casino gaming in missouri...casino industry itself induce another 300,000 indirect jobs. while all...
TRANSCRIPT

1
CASINO GAMING IN MISSOURI: THE SPENDING DISPLACEMENT
EFFECT AND GAMING’S NET ECONOMIC IMPACT
*****DRAFT**********DRAFT**********DRAFT**********DRAFT*****
DON PHARESUniversity of Missouri - St. Louis
THE 2001 MISSOURI ECONOMICS CONFERENCECOLUMBIA, MOMAY 4-5, 2001
Department of Economics 408 SSBUniversity of Missouri - St. Louis
St. Louis, MO. 63121314-516-5551 (with voice mail)e-mail: [email protected]

2
THE CONTEXT OF GAMING
Regulation of casino gaming recently has emerged as a controversial policy
issue for state governments. The corresponding need for careful analysis of its
economic impact at a sub-national level has arisen as a challenge for policy analysis.
For many decades prior to the 1930's, the only legal gaming in the U.S. was at horse
and dog racing tracks in selected states. In 1931 casino gaming became available in
Nevada. However, the very hot desert climate, geographic remoteness, and sparse
population with an absence of any significant urban centers meant that its development
was not then economically feasible. In 1940, with the practicality of air conditioning and
the availability of significant investment funds, the first major casino development took
place in Las Vegas.
Concerning the availability of necessary investment funds, note that there is no
practical way of keeping track of total wagering at casinos since part of the betting
occurs out of reinvestment of winnings, including previous winnings, mixed in with the
betting of new funds. This meant that owning a casino was an attractive way to
“launder” illegal gains from other activities, so it is no surprise that capital for the initial
development of Las Vegas casinos largely came from illicit activities.
Currently, there is much more careful policing of casino operations and finances.
Casino owners now are largely international casino or hotel corporations with no
evidence of criminal influence (Salter, 1997). But citizen fears of organized crime
interests gaining control of legitimate casino interests continued to influence public
policy for many years. In fact, Nevada continued as the only state to permit legal casino
gambling until 1978 when casinos began operations in New Jersey but only in Atlantic
City. Ironically, casinos which were “sold” here as a way of solving the “Atlantic City
problem” did provide significant revenues to the state out of the 9.5% tax on net casino
win, but gave little direct benefit to the city.
The fiscal benefits for the state, however, grew very rapidly and other states

3
soon emulated this experience. Small land-based casinos began operations in South
Dakota in 1989 and Colorado in 1991. The first river-based casinos opened in Iowa and
Illinois in 1991, Mississippi in 1992. Louisiana in 1993, Missouri in 1994, and Indiana in
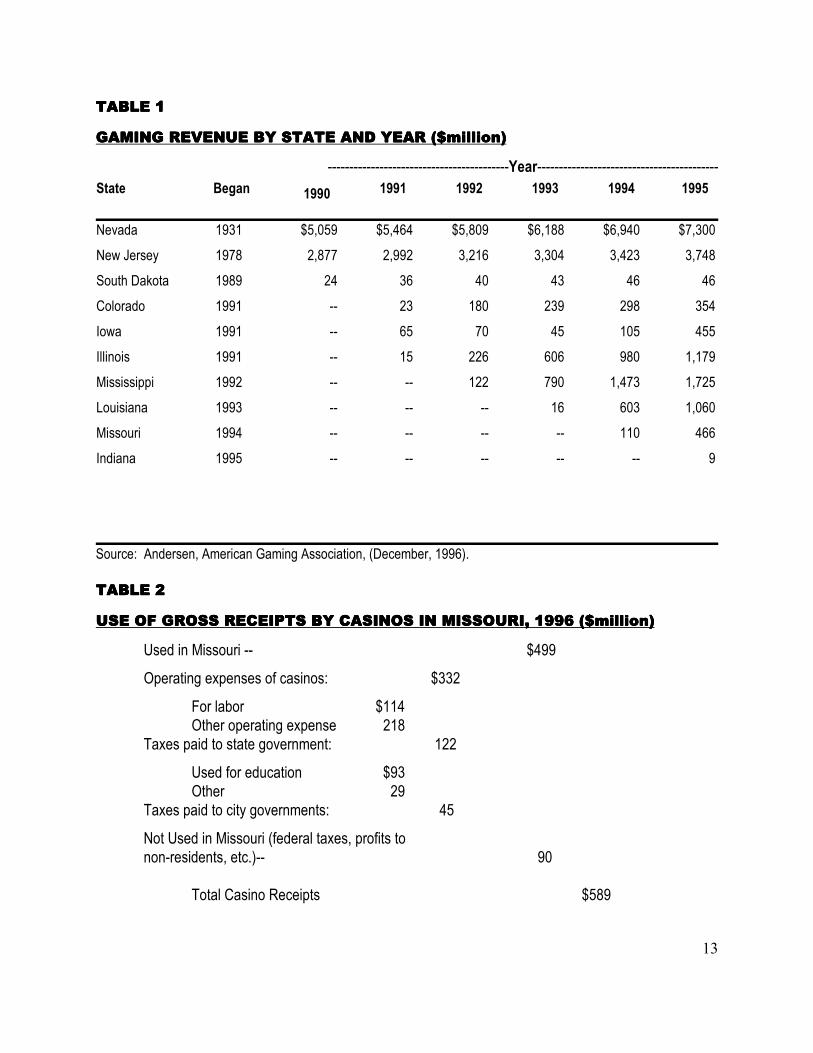
1995. Table 1 shows the rapid recent growth of gaming tax revenues in the states
which have authorized casinos other than on non-Native American reservations since
1989. Note, however, in the twenty years since casinos came to New Jersey with
almost immediate success, the spread of casinos has been pretty much restricted to
the small number of other states mentioned above. And, except for Colorado and very
small operations in South Dakota, all authorizations for casinos have been on the
Mississippi or Missouri rivers and /or the Gulf Coast.
Casinos on Native American reservations do operate in twenty-two states,
though their total business is only about a third of the volume of the ten states with non-
reservation casinos. The casinos on reservations have been made possible by the
limited sovereignty status of Reservation Territory. The relatively low volume on
reservation casinos is due to these territories having limited access from population
centers, though the largest single casino in the United States probably is Foxwoods in
Connecticut, easily accessible to New York and Boston.
Even for casinos not on tribal lands, however, the situation is unusual, both from
a legal and public opinion standpoint, with casinos subject to extensive and complex
regulation. The motives for this are numerous; to make certain that criminal elements
are excluded; to limit compulsive gamblers from self-destructive play; to accommodate
conservative religious concerns over gaming; to avoid destructive competition between
casinos due to excess entry or crowding of particular local markets; to assure the state
gaming commission that substantial economic development will result from any
proposed development. In Missouri, the focus of this study, where casino gaming has
been legal since 1995, there are many regulations affecting operations.
First, the Missouri Gaming Commission has considerable authority over who can
operate casinos, where they are located, and how many there will be. Second, their
locations are limited to navigable rivers. Initially, they had to be on operational river
boats which actually cruised for two hour periods with gaming allowed only then. Now
4
they can be built on a barge that is afloat in the river, not necessarily with any capacity
for cruising, but patrons still are admitted only for scheduled two-hour “cruises.” Third,
patrons are allowed to purchase no more than $500 in chips in any two-hour session.
Effectively this rules out games for “high rollers” thus affecting the kind of patronage
attracted. Some say this is for the good of the community: others say it limits net
casino win and hence, the economic development benefits. Finally, it should be noted
that casinos participate in virtually no publicly funded programs for stimulating regional
development such as grants, low interest loans, public provision of infrastructure, tax
abatement, TIF’s, etc.
Besides regulatory safeguards, there also is great concern with just how much
added economic activity a proposed casino would generate both within the local
community and the state. In fact, given the views of some observers, without substantial
expected economic development, it would be hard to find political justification for
approval of casino applications. Unfortunately, regulatory commissions seldom have
the staff or access to necessary data to undertake an objective assessment of
development prospects, nor are they capable even of auditing actual experience after
the fact. There is nothing peculiar about casinos in this regard (see Office of the Auditor
General, 1989 for the difficulties of determining just how many net new jobs were
generated by subsidies to new industries). What is peculiar to casinos, however, is the
controversy surrounding the issue of whether any new spending or jobs are created,
much less how many.
At one extreme are conservative claims that funds spent on wagering would
otherwise necessarily have been spent on something else so that zero net development
results. An exception would be the effects on the region of wagering by visitors from
outside the area. In fact, Eadington (no date) argues that this is the only channel by
which regional development can be generated. This leads him to conclude that unless
an area has the prospect for attracting a major flow of national or international visitors
the only justification for licensing is that a state wants to make recreational gaming
available to its citizens. And further, he speculates that Las Vegas and New Jersey are
already so highly developed that other US locations are unlikely to draw significant
5
national market patrons so that economic development is not a legitimate claim for a
proposed casino anywhere except in these two regions.
A number of important factors are omitted from his view. First, even if local
patrons would spend all of their wagering outlays on other goods this does not mean
there is no net effect on the state economy since the import component of the alternate
expenditure distribution could be very different than the import component of casino
gaming. Second, some of the spending on domestic gaming may be at the expense of
reduced imported goods. Third, some gaming outlay may come from savings.
The opposite extreme from Eadington’s is that all gaming expenditure
necessarily is net new spending for the state, even if it is from state residents.
According to the reports by Andersen (1996 and 1997), the 300,000 direct jobs in the
casino industry itself induce another 300,000 indirect jobs. While all 600,000 of these
jobs presumably would be continuing, they also add in as “indirect,” 85,000 construction
jobs even though they would be spread only over a few initial years and then disappear.
In any event, leaving this careless specification of construction effects aside, this would
imply a Keynesian foreign trade multiplier of between 2.0 and 2.3; not implausible as a
short-run foreign trade multiplier for the casino industry in the US (see Leven, 1968).
At the same time, the Andersen report makes no allowance for off-setting effects
of wagering being in-part supported by reduced spending on other goods. In a short-run
context with significant unemployment, the Andersen report might be justified. In a long-
run growth context this makes no sense. They defend their position in two different
ways. First, they maintain that the economy is undergoing historical growth more or less
continuously, if unevenly. But even if that is so, such growth already is allowed for by
way of the included long-run multiplier effect. Alternatively, they argue that the
expansion of the casino industry generates additional demand for itself, a sort of Say’s
Law argument. But that could be so only if casinos have the effect of increasing labor
force participation and/or labor productivity in general on account of salutary external
effects of gaming on labor, hardly likely.
The actual effect on a sub-national economy necessarily would lie somewhere
above the value of 0.0 implied by those who maintain that all spending in casinos would

6
be a substitute for other existing regional demand and below the 2.3 Keynesian short-
run multiplier estimated for the US as a whole in Andersen. Essentially, estimating the
developmental impact of casinos on a state, or other regional economy, involves sorting
through a complex chain of effects so as to determine just where within this large
interval the actual effect lies.
METHODOLOGYMost readers of this paper will be generally familiar with “impact analysis” (Isard,
1963). The procedure ordinarily is straightforward. First, calculate the contribution of
the project’s output by sector, entering this into the final demand vector in an inter-
industry model for a region. Next multiply this final demand vector by (I - T)-1, where T
is the matrix coefficients tij, the amount of output of sector I purchased in the region per
unit of output of sector j. Sum by sector to get the resultant total output effect for the
region. The same calculation can be made in terms of labor input or income (Perloff
and Leven, 1964). These are the appropriate calculations for any development which
entirely a “basic” or export activity, like a new military base, a steel mill, or a home office
for an international company. And these are the kinds of activities for which impact
analyses ordinarily are done. They would be inappropriate for something like a new
McDonald’s outlet. In fact, generally the multiplier for a new local-market-serving fast-
food outlet would be 0.0, since the total fast-food capacity would be endogenously
determined by total basic (i.e., exogenous) output.
In the real world, of course, sectors rarely are entirely “basic” or entirely “non-
basic,” but in most development analysis applications they are usually approximately
so. The case of a casino is very different. In many situations it involves significant
domestic as well as export demand and the ratio of these two markets is important. The
distribution of substitutability between domestic casino demand and alternate domestic
and imported demand can be substantial, affecting differences in net multiplier effects.
Also, casinos often involve especially large tax transfers to state and local
governments, which have their own net multipliers. Finally, separate coefficients
specifically for casinos are not available from secondary data.
An outline of the scheme used for estimating impacts in the state of Missouri is

7
shown in Figure 1. We start not with “net casino win,” but with the individual inputs to
production of gaming services. This is so we are not constrained to compute the
multiplied impact of “net casino win” as if it were simply “entertainment,” the closest
sector approximating it. We can assign inputs of within state factors of production (in-
commuting labor, profits to non-residents, and federal taxes are netted out) directly to a
household multiplier calculation. To this we add the direct and indirect outputs by sector
from other non-tax inputs to casinos. All of this has the effect of simulating without
distortion what the effects would be if separate inter-industry data for casinos
specifically were available.
Next we input gaming and other taxes paid to state and local government into
the final demand vector and compute the direct and indirect effects of these taxes. In
Missouri most of the tax is the 20% levy on “net casino win.” The 18% going to the state
for primary and secondary schools is shown as final demand for public education. The
2% tax on net win going to the “home dock” cities where the casinos are located, and
the $2 admission tax per patron (half to the home dock city and half to the state) are
assigned to final demand for state and local government.
Added to the above impacts are direct and indirect effects of construction and
purchase of equipment. These are computed in a straight forward inter-industry
multiplier calculation, except that we can make them additive to operating expense
impacts by “annualizing” them. This amounts to calculating the annual flow which at the
prevailing market rate of interest (about 7% in the U.S. at present) and expected life of
casino capital (twenty years) would have a present value equal to actual construction
plus equipment purchase outlay. This annual flow equivalent vector can then be added
to the vector of direct and indirect impacts of operating expenses and taxes.
The remaining problem is to estimate the direct and indirect effects of household
expenditures in Missouri which are reduced as a consequence of spending on gaming.
There are very few examples of studies that have estimated displacement of other
expenditures by gaming outlay explicitly, and then only for much simpler situations such
as at the Red Sea in Israel (Felsenstein and Freeman, 1997). Also note that spending
by non-Missourians involves no offset. But even all of the spending by Missourians

8
does not come from reducing other within state purchases. In our study, a small part
comes from personal saving. A much larger part comes from reduction of imports. In
Missouri, for example, about 30% of the money spent on in-state casinos comes from
reduced spending at casinos and horse and dog tracks outside the state (see Table 3).
This reveals one of the troublesome dimensions of framing appropriate policy; once
neighboring states have established legal casinos, a given state may be virtually forced
to establish a casino to avoid import drain, even though the development effect for all
states combined could be no greater than what could be achieved by a joint agreement
to have no casinos. Just how an individual state should establish policy on casinos can
easily revert to a strategic situation whereby evaluating impacts for each state under a
variety of group behaviors becomes necessary. Even though our case study for
Missouri represents the most comprehensive impact assessment to date for a single
state, it has yet to be expanded into a simultaneous multi-state framework.
THE DATAThe necessary available and relevant data would vary considerably from state to
state, so we summarize only briefly the data assembly problem we faced for completing
our Missouri study. First, an inter-industry table for the region must be obtained. We
used the model developed by IMPLAN (1996) with data specific for the state of
Missouri. For the input vector, including factor payments and the cost of constructing
facilities, data were obtained from the individual casino venues. Where actual data
were not available, they were estimated from data in developers’ proposals and/or
available data for casinos in similar regions. Tax data came from both the gaming
venues and the state gaming commission. Data for the actual amount of gaming were
available from regulatory agencies, either based on operating reports or prospectuses
for proposed casinos. We determined the ratio of in-state to visitor patrons from a
parking lot license plate survey done by the casinos. Missouri casinos serve almost
entirely patrons from Missouri or contiguous states.
Estimates of where patrons would otherwise have spent the money spent on
gaming were calculated from U.S. Department of Commerce data on income, saving,
and spending by category for the St. Louis and Kansas City metropolitan areas in

9
Missouri (together they account for more than half the state’s population), a telephone
survey we conducted for 823 casino patrons throughout the state, and estimates of
income elasticities of demand by product sector (Popkin, 1996).
CASE STUDY RESULTSFor the ten casinos operational in Missouri in 1996, gross receipts were $589
million. Most of the amount, $503 million was the “new casino win;” the remaining $86
million was from sales of food, drinks, miscellaneous gift shop merchandise and
admissions to special shows. Table 2 shows the allocation of the $589 million in
receipts between moneys flowing directly out of the state and those dispersed in
Missouri for major components of casino outlay. The funds flowing out of the state have
no direct impact on the Missouri economy.
The money spent in Missouri also partly “leaks out” of the state via inputs
purchased directly and indirectly from elsewhere. Casino records are not kept in a way
which permits tracking imported inputs. In fact, much of the point of using regional
input-output matrices is to allow for these direct and indirect imports by linking data on,
or estimates of, total imports by sector to outputs of particular sectors via import-
adjusted technological coefficients; Leven’s “from-to” coefficients (1968).
The sources of funds spent by Missourians on gaming is shown in Table 3. The
main point here is to derive, as a residual, the $265 million which it is estimated came
from diversion of spending on other goods in the state. The impact here would be to
reduce the multiplier effect of total spending at casinos.
The direct and indirect impacts of the receipts dispersed domestically are shown
in Table 4, broken down by type of disbursement as indicated on the left side of the
Table. The relatively small amounts representing profits and deprecation reserves for
convenience were simply added into payments to labor, though labor payments to in-
commuters from other states are assigned to funds not used in Missouri. The indirect
impacts are shown in the second column of Table 4, total impacts in the third column
and the ratio of indirect to direct effects in the fourth column. Note the relatively low
variance in the ratios of indirect to direct effects by type of spending (at least in
Missouri). This suggests that if all that policy analysis requires is to know, “how much is

10
the increase in output?”, the inter-industry calculations have to be included.
But using a simple nonbasic to basic ratio, the analysis is still not simple. The
sorting of gross receipts into types of flow as in Table 2 still would be necessary, and
even more troublesome, estimates of the source of funds for state resident spending as
shown in Table 3 would have to be accomplished.
All of the impact analysis can be carried out in terms of “job” or “income” units in
addition to “output” units. The $544 million in net generated output shown in Table 4
would be equivalent in Missouri to added personal income of $324 million or 12,124
added jobs. Detail for output, personal income, and jobs for each of fifty-five sectors
are provided in Leven, Phares, and Louishomme (1997).
SOME CONCLUSIONSThe regional economic impact of casinos is complex, but as the discussion in
this paper indicates, the estimation of these impacts in a credible, non-biased way can
be achieved. Important issues of casino licensing and regulation require such analysis
and it has been our aim that this paper at least provide an outline of effective methods
for achieving such analysis.
But as useful as economic impact analysis is in analyzing policy alternatives we
should note that knowing the economic impact effects are only part of the information
needed for effective analysis of casino policy. For one thing, nothing in our analysis
would tell us much about establishing regulations for casino operations. Should there
be “cruise” requirements, “loss limits” and/or maximum bets, or restricted access?
Even more vexing are questions of market saturation and regional interdependence of
casino markets. These questions call for the development of industrial organization
studies of the industry of a kind not yet attempted.
Another issue is that our analysis has been concerned with long-run effects only
to the extent that the indirect impact calculations have assumed a long run infinitely
elastic supply of labor and business capacity in sectors providing inputs to casinos,
directly or indirectly. For a small region in an open economy this is not a serious
limitation. On the other hand, the presence of facilities for gaming might impact the
attractiveness of the environment for people and/or businesses in general, perhaps
11
positively or negatively. Do families find the presence of casinos desirable or
undesirable? How about potential location of businesses not directly related to
casinos? Are there thresholds where more casinos have significant influence? These
questions are amenable to economic analysis, but so far as we know serious study has
not yet been done.
Finally, socio-psychological impacts of gaming on family life are much discussed
issues but available findings don’t go very far (Goodman, 1994). Economists are
trained in general to avoid such issues as whether consumption of this or that good or
service is or is not “worthwhile” for consumers. We usually concentrate simply on
whether markets efficiently produce whatever it is that consumers want. An important
exception, however, is where there are external effects on others of consumption or
production choices by particular people or firms, especially negative effects like
environmental pollution. And it has been argued that gambling is not just bad for the
people who do it, but that it imposes social costs on society as a whole via its rendering
otherwise ordinary families socially dis-functional. Serious clinical case studies of
gamblers certainly do exist (Lesieur, 1992) documenting serious adverse affects on
particular individuals. These studies raise as many questions as they answer.
First, is the question of how many problem gamblers are there? Another problem
is that gambling addiction, while real might just be a re-channeling of other addictive
behavior. These questions deserve serious sociological research, but such studies as
we have been able to locate, do document destructive consequences for particular
individuals, but do not indicate just how man “problem gamblers” there might be.
We have not done the needed research on this, but in our survey of Missouri
gamers we discovered a socio-economic composition of casino patrons and gaming
habits that suggest most of them are not addictive gamers. They are a little over half
female with a median age of thirty-seven. Half of them have median family incomes of
above $50,000 per year, almost all are high school graduates and about a quarter have
had some college education. In a survey in Leven, Phares, and Louishomme (1997)
most patrons budget $50 or less for a casino visit. All but one of the casinos in the
state is inaccessible without a private car, so very few very low income people are

12
patrons. A survey of gamers in neighboring Illinois reveals roughly similar patronage
(Gazei and Thompson, 1995). We must warn, however, that very different situations
might prevail in other states.
While we can conclude that there are many questions concerning casino gaming
that await further research, the methodology for determining its net contribution to
output, income, and employment in regional economies seems well established in our
case study for Missouri. As shown at the bottom of Table 4, the effective multiplier for
casino gaming in Missouri is 0.92, after netting out the displacement of other spending,
though for spending at casinos the multiplier is 2.1, similar for the state economy as a
whole. Also, a multiplier even of 0.92 is a long way from 0.0 as would be argued a
priori by anti-casino interests. That it is about half way between zero and the foreign
trade multiplier for an average pure export activity is coincidental for Missouri.
Depending on a region’s inter-industry structure, its gaming taxes, its tourist
attractiveness, and just where local residents got the money they wagered, the results
could be anywhere from 0.0 to over 2.0. But the research underlying this paper has
provided a way of determining just where it would be for any particular state, providing
the information flow needed to implemented it can be assembled.
13
TABLE 1TABLE 1TABLE 1TABLE 1
GAMING REVENUE BY STATE AND YEAR ($million)GAMING REVENUE BY STATE AND YEAR ($million)GAMING REVENUE BY STATE AND YEAR ($million)GAMING REVENUE BY STATE AND YEAR ($million)
------------------------------------------Year------------------------------------------State Began 1990 1991 1992 1993 1994 1995
Nevada
New Jersey
South Dakota
Colorado
Iowa
Illinois
Mississippi
Louisiana
Missouri
Indiana
1931
1978
1989
1991
1991
1991
1992
1993
1994
1995
$5,059
2,877
24
--
--
--
--
--
--
--
$5,464
2,992
36
23
65
15
--
--
--
--
$5,809
3,216
40
180
70
226
122
--
--
--
$6,188
3,304
43
239
45
606
790
16
--
--
$6,940
3,423
46
298
105
980
1,473
603
110
--
$7,300
3,748
46
354
455
1,179
1,725
1,060
466
9
Source: Andersen, American Gaming Association, (December, 1996).
TABLE 2TABLE 2TABLE 2TABLE 2
USE OF GROSS RECEIPTS BY CASINOS IN MISSOURI, 1996 ($million)USE OF GROSS RECEIPTS BY CASINOS IN MISSOURI, 1996 ($million)USE OF GROSS RECEIPTS BY CASINOS IN MISSOURI, 1996 ($million)USE OF GROSS RECEIPTS BY CASINOS IN MISSOURI, 1996 ($million)
Used in Missouri -- $499
Operating expenses of casinos: $332
For labor $114Other operating expense 218
Taxes paid to state government: 122
Used for education $93Other 29
Taxes paid to city governments: 45
Not Used in Missouri (federal taxes, profits tonon-residents, etc.)-- 90
Total Casino Receipts $589

14
TABLE 3
WHERE MISSOURIANS GOT THE MONEY FOR THEIR SPENDING AT CASINOS,1995-96 ($million)
Casino spending by non-resident tourists $177
Casino spending by Missouri residents $412
From reduced savings -49
From reduced spending OUTSIDE Missouri:
at casinos outside Missouri - 51
at horse & dog tracks outside Missouri - 9
on vacations outside Missouri -16
on other out-of-state purchase -22
From reduced spending IN Missouri -265
TABLE 4
DIRECT & INDIRECT EFFECTS OF MAJOR COMPONENTS OF CASINOSPENDING IN MISSOURI, 1995-96 ($million)
EFFECT
Casino Operations
Taxes to State Government
Taxes to City Governments
Annualized Construction Cost
LESS: Reduce Other Spending
Direct
$332
122
45
32
-265
Indirect
$277
131
48
27
-205
Total
$609
253
93
59
-470
Multiplier
1.83
2.07
2.07
1.84
1.77
TOTAL NET EFFECT $544 million
TOTAL CASINO SPENDING $589 million
NET MULTIPLIER FOR CASINOS 0.92

15
REFERENCES
Andersen, Arthur, Economic Impacts of Casino Gaming in the United States, (Washington, DC: American GamingAssociation, Vol. 1, December 1996; Volume 2, May 1997).
Eadington, William R., The Gambling Studies, (Reno, NV: Institute for the Study of Gaming and Commercial Gaming,University of Nevada, 1991).
Eadington, William R., “Economic Development and the Introduction of Casinos: Myths and Realities,” unpublished,no date.
Felsenstein, Daniel and Freeman, Daniel, “Simulating the Impacts of Gambling in a Tourist Location: Some Evidencefrom Israel,” unpublished, 1997.
Gazei, Ricardo C. and Thompson, William N., “Casino Gamblers in Illinois: Who Are they?”, 1995, unpublished.
Goodman, Robert, Legalized Gambling as a Strategy for Economic Development, (Northampton, MA: RobertGoodman, 1994).
Isard, Walter, Methods of Regional Analysis, (New York, NY: John Wiley & Sons, 1963).
IMPLAN, IMPLAN Professional (Stillwater, MN: Minnesota IMPLAN Group, 1996).
Lesieur, Henry R., “Compulsive Gambling,” Society, May-June, 1992.
Leven, Charles, “Regional Income and Product Accounts,” in L. Needleman, (ed.), Regional Economics, (London:Penguin Books, 1968).
Leven, Charles, Don Phares, and Claude Louishomme, The Economic Impact of Gaming in Missouri, (St. Louis,MO:, 1997).
Office of the Auditor General, Management and Program Audit of the Department of Commerce & CommunityAffairs’ Economic Development Programs, (Springfield, IL: State of Illinois, Office of the Auditor General, July, 1989).
Perloff, Harvey and Charles Leven, “Toward an Integrated System of Regional Accounts,” in W. Hirsch (ed.), Studiesin Regional Accounts, (Baltimore, MD: John Hopkins Press, 1964).
Popkin, Joel, “Estimates of Income Elasticity of Final Demand by Households in Missouri,” a report to Leven andPhares Associates, 1996.
Salter, Jim, “Police Say Gambling Has Brought No Increase in Crime,” Associated Press Release J2567, March 9,1997.
Tiebout, Charles M., The Community Economic Base Study, (New York, NY: Committee for Economic Development,1966).RIVERBOAT GAMING IN MISSOURI:

16
AN OVERVIEW AND ITS IMPACT ON LOCAL HOME DOCKCOMMUNITIES
*****DRAFT*****
THE 2001 MISSOURI ECONOMICS CONFERFENCECOLUMBIA, MO
MAY 4-5, 2001
Don PharesUniversity of Missouri – St. Louis
Department of Economics 408 SSBSt. Louis, MO 63121
314.516.5551e-mail: [email protected]

17
INTRODUCTION
Riverboat casino gaming has been the subject of major public policy debate in Missourisince November 1992 when the state electorate was presented with the first ballot referendum onthis topic. This measure asked voters whether riverboat casino gaming should be allowed. Theelectorate responded with a resounding “yes” and approved the measure by approximately 63percent. This action did not end political debate on riverboat casinos in Missouri, however. Inmany ways it marked a dramatic escalation of the debate and a shift in the locus of where keydecisions were made in regards to this public policy issue. Rather than being confined to the hallsof the state capital, riverboat casinos now became a hotly debated issue among the state'scitizenry and in the chamber of the state’s Supreme Court. Key decisions were now made notonly by the legislature but also by the Missouri Supreme Court and Missouri voters. Yet, despitethe political turmoil that has characterized this policy issue, Missouri’s riverboat casino industryhas grown in terms of the number of venues, patrons, and casino and governmental revenuessince making its debut. This growth has led to the industry becoming a significant source of taxrevenue for both the state government and the local communities (called home dock) that hostgaming venues. Table I shows the fiscal impact on each home dock community.
The Public Debate and Legal Challenges
Missourians have had a lively and sustained public debate about riverboat casinos.Initially, the debate focused on whether this industry should be legalized. Proponents argued thatlegalization of riverboat casinos would create jobs, generate new tax revenues, and attract newinvestment to the state (Table II provides information on the economic impact of casino gamingon the state of Missouri). Opponents argued that legalization of gaming would increase crime,result in political corruption and gaming addiction, and be socially destructive. Despite thesearguments, approximately 63 percent of Missourians who voted in the 1992 election said yes tolegalization of casino gaming in the state. However, this represents the high mark in votersupport for gaming measures in Missouri. In subsequent elections in which state voters had tocast ballots on riverboat casino measures this early mark has not been matched. In fact, thesecond time Missouri voters were asked to vote on a gaming measure, the referendum wasdefeated by a very small margin. This occurred in the April 5, 1994 election in which theelectorate was asked to legalize slot machines and other “games of chance.” A January 1994ruling by the state supreme court -- wherein the court held that slot machines, craps, roulette andother “games of chance” were unconstitutional (Harris v. Missouri Gaming Commission, 1993) -- necessitated this ballot measure. In response to this ruling a constitutional referendum waspresented as Amendment 3 to state voters. It was defeated by 1,261votes, 528,072 to 526,811 (St.Louis Post-Dispatch April 6, 1994).
With this vote, gaming opponents had won a major victory and Missouri’s nascent casinoindustry was thrown into a high level of uncertainty because slot machines provide the majorsource of casino revenues and profits and, therefore, also government tax and fee revenues. Thenarrow margin of defeat galvanized gaming proponents who succeeded in collecting more than

18
130,000 signatures within a two-month period and a new measure was presented to theelectorate. Amendment 6, as this came to be known, asked voters the following question:
Shall the General Assembly be authorized to permit only upon the Missouri River and theMississippi River lotteries, gift enterprises, and games of chance to be conducted onexcursion boats and floating facilities? This proposal would increase state revenues fromexisting gaming boats approximately $30,000,000 per year. Impact on local governmentsis unknown. (1)
In this campaign the proponents emphasized that casinos would provide additionalfunding for public education. In fact, by a constitutional amendment approved in November of1992 all state revenues derived from gaming activities are dedicated to public education. Severalof the TV ads featured teachers and other state residents talking about the potential benefits ofslot machines to the state's existing casinos and new gaming developments that would come online. Opponents argued that approval of Amendment 6 would mark an expansion of the gamingindustry in Missouri and expressed fear that out-of-state gaming interests were overwhelming thestate’s political process. In November 1994 Amendment 6 was approved by a 54 percent margin.Shortly thereafter, on December 9, 1994 the first slot machines were introduced to Missourigaming venues. (Missouri Gaming Commission 1996 Annual Report).
The most recent challenge to riverboat casinos in Missouri centered on the state gamingcommission’s practice of allowing casino developers to build facilities in man-made basinsinstead of in the channel of the Missouri and Mississippi Rivers. Gaming opponents challengedthis practice, arguing that it violated the provision of the Missouri Constitution authorizingriverboat casinos on the two rivers. The Missouri Supreme Court agreed with this argument.Writing for a unanimous court, Chief Justice Duane Benton wrote “In sum, the 1994constitutional amendment authorizes games of chance to be conducted on excursion gamblingboats and floating facilities solely over and in contact with the surface of the Mississippi andMissouri Rivers…. The mere presence of river water in artificial spaces within 1,000 feet of thechannel does not make gambling ‘only upon the Mississippi River and Missouri River’”(emphasis added) (Akin v. Missouri Gaming Commission, 1996). Accordingly, the court declaredthat the six riverboat casinos that had been built in moats were unconstitutional.
Again the industry mounted a major campaign and presented state voters with areferendum to resolve the issue. Opponents of the measure argued that the industry had failed todeliver on its promises of old-time paddle wheel boats that cruised on the rivers. Proponents ofthe measure argued that these facilities had created jobs for thousands of Missourians and defeatof Proposition 9 would eliminate those jobs (again, see Table I). On November 3, 1998Proposition 9 was approved by a vote of 821,324 to 642,337 (St. Louis Post-Dispatch, November4, 1998).
The casino gaming debate has stirred strong passions among both gaming opponents andproponents in Missouri since the industry was first legalized in 1992. Gaming opponents have

19
not only made arguments about the social and human costs of gaming; they have also used thestate’s court system to challenge the industry. Proponents have used superior financial resourcesto mobilize the winning coalitions needed in most of the key elections dealing with this issue.Given this history, it is very likely that the Missouri gaming industry will probably face newpolitical challenges in the future. However, the industry has demonstrated an ability to overcomesuch challenges since its inception and no doubt will continue to be an active player in theongoing debate about this public policy issue. Moreover, Missourians have not only supportedthe industry with their votes on ballot initiatives but have also continued to vote with their feetand dollars by patronizing riverboat casinos across the state.
The Development of the Missouri Gaming Industry
It is in this turbulent political environment that the Missouri gaming industry hasdeveloped. In its first year of operation [fiscal year (FY) 1995] the industry was comprised of sixvenues, two located in the St. Louis area (7 and 5 on Map 1), two in the Kansas City area (3 and4 on Map 1), one in the northwest region of the state (6 on Map 1), and one in the southeastregion (1 on Map 1). Initially, four Missouri riverboat casinos made their debut in August 1994and included boats in the city of St. Louis, the city of St. Charles, the city of Riverside, and St.Joseph. The following month Harrah’s Casino opened in North Kansas City. Aztar Casino beganoperations on April 27, 1995 in Caruthersville, a small city in the southeast region of the state.
By fiscal year 1998, the Missouri riverboat casino industry had expanded to include atotal of ten operating venues, see Map 1 for their location. FY’98 also saw the closure of the firstcasino in the state. The Boyd Company’s Sam’s Town Casino (2 on Map 1) closed on July 15,1998. As will be seen below, despite the closure of Sam’s Town, total admissions, adjustedgross receipts (AGR), and tax revenues to the state and home dock communities have increasedeach year that the industry has operated in Missouri. Full detail on the revenues to each homedock communities by venue, source, and year (fiscal years 1995-98) is provided in Tables III-VI.The impact on these communities' fiscal status is shown in Table I.
SOURCES AND USES OF LOCAL GAMING REVENUES
An Overview of Missouri Casino Revenues (2)
Since the opening of the first casinos in Missouri in the fall of 1994 the number ofcommunities with these developments has increased significantly, as has the amount of revenuesthey have collected from the industry. In their first year of operation, the six operating casinoscontributed $18.4 million in admission fees and the local portion of the State Gaming Tax to thecities that served as their home dock cities.(3) The following year, FY’96, Kansas City becamethe seventh Missouri community with an operating casino when the Boyd Company’s Sam’sTown Casino opened for business on September 13, 1995. While the number of casinosexpanded by one between FY’95 and FY’96 local gaming revenues increased by 84% to $33.7

20
million. This dramatic growth reflects the first full year of operations with legalized slotmachines.
As the Missouri gaming industry expanded and matured the rate of growth in localgaming revenues declined but remained strong and positive in absolute terms. In FY’97 threenew casinos came on-line. These included the Hilton Flamingo and Station Casinos in KansasCity and the Players’ and Harrah’s Casinos in Maryland Heights, a suburb of the city of St.Louis. This further expansion of the Missouri casino industry was accompanied by growth ingaming revenues to local governments of an additional 35% between FY’96 and FY’97.
No new casinos opened in FY'98. In fact, one casino, Sam’s Town, closed on July 15,1998. Yet, local gaming revenues increased for the fourth straight year, going from $45.5 millionin FY’97 to $55.6 million in FY’98, a 22% increase.
The overall growth in the number of Missouri communities with casino developmentsand total revenues generated by these developments for local coffers provides the general contextfor the discussion below. In the following sections we examine the individual gaming venues, thegaming revenues each has received, and the uses to which those funds have been put in thesehome dock communities. Again, review Tables I and III-VI for complete detail.
The Impact on Local Home Dock Communities
CARUTHERSVILLEThe City of Caruthersville is located in the southeastern section of the state of Missouri,
an area generally known as the Boot-Hill. Casino gaming has had a dramatic impact both onunemployment in the city and on the financial health of the city’s government. On theemployment front, prior to the legalization of casinos, the city had lost two of its largestemployers, the Brown Shoe Factory and the Caruthersville Shipyard. Combined, these twocompanies employed over 800 residents of the area. As a result of these plant closures, theunemployment rate in Pemiscot County reached a high of 15.6% in 1994. In March 1998unemployment was down to 8.1%. The more than 400 jobs created by the Aztar casino hascontributed to the dramatic reduction in unemployment in the county (Missouri GamingCommission 1998).
In terms of casino revenues, Caruthersville received $695,910 in admissions fees and$444,668 from the local portion of the gaming tax in FY’98 for a total of $1,140,578. In each ofthe previous two fiscal years the city received approximately $1.2 million from these sources.Caruthersville received less than $200,000 in admissions fees and gaming tax receipts in FY’95because Casino Aztar was only opened for the last two months of the year.
It is important to note that in addition to the admission fees and State Gaming Taxes, thecity also received $3 million as part of the initial development agreement with Casino Aztar. Thecity also received an additional $3 million from the developer over the first three years of

21
operation. The impact of gaming revenues on the fiscal health of the city can be seen in the factthat in FY’97 gaming revenues constituted fifty-two percent (52%) of total local revenues, seeTable I for the impact on each gaming community.
Use of Gaming RevenuesThe City of Caruthersville used a substantial portion of the original $3 million it received
as part of the development agreement to make capital improvements in the downtown area. Thishas included the rebuilding of two major streets leading to the casino development, includingimproved drainage, lighting and landscaping (City of Caruthersville 1996; Missouri GamingCommission 1998).
More generally, Caruthersville has used gaming revenues to improve city streets, parks,water and sewer systems, to purchase new recreation equipment, construct a new sports complex,and acquire a fire truck, new police cars and sanitation equipment. The city has also used aportion of these funds to establish a building improvement loan fund for local property ownersand to initiate an active economic development program.
KANSAS CITYThe city of Kansas City received $11.4 million in admissions fees and $4.3 million in the
local portion of the State Gaming Tax in FY’98. The $15.8 million collected by Kansas City inFY’98 represents a 46.7 percent increase over FY’97 receipts. In FY’96, the first year in which acasino operated in the city, Kansas City received $3.9 million in gaming tax revenues.
Use of Gaming RevenuesKansas City has adopted a policy committing gaming revenues to a capital fund. As such,
local officials have used these funds to make public infrastructure improvements throughout thecity. Coupling gaming revenues with general revenues and other funds Kansas City officials haveinitiated an expansion and renovation of the street lighting system, purchased fire fightingequipment, and made improvements to roads and streets. Gaming funds have also been used forsite acquisition for a civic mall, sidewalk and curb construction, bridge repair and replacement,catch basin repair and replacement, a sprinkler system in city hall, and zoo improvements (Land1996; Queen 1998).
For example, one major initiative that Kansas City, in cooperation with the city’s electriccompany, Kansas City Light and Power, has undertaken is a citywide street lighting project. Thecity is putting in place a new lighting system. This project is funded by a $110 million bondissue. These bonds are serviced by a combination of general revenue funds and gaming revenues.
In addition to the use of gaming funds for capital improvements, Kansas City alsonegotiated a deal with Hilton Flamingo Casino, which has resulted in the redevelopment of a 32acre site, located on the city’s riverfront, into a public park. This land had most recently served asthe city’s towing lot. The agreement with Hilton Flamingo secured a commitment from the
22
company wherein rent payments from the casino are being used to service a $20 million bondissue. Construction of the new park was begun in August 1996. The new park was dedicated inthe fall of 1998 (Queen 1998; Kansas City Star September 17, 1996).
CITY OF ST. LOUISThe city of St. Louis has one casino, the President Casino on the Admiral. The President
is located on the city’s downtown riverfront, at the foot of the Gateway Arch. In FY’95 St. Louisreceived $3.6 million in admissions fees and the local share of the State Gaming Tax. Althoughthis figure increased to $4.9 million in FY’96, it shrank to $4.6 million in FY’97 and to $4.1million in FY’98. In addition to these gaming revenues, St. Louis also receives lease paymentsfor the President Casino equaling two percent of adjusted gross receipts.
Use of Gaming RevenuesThe city of St. Louis has used its portion of the State Gaming Tax for public safety on the
riverfront. This has included funding for additional police patrols, street and lightingimprovements, and support for the fire department’s marine unit. Revenues from the admissionsfee have been allocated to the city’s capital fund. As such, these revenues are combined withfunds from other sources to fund street paving, bridge repair, rolling stock replacement, andbuilding improvements throughout the city.
Revenues received from the lease payments have been allocated to the city’s portauthority and economic development agency. Approximately $3.0 million was allocated forneighborhood and economic development. The most notable use of these funds was a housinginitiative designed to foster home ownership. This included a one-time grant of $2,000 to personsbuying a house in the city. Following the mayoral election of April 1996, revenues generated bythe President Casino lease have been allocated to the city’s economic development agency andare not allocated to specific programs (Payne 1996; 1997 Budget of the City of St. Louis).
NORTH KANSAS CITYPrior to FY’98, the city of North Kansas City led all Missouri casino venues in gaming
revenue receipts. In FY'98 North Kansas City had gaming revenues of $9.7 million. The figurefor FY'97 was $10.5 million, $8.4 million for FY'96, and $4.8 million for FY'95. In addition totax revenues, the city of North Kansas City also received an initial $6 million lease payment andreceives annual lease payments.
Use of Gaming RevenuesNorth Kansas City, like most other Missouri communities with casino developments, has
devoted a significant portion of gaming revenues to infrastructure improvements. Gamingrevenues have been used to capitalize the city’s five-year capital improvements plan. Gamingrevenues have also been used to acquire new equipment including two fire trucks ($649,000),purchase new replacement vehicles ($218,900), and a new radio system ($1.3 million). NorthKansas City has used a portion of gaming revenues to capitalize a water and sewer utilitymaintenance and depreciation fund, build a new community center ($2.8 million), pay off water
23
pollution control bonds ($1.0 million), and provide additional resources to both the local fire andpolice departments ($783,000) (De French 1996).
North Kansas City has also used gaming revenues to eliminate personal property taxespaid by local residents and businesses. This is a reduction of approximately $260,000 per year(De French 1996; Comprehensive Annual Financial Report of the City of North Kansas City forthe year ended September 30, 1995).
As part of its development agreement with the city of North Kansas City, Harrah’s Casinohas committed to making annual minimum civic contributions of $100,000. The civiccontribution is based on 1% of net operating income or $100,000, whichever is greater. Thesefunds are distributed by the city council. In 1995, for example, thirty-six community groups andorganizations received funding from this source. Funding awards ranged from $1,000 to $3,817,with one organization receiving $50,000 (De French 1996).
The impact of gaming has been dramatic on the finances of North Kansas City. The city’s1994-95 budget totaled $12 million including capital improvements. With the introduction ofcasino gaming the 1995-96 budget more than doubled to $25 million; in 1996-97 it was $25.9million.CITY OF RIVERSIDE
In terms of Admissions fees and the local portion of the State Gaming Tax, the city ofRiverside received $3.6 million in FY'95, $5.2 million in FY'96, $4.6 million in FY'97, and $4.7million in FY'98. In addition, Riverside also received $5 million in advance rents and a $1million grant from Argosy Casino for the construction of a city park.
Use of Gaming RevenuesRiverside officials have used gaming revenues to develop a new Master Plan for the city,
construct a new community center and swimming pool ($3 million), and to construct a newpublic works maintenance building ($1 million). Plans and specifications for a new combinedcity hall and post office are currently being developed ($4.5 million). The city has completed $3million in street improvement and has committed an additional $3 million to this purpose. Theseimprovements have resulted in some streets being paved for the first time and streets havingsidewalks and curves where none had previously existed. In addition, $1.3 million was used toretire outstanding sanitary sewer bonds (Daniels 1996).
CITY OF ST. CHARLESSt. Charles received $5.0 million in admissions fees and the local portion of the State
Gaming Tax in FY’95, $8.5 million in FY’96, $9.0 million in FY’97, and $7.0 million in FY’98.
Use of Gaming RevenuesThe city of St. Charles has committed 20% of gaming revenues to help capitalize a two
million dollar fund for new street construction and reconstruction of existing roadways, includingnew cubs and gutters, street lighting and traffic signals. Twenty percent of gaming funds are

24
committed to enhancing or expanding city facilities or the construction of new city facilities.Fifteen percent of gaming revenues are committed to capitalizing a two million-dollar economicdevelopment fund. In addition, gaming revenues are also used to fund stormwater control (25%)and to capitalize a two million dollar emergency fund (Schulz 1996; City of St. Charles 1994 and1995; Missouri Gaming Commission 1998).
CITY OF ST. JOSEPHThe City of St. Joseph stands out in that it is the only casino venue that shares its gaming
proceeds with a county government. By agreement, the city of St. Joseph shares its gamingrevenues on a 50-50 basis with Buchanan County, the county in which it is located. In terms ofadmissions fees and the local share of the State Gaming Tax, St Joseph received $1.0 million inFY’95, $1.3 million in FY’96, $1.1 million in FY’97, and $1.1 million in FY’98. St. Joseph alsoreceives lease payment for the St Jo Frontiers Partnership.
Use of Gaming RevenuesSt. Joseph officials have used gaming revenues for public celebration and festivals;
$15,000 was expended for this purpose in FY’95, $30,000 in FY’96, and $65,000 in FY’97. St.Joseph officials have also used gaming revenues for public safety. These expenditures haveincluded such things as the purchase of new police cars and vests, and radar training. Publicsafety expenditures totaled $550,923 in FY’96, $401,499 in FY’97, and $296,558 in FY’98. Thecity has also used gaming revenues to make infrastructure improvements such as parking lotrepairs, street improvements, and construction of new downtown sidewalks and curbs (Rodney1998).
CITY OF MARYLAND HEIGHTSThe City of Maryland Heights received $3.5 million in admissions fees and its share of
the State gaming Tax in FY'97 for a partial year of operation. These funds increased dramaticallyto $11.6 million in FY'98.
Use of Gaming RevenueSeventy percent (70%) of gaming revenues are pledged to the city’s General Fund with
the remaining thirty percent (30%) of gaming revenues pledged to the Earth City Expressway. Asubstantial portion of gaming revenues is committed to infrastructure improvements and publicsafety. For example, by ordinance, the city has committed $3 million annually to improvementsto the Earth City Expressway and $500,000 to the police department. In addition, in 1998,Maryland Heights spent approximately $2.7 million of gaming revenues on road improvementsincluding street reconstruction, bridge replacements, and traffic studies and related engineeringservices (Leven, Phares, and Louishomme 1998; Missouri Gaming Commission 1998; City ofMaryland Heights Proposed 1997 Budget).

25
CONCLUSIONS
As the information in Tables I-VI clearly indicate, gaming revenues from the admissionsfee and the local portion of the state gaming tax have become an important element in financinglocal services for home dock communities. Obviously, the fiscal impact is far greater in thesmaller cities and much less for St. Louis and Kansas City. Gaming revenues as a percentage oftotal revenues ranges from a tiny 0.8% in Kansas City to a dominant 75.2% in Riverside (seeTable I).
A recent study of the impact of gaming in the state of Missouri highlights the economicbenefits in terms of new jobs, over 17,000, additional personal income, over $508 million, andnew spending, $759 million (see Table II). In addition, of course, in FY'98 there was some $55million in tax and fee revenues going to support public services in gaming venue localities (seeTable III). (4)
A survey, done by the authors, of each of the home dock cities reveals that most of thegaming revenues have been spent on capital investment ranging from street lighting and roadimprovement to public safety and economic development. This suggests that the communitieshave wisely chosen to not build these newfound revenues into general revenue for day-to-dayoperations but are dedicating them for one-time uses.

26
NOTES
1. 1994 MO Laws 1249 as noted on page 263 of Akin v. Missouri Gaming Commission.2. Unless otherwise noted, revenue amounts from the admissions fee and the local portion of the
State Gaming Tax are taken from Missouri Gaming Commission Annual Reports for FiscalYears 1995, 1996, 1997 and 1998.
3. The admissions fee is $2.00 per person split evenly between the home dock locality and the state of Missouri; it must be paid for every person entering a gaming venue. The state gaming tax is 20% of adjusted gross receipts; 2% goes to the locality and 18% to the state of Missouri.4. This report does not look at the impact for the state but Table III indirectly reflects the revenues received by the state of Missouri, which are constitutionally earmarked for elementary and secondary and higher education. The state receives the same $1.00 per admission as locals, yielding $39.5 million. The state receives 18% of the 20% state gaming tax or $145 million (9 times the 2% share of the locals or $16.1 million).

27
REFERENCES
Akin, et al. v. Missouri Gaming Commission, et al., 956 SW2d 261, 1997.
City of Caruthersville 1996. City of Caruthersville, Missouri Financial Statements, June 30,1996.
Comprehensive Annual Financial Report for the City of St. Charles Missouri for the fiscal yearended June 30, 1994 and June 30, 1995,
De French 1996. Conversation with City Administrator George De French on September 17,1996 and letter from him dated November 8, 1996.
Harris, et al. v. Missouri Gaming Commission, et al. 869 SW2d 58, 1996.
Land, Shirley 1996. September 17, 1996 letter from S. Land, Financial Budget Manager, FinanceDepartment, Kansas City Missouri.
Leven, Charles, Don Phares, and Claude Louishomme. 1998. The Economic Impact of Gaming inMissouri. St. Louis, MO: Civic Progress Inc.
Levin, Mark 1998. November 6, 1998 conversation with Mark Levin, City Administrator, City ofMaryland Heights, Missouri.
Maryland Heights November 21, 1996. City of Maryland Heights Proposed 1997 Budget.
Missouri Gaming Commission 1998. 1998 Annual Report to the General Assembly.
Missouri Gaming Commission 1997. 1997 Annual Report to the General Assembly.
Missouri Gaming Commission 1996. 1996 Annual Report to the General Assembly.
Missouri Gaming Commission 1995. 1995 Annual Report to the General Assembly.
Payne, Paul 1996. August 2, 1996 Facsimile transmission from Paul W. Payne, City of St. LouisBudget Division.
Queen, Tammy 1998. Monday, November 2, 1998 e-mail from T. Queen, Financial BudgetManager, Finance Department, Kansas City Missouri.
Rodney, Dale 1998. City of St. Joseph, Missouri Riverboat Gaming Expenditure Summary as ofFiscal Year 1998. Material provided by Dale Rodney, accountant for the city of St. Joseph.

28
Schulz, Brent 1996. November 21, 1996 letter and attachments from Brent C. Schulz, Assistantto the City Administrator, city of St. Charles Missouri.