cases of schwannomatosis and literature review analysis of
TRANSCRIPT

Page 1/18
Analysis of Imaging and Pathological Features in 12Cases of Schwannomatosis and Literature ReviewCheng-wei Kang ( [email protected] )
West China School of Medicine: Sichuan University West China Hospital https://orcid.org/0000-0003-4834-8957Li-xue Wu
Sichuan University West China College of Public Health: Sichuan University West China School of PublicHealthXiao-bing Pu
Sichuan University West China College of Public Health: Sichuan University West China School of PublicHealthChang-chao Dong Dong
Sichuan University West China College of Public Health: Sichuan University West China School of PublicHealthGang Tan
Sichuan University West China College of Public Health: Sichuan University West China School of PublicHealthZhao-kui Yan
Sichuan University West China College of Public Health: Sichuan University West China School of PublicHealthJiang Shen
Sichuan University West China College of Public Health: Sichuan University West China School of PublicHealthLei Liu
West China School of Medicine: Sichuan University West China Hospital https://orcid.org/0000-0002-2184-9463
Research Article
Keywords: Schwannomatosis, Imaging features, Pathology, Immunohistochemistry, Differential diagnosis
Posted Date: May 26th, 2021
DOI: https://doi.org/10.21203/rs.3.rs-539940/v1
License: This work is licensed under a Creative Commons Attribution 4.0 International License. ReadFull License

Page 2/18
Page 3/18
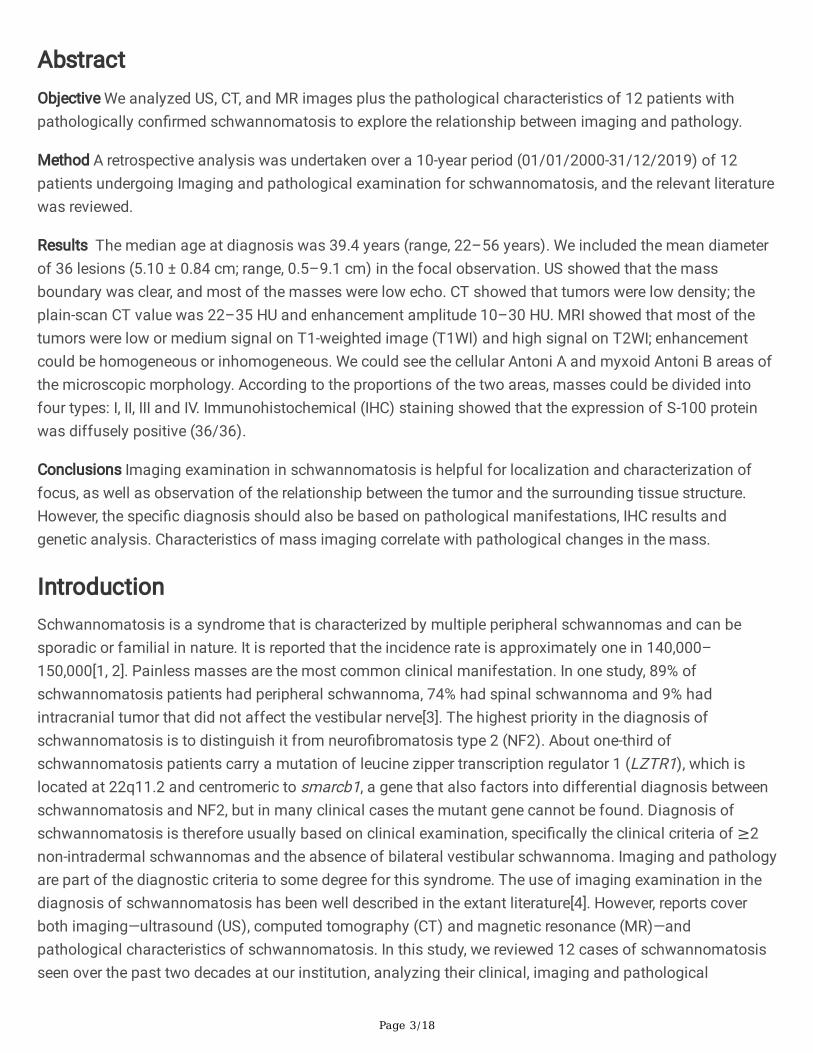
AbstractObjective We analyzed US, CT, and MR images plus the pathological characteristics of 12 patients withpathologically con�rmed schwannomatosis to explore the relationship between imaging and pathology.
Method A retrospective analysis was undertaken over a 10-year period (01/01/2000-31/12/2019) of 12patients undergoing Imaging and pathological examination for schwannomatosis, and the relevant literaturewas reviewed.
Results The median age at diagnosis was 39.4 years (range, 22–56 years). We included the mean diameterof 36 lesions (5.10 ± 0.84 cm; range, 0.5–9.1 cm) in the focal observation. US showed that the massboundary was clear, and most of the masses were low echo. CT showed that tumors were low density; theplain-scan CT value was 22–35 HU and enhancement amplitude 10–30 HU. MRI showed that most of thetumors were low or medium signal on T1-weighted image (T1WI) and high signal on T2WI; enhancementcould be homogeneous or inhomogeneous. We could see the cellular Antoni A and myxoid Antoni B areas ofthe microscopic morphology. According to the proportions of the two areas, masses could be divided intofour types: I, II, III and IV. Immunohistochemical (IHC) staining showed that the expression of S-100 proteinwas diffusely positive (36/36).
Conclusions Imaging examination in schwannomatosis is helpful for localization and characterization offocus, as well as observation of the relationship between the tumor and the surrounding tissue structure.However, the speci�c diagnosis should also be based on pathological manifestations, IHC results andgenetic analysis. Characteristics of mass imaging correlate with pathological changes in the mass.
IntroductionSchwannomatosis is a syndrome that is characterized by multiple peripheral schwannomas and can besporadic or familial in nature. It is reported that the incidence rate is approximately one in 140,000–150,000[1, 2]. Painless masses are the most common clinical manifestation. In one study, 89% ofschwannomatosis patients had peripheral schwannoma, 74% had spinal schwannoma and 9% hadintracranial tumor that did not affect the vestibular nerve[3]. The highest priority in the diagnosis ofschwannomatosis is to distinguish it from neuro�bromatosis type 2 (NF2). About one-third ofschwannomatosis patients carry a mutation of leucine zipper transcription regulator 1 (LZTR1), which islocated at 22q11.2 and centromeric to smarcb1, a gene that also factors into differential diagnosis betweenschwannomatosis and NF2, but in many clinical cases the mutant gene cannot be found. Diagnosis ofschwannomatosis is therefore usually based on clinical examination, speci�cally the clinical criteria of ≥2non-intradermal schwannomas and the absence of bilateral vestibular schwannoma. Imaging and pathologyare part of the diagnostic criteria to some degree for this syndrome. The use of imaging examination in thediagnosis of schwannomatosis has been well described in the extant literature[4]. However, reports coverboth imaging—ultrasound (US), computed tomography (CT) and magnetic resonance (MR)—andpathological characteristics of schwannomatosis. In this study, we reviewed 12 cases of schwannomatosisseen over the past two decades at our institution, analyzing their clinical, imaging and pathological

Page 4/18
characteristics, and attempted to elucidate the internal relationship between imaging and pathology inschwannomatosis.
Clinical Data And MethodsThis study was a retrospective analysis of 12 cases of schwannomatosis con�rmed by pathology aftercomplete imaging examination (US, CT and MRI) at our hospital during January 2000–December 2019. Themedian age at diagnosis was 39.4 years (range, 22–56 years), with a median delay from the initialsymptoms to diagnosis of 7.4 years (range, 0.1–40 years). All 12 patients received imaging examinations.Two cases were intracranial, 7 involved the intraspinal nerves, 6 were in the torso, 11 were in the limbs, 5were in the chest and 7 were abdominal. The total number of masses was >60 (some masses had fused withone another, making them di�cult to accurately count). The focus of imaging observation and pathologicaldiagnosis was the masses that underwent surgical resection or puncture biopsy. (Intracranial and intraspinalmasses are not easily examined by US and were therefore not included in the selective analysis). Ultimately,we included a total of 36 masses in our analysis (Table 1).
Table 1 General clinical data of 12 patients with schwannomatosis
Male/Female(n)
Medianage (y)
Courseofdisease(y)
Observations/Total
Symptomatic/Asymptomatic
Resectionedcases(masses)
Puncturecases(masses)
Statistic 10/2 39.4 7.4 36/60+ 9/3 10 (32) 2 (4)
1.1 Inclusion criteria
(1) The presence of ≥2 non-intradermal schwannomas in different parts of the body as con�rmed bypathology (surgery/puncture biopsy), (2) the patient did not meet any existing diagnostic criteria for NF2 orhave any �rst-degree relatives with NF2, (3) blood samples of patients age < 20 years were genetically tested,and NF2 mutation was found to be absent from blood deoxyribonucleic acid (DNA), and (4) patients age ≤40 years underwent enhanced MRI, excluding those with bilateral vestibular schwannoma[5, 6].
1.2 Imaging and pathological-examination methods
1.2.1Ultrasonic-examination method
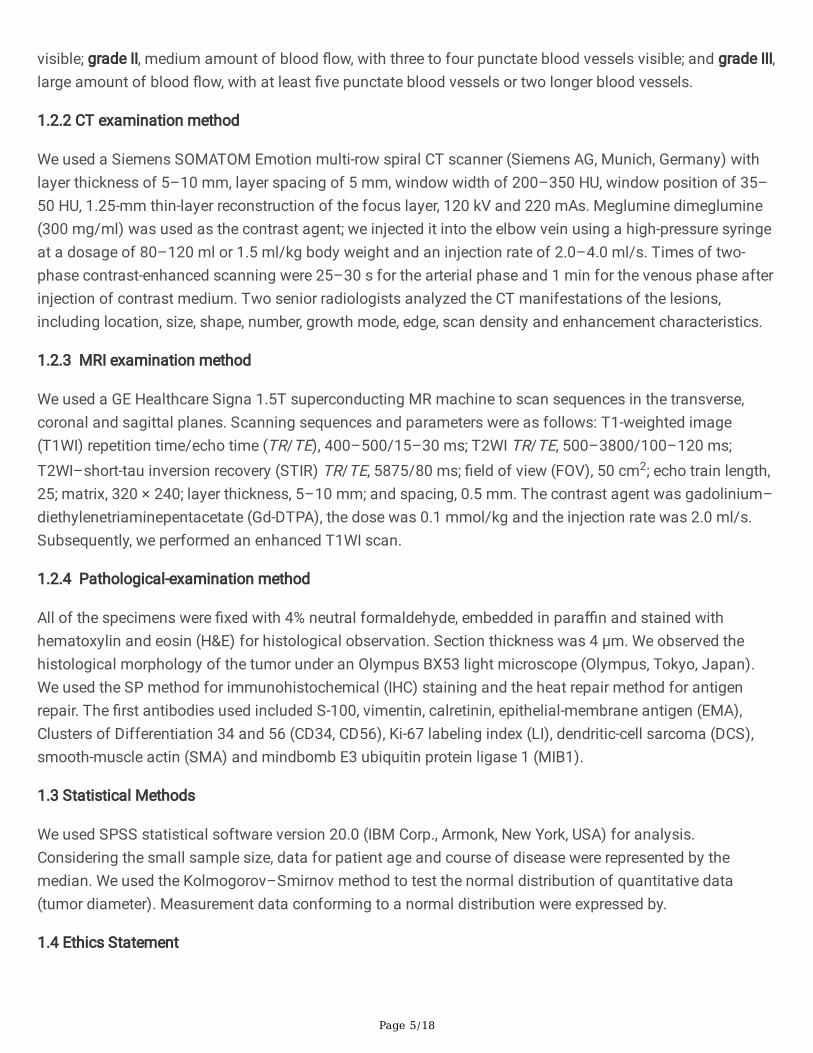
We used a GE LOGIQ E9 US system (GE Healthcare, Chicago, IL, USA) and a Canon Aplio i800 color DopplerUS diagnostic instrument (Canon Medical Systems USA, Tustin, CA, USA). The probe frequency was 5–12MHz; for the abdominal convex array probe, the frequency was 2–5 MHz. Two deputy chief US specialistsobserved schwannomatosis patients’ US imaging data. We recorded tumor location, quantity, size, shape,boundary, internal and rear echo, relationship with peripheral nerves and blood vessels, and blood �owsignals. When opinions differed, a consensus was reached after discussion. Evaluation criteria were asfollows: Blood �ow signal in the mass was graded on the Adler scale: grade 0, no blood �ow signal found inthe tumor; grade I, small amount of blood �ow, with one to two punctate or rod-shaped tumor blood vessels
Page 5/18
visible; grade II, medium amount of blood �ow, with three to four punctate blood vessels visible; and grade III,large amount of blood �ow, with at least �ve punctate blood vessels or two longer blood vessels.
1.2.2 CT examination method
We used a Siemens SOMATOM Emotion multi-row spiral CT scanner (Siemens AG, Munich, Germany) withlayer thickness of 5–10 mm, layer spacing of 5 mm, window width of 200–350 HU, window position of 35–50 HU, 1.25-mm thin-layer reconstruction of the focus layer, 120 kV and 220 mAs. Meglumine dimeglumine(300 mg/ml) was used as the contrast agent; we injected it into the elbow vein using a high-pressure syringeat a dosage of 80–120 ml or 1.5 ml/kg body weight and an injection rate of 2.0–4.0 ml/s. Times of two-phase contrast-enhanced scanning were 25–30 s for the arterial phase and 1 min for the venous phase afterinjection of contrast medium. Two senior radiologists analyzed the CT manifestations of the lesions,including location, size, shape, number, growth mode, edge, scan density and enhancement characteristics.
1.2.3 MRI examination method
We used a GE Healthcare Signa 1.5T superconducting MR machine to scan sequences in the transverse,coronal and sagittal planes. Scanning sequences and parameters were as follows: T1-weighted image(T1WI) repetition time/echo time (TR/TE), 400–500/15–30 ms; T2WI TR/TE, 500–3800/100–120 ms;T2WI–short-tau inversion recovery (STIR) TR/TE, 5875/80 ms; �eld of view (FOV), 50 cm2; echo train length,25; matrix, 320 × 240; layer thickness, 5–10 mm; and spacing, 0.5 mm. The contrast agent was gadolinium–diethylenetriaminepentacetate (Gd-DTPA), the dose was 0.1 mmol/kg and the injection rate was 2.0 ml/s.Subsequently, we performed an enhanced T1WI scan.
1.2.4 Pathological-examination method
All of the specimens were �xed with 4% neutral formaldehyde, embedded in para�n and stained withhematoxylin and eosin (H&E) for histological observation. Section thickness was 4 μm. We observed thehistological morphology of the tumor under an Olympus BX53 light microscope (Olympus, Tokyo, Japan).We used the SP method for immunohistochemical (IHC) staining and the heat repair method for antigenrepair. The �rst antibodies used included S-100, vimentin, calretinin, epithelial-membrane antigen (EMA),Clusters of Differentiation 34 and 56 (CD34, CD56), Ki-67 labeling index (LI), dendritic-cell sarcoma (DCS),smooth-muscle actin (SMA) and mindbomb E3 ubiquitin protein ligase 1 (MIB1).
1.3 Statistical Methods
We used SPSS statistical software version 20.0 (IBM Corp., Armonk, New York, USA) for analysis.Considering the small sample size, data for patient age and course of disease were represented by themedian. We used the Kolmogorov–Smirnov method to test the normal distribution of quantitative data(tumor diameter). Measurement data conforming to a normal distribution were expressed by.
1.4 Ethics Statement
Page 6/18
This retrospective study was approved by our hospital’s institutional review board. We obtained signedconsent from each patient.
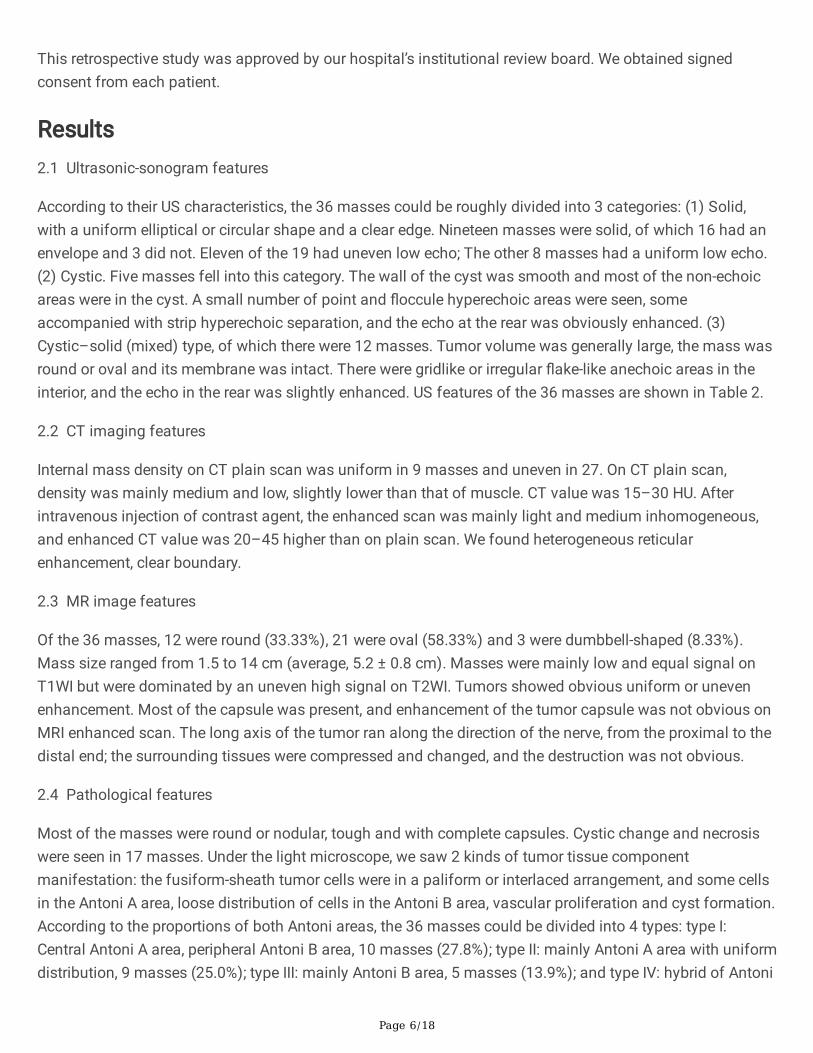
Results2.1 Ultrasonic-sonogram features
According to their US characteristics, the 36 masses could be roughly divided into 3 categories: (1) Solid,with a uniform elliptical or circular shape and a clear edge. Nineteen masses were solid, of which 16 had anenvelope and 3 did not. Eleven of the 19 had uneven low echo; The other 8 masses had a uniform low echo.(2) Cystic. Five masses fell into this category. The wall of the cyst was smooth and most of the non-echoicareas were in the cyst. A small number of point and �occule hyperechoic areas were seen, someaccompanied with strip hyperechoic separation, and the echo at the rear was obviously enhanced. (3)Cystic–solid (mixed) type, of which there were 12 masses. Tumor volume was generally large, the mass wasround or oval and its membrane was intact. There were gridlike or irregular �ake-like anechoic areas in theinterior, and the echo in the rear was slightly enhanced. US features of the 36 masses are shown in Table 2.
2.2 CT imaging features
Internal mass density on CT plain scan was uniform in 9 masses and uneven in 27. On CT plain scan,density was mainly medium and low, slightly lower than that of muscle. CT value was 15–30 HU. Afterintravenous injection of contrast agent, the enhanced scan was mainly light and medium inhomogeneous,and enhanced CT value was 20–45 higher than on plain scan. We found heterogeneous reticularenhancement, clear boundary.
2.3 MR image features
Of the 36 masses, 12 were round (33.33%), 21 were oval (58.33%) and 3 were dumbbell-shaped (8.33%).Mass size ranged from 1.5 to 14 cm (average, 5.2 ± 0.8 cm). Masses were mainly low and equal signal onT1WI but were dominated by an uneven high signal on T2WI. Tumors showed obvious uniform or unevenenhancement. Most of the capsule was present, and enhancement of the tumor capsule was not obvious onMRI enhanced scan. The long axis of the tumor ran along the direction of the nerve, from the proximal to thedistal end; the surrounding tissues were compressed and changed, and the destruction was not obvious.
2.4 Pathological features
Most of the masses were round or nodular, tough and with complete capsules. Cystic change and necrosiswere seen in 17 masses. Under the light microscope, we saw 2 kinds of tumor tissue componentmanifestation: the fusiform-sheath tumor cells were in a paliform or interlaced arrangement, and some cellsin the Antoni A area, loose distribution of cells in the Antoni B area, vascular proliferation and cyst formation.According to the proportions of both Antoni areas, the 36 masses could be divided into 4 types: type I:Central Antoni A area, peripheral Antoni B area, 10 masses (27.8%); type II: mainly Antoni A area with uniformdistribution, 9 masses (25.0%); type III: mainly Antoni B area, 5 masses (13.9%); and type IV: hybrid of Antoni
Page 7/18
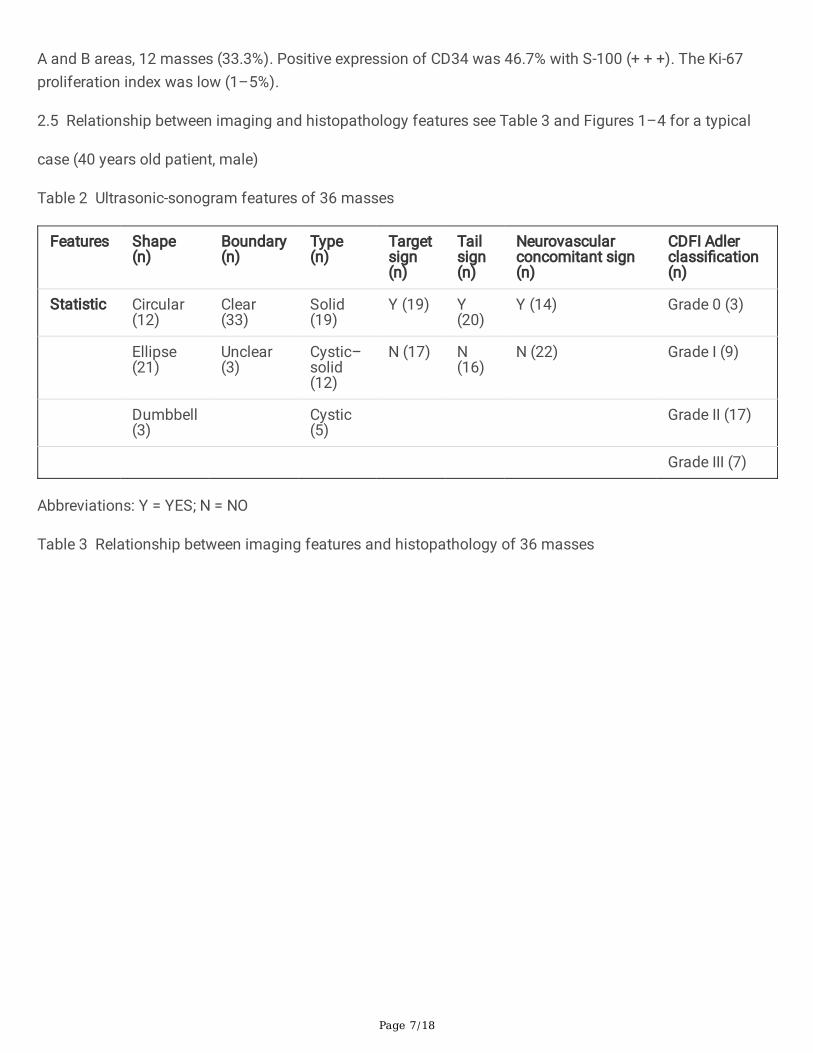
A and B areas, 12 masses (33.3%). Positive expression of CD34 was 46.7% with S-100 (+ + +). The Ki-67proliferation index was low (1–5%).
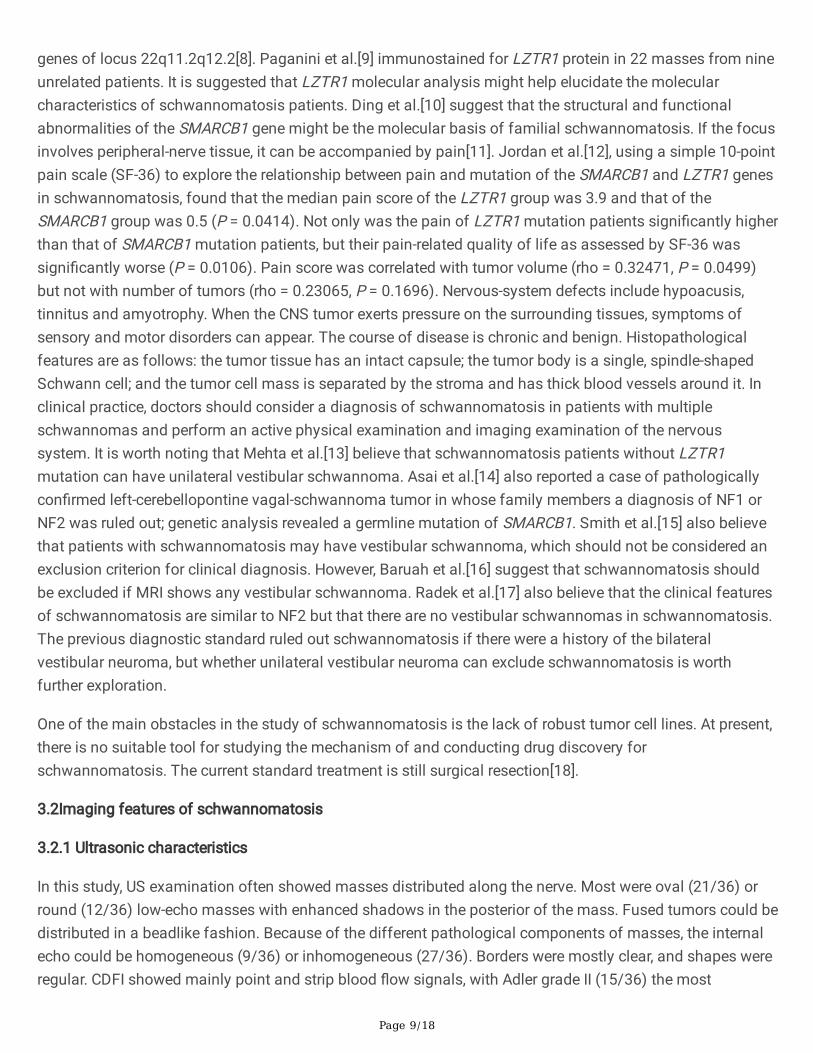
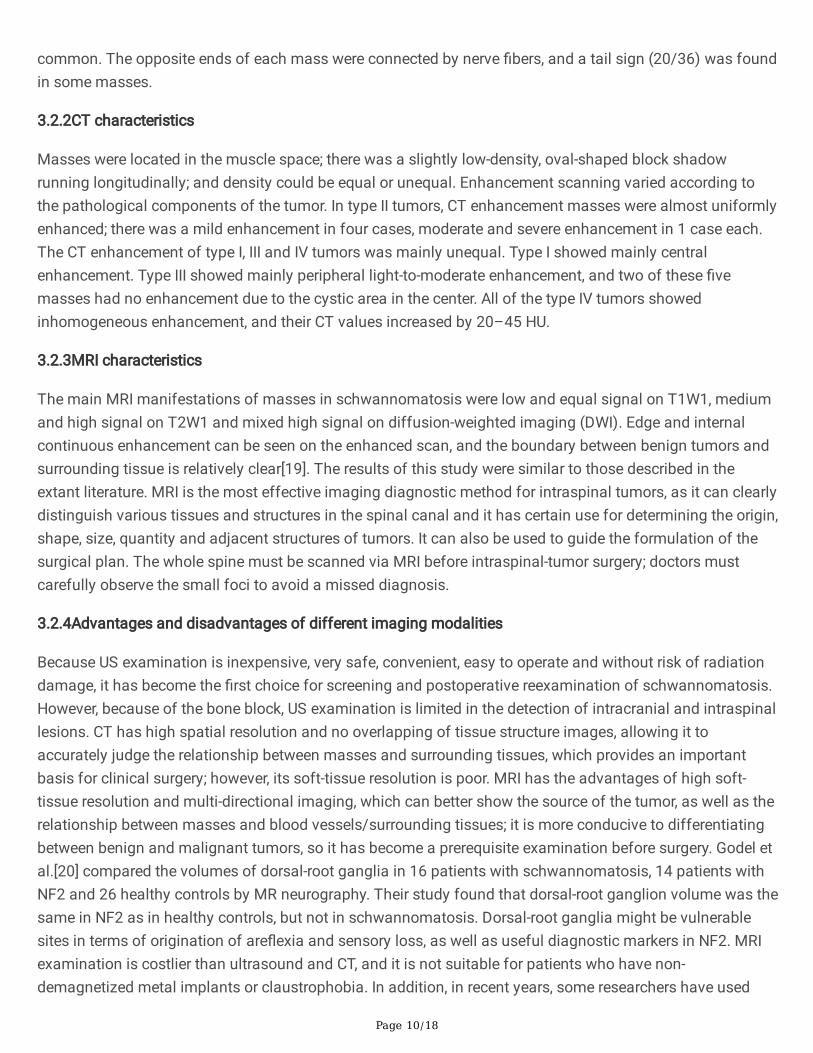
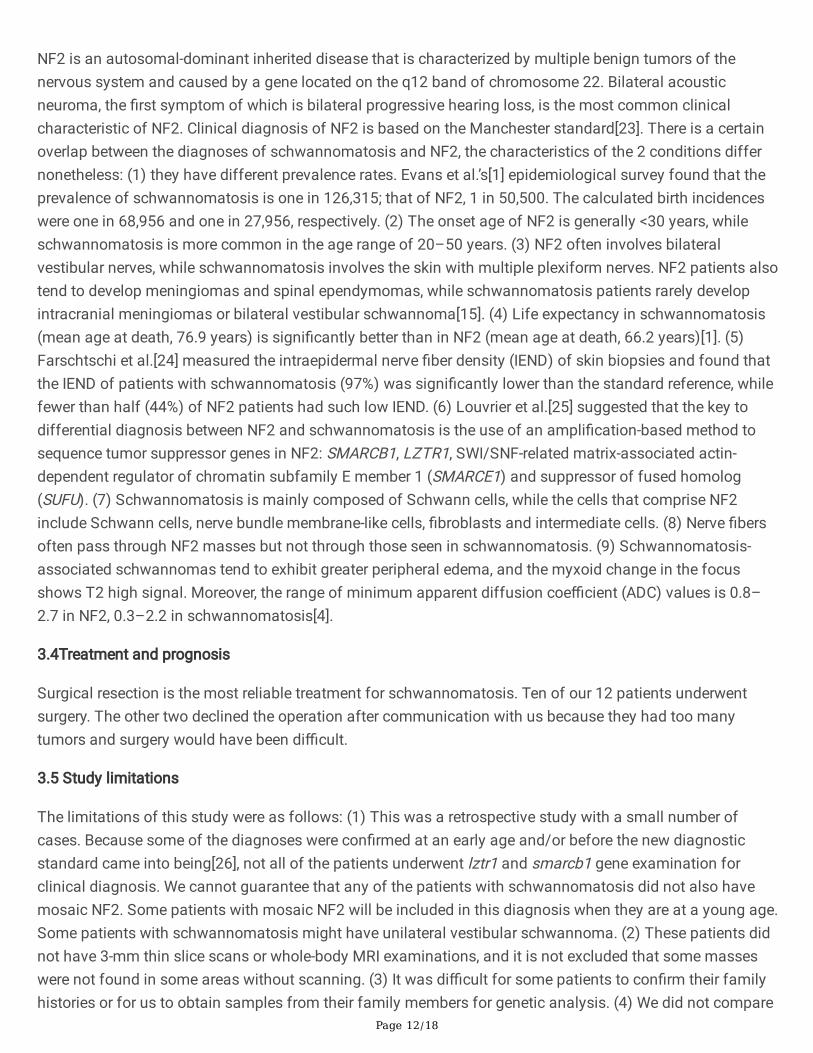
2.5 Relationship between imaging and histopathology features see Table 3 and Figures 1–4 for a typical
case (40 years old patient, male)
Table 2 Ultrasonic-sonogram features of 36 masses
Features Shape(n)
Boundary(n)
Type(n)
Targetsign(n)
Tailsign(n)
Neurovascularconcomitant sign(n)
CDFI Adlerclassi�cation(n)
Statistic Circular(12)
Clear(33)
Solid(19)
Y (19) Y(20)
Y (14) Grade 0 (3)
Ellipse(21)
Unclear(3)
Cystic–solid(12)
N (17) N(16)
N (22) Grade I (9)
Dumbbell(3)
Cystic(5)
Grade II (17)
Grade III (7)
Abbreviations: Y = YES; N = NO
Table 3 Relationship between imaging features and histopathology of 36 masses
Page 8/18
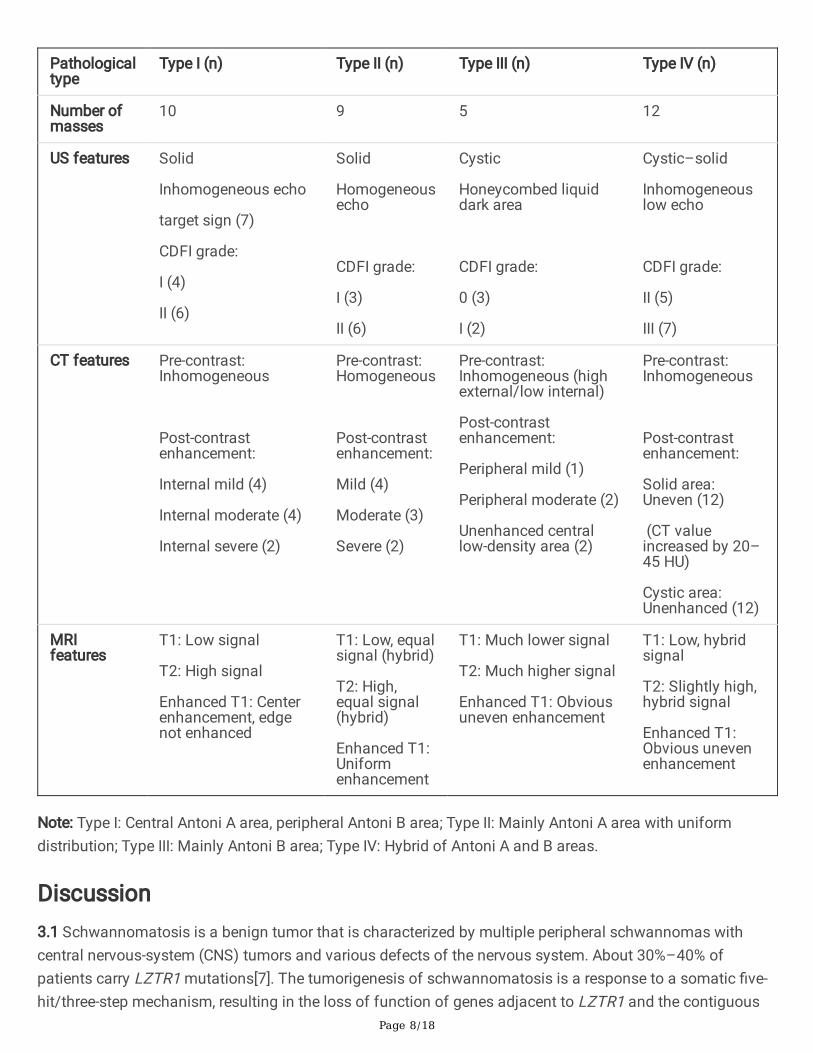
Pathologicaltype
Type I (n) Type II (n) Type III (n) Type IV (n)
Number ofmasses
10 9 5 12
US features Solid
Inhomogeneous echo
target sign (7)
CDFI grade:
I (4)
II (6)
Solid
Homogeneousecho
CDFI grade:
I (3)
II (6)
Cystic
Honeycombed liquiddark area
CDFI grade:
0 (3)
I (2)
Cystic–solid
Inhomogeneouslow echo
CDFI grade:
II (5)
III (7)
CT features Pre-contrast:Inhomogeneous
Post-contrastenhancement:
Internal mild (4)
Internal moderate (4)
Internal severe (2)
Pre-contrast:Homogeneous
Post-contrastenhancement:
Mild (4)
Moderate (3)
Severe (2)
Pre-contrast:Inhomogeneous (highexternal/low internal)
Post-contrastenhancement:
Peripheral mild (1)
Peripheral moderate (2)
Unenhanced centrallow-density area (2)
Pre-contrast:Inhomogeneous
Post-contrastenhancement:
Solid area:Uneven (12)
(CT valueincreased by 20–45 HU)
Cystic area:Unenhanced (12)
MRIfeatures
T1: Low signal
T2: High signal
Enhanced T1: Centerenhancement, edgenot enhanced
T1: Low, equalsignal (hybrid)
T2: High,equal signal(hybrid)
Enhanced T1:Uniformenhancement
T1: Much lower signal
T2: Much higher signal
Enhanced T1: Obviousuneven enhancement
T1: Low, hybridsignal
T2: Slightly high,hybrid signal
Enhanced T1:Obvious unevenenhancement
Note: Type I: Central Antoni A area, peripheral Antoni B area; Type II: Mainly Antoni A area with uniformdistribution; Type III: Mainly Antoni B area; Type IV: Hybrid of Antoni A and B areas.
Discussion3.1 Schwannomatosis is a benign tumor that is characterized by multiple peripheral schwannomas withcentral nervous-system (CNS) tumors and various defects of the nervous system. About 30%–40% ofpatients carry LZTR1 mutations[7]. The tumorigenesis of schwannomatosis is a response to a somatic �ve-hit/three-step mechanism, resulting in the loss of function of genes adjacent to LZTR1 and the contiguous
Page 9/18
genes of locus 22q11.2q12.2[8]. Paganini et al.[9] immunostained for LZTR1 protein in 22 masses from nineunrelated patients. It is suggested that LZTR1 molecular analysis might help elucidate the molecularcharacteristics of schwannomatosis patients. Ding et al.[10] suggest that the structural and functionalabnormalities of the SMARCB1 gene might be the molecular basis of familial schwannomatosis. If the focusinvolves peripheral-nerve tissue, it can be accompanied by pain[11]. Jordan et al.[12], using a simple 10-pointpain scale (SF-36) to explore the relationship between pain and mutation of the SMARCB1 and LZTR1 genesin schwannomatosis, found that the median pain score of the LZTR1 group was 3.9 and that of theSMARCB1 group was 0.5 (P = 0.0414). Not only was the pain of LZTR1 mutation patients signi�cantly higherthan that of SMARCB1 mutation patients, but their pain-related quality of life as assessed by SF-36 wassigni�cantly worse (P = 0.0106). Pain score was correlated with tumor volume (rho = 0.32471, P = 0.0499)but not with number of tumors (rho = 0.23065, P = 0.1696). Nervous-system defects include hypoacusis,tinnitus and amyotrophy. When the CNS tumor exerts pressure on the surrounding tissues, symptoms ofsensory and motor disorders can appear. The course of disease is chronic and benign. Histopathologicalfeatures are as follows: the tumor tissue has an intact capsule; the tumor body is a single, spindle-shapedSchwann cell; and the tumor cell mass is separated by the stroma and has thick blood vessels around it. Inclinical practice, doctors should consider a diagnosis of schwannomatosis in patients with multipleschwannomas and perform an active physical examination and imaging examination of the nervoussystem. It is worth noting that Mehta et al.[13] believe that schwannomatosis patients without LZTR1mutation can have unilateral vestibular schwannoma. Asai et al.[14] also reported a case of pathologicallycon�rmed left-cerebellopontine vagal-schwannoma tumor in whose family members a diagnosis of NF1 orNF2 was ruled out; genetic analysis revealed a germline mutation of SMARCB1. Smith et al.[15] also believethat patients with schwannomatosis may have vestibular schwannoma, which should not be considered anexclusion criterion for clinical diagnosis. However, Baruah et al.[16] suggest that schwannomatosis shouldbe excluded if MRI shows any vestibular schwannoma. Radek et al.[17] also believe that the clinical featuresof schwannomatosis are similar to NF2 but that there are no vestibular schwannomas in schwannomatosis.The previous diagnostic standard ruled out schwannomatosis if there were a history of the bilateralvestibular neuroma, but whether unilateral vestibular neuroma can exclude schwannomatosis is worthfurther exploration.
One of the main obstacles in the study of schwannomatosis is the lack of robust tumor cell lines. At present,there is no suitable tool for studying the mechanism of and conducting drug discovery forschwannomatosis. The current standard treatment is still surgical resection[18].
3.2Imaging features of schwannomatosis
3.2.1 Ultrasonic characteristics
In this study, US examination often showed masses distributed along the nerve. Most were oval (21/36) orround (12/36) low-echo masses with enhanced shadows in the posterior of the mass. Fused tumors could bedistributed in a beadlike fashion. Because of the different pathological components of masses, the internalecho could be homogeneous (9/36) or inhomogeneous (27/36). Borders were mostly clear, and shapes wereregular. CDFI showed mainly point and strip blood �ow signals, with Adler grade II (15/36) the most
Page 10/18
common. The opposite ends of each mass were connected by nerve �bers, and a tail sign (20/36) was foundin some masses.
3.2.2CT characteristics
Masses were located in the muscle space; there was a slightly low-density, oval-shaped block shadowrunning longitudinally; and density could be equal or unequal. Enhancement scanning varied according tothe pathological components of the tumor. In type II tumors, CT enhancement masses were almost uniformlyenhanced; there was a mild enhancement in four cases, moderate and severe enhancement in 1 case each.The CT enhancement of type I, III and IV tumors was mainly unequal. Type I showed mainly centralenhancement. Type III showed mainly peripheral light-to-moderate enhancement, and two of these �vemasses had no enhancement due to the cystic area in the center. All of the type IV tumors showedinhomogeneous enhancement, and their CT values increased by 20–45 HU.
3.2.3MRI characteristics
The main MRI manifestations of masses in schwannomatosis were low and equal signal on T1W1, mediumand high signal on T2W1 and mixed high signal on diffusion-weighted imaging (DWI). Edge and internalcontinuous enhancement can be seen on the enhanced scan, and the boundary between benign tumors andsurrounding tissue is relatively clear[19]. The results of this study were similar to those described in theextant literature. MRI is the most effective imaging diagnostic method for intraspinal tumors, as it can clearlydistinguish various tissues and structures in the spinal canal and it has certain use for determining the origin,shape, size, quantity and adjacent structures of tumors. It can also be used to guide the formulation of thesurgical plan. The whole spine must be scanned via MRI before intraspinal-tumor surgery; doctors mustcarefully observe the small foci to avoid a missed diagnosis.
3.2.4Advantages and disadvantages of different imaging modalities
Because US examination is inexpensive, very safe, convenient, easy to operate and without risk of radiationdamage, it has become the �rst choice for screening and postoperative reexamination of schwannomatosis.However, because of the bone block, US examination is limited in the detection of intracranial and intraspinallesions. CT has high spatial resolution and no overlapping of tissue structure images, allowing it toaccurately judge the relationship between masses and surrounding tissues, which provides an importantbasis for clinical surgery; however, its soft-tissue resolution is poor. MRI has the advantages of high soft-tissue resolution and multi-directional imaging, which can better show the source of the tumor, as well as therelationship between masses and blood vessels/surrounding tissues; it is more conducive to differentiatingbetween benign and malignant tumors, so it has become a prerequisite examination before surgery. Godel etal.[20] compared the volumes of dorsal-root ganglia in 16 patients with schwannomatosis, 14 patients withNF2 and 26 healthy controls by MR neurography. Their study found that dorsal-root ganglion volume was thesame in NF2 as in healthy controls, but not in schwannomatosis. Dorsal-root ganglia might be vulnerablesites in terms of origination of are�exia and sensory loss, as well as useful diagnostic markers in NF2. MRIexamination is costlier than ultrasound and CT, and it is not suitable for patients who have non-demagnetized metal implants or claustrophobia. In addition, in recent years, some researchers have used

Page 11/18
positron emission tomography (PET) for imaging diagnosis of schwannomatosis[21], but PET imagingmight not be a reliable predictor of malignant transformation in schwannoma, which reduces the enthusiasmfor tumor surgery without obvious clinical symptoms or signs[22]. This imaging modality is also expensiveand di�cult to promote.
3.2.5 Pathological features of schwannomatosis
In general, specimens have a capsule, and there are no nerve �bers in the tumor body. In terms of pathmorphology, two types of schwannoma tissue can be seen under the microscope. In type A tissue, tumorcells are arranged in bundles; cells within the tissue are spindle-shaped and arranged parallel to each otherinto palisades; the nucleus is thin and long; and there are abundant slender reticular �bers between the cells.Type B has few cells in the tissue. The arrangement of tumor cells is disordered and loose, with liquidbetween cells and �bers that can collect in the capsule. There is a large extracellular space between tissues,and abundant capillaries and blood sinuses between cells. Tumor blood vessels often show sinusoidal,spongy, or capillary-like dilation and hyaline change of blood vessel walls. In terms of immunophenotype,schwannomatosis is the same as classic soft-tissue schwannoma. Our 12 cases all showed diffuse positiveS-100 protein expression, which could be used as the �rst marker. NF was generally not expressed, Ki-67 wasbelow 3%, and patients were mostly positive for CD34 and vimentin.
3.2.6 Relationship between imaging manifestations and pathology
This study showed a certain correlation between tumor imaging and pathological properties inschwannomatosis. Because of the density of the cells in Antoni type A tissue, CT plain scan and US �ndingsin lesions mainly composed of this tissue showed mostly moderate and slightly low density or echo. Theuniformity of the internal density or echo depended on the amount of Antoni type B tissue. The distributionof Antoni type B tissue in the tumor was consistent with that of the low-density and low-echo areas. Antoni Bareas easily become cystic, and their imaging features are round low-density areas with smooth inner walls.The enhancement range of the tumor varied greatly, from light to signi�cant; the enhancement could beirregular or more uniform, or there could be interstitial or cystic low density in the enhancement area. Thischange was consistent with the distribution of multicystic space and hemorrhagic degeneration in Antonitype B tissue, similar to the characteristic manifestation of schwannoma on T2WI: target sign. In this study,25 masses had enhancement amplitudes >20 HU, 5 of which were schwannomas with active growth. Therewere abundant blood sinuses in the tumors. The blood-rich Antoni type A tissues were enhanced, whileenhancement of Antoni type B tissues was not obvious. In this study, 11 masses with enhancement <20 HUwere found to have a large number of collagen �bers. Other causes of tumor enhancement included hyalinedegeneration, hemorrhage and necrosis. CDFI revealed no signi�cant blood �ow signal in most lesions, onlya small amount of linear color blood �ow signal. The reason was that the wall of the tumor vessel was�brosis and accompanied by thrombosis.
3.3 Differential diagnosis
Neuro�bromatosis type 2 NF2
Page 12/18
NF2 is an autosomal-dominant inherited disease that is characterized by multiple benign tumors of thenervous system and caused by a gene located on the q12 band of chromosome 22. Bilateral acousticneuroma, the �rst symptom of which is bilateral progressive hearing loss, is the most common clinicalcharacteristic of NF2. Clinical diagnosis of NF2 is based on the Manchester standard[23]. There is a certainoverlap between the diagnoses of schwannomatosis and NF2, the characteristics of the 2 conditions differnonetheless: (1) they have different prevalence rates. Evans et al.’s[1] epidemiological survey found that theprevalence of schwannomatosis is one in 126,315; that of NF2, 1 in 50,500. The calculated birth incidenceswere one in 68,956 and one in 27,956, respectively. (2) The onset age of NF2 is generally <30 years, whileschwannomatosis is more common in the age range of 20–50 years. (3) NF2 often involves bilateralvestibular nerves, while schwannomatosis involves the skin with multiple plexiform nerves. NF2 patients alsotend to develop meningiomas and spinal ependymomas, while schwannomatosis patients rarely developintracranial meningiomas or bilateral vestibular schwannoma[15]. (4) Life expectancy in schwannomatosis(mean age at death, 76.9 years) is signi�cantly better than in NF2 (mean age at death, 66.2 years)[1]. (5)Farschtschi et al.[24] measured the intraepidermal nerve �ber density (IEND) of skin biopsies and found thatthe IEND of patients with schwannomatosis (97%) was signi�cantly lower than the standard reference, whilefewer than half (44%) of NF2 patients had such low IEND. (6) Louvrier et al.[25] suggested that the key todifferential diagnosis between NF2 and schwannomatosis is the use of an ampli�cation-based method tosequence tumor suppressor genes in NF2: SMARCB1, LZTR1, SWI/SNF-related matrix-associated actin-dependent regulator of chromatin subfamily E member 1 (SMARCE1) and suppressor of fused homolog(SUFU). (7) Schwannomatosis is mainly composed of Schwann cells, while the cells that comprise NF2include Schwann cells, nerve bundle membrane-like cells, �broblasts and intermediate cells. (8) Nerve �bersoften pass through NF2 masses but not through those seen in schwannomatosis. (9) Schwannomatosis-associated schwannomas tend to exhibit greater peripheral edema, and the myxoid change in the focusshows T2 high signal. Moreover, the range of minimum apparent diffusion coe�cient (ADC) values is 0.8–2.7 in NF2, 0.3–2.2 in schwannomatosis[4].
3.4Treatment and prognosis
Surgical resection is the most reliable treatment for schwannomatosis. Ten of our 12 patients underwentsurgery. The other two declined the operation after communication with us because they had too manytumors and surgery would have been di�cult.
3.5 Study limitations
The limitations of this study were as follows: (1) This was a retrospective study with a small number ofcases. Because some of the diagnoses were con�rmed at an early age and/or before the new diagnosticstandard came into being[26], not all of the patients underwent lztr1 and smarcb1 gene examination forclinical diagnosis. We cannot guarantee that any of the patients with schwannomatosis did not also havemosaic NF2. Some patients with mosaic NF2 will be included in this diagnosis when they are at a young age.Some patients with schwannomatosis might have unilateral vestibular schwannoma. (2) These patients didnot have 3-mm thin slice scans or whole-body MRI examinations, and it is not excluded that some masseswere not found in some areas without scanning. (3) It was di�cult for some patients to con�rm their familyhistories or for us to obtain samples from their family members for genetic analysis. (4) We did not compare
Page 13/18
the imaging characteristics seen in this study with those of NF2. (5) Because treatment plan and e�cacyevaluation were not the focus of this study, no corresponding discussion and case follow-up analysis wasconducted.
DeclarationsData Availability Statement Some or all data, models, or code generated or used during the study areavailable from the corresponding author by request. ([email protected]).
Author contributions Cheng-wei Kang Responsible for research design, literature review, statistical analysis,and article writing Chang-chao Dong, Gang Tan, Zhao-kui Yan, Xiao-ping Pu Collect and sort out relevantoriginal data Li-xue Wu Pathological sections and immunohistochemical staining Jiang Shen Analysis ofimaging characteristics Lei Liu Responsible for the revision of articles.
Funding Not applicable.
Compliance with ethical standards
Con�ict of interest We declare that we have no �nancial and personal relationships with other people ororganizations that can inappropriately in�uence our work, there is no professional or other personal interestof any nature or kind in any product, service, and/or company that could be construed as in�uencing theposition presented in this article.
References1. Evans DG, Bowers NL, Tobi S et al (2018) Schwannomatosis: a genetic and epidemiological study. J
Neurol Neurosurg Psychiatry 89(11):1215–1219
2. Antinheimo J, Sankila R, Carpén O, Pukkala E, Sainio M, Jääskeläinen J (2000) Population-basedanalysis of sporadic and type 2 neuro�bromatosis-associated meningiomas and schwannomas.Neurology 54(1):71–76
3. Merker VL, Esparza S, Smith MJ, Stemmer-Rachamimov A, Plotkin SR (2012) Clinical features ofschwannomatosis: a retrospective analysis of 87 patients. Oncologist 17(10):1317–1322
4. Ahlawat S, Blakeley JO, Langmead S, Belzberg AJ, Fayad LM (2020) Current status andrecommendations for imaging in neuro�bromatosis type 1, neuro�bromatosis type 2, andschwannomatosis. Skeletal Radiol 49(2):199–219
5. Baser ME, Evans DG, Friedman JM (2006) Increasing the speci�city of diagnostic criteria forschwannomatosis. Neurology: O�cial Journal of the American Academy of Neurology. (5): 730–732
�. Plotkin SR, Blakeley JO, Evans DG et al (2013) Update from the 2011 International SchwannomatosisWorkshop: From genetics to diagnostic criteria. Am J Med Genet A 161A(3):405–416
7. Kehrer-Sawatzki H, Farschtschi S, Mautner VF, Cooper DN (2017) The molecular pathogenesis ofschwannomatosis, a paradigm for the co-involvement of multiple tumour suppressor genes intumorigenesis. Hum Genet 136(2):129–148
Page 14/18
�. Deiller C, Van-Gils J, Zordan C et al (2019) Coexistence of schwannomatosis and glioblastoma in twofamilies. Eur J Med Genet 62(8):103680
9. Paganini I, Chang VY, Capone GL et al (2015) Expanding the mutational spectrum of LZTR1 inschwannomatosis. Eur J Hum Genet 23(7):963–968
10. Ding Y, Rong H, Wang Y et al (2019) Detection of Germline Mutations of the SMARCB1 Gene in aChinese Family with Intraspinal Schwannomatosis. World Neurosurg 123:318–322
11. Ostrow KL, Donaldson KJ, Caterina MJ, Belzberg A, Hoke A (2019) The Secretomes of Painful VersusNonpainful Human Schwannomatosis Tumor Cells Differentially In�uence Sensory Neuron GeneExpression and Sensitivity. Sci Rep 9(1):13098
12. Jordan JT, Smith MJ, Walker JA et al (2018) Pain correlates with germline mutation inschwannomatosis. Med (Baltim) 97(5):e9717
13. Mehta GU, Feldman MJ, Wang H, Ding D, Chittiboina P (2016) Unilateral vestibular schwannoma in apatient with schwannomatosis in the absence of LZTR1 mutation. J Neurosurg 125(6):1469–1471
14. Asai K, Tani S, Mineharu Y et al (2015) Familial schwannomatosis with a germline mutation ofSMARCB1 in Japan. Brain Tumor Pathol 32(3):216–220
15. Smith MJ, Kulkarni A, Rustad C et al (2012) Vestibular schwannomas occur in schwannomatosis andshould not be considered an exclusion criterion for clinical diagnosis. Am J Med Genet A 158A(1):215–219
1�. Baruah RK, Bora S, Haque R (2016) Segmental Schwannomatosis of the Spine: Report of a Rare Caseand Brief Review of Literature. Ortop Traumatol Rehabil 18(1):73–78
17. Radek M, Tomasik B, Wojdyn M, Snopkowska-Wiaderna D, Błaszczyk M, Radek A (2016)Neuro�bromatosis type 2 (NF 2) or schwannomatosis?--Case report study and diagnostic criteria. NeurolNeurochir Pol 50(3):219–225
1�. Ostrow KL, Donaldson K, Blakeley J, Belzberg A, Hoke A (2015) Immortalized Human Schwann CellLines Derived From Tumors of Schwannomatosis Patients. PLoS One 10(12):e0144620
19. Caltabiano R, Magro G, Polizzi A et al (2017) A mosaic pattern of INI1/SMARCB1 protein expressiondistinguishes Schwannomatosis and NF2-associated peripheral schwannomas from solitary peripheralschwannomas and NF2-associated vestibular schwannomas. Childs Nerv Syst 33(6):933–940
20. Godel T, Mautner VF, Farschtschi S et al (2018) Dorsal root ganglia volume differentiatesschwannomatosis and neuro�bromatosis 2. Ann Neurol 83(4):854–857
21. Morshed RA, Lee AT, Lee YM, Chin CT, Jacques L (2019) Schwannomatosis of the Spinal AccessoryNerve: A Case Report. J Brachial Plex Peripher Nerve Inj 14(1):e9–e13
22. Lieber B, Han B, Allen J et al (2016) Utility of positron emission tomography in schwannomatosis. J ClinNeurosci 30:138–140
23. MacCollin M, Chiocca EA, Evans DG et al (2005) Diagnostic criteria for schwannomatosis. Neurology64(11):1838–1845
24. Farschtschi SC, Kluwe L, Schön G et al (2020) Distinctive low epidermal nerve �ber density inschwannomatosis patients provides a major parameter for diagnosis and differential diagnosis. BrainPathol 30(2):386–391
Page 15/18
25. Louvrier C, Pasmant E, Briand-Suleau A et al (2018) Targeted next-generation sequencing for differentialdiagnosis of neuro�bromatosis type 2, schwannomatosis, and meningiomatosis. Neuro Oncol20(7):917–929
2�. Kehrer-Sawatzki H, Farschtschi S, Mautner VF, Cooper DN. The molecular pathogenesis ofschwannomatosis, a paradigm for the co-involvement of multiple tumour suppressor genes intumorigenesis. Hum Genet. 136(2): 129–148
Figures
Figure 1
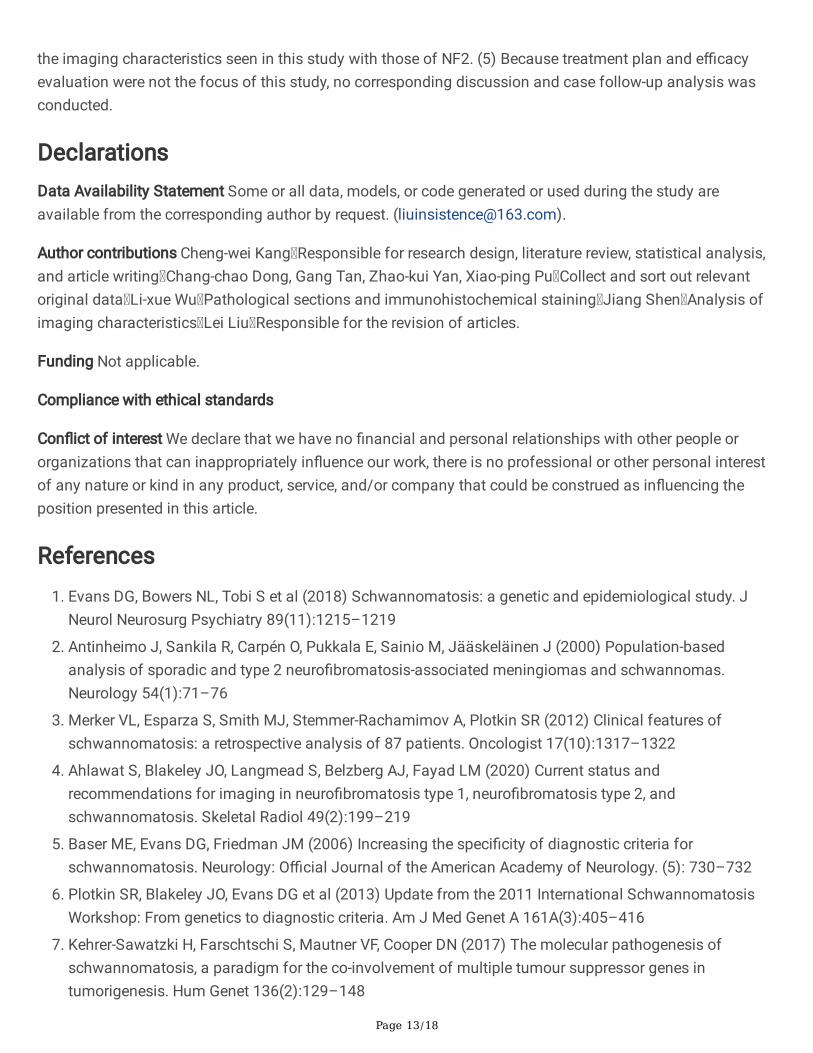
A Left neck mass. Yellow arrow: capsule is complete; Green arrow: Inhomogeneous internal echo. B Left neckmass. Yellow arrow: blood vessels in the mass. CDFI: Small amount of blood �ow signal. C Left thigh mass.CDFI: medium �ow signal. D Left thigh mass. CDFI: multiple blood �ow signals.

Page 16/18
Figure 2
A Left-thigh mass. Plain CT value: 29 HU. Red arrow: clear and complete capsule. Yellow arrow: CT value ofthe mass on the plain scan. B Left-thigh mass. Arterial-phase CT value: 55 HU. Blue arrow: companionvessel; green arrow: small amount of cystic area. C Mass in left midthigh. Plain CT value: 22 HU. D Mass inleft midthigh. Yellow arrow: ring enhancement of the mass. Enhancement CT value of edge: 70 HU. Internalenhancement not obvious. Blue arrow: central enhancement of the mass.
Page 17/18
Figure 3
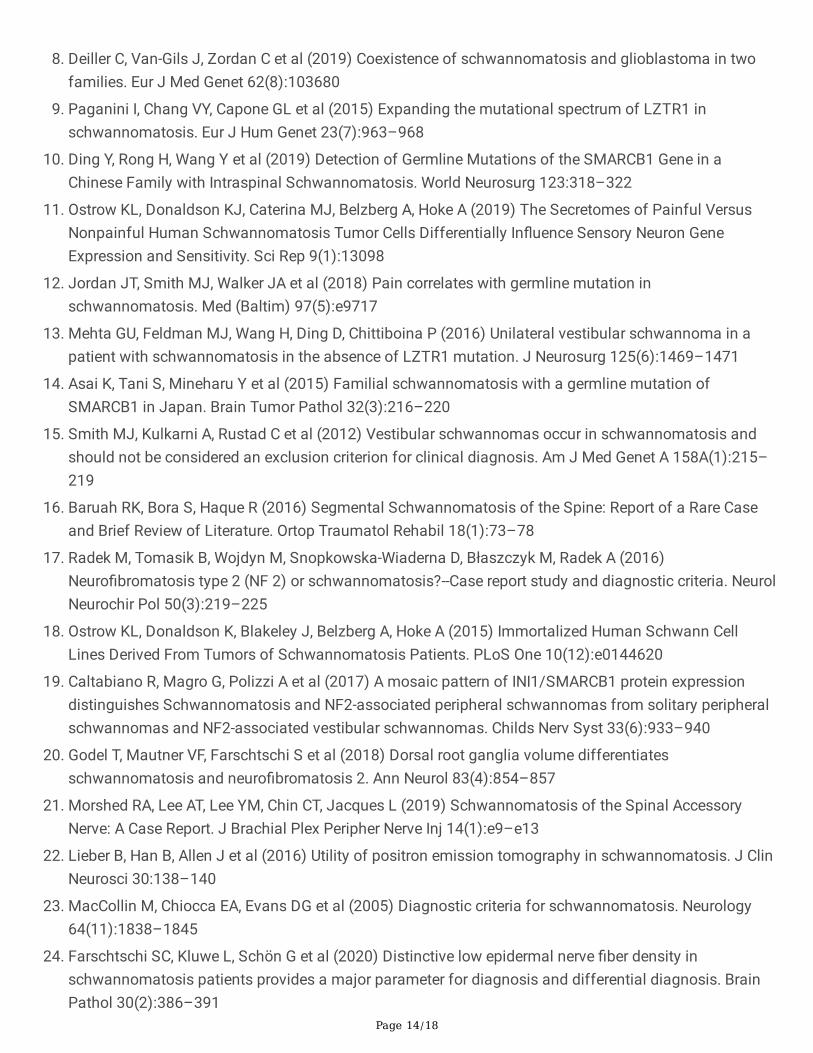
A Left neck mass. Yellow arrows: clear boundary, distributed along the brachial plexus. Blue-circled areas: themass is connected with the spinal canal. B Pleural mass along the intercostal nerve, as shown by the yellowarrow. C Lumbar spinal-canal mass. Yellow arrows: along the cauda equina nerve. D ORIG WATER: OCorIDEAL MRI sequence to observe the masses in the left thigh.

Page 18/18
Figure 4
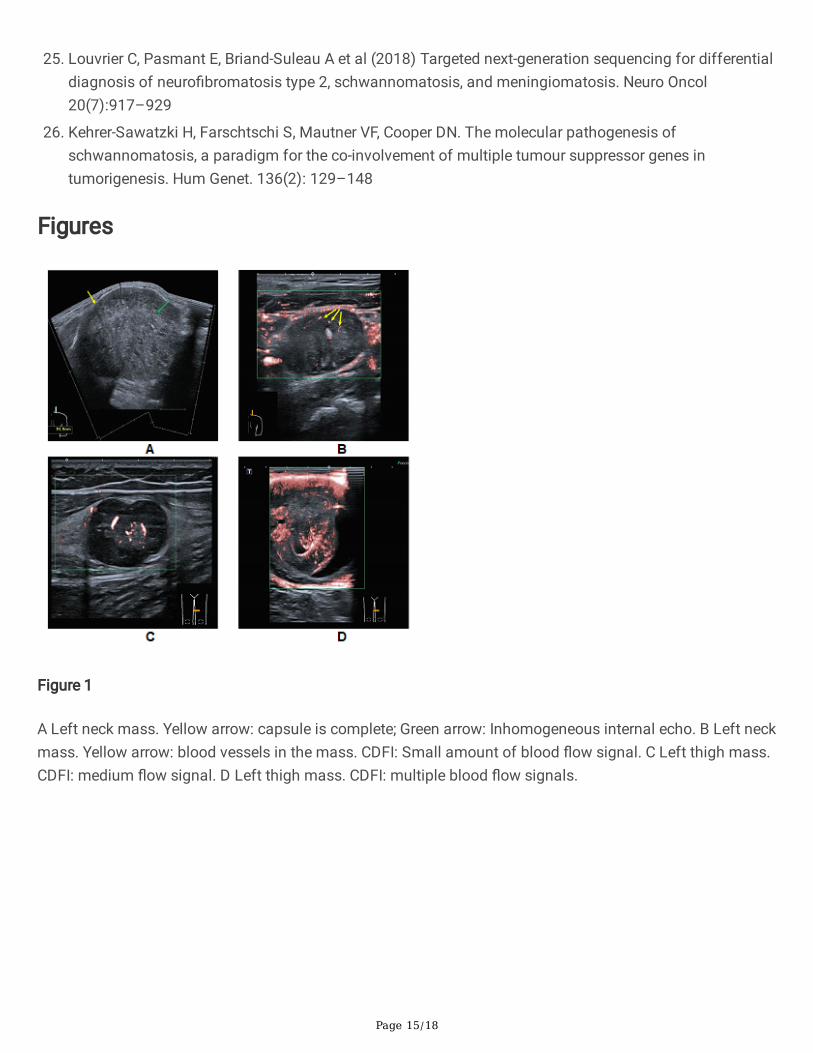
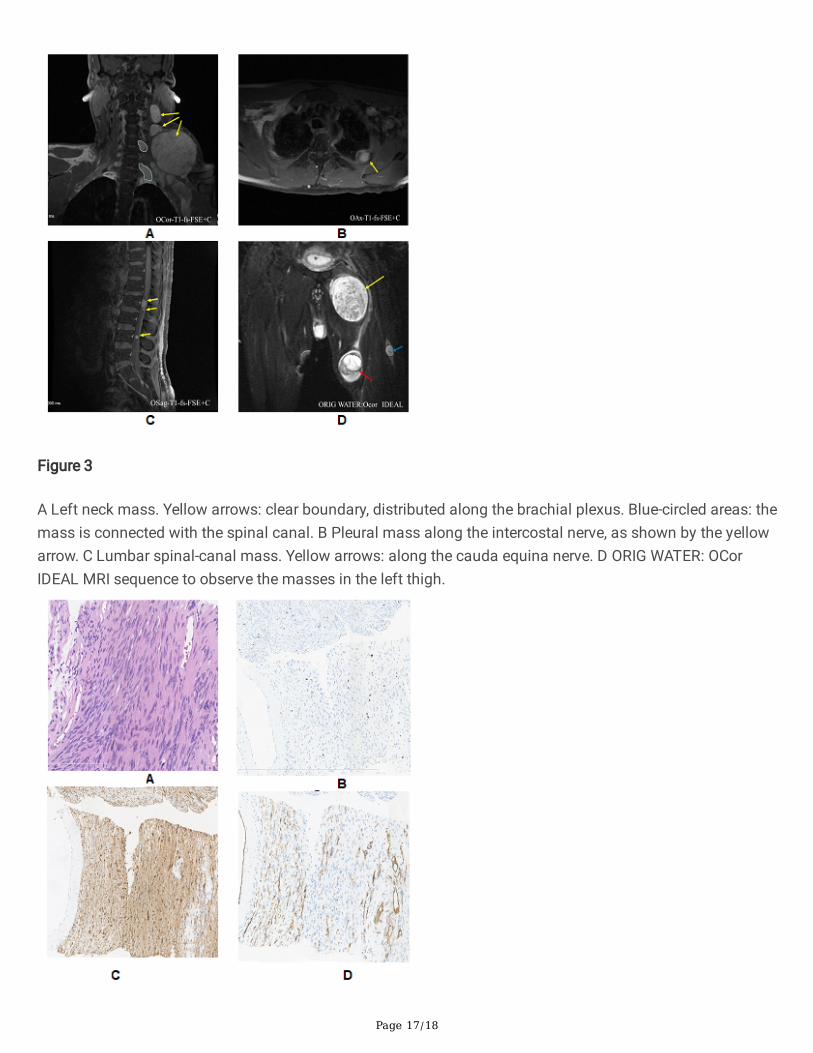
Left neck mass A HE-200× Mainly Antoni A area with peripheral Antoni B area B MIB1-100× Positiveexpression of MIB-1 was 5% C S100-100× Positive expression of S100 D CD34-100× Positive expression ofCD34