case study discrete-event simulation applied to a
TRANSCRIPT

CASE STUDY
Financial support: None. Conflict of interest: The authors have no conflict of interest to declare. Corresponding author: [email protected] Received: 18 Aug 2020. Approved: 8 Dec 2020. Editor: Julio Vieira Neto and Osvaldo L. G. Quelhas.
This is an Open Access article distributed under the terms of the Creative Commons Attribution License, which permits unrestricted use, distribution, and reproduction in any medium, provided the original work is properly cited.
Brazilian Journal of Operations & Production Management, Vol. 18, No. 1, e20211076, 2021 | https://doi.org/10.14488/BJOPM.2021.012 1/20
Discrete-event simulation applied to a radiotherapy process: a case study of a cancer center Douglas Moura Miranda1, Mariana Pedrini Moura Miranda2 1Federal University of Mineiro Triangle, Department of Production Engineering, Uberaba, MG, Brazil. 2Hélio Angotti Hospital, Department of Radiotherapy, Uberaba, MG, Brazil.
How to cite: Miranda, D.M. and Miranda, M.P.M. (2021), “Discrete-event simulation applied to a radiotherapy process: a case study of a cancer center”, Brazilian Journal of Operations & Production Management, Vol. 18, No. 1, e20211076. https://doi.org/10.14488/BJOPM.2021.012
ABSTRACT
Goal: This research aims to investigate how to maximize the throughput and reduce the waiting time for oncological patients of a radiotherapy process. Design / Methodology / Approach: A case study was conducted to develop a simulation model integrated with optimization techniques, including an expert system to support everyday decision making in the operation. Results: The experiments demonstrated that the approach was able to identify better configurations of the process, improving productivity without deteriorating quality. Results also considered the future acquisition of a new linear accelerator allowing the operation to plan its ramp up accordingly. Another result is the devised tool to allow the operation to run its own simulation studies. Limitations of the investigation: The results are valid for processes with similar characteristics of the one studied in the present paper, closing the scope at the treatment stage. Practical implications: This work demonstrates the possibility of applying modern simulation techniques in radiotherapy, not only enabling improvements for the present situation but also integrating the model to the operation to support everyday decision making. Originality / Value: The number of details captured by the model is significantly higher than others studies. The integration of the methodology to the treatment process makes possible for the operation to continue benefiting from the model in a long term.
Keywords: Discrete Event Simulation; Radiotherapy; Scheduling; Optimization; Cancer Clinics.
1. INTRODUCTION AND BACKGROUND More than 14 million new cases of cancer are diagnosed globally each year, and among
other types of treatment, radiotherapy (radiation therapy) has the potential to improve the rates of cure of 3.5 million people and provide palliative relief for an additional 3.5 million people (Jaffray and Gospodarowicz, 2015). The patient waiting time from the point of referral to the point of starting treatment is a major concern considering its relationship with the patient's overall survival and quality of life. In this context, there have been studies in the literature applying Operational Research techniques such as discrete event simulation techniques (DES) to find ways of reducing patient waiting time.
Radiotherapy is a treatment that uses radiation to destroy or prevent the growth of tumor cells, control bleeding and pain, and reduce tumors that are compressing other organs. It is a treatment modality that uses ionizing radiation to eliminate the abnormal cells of a tumor or,

Discrete-event simulation applied to a radiotherapy process: a case study of a cancer center
Brazilian Journal of Operations & Production Management, Vol. 18, No. 1, e20211076, 2021 2/20
at least, to prevent its proliferation. During radiation therapy, some normal cells can also be damaged, but in this type of treatment, normal cells have a better ability to recover from radiation damage. External-beam radiation therapy is the most common type of treatment where a linear accelerator machine (linac) is used to aim high-energy rays at the tumor from outside of the body.
Zubizarreta et al. (2017) report that the actual coverage of needs to provide full access to radiotherapy globally ranges from 34% in Africa to over 92% in Europe. There are more than 7500 radiotherapy centers worldwide, and over 7000 additional centers needed which is evidence that maximizing the throughput of the existent centers has a great social and economic appeal, especially to developing countries where high gaps are found.
In this context, this paper proposes a discrete-event simulation model for the treatment stage of a local radiotherapy center in Brazil. The objective is to understand through simulation and optimization techniques the relationship of the variables that impact the throughput and, consequently, the waiting time of the patients.
The main contributions of this paper are: 1. A higher number of details captured by the modeling of the treatment stage when
compared with the related literature. 2. The utilization of optimization techniques with simulation to better evaluate the process. 3. The development of an expert system for the operation to support everyday decision
making. Our literature review showed that a vast majority of papers modeling radiotherapy
processes focus on modeling the whole process, which is a plausible attempt because it may provide insights about issues in any part of the process. On the minus side, we have identified flaws in these models that potentially affect their validity and reliability. Among many reasons, we quote the lack of precise data to properly represent the behavior of all steps (for instance, the duration time of all tasks and doctors’ shifts) and the lack of a rigorous statistical analysis both regarding the input and output data. By closing the scope in the treatment stage, we favor to capture in details all the nuances of the operation, not only analyzing the current situation and possible scenarios but also building a friendly tool that stays in the operation for its day-to-day routine, reinforcing the legacy of the present work.
The paper is structured as follows. We give a literature review in Section 2 specifically related to radiotherapy, followed by the description of the simulation model in Section 3. Next, in Section 4, we present experiments and results regarding the validity of the model, tested scenarios, variables relationship, and optimization. We also explain the expert system built for the operation. Finally, the main findings and conclusions are highlighted in Section 5.
2. LITERATURE REVIEW Operational Research and Production & Management techniques have been largely applied to
hospitals operations (Chang Junior et al., 2019). In radiotherapy, simulation techniques have been applied over the years and the related literature is listed in Table 1 showing a classification based on the problem characteristics and situating this paper in the literature.
Table 1 presents five categories where the first identifies the simulation technique used to model the process: DES (Discrete Event Simulation), SD (System Dynamics), MCS (Monte Carlo Simulation). The second category refers to the platform or software used to apply the simulation technique. The third category gives information about the scope of the studies where it is found that most of them (9 out of 16) approaches the whole radiotherapy process comprising the planning and treatment stages. Four papers are tackling the planning stage that includes the steps preceding the execution of the treatment as mentioned in Section 1. There are also studies approaching specific steps of the process: consultation step by Joustra et al. (2010), quality assurance by Pooya et al. (2014) targeting the verification points of the process, and the treatment stage by the current paper.
The fourth category refers to the main output metrics used by the authors to assess different scenarios of the process, where 11 studies used directly the RTTT emphasizing their

Discrete-event simulation applied to a radiotherapy process: a case study of a cancer center
Brazilian Journal of Operations & Production Management, Vol. 18, No. 1, e20211076, 2021 3/20
concern with the patient waiting time to start radiotherapy sessions. The other studies focus on metrics that assess one specific part of the process but still related to the RTTT. Joustra et al. (2010) use the waiting time for the first consultant, and naturally, the longer it is, the longer it takes for the patient to start treating. Analogously, Pooya et al. (2014) study the time interval between incidents (TIBI) which is directly related to the RTTT. Also, the current paper by proposing solutions to maximize the throughput of the treatment stage contributing then to the reduction of the RTTT.
Table 1: Literature classification based on the study characteristics
Reference Technique Platform Scope Main outputs Main variables Munro and
Potter (1994) MCS Excel
planning & treatment
RTTT demand
Thomas et al. (2001)
MCS C++ planning & treatment
RTTT demand; machine quantity
Thomas (2003) MCS C++ planning & treatment
RTTT demand; machine quantity
Proctor et al. (2007)
DES Simul8 planning & treatment
RTTT demand, # oncologists, #
technicians, # other resources Kapamara et al.
(2007) DES Simul8
planning & treatment
RTTT demand, # oncologists, #
technicians, # other resources Werker et al.
(2009) DES Arena planning planning time
capacity; # resources (therapists; physicists)
Joustra et al. (2010)
DES not
mentioned consultation first consultant time
# consultations; # regular and urgent patients
Morgan et al. (2011)
DES & SD not
mentioned planning & treatment
RTTT # oncologists, # technicians, #
other resources Oddiraju and Mutic (2011)
DES Arena planning RTTT incident stage; demand
Pooya et al. (2014)
DES Arena quality
assurance TIBI; throughput incident stage
Morgan et al. (2016)
DES & SD not
mentioned planning & treatment
RTTT # oncologists, # technicians, #
other resources Babashov et al.
(2017) DES Simul8
planning & treatment
RTTT # oncologists, # technicians, #
other resources Saberi and
Awasthi (2019) DES Arena
planning & treatment
RTTT # oncologists, # technicians, #
other resources Vieira et al.
(2019). DES
Siemens PLM
planning RTTT # patients; push/pull
scheduling Bauza and Chow
(2019). MCS Matlab planning workload balance
physicist on call schedule
Current paper DES Arena treatment treatment waiting time; throughput
scheduling; # technicians; demand; slot length for
treatment
Finally, the last category of Table 1 lists the main variables used in the experiments in which values have been changed to study their impact on the output variables. The level of demand (number of patients) and the number of resources such as therapists, physicians, technicians, and linacs are the most common variables studied.
Among more recent papers, Morgan et al. (2016) give a valuable contribution by studding how SD can be used to support the DES model. While the SD model captures the dynamics of how the radiotherapy department responds to increasing referral to first treatment times, the DES model was used to provide more representative insights into the knock-on impact of altering the treatment time or the number of treatment fractions for different groups of patients.

Discrete-event simulation applied to a radiotherapy process: a case study of a cancer center
Brazilian Journal of Operations & Production Management, Vol. 18, No. 1, e20211076, 2021 4/20
Babashov et al. (2017) analyzed the radiotherapy planning process at the London Regional Cancer Program to determine the bottlenecks and to quantify the effect of specific resource levels with the goal of reducing waiting times. It was found that increasing the number of dosimetrists by one, reduced the mean RTTT by 6.55%, leading to 84.92% of patients being treated within the 14-calendar day target. Adding one more oncologist decreased the mean RTTT from 10.83 to 10.55 days, whereas a 15% increase in arriving patients increased the waiting time by 22.53%.
Saberi and Awasthi (2019) is an extension of Werker et al. (2009) providing a broader view of the process. They suggest including palliative and radical priority patients at the beginning of the process helps to start the process treatment sooner for the patients who are palliative and close to the highest stages of cancer.
Vieira et al. (2019) study the planning stage, especially the effect of two scheduling policies for the first irradiation session: pull strategy and push strategy. In the first strategy, the first session is set right after consultation; in the second, it is set after the planning stage has been completed. Results showed that increasing the pull strategy reduces the average number of patients starting treatment after their due date.
Bauza and Chow (2019) applied Monte Carlo Simulation to study a specific variation of the problem that refers to the emergency radiotherapy in a cancer center. The objective was to improve the scheduling of the physicists by maximizing the workload generating fairer planning among the physicists.
The literature review has also identified significant limitations in these works. Morgan et al. (2016) does not provide details of the simulation model and the software used to run the simulation. The input data is not listed, as well as the data collection method, and task times are estimated by interviews. Babashov et al. (2017) provide few details of the simulations model, using descriptive statistics but without the support of inferential statistical analyses such as hypothesis tests and regressions. According to the authors, because task times were not available through the tracking database, the staff was interviewed to estimate the duration of several tasks. Additionally, other data estimates were obtained through model calibration. Saberi and Awasthi (2019) utilize triangular distributions for many input data which suggests that these data are estimated from interviews. Experiments report results from only three replications, and no hypothesis test has been provided to validate the model. An optimization problem is solved with no justification for the objectives and constraints.
From the aforementioned, the inattention to the application of the best simulation practices may affect the validity and reliability of the studies. It is expected to properly list the input data of the model as well as the probability distributions functions used to approximate the random variables supported by a goodness of fit statistical test. The model should be validated by using proper statistical tests as well as the number of replications used in the experiments. Whenever possible, time studies should be preferable over interviews. The attention to points like these is one difference between our paper and others.
Another difference is that the current paper closes the scope on the treatment stage, capturing details of the operation such as the existence of unscheduled patients; patient absences; dropouts; scheduling; queue policies, and many others; improving the representativity of the model when emulating the real system. An optimization with simulation model is solved to study scenarios that a human would unlikely think by himself. We also build a friendly tool that has been used by the operation, cementing the legacy of the present work.
3. SIMULATION MODEL
This section describes the developed discrete-event simulation model. The modeling consists of firstly developing a conceptual model through an Activity Cycle Diagram (ACD), flowchart, and causal diagram. Next, we describe the data collection process, statistical treatment, and modeling of the input data; and finally, the development of the computational model used to carry out the experiments.
Discrete-event simulation applied to a radiotherapy process: a case study of a cancer center
Brazilian Journal of Operations & Production Management, Vol. 18, No. 1, e20211076, 2021 5/20
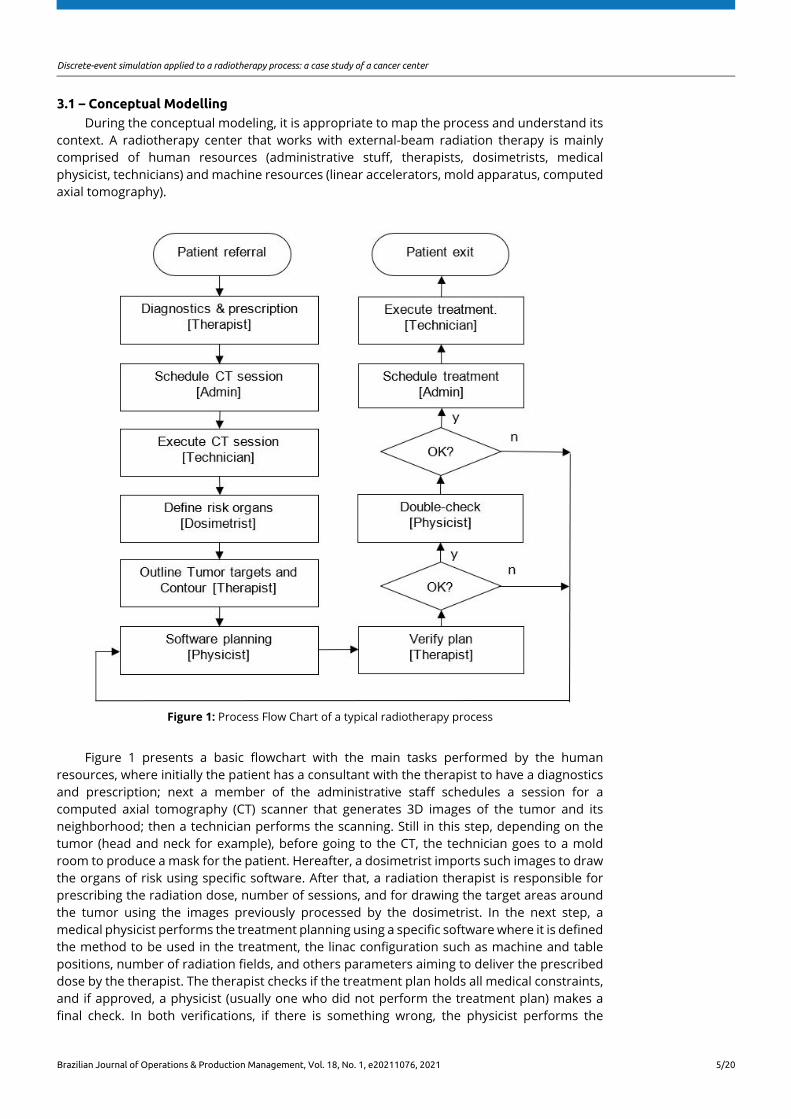
3.1 – Conceptual Modelling During the conceptual modeling, it is appropriate to map the process and understand its
context. A radiotherapy center that works with external-beam radiation therapy is mainly comprised of human resources (administrative stuff, therapists, dosimetrists, medical physicist, technicians) and machine resources (linear accelerators, mold apparatus, computed axial tomography).
Figure 1: Process Flow Chart of a typical radiotherapy process
Figure 1 presents a basic flowchart with the main tasks performed by the human resources, where initially the patient has a consultant with the therapist to have a diagnostics and prescription; next a member of the administrative staff schedules a session for a computed axial tomography (CT) scanner that generates 3D images of the tumor and its neighborhood; then a technician performs the scanning. Still in this step, depending on the tumor (head and neck for example), before going to the CT, the technician goes to a mold room to produce a mask for the patient. Hereafter, a dosimetrist imports such images to draw the organs of risk using specific software. After that, a radiation therapist is responsible for prescribing the radiation dose, number of sessions, and for drawing the target areas around the tumor using the images previously processed by the dosimetrist. In the next step, a medical physicist performs the treatment planning using a specific software where it is defined the method to be used in the treatment, the linac configuration such as machine and table positions, number of radiation fields, and others parameters aiming to deliver the prescribed dose by the therapist. The therapist checks if the treatment plan holds all medical constraints, and if approved, a physicist (usually one who did not perform the treatment plan) makes a final check. In both verifications, if there is something wrong, the physicist performs the
Discrete-event simulation applied to a radiotherapy process: a case study of a cancer center
Brazilian Journal of Operations & Production Management, Vol. 18, No. 1, e20211076, 2021 6/20
necessary adjustments. Finally, the administrative staff can schedule the treatment sessions that are performed by the technicians using a linear accelerator.
A typical performance metric of the process is the elapsed time from the patient referral until the first session of treatment, and sometimes this metric is referred to as ready-to-treat to treatment (RTTT) à la Babashov et al., 2017. It is common to split the process into two stages: planning and treatment, where the first refers to all steps preceding the execution of the treatment, and the second the treatment itself.
Differently from the first stage, the treatment stage is repeated many times over the days for the same patient. The treatment is comprised of fractions, where a fraction is the base unit of treatment during a visit to the radiotherapy department, delivered at daily intervals. A phase of radiotherapy treatment comprises several treatment fractions and a single course of treatment is designed around a single treatment regime of one or more phases, requiring one or more treatment plans to be created by the therapist and physician. Note that the complexity of these plans can vary for the different cancer types and the characteristics of the patient’s disease (Morgan et al.,2016).
Because the treatment stage is a repetitive task, where it is common to have a plan lasting more than 20 sessions, it usually has the largest number of employees, in this case, technicians. It also utilizes the linear accelerator which is the most expensive resource of external-beam radiation therapy. Because of the high volume of sessions, this operation must work with high productivity levels, otherwise it becomes a bottleneck of the whole process, affecting the waiting time of the patient (RTTT). These reasons make this stage particularly important, so it is the focus of the present work.
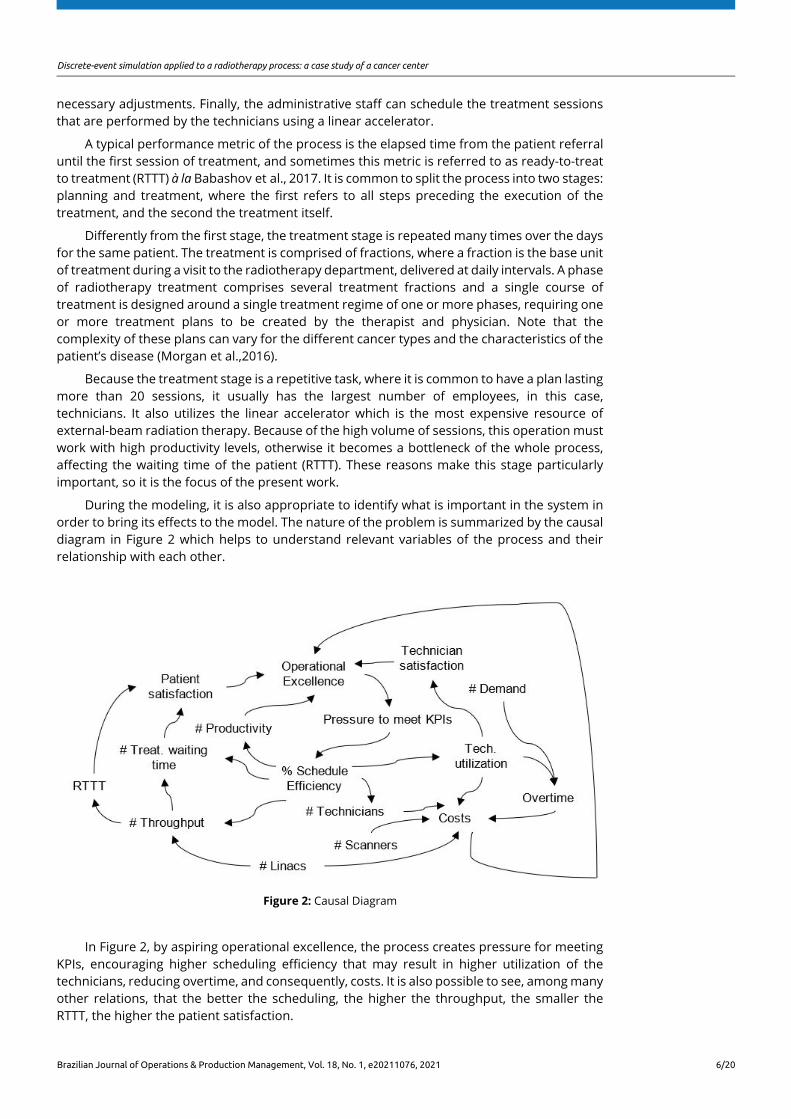
During the modeling, it is also appropriate to identify what is important in the system in order to bring its effects to the model. The nature of the problem is summarized by the causal diagram in Figure 2 which helps to understand relevant variables of the process and their relationship with each other.
Figure 2: Causal Diagram
In Figure 2, by aspiring operational excellence, the process creates pressure for meeting KPIs, encouraging higher scheduling efficiency that may result in higher utilization of the technicians, reducing overtime, and consequently, costs. It is also possible to see, among many other relations, that the better the scheduling, the higher the throughput, the smaller the RTTT, the higher the patient satisfaction.
Discrete-event simulation applied to a radiotherapy process: a case study of a cancer center
Brazilian Journal of Operations & Production Management, Vol. 18, No. 1, e20211076, 2021 7/20
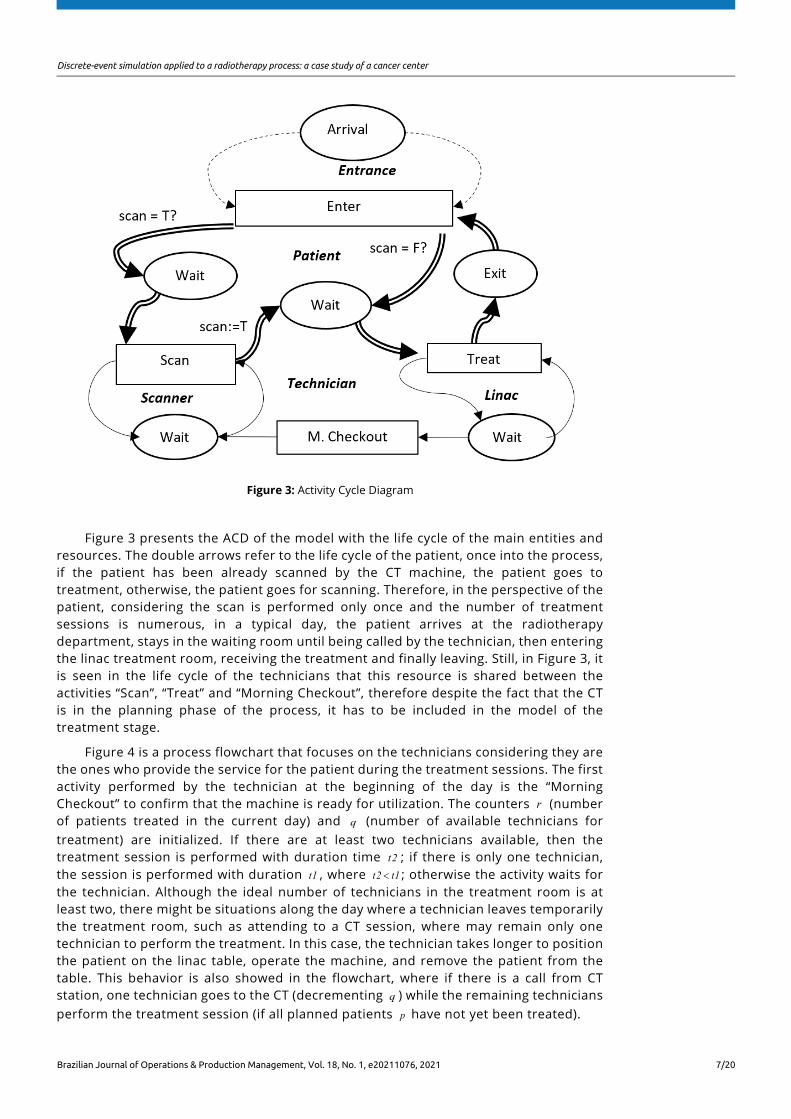
Figure 3: Activity Cycle Diagram
Figure 3 presents the ACD of the model with the life cycle of the main entities and resources. The double arrows refer to the life cycle of the patient, once into the process, if the patient has been already scanned by the CT machine, the patient goes to treatment, otherwise, the patient goes for scanning. Therefore, in the perspective of the patient, considering the scan is performed only once and the number of treatment sessions is numerous, in a typical day, the patient arrives at the radiotherapy department, stays in the waiting room until being called by the technician, then entering the linac treatment room, receiving the treatment and finally leaving. Still, in Figure 3, it is seen in the life cycle of the technicians that this resource is shared between the activities “Scan”, “Treat” and “Morning Checkout”, therefore despite the fact that the CT is in the planning phase of the process, it has to be included in the model of the treatment stage.
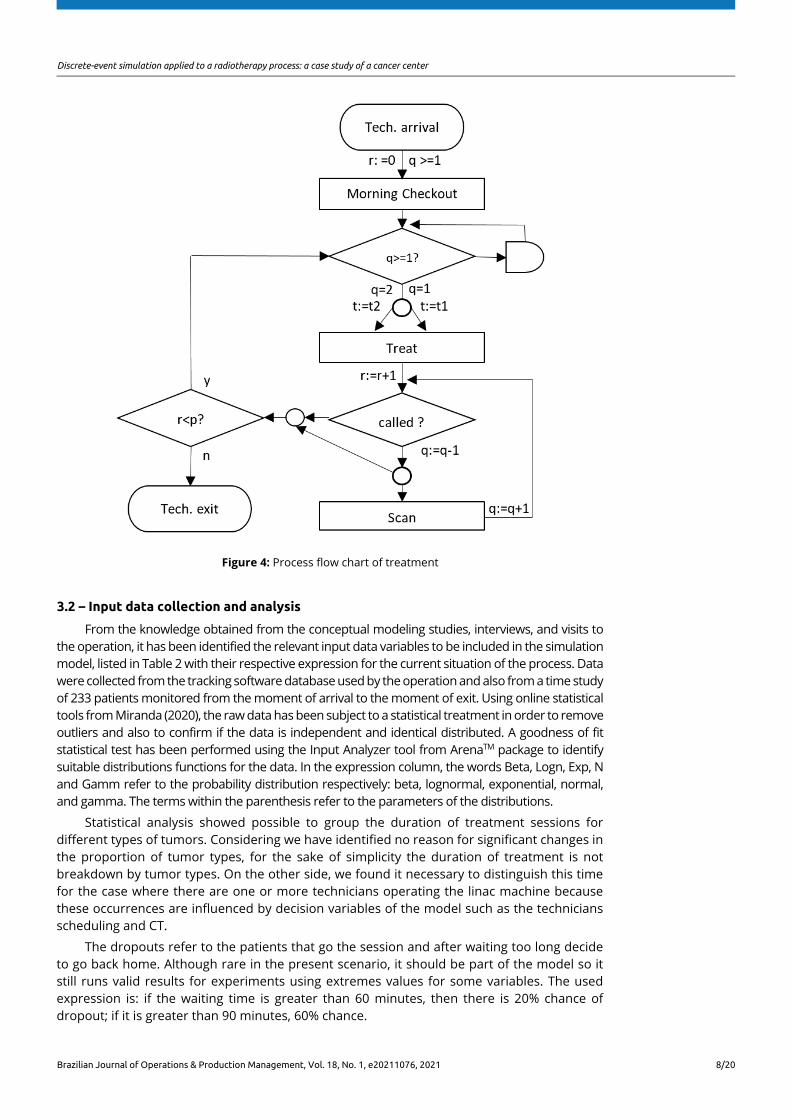
Figure 4 is a process flowchart that focuses on the technicians considering they are the ones who provide the service for the patient during the treatment sessions. The first activity performed by the technician at the beginning of the day is the “Morning Checkout” to confirm that the machine is ready for utilization. The counters r (number of patients treated in the current day) and q (number of available technicians for treatment) are initialized. If there are at least two technicians available, then the treatment session is performed with duration time t2 ; if there is only one technician, the session is performed with duration t1 , where t2 t1< ; otherwise the activity waits for the technician. Although the ideal number of technicians in the treatment room is at least two, there might be situations along the day where a technician leaves temporarily the treatment room, such as attending to a CT session, where may remain only one technician to perform the treatment. In this case, the technician takes longer to position the patient on the linac table, operate the machine, and remove the patient from the table. This behavior is also showed in the flowchart, where if there is a call from CT station, one technician goes to the CT (decrementing q ) while the remaining technicians perform the treatment session (if all planned patients p have not yet been treated).
Discrete-event simulation applied to a radiotherapy process: a case study of a cancer center
Brazilian Journal of Operations & Production Management, Vol. 18, No. 1, e20211076, 2021 8/20
Figure 4: Process flow chart of treatment
3.2 – Input data collection and analysis
From the knowledge obtained from the conceptual modeling studies, interviews, and visits to the operation, it has been identified the relevant input data variables to be included in the simulation model, listed in Table 2 with their respective expression for the current situation of the process. Data were collected from the tracking software database used by the operation and also from a time study of 233 patients monitored from the moment of arrival to the moment of exit. Using online statistical tools from Miranda (2020), the raw data has been subject to a statistical treatment in order to remove outliers and also to confirm if the data is independent and identical distributed. A goodness of fit statistical test has been performed using the Input Analyzer tool from ArenaTM package to identify suitable distributions functions for the data. In the expression column, the words Beta, Logn, Exp, N and Gamm refer to the probability distribution respectively: beta, lognormal, exponential, normal, and gamma. The terms within the parenthesis refer to the parameters of the distributions.
Statistical analysis showed possible to group the duration of treatment sessions for different types of tumors. Considering we have identified no reason for significant changes in the proportion of tumor types, for the sake of simplicity the duration of treatment is not breakdown by tumor types. On the other side, we found it necessary to distinguish this time for the case where there are one or more technicians operating the linac machine because these occurrences are influenced by decision variables of the model such as the technicians scheduling and CT.
The dropouts refer to the patients that go the session and after waiting too long decide to go back home. Although rare in the present scenario, it should be part of the model so it still runs valid results for experiments using extremes values for some variables. The used expression is: if the waiting time is greater than 60 minutes, then there is 20% chance of dropout; if it is greater than 90 minutes, 60% chance.
Discrete-event simulation applied to a radiotherapy process: a case study of a cancer center
Brazilian Journal of Operations & Production Management, Vol. 18, No. 1, e20211076, 2021 9/20
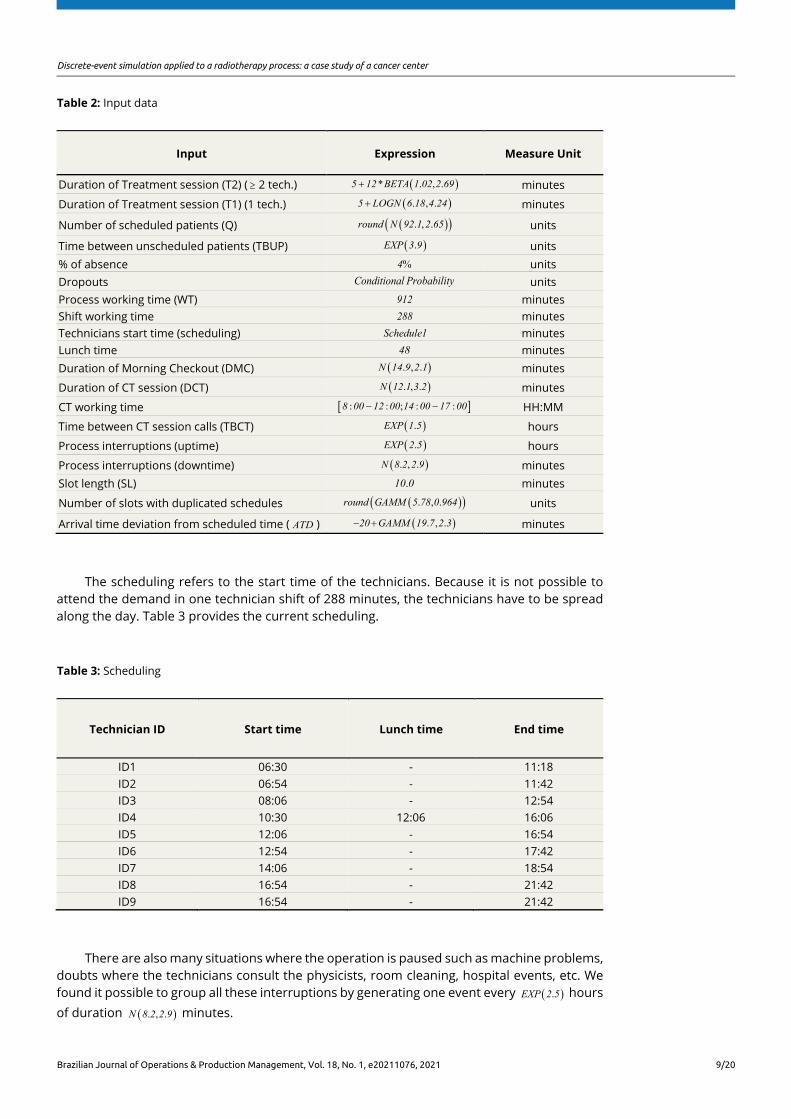
Table 2: Input data
Input Expression Measure Unit
Duration of Treatment session (T2) ( ≥ 2 tech.) ( )* . , .5 12 BETA 1 02 2 69+ minutes
Duration of Treatment session (T1) (1 tech.) ( ) . , .5 LOGN 6 18 4 24+ minutes
Number of scheduled patients (Q) ( )( ). , .round N 92 1 2 65 units
Time between unscheduled patients (TBUP) ( ).EXP 3 9 units
% of absence %4 units Dropouts Conditional Probability units Process working time (WT) 912 minutes Shift working time 288 minutes Technicians start time (scheduling) Schedule1 minutes Lunch time 48 minutes
Duration of Morning Checkout (DMC) ( ). , .N 14 9 2 1 minutes
Duration of CT session (DCT) ( ). , .N 12 1 3 2 minutes
CT working time [ ]: : ; : :8 00 12 00 14 00 17 00− − HH:MM
Time between CT session calls (TBCT) ( ).EXP 1 5 hours
Process interruptions (uptime) ( ).EXP 2 5 hours
Process interruptions (downtime) ( ). , .N 8 2 2 9 minutes
Slot length (SL) .10 0 minutes
Number of slots with duplicated schedules ( )( ). , .round GAMM 5 78 0 964 units
Arrival time deviation from scheduled time ( ATD ) ( ) . , .20 GAMM 19 7 2 3− + minutes
The scheduling refers to the start time of the technicians. Because it is not possible to attend the demand in one technician shift of 288 minutes, the technicians have to be spread along the day. Table 3 provides the current scheduling.
Table 3: Scheduling
Technician ID Start time Lunch time End time
ID1 06:30 - 11:18 ID2 06:54 - 11:42 ID3 08:06 - 12:54 ID4 10:30 12:06 16:06 ID5 12:06 - 16:54 ID6 12:54 - 17:42 ID7 14:06 - 18:54 ID8 16:54 - 21:42 ID9 16:54 - 21:42
There are also many situations where the operation is paused such as machine problems, doubts where the technicians consult the physicists, room cleaning, hospital events, etc. We found it possible to group all these interruptions by generating one event every ( ).EXP 2 5 hours of duration ( ). , .N 8 2 2 9 minutes.

Discrete-event simulation applied to a radiotherapy process: a case study of a cancer center
Brazilian Journal of Operations & Production Management, Vol. 18, No. 1, e20211076, 2021 10/20
3.3 – Computational model
The computational model is presented in Figure 5 and Figure 6. It was implemented using the commercial simulation software ArenaTM, on a desktop computer with two IntelTM Core processors i7TM3, 1GHz with 8GB of RAM and WindowsTM 10 operating system. The model simulates workday events of the treatment stage, where the patients are the entities that flow through the system, and the technicians, linac and CT are the resources.
For the sake of organization, we have labeled the modules of the model by row and column to facilitate references in Figure 5. The main attributes of the entity “patient” are: arrival time, start time of treatment, scheduled time, treatment time, patient delay, process delay, process anticipation.
The main flow starts at module R3C1 that generates Q scheduled patients to be treated at the day. Next, in R3C2, it is assigned the scheduled time of the patients. In R3C3, if the patient is absent (4% probability), it leaves the system (R4C5), otherwise it moves on to R3C4 that imposes a delay to the entity. The entity leaves this module at the time equivalent to the arrival time of the patient in the waiting room of the facility. Note that
( ) ( ) ( ) ,Scheduled Time ST ArrivalTime AT Deviation ATD− = therefore the delay in R3C4 is –AT ST ATD= , where ATD is the random variable listed in Table 2. This is important because the patient can arrive before or after the scheduled time impacting the queue order when called by the technicians. That is the reason we don’t simply use the time between arrivals but the deviation from the scheduled time. Following, the arrival time is captured in R3C5. Next, R3C6 seizes the resources “technicians” and “linac”, with queue policy of type “Lowest Attribute Value” for the attribute “arrival time”. By doing so, the patients that already arrived in the waiting room are ordered by scheduled time, allowing to properly calculate the waiting time of the patient.
Figure 5: Computational model
In R5C1, if the patient is not late, it goes to R5C2 where the attribute “process delay” is computed by the expression: ( ) ( ) ( ) ( )( )*( ) *TNOW ST TNOW ST 0 0 TNOW ST 0− − > + − ≤ where TNOW
refers to the simulation time the entity entered into the module. Otherwise, it goes to R6C3, where the attribute “patient delay” is computed by the expression: AT ST− . Module

Discrete-event simulation applied to a radiotherapy process: a case study of a cancer center
Brazilian Journal of Operations & Production Management, Vol. 18, No. 1, e20211076, 2021 11/20
R5C2 assigns value TNOW for the attribute “start time of treatment” and the attribute “process anticipation” is updated with value: ( ) ( ) ( ) ( )( )*( ) * .ST TNOW ST TNOW 0 0 ST TNOW 0− − > + − ≤
In module R6C4, if the entity refers to a patient dropout, it goes to R7C5 (read & write module) that writes into an Excel file statistics of the entity and after that the entity leaves the system. Otherwise, it goes to R5C4 (delay-release module) that delays the resources “technicians” and “linac” by T1 or T 2 minutes and releases them. Module R5C5 writes into an Excel file attributes values of the entity, R6C5 updates auxiliary variables such as the time of the last patient, and finally, the entity leaves the system.
Another flow is started in R2C1 that generates entities related to the patients scheduled in slots already busy. This is a practice of the operation where, for example, instead of reducing the slot length to have more slots for scheduling, they double schedule one slot a certain number of slots. R2C2 assigns the schedule time picking a slot using a uniform distribution [ ],U a b where a is the completion time of the morning checkout and b is the planned process closing time. There is also a flow starting at R2C3 regarding the unscheduled patients that creates an entity every TBUP hours, and R2C4 assigns the schedule time (value TNOW ) then moving to the main flow. The last flow models the dropout, where R1C3 creates an entity every 1 minute that triggers the “search & remove” module R1C4 that checks the linac queue according to the criteria already explained. If any entity (patient) in the linac queue meets such criteria, the entity is removed from the queue and goes to R2C6 where it receives an attribute dropout true= , it is separated from the flow in R6C4 and its statistics collected in R7C5.
There are other separated modules to create CT call, the activity morning checkout seizing “linac” an “technician”, a VBA module with an algorithm to initialize variables and replicate the logic used by the operation to assign lunch time for the technicians.
4 – EXPERIMENTS AND RESULTS
4.1 – Preliminary experiments and validation
Firstly, preliminary experiments were executed to determine the appropriate number of replications to be used in further experiments. The system is said terminal, where each replication of the model emulates one workday of the operation, with a given start time, including the events and statistics under transient regime. The number of replications has been calculated based on Law et al. (2000) by a rearrange of the confidence interval formula. The results for 10 initial replications, 95% confidence level, for the metrics “exit time of the last patient” ( ET ) and “process delay” (PD), determined 24 replications to be used in the following experiments.
In order to validate the model, we have performed one experiment using the current values of input data of the operation to compare the model output with the real system output for the responses ET and PD . We performed a t-test assuming equal variances to compare the means (after Levene’s test), with 95% confidence level. Table 4 and Figure 6 shows that there are no significant statistical differences for both responses evidencing that the model behavior reflects the real world.
Table 4: Comparison with the real system
ET (model) ET (real system) PD (model) PD (real system)
Mean 871.55 869.42 11.47 12.77 Standard Deviation 16.84 18.65 6.51 6.93
p value− (variance) 0.183 0.540 p value− (mean) 0.810 0.535
Discrete-event simulation applied to a radiotherapy process: a case study of a cancer center
Brazilian Journal of Operations & Production Management, Vol. 18, No. 1, e20211076, 2021 12/20
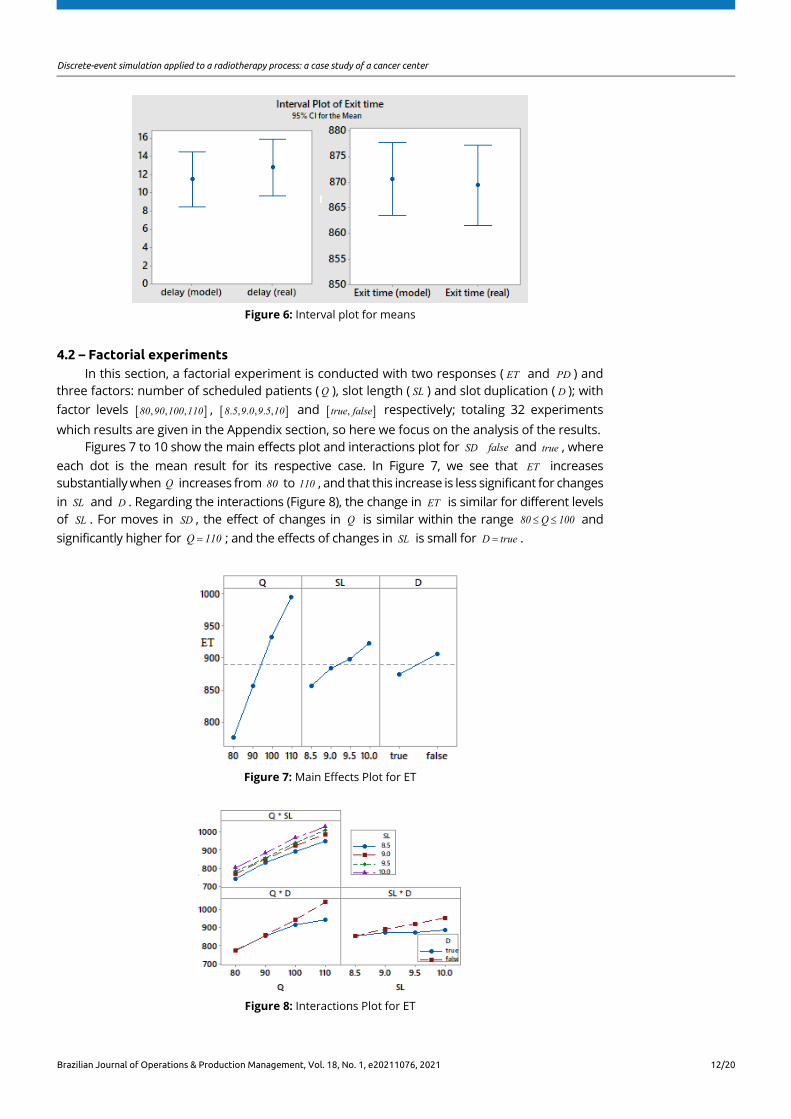
Figure 6: Interval plot for means
4.2 – Factorial experiments In this section, a factorial experiment is conducted with two responses ( ET and PD ) and
three factors: number of scheduled patients ( Q ), slot length ( SL ) and slot duplication ( D ); with factor levels [ ], , ,80 90 100 110 , [ ]. , . , . , 8 5 9 0 9 5 10 and [ ], true false respectively; totaling 32 experiments which results are given in the Appendix section, so here we focus on the analysis of the results.
Figures 7 to 10 show the main effects plot and interactions plot for SD false and true , where each dot is the mean result for its respective case. In Figure 7, we see that ET increases substantially when Q increases from 80 to 110 , and that this increase is less significant for changes in SL and D . Regarding the interactions (Figure 8), the change in ET is similar for different levels of SL . For moves in SD , the effect of changes in Q is similar within the range 80 Q 100≤ ≤ and significantly higher for Q 110= ; and the effects of changes in SL is small for D true= .
Figure 7: Main Effects Plot for ET
Figure 8: Interactions Plot for ET
Discrete-event simulation applied to a radiotherapy process: a case study of a cancer center
Brazilian Journal of Operations & Production Management, Vol. 18, No. 1, e20211076, 2021 13/20
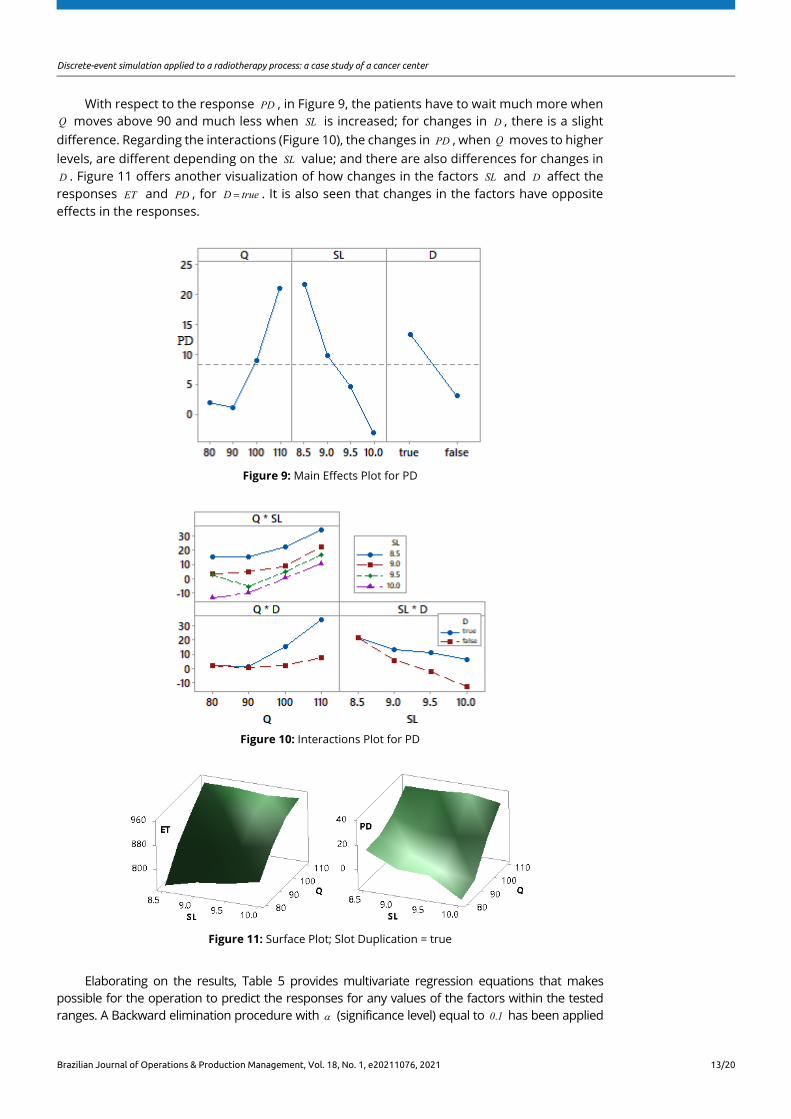
With respect to the response PD , in Figure 9, the patients have to wait much more when Q moves above 90 and much less when SL is increased; for changes in D , there is a slight difference. Regarding the interactions (Figure 10), the changes in PD , when Q moves to higher levels, are different depending on the SL value; and there are also differences for changes in D . Figure 11 offers another visualization of how changes in the factors SL and D affect the responses ET and PD , for D true= . It is also seen that changes in the factors have opposite effects in the responses.
Figure 9: Main Effects Plot for PD
Figure 10: Interactions Plot for PD
Figure 11: Surface Plot; Slot Duplication = true
Elaborating on the results, Table 5 provides multivariate regression equations that makes possible for the operation to predict the responses for any values of the factors within the tested ranges. A Backward elimination procedure with α (significance level) equal to .0 1 has been applied
Discrete-event simulation applied to a radiotherapy process: a case study of a cancer center
Brazilian Journal of Operations & Production Management, Vol. 18, No. 1, e20211076, 2021 14/20
to remove not significant terms. The high values of the adjusted and predicted 2R indicate that the predictors SL and D explain most of the variance in the responses ET and PD ; and because the adjusted and predicted 2R are close, the model does not appear to overfit and has an adequate predictive ability. No issues have been found regarding the residuals.
Table 5: Multivariate Regression
D Regression Equation ( )2R adj ( )2R pred
False . . . *ET 1688 14 56 Q 176 5 SL 2 543Q SL= − − + 98.93% 98.25%
. . . . *2PD 57 1 30Q 19 7 SL 0 01563Q 0 441Q SL=− + + + − 93.75% 86.26%
True . . . . *2ET 2212 43 01Q 148 7 SL 0 1303Q 1 346 Q SL=− + + − − 99.03% 98.83%
. . . . *2PD 963 13 69Q 67 9 SL 0 04800Q 0 614Q SL= − − + + 94.51% 92.40%
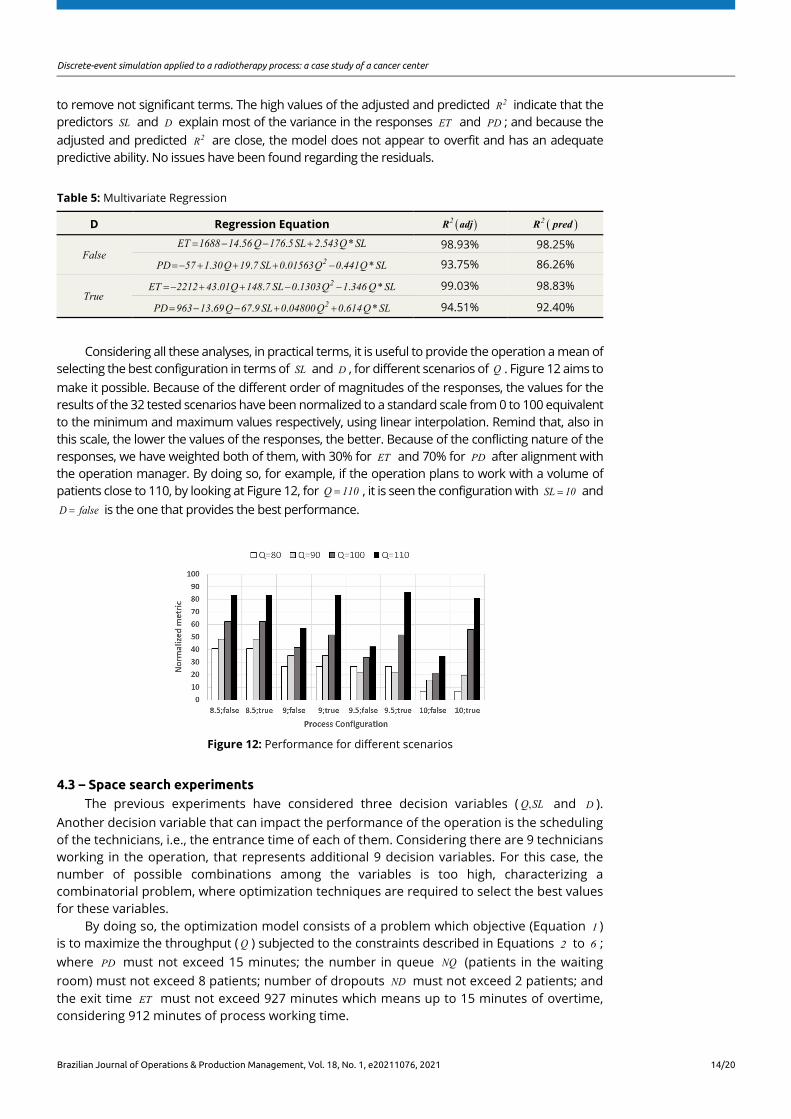
Considering all these analyses, in practical terms, it is useful to provide the operation a mean of selecting the best configuration in terms of SL and D , for different scenarios of Q . Figure 12 aims to make it possible. Because of the different order of magnitudes of the responses, the values for the results of the 32 tested scenarios have been normalized to a standard scale from 0 to 100 equivalent to the minimum and maximum values respectively, using linear interpolation. Remind that, also in this scale, the lower the values of the responses, the better. Because of the conflicting nature of the responses, we have weighted both of them, with 30% for ET and 70% for PD after alignment with the operation manager. By doing so, for example, if the operation plans to work with a volume of patients close to 110, by looking at Figure 12, for Q 110= , it is seen the configuration with SL 10= and D false= is the one that provides the best performance.
Figure 12: Performance for different scenarios
4.3 – Space search experiments The previous experiments have considered three decision variables ( , Q SL and D ).
Another decision variable that can impact the performance of the operation is the scheduling of the technicians, i.e., the entrance time of each of them. Considering there are 9 technicians working in the operation, that represents additional 9 decision variables. For this case, the number of possible combinations among the variables is too high, characterizing a combinatorial problem, where optimization techniques are required to select the best values for these variables.
By doing so, the optimization model consists of a problem which objective (Equation 1 ) is to maximize the throughput ( Q ) subjected to the constraints described in Equations 2 to 6 ; where PD must not exceed 15 minutes; the number in queue NQ (patients in the waiting room) must not exceed 8 patients; number of dropouts ND must not exceed 2 patients; and the exit time ET must not exceed 927 minutes which means up to 15 minutes of overtime, considering 912 minutes of process working time.

Discrete-event simulation applied to a radiotherapy process: a case study of a cancer center
Brazilian Journal of Operations & Production Management, Vol. 18, No. 1, e20211076, 2021 15/20
MaxQ (1)
. .s t (2)
PD 15≤ (3)
NQ 8≤ (4)
ND 2≤ (5)
ET 927≤ (6)
The decision variables are described in Table 6, where iST refers to the start time of the technician i where { }, , ,i 1 2 9∈ … .
Table 6: Decision variables for the optimization model
Variable Type Lower Bound Upper Bound Increment
SL discrete 8.0 10.0 0.25 D Boolean false true -
iST discrete 0 624 24
The problem has been solved using the solver OptQuestTM that is a module of the simulation software ArenaTM combining the metaheuristics of Tabu Search, Neural Networks, and Scatter Search into a single search heuristic. For each run of the optimization, 24 replicas of the simulation model are executed and the average values among the replications are calculated to check the constraints. The results are showed in Table 7 where, in simulation time, minutes 0 and 912 are equivalent to the operation starting time 6:30 and closing time 21:42, respectively. It is seen that when compared with the original values used by the operation, some technicians are scheduled to arrive earlier and the slot length changed from 10 to 9 minutes. The output Q and its 95% confidence interval are showed at the bottom of the table.
Table 7: Opt. Results
Dec. Variables Original Opt. 1ST 0 0 2ST 24 24 3ST 96 96 4ST 240 192 5ST 336 312 6ST 384 360 7ST 456 456 8ST 624 600 9ST 624 624
SL 10 9 D true true Q 98.4 107.1 % 95 CI [95.5;101.3] [104.2;110.0]
4.4 – Space search experiments for two linacs
The operation is acquiring a second linear accelerator, and the manager has expressed his concern about the configuration of the operation, including the number and scheduling of technicians. We have modified the model described in Section 3 to operate with two machines, where each machine has its own scheduled patients. It has been decided to have both
Discrete-event simulation applied to a radiotherapy process: a case study of a cancer center
Brazilian Journal of Operations & Production Management, Vol. 18, No. 1, e20211076, 2021 16/20
machines in the same model instead of individual models for each machine because there is a relationship between the machines. For example, when a technician is called to a CT session, the technician of the linac with the lowest number of patients in the queue is the one to attend the session.
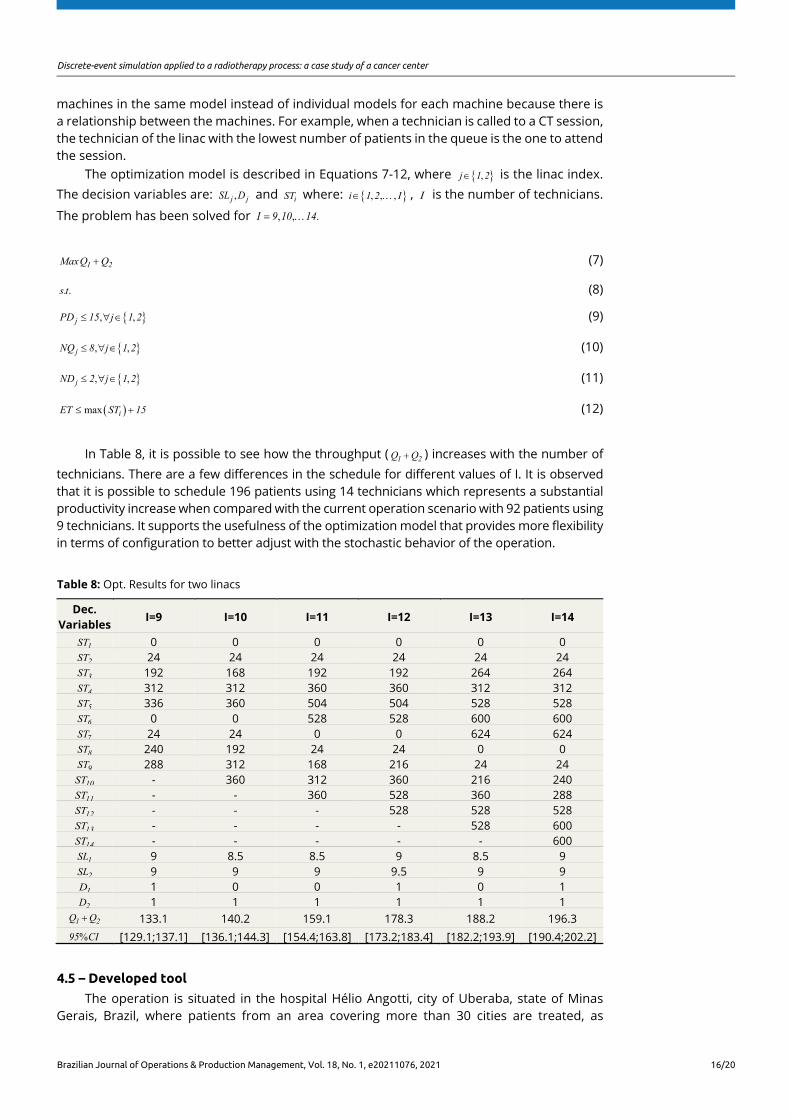
The optimization model is described in Equations 7-12, where { },j 1 2∈ is the linac index. The decision variables are: , j jSL D and iST where: { }, , ,i 1 2 I∈ … , I is the number of technicians.
The problem has been solved for , , .I 9 10 14= …
1 2MaxQ Q+ (7)
. .s t (8)
{ }, , jPD 15 j 1 2≤ ∀ ∈ (9)
{ }, ,jNQ 8 j 1 2≤ ∀ ∈ (10)
{ }, ,jND 2 j 1 2≤ ∀ ∈ (11)
( )max iET ST 15≤ + (12)
In Table 8, it is possible to see how the throughput ( 1 2Q Q+ ) increases with the number of technicians. There are a few differences in the schedule for different values of I. It is observed that it is possible to schedule 196 patients using 14 technicians which represents a substantial productivity increase when compared with the current operation scenario with 92 patients using 9 technicians. It supports the usefulness of the optimization model that provides more flexibility in terms of configuration to better adjust with the stochastic behavior of the operation.
Table 8: Opt. Results for two linacs
Dec. Variables
I=9 I=10 I=11 I=12 I=13 I=14
1ST 0 0 0 0 0 0 2ST 24 24 24 24 24 24 3ST 192 168 192 192 264 264 4ST 312 312 360 360 312 312 5ST 336 360 504 504 528 528 6ST 0 0 528 528 600 600 7ST 24 24 0 0 624 624 8ST 240 192 24 24 0 0 9ST 288 312 168 216 24 24
10ST - 360 312 360 216 240 11ST - - 360 528 360 288 12ST - - - 528 528 528 13ST - - - - 528 600 14ST - - - - - 600 1SL 9 8.5 8.5 9 8.5 9 2SL 9 9 9 9.5 9 9 1D 1 0 0 1 0 1 2D 1 1 1 1 1 1
1 2Q Q+ 133.1 140.2 159.1 178.3 188.2 196.3 % 95 CI [129.1;137.1] [136.1;144.3] [154.4;163.8] [173.2;183.4] [182.2;193.9] [190.4;202.2]
4.5 – Developed tool
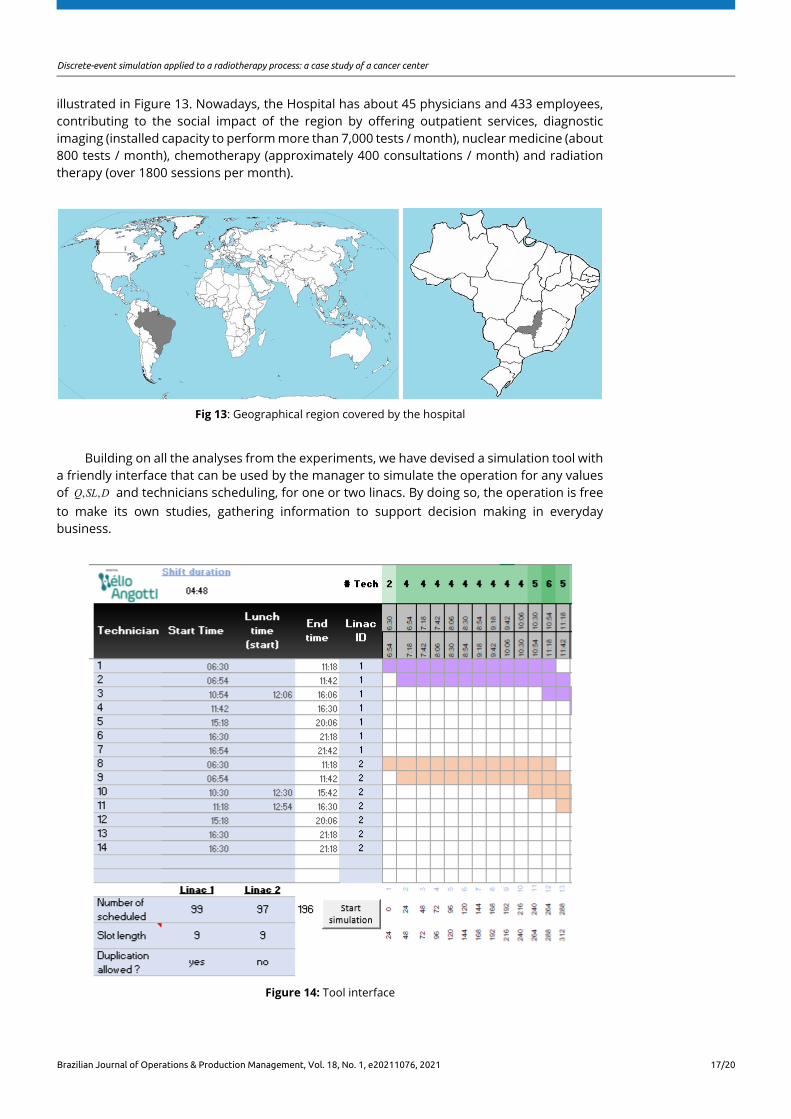
The operation is situated in the hospital Hélio Angotti, city of Uberaba, state of Minas Gerais, Brazil, where patients from an area covering more than 30 cities are treated, as
Discrete-event simulation applied to a radiotherapy process: a case study of a cancer center
Brazilian Journal of Operations & Production Management, Vol. 18, No. 1, e20211076, 2021 17/20
illustrated in Figure 13. Nowadays, the Hospital has about 45 physicians and 433 employees, contributing to the social impact of the region by offering outpatient services, diagnostic imaging (installed capacity to perform more than 7,000 tests / month), nuclear medicine (about 800 tests / month), chemotherapy (approximately 400 consultations / month) and radiation therapy (over 1800 sessions per month).
Fig 13: Geographical region covered by the hospital
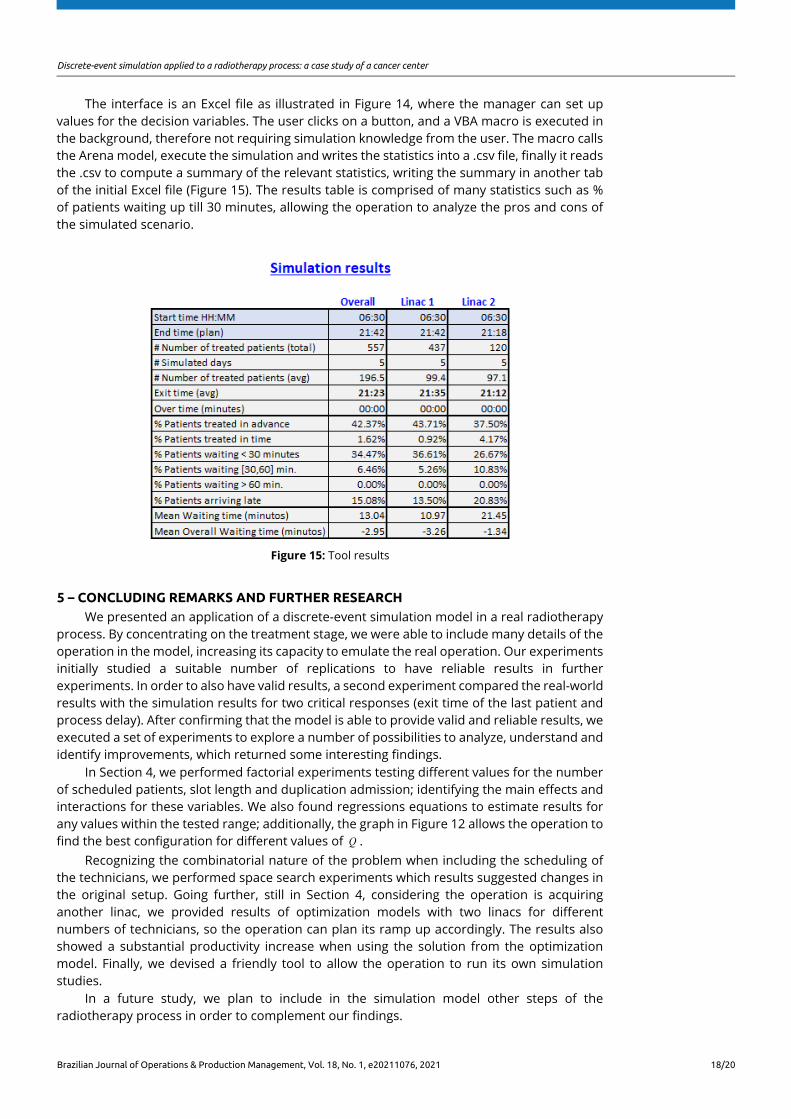
Building on all the analyses from the experiments, we have devised a simulation tool with a friendly interface that can be used by the manager to simulate the operation for any values of , , Q SL D and technicians scheduling, for one or two linacs. By doing so, the operation is free to make its own studies, gathering information to support decision making in everyday business.
Figure 14: Tool interface
Discrete-event simulation applied to a radiotherapy process: a case study of a cancer center
Brazilian Journal of Operations & Production Management, Vol. 18, No. 1, e20211076, 2021 18/20
The interface is an Excel file as illustrated in Figure 14, where the manager can set up values for the decision variables. The user clicks on a button, and a VBA macro is executed in the background, therefore not requiring simulation knowledge from the user. The macro calls the Arena model, execute the simulation and writes the statistics into a .csv file, finally it reads the .csv to compute a summary of the relevant statistics, writing the summary in another tab of the initial Excel file (Figure 15). The results table is comprised of many statistics such as % of patients waiting up till 30 minutes, allowing the operation to analyze the pros and cons of the simulated scenario.
Figure 15: Tool results
5 – CONCLUDING REMARKS AND FURTHER RESEARCH We presented an application of a discrete-event simulation model in a real radiotherapy
process. By concentrating on the treatment stage, we were able to include many details of the operation in the model, increasing its capacity to emulate the real operation. Our experiments initially studied a suitable number of replications to have reliable results in further experiments. In order to also have valid results, a second experiment compared the real-world results with the simulation results for two critical responses (exit time of the last patient and process delay). After confirming that the model is able to provide valid and reliable results, we executed a set of experiments to explore a number of possibilities to analyze, understand and identify improvements, which returned some interesting findings.
In Section 4, we performed factorial experiments testing different values for the number of scheduled patients, slot length and duplication admission; identifying the main effects and interactions for these variables. We also found regressions equations to estimate results for any values within the tested range; additionally, the graph in Figure 12 allows the operation to find the best configuration for different values of Q .
Recognizing the combinatorial nature of the problem when including the scheduling of the technicians, we performed space search experiments which results suggested changes in the original setup. Going further, still in Section 4, considering the operation is acquiring another linac, we provided results of optimization models with two linacs for different numbers of technicians, so the operation can plan its ramp up accordingly. The results also showed a substantial productivity increase when using the solution from the optimization model. Finally, we devised a friendly tool to allow the operation to run its own simulation studies.
In a future study, we plan to include in the simulation model other steps of the radiotherapy process in order to complement our findings.

Discrete-event simulation applied to a radiotherapy process: a case study of a cancer center
Brazilian Journal of Operations & Production Management, Vol. 18, No. 1, e20211076, 2021 19/20
REFERENCES Babashov, V., Aivas, I., Begen, M.A. et al. (2017), "Reducing patient waiting times for radiation therapy and
improving the treatment planning process: a discrete-event simulation model", Clinical Oncology, Vol. 29, No. 6, pp. 385-91.
Bauza, X. and Chow, J.C. (2019), "An automated scheduling system for radiotherapy physicist on-call using Monte Carlo simulation", Australasian Physical & Engineering Sciences in Medicine, Vol. 42, No. 1, pp. 27-32.
Chang Junior, J., Lima, F., Fernandes, A.M.S. et al. (2019), "Computer Simulation Model for Outpatient Clinics in a Brazilian Large Public Hospital Specialized in Cardiology", Brazilian Journal of Operations & Production Management, Vol. 16, No. 1, pp. 14-32.
Jaffray, D. A., & Gospodarowicz, M. K. (2015), "Radiation therapy for cancer", in Gelband, H., Jha, P., Sankaranarayanan, R., and Horton, S. (Eds.), Cancer: Disease Control Priorities, The International Bank for Reconstruction and Development, Washington .
Joustra, P., Van der Sluis, E. and Van Dijk, N.M. (2010), "To pool or not to pool in hospitals: a theoretical and practical comparison for a radiotherapy outpatient department", Annals of Operations Research, Vol. 178, No. 1, pp. 77-89.
Kapamara, T., Sheibani, K., Petrovic, D. et al. (2007), “A simulation of a radiotherapy treatment system: a case study of a local cancer centre”, in Proceedings of ORP3 Conference, Guimarães, pp. 29-35.
Law, A.M., Kelton, W.D. and Kelton, W.D. (2000), Simulation Modeling and Analysis, Vol. 3, McGraw-Hill, New York.
Miranda, D. (2020), “Outlier detector: independence and stability”, available at: https://dunamath.com/outlier.aspx https://dunamath.com/autocorrelation_stability.aspx (accessed 26 June 2020).
Morgan, J., Howick, S. and Belton, V. (2011), “Designs for the complementary use of system dynamics and discrete-event simulation”, in Proceedings of the 2011 Winter Simulation Conference, IEEE, pp. 2710-2722.
Morgan, J.S., Belton, V. and Howick, S. (2016), "Lessons from mixing OR methods in practice: using DES and SD to explore a radiotherapy treatment planning process", Health Systems, Vol. 5, No. 3, pp. 166-77.
Munro, A.J. and Potter, S. (1994), "Waiting times for radiotherapy treatment: not all that mysterious and certainly preventable", Clinical Oncology, Vol. 6, No. 5, pp. 314-8.
Oddiraju, S. and Mutic, S. (2011), "Discrete‐event simulation modelling to improve radiation therapy planning process", Medical Physics, Vol. 38, No. 6, pp. 3456.
Pooya, P., Ivy, J., Mazur, L. et al. (2014), “Assessing the reliability of the radiation therapy care delivery process using discrete event simulation”, in Proceedings of the Winter Simulation Conference 2014, IEEE, pp. 1233-1244.
Proctor, S., Lehaney, B., Reeves, C. et al. (2007), "Modelling patient flow in a radiotherapy department", OR Insight, Vol. 20, No. 3, pp. 6-14.
Saberi, M. and Awasthi, A. (2019), “Using of optimal simulation modelling to reduce radiotherapy cancer waiting time and improve survival”, in Proceedings of the International Conference on IE&OM, Toronto, Canada.
Thomas, S.J. (2003), "Capacity and demand models for radiotherapy treatment machines", Clinical Oncology, Vol. 15, No. 6, pp. 353-8.
Thomas, S.J., Williams, M.V., Burnet, N.G. et al. (2001), "How much surplus capacity is required to maintain low waiting times?", Clinical Oncology, Vol. 13, No. 1, pp. 24-8.
Vieira, B., Demirtas, D., Van De Kamer, J.B. et al. (2019), "Improving workflow control in radiotherapy using discrete-event simulation", BMC Medical Informatics and Decision Making, Vol. 19, No. 1, pp. 199.
Werker, G., Sauré, A., French, J. et al. (2009), "The use of discrete-event simulation modelling to improve radiation therapy planning processes", Radiotherapy and Oncology, Vol. 92, No. 1, pp. 76-82.
Zubizarreta, E.V.D.J., Van Dyk, J. and Lievens, Y. (2017), "Analysis of global radiotherapy needs and costs by geographic region and income level", Clinical Oncology, Vol. 29, No. 2, pp. 84-92.
Author contributions: Douglas M. Miranda: Conceptualization, Methodology, Software, Writing- Original draft preparation, Investigation, Supervision; Mariana Pedrini M. Miranda: Conceptualization, Data curation, Writing- Reviewing and Editing
Discrete-event simulation applied to a radiotherapy process: a case study of a cancer center
Brazilian Journal of Operations & Production Management, Vol. 18, No. 1, e20211076, 2021 20/20
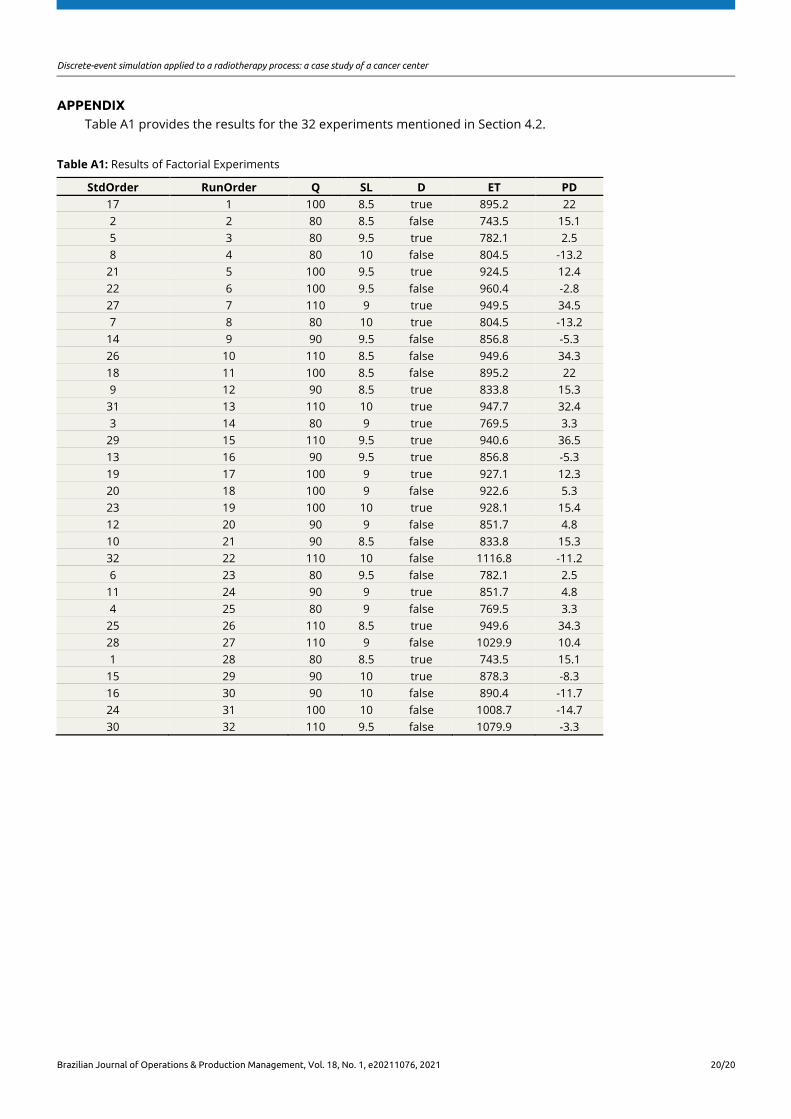
APPENDIX Table A1 provides the results for the 32 experiments mentioned in Section 4.2.
Table A1: Results of Factorial Experiments
StdOrder RunOrder Q SL D ET PD 17 1 100 8.5 true 895.2 22
2 2 80 8.5 false 743.5 15.1
5 3 80 9.5 true 782.1 2.5
8 4 80 10 false 804.5 -13.2
21 5 100 9.5 true 924.5 12.4
22 6 100 9.5 false 960.4 -2.8
27 7 110 9 true 949.5 34.5
7 8 80 10 true 804.5 -13.2
14 9 90 9.5 false 856.8 -5.3
26 10 110 8.5 false 949.6 34.3
18 11 100 8.5 false 895.2 22
9 12 90 8.5 true 833.8 15.3
31 13 110 10 true 947.7 32.4
3 14 80 9 true 769.5 3.3
29 15 110 9.5 true 940.6 36.5
13 16 90 9.5 true 856.8 -5.3
19 17 100 9 true 927.1 12.3
20 18 100 9 false 922.6 5.3
23 19 100 10 true 928.1 15.4
12 20 90 9 false 851.7 4.8
10 21 90 8.5 false 833.8 15.3
32 22 110 10 false 1116.8 -11.2
6 23 80 9.5 false 782.1 2.5
11 24 90 9 true 851.7 4.8
4 25 80 9 false 769.5 3.3
25 26 110 8.5 true 949.6 34.3
28 27 110 9 false 1029.9 10.4
1 28 80 8.5 true 743.5 15.1
15 29 90 10 true 878.3 -8.3
16 30 90 10 false 890.4 -11.7
24 31 100 10 false 1008.7 -14.7
30 32 110 9.5 false 1079.9 -3.3