case study 3 - annex
TRANSCRIPT
This project has received funding from the European Union’s Horizon 2020 research and innovation
programme under grant agreement No 642317.
Case Study 3 - Annex
Danube River Basin – harmonising inland,
coastal and marine ecosystem management to
achieve aquatic biodiversity targets1
1See full case study report for author and project information. Further information at https://aquacross.eu/content/case-study-3-danube-river-basin-harmonising-inland-coastal-and-
marine-ecosystem-management
Annex 1: Danube tributaries: Impact of
hydropower
Southeast Europe (SEE) represents one of the hotspots of aquatic biodiversity worldwide
(Griffiths, Kryštufek, & Reed, 2004). In the same time, the area sees a boom of hydropower
development, with more than 2500 dams being planned, even in nature conservation areas (EU
Natura 2000 areas). Thus, the construction of hydropower dams represents a clear threat to
the regional aquatic biodiversity and ecosystem services, while there is hardly any data
available so far on the environmental effects of hydropower plants in that region featuring high
aquatic biodiversity.
So far, there is no nationally available overviews on the number of existing and planned HP
plants for the most countries of SEE Europe. As data on the operation type of HP plants are
often lacking, too, as well as the environmental flows provided, the impacts of existing HP
plants on the flow regimes of rivers are largely unknown, and in consequence the ecological
impacts, too. Especially, potentially valuable hydrological and ecological studies comparing the
situations before and after dam construction are rare. There are missing national strategies for
hydropower development which are legally binding.
Selection of the relevant indicators, metrics and indices for
assessing the pressure induced by hydropower activity
Based on data availability for Danube tributaries indicators for the D-P-S analyses in SEE were
selected according with the AQUACROSS concept on drivers, human activities, pressures and
ecosystem state, which was specified for indicators, metrics and indices in WP4 and WP5.
Water abstraction, water flow changes and interruption of longitudinal river continuity for
energy production by hydroelectric dams were selected as indicators for physical changes by
human activities (Table AI 1), and fish communities were selected to describe state/ecosystem
components (Table AI 2)
Table AI 1 Available integrative indicators describing selected pressure induced by hydropower activity
Pressures Indicator Available metric/Index Data availability
Water flow rate
changes,
Water abstraction
Water flow changes,
hydrological
alteration - local,
including sediment
transport
considerations
Extent of area affected by
permanent hydrographical
alterations
River water bodies
significantly affected by
impoundments, water
Slovenia, Croatia,
Montenegro,
Serbia, Bosnia and
Herzegovina,
Bulgaria, Romania

abstraction or
hydropeaking
ditto Collated database of
future infrastructure
projects (hydrological
alteration)
Slovenia, Croatia,
Montenegro, Serbia,
Bosnia and
Herzegovina,
Bulgaria, Romania
Water flow rate
changes,
Water abstraction
Water flow changes,
hydrological
alteration
The ecodifference method
(ecodeficit and ecosurplus
metrics)
5 rivers in Slovenia
and Croatia affected
by hydropower
operation in different
ways
ditto The Indicators of
Hydrologic Alteration
model
5 rivers in Slovenia
and Croatia affected
by hydropower
operation in different
ways
ditto Method for the
assessment of flow
alteration by hydropeaking
5 rivers in Slovenia
and Croatia affected
by hydropower
operation in different
ways
Table AI 2: Available integrative indicators describing state/ecosystem components.
State Component
/indicator Metric/Index examples
Data
availability
Biological state Fish composition, abundance;
population
Romania
Mapping the pressures represented by hydroelectric dams in SEE
The known locations of current and planned dams based on available data sets, which are
partially known to be incomplete (e.g. for Romania), were mapped (Figure AI 1).The map hence
shows the minimum extent of potential effects of hydropower on rivers in SEE, which hence
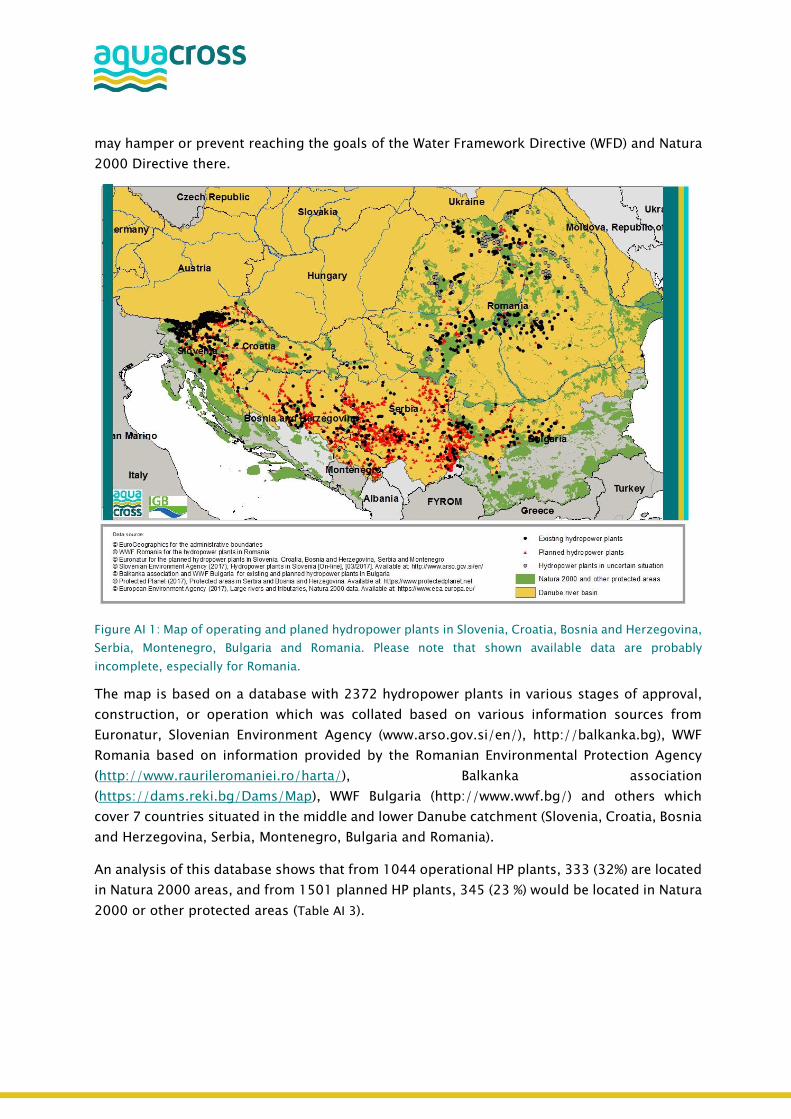
may hamper or prevent reaching the goals of the Water Framework Directive (WFD) and Natura
2000 Directive there.
Figure AI 1: Map of operating and planed hydropower plants in Slovenia, Croatia, Bosnia and Herzegovina,
Serbia, Montenegro, Bulgaria and Romania. Please note that shown available data are probably
incomplete, especially for Romania.
The map is based on a database with 2372 hydropower plants in various stages of approval,
construction, or operation which was collated based on various information sources from
Euronatur, Slovenian Environment Agency (www.arso.gov.si/en/), http://balkanka.bg), WWF
Romania based on information provided by the Romanian Environmental Protection Agency
(http://www.raurileromaniei.ro/harta/), Balkanka association
(https://dams.reki.bg/Dams/Map), WWF Bulgaria (http://www.wwf.bg/) and others which
cover 7 countries situated in the middle and lower Danube catchment (Slovenia, Croatia, Bosnia
and Herzegovina, Serbia, Montenegro, Bulgaria and Romania).
An analysis of this database shows that from 1044 operational HP plants, 333 (32%) are located
in Natura 2000 areas, and from 1501 planned HP plants, 345 (23 %) would be located in Natura
2000 or other protected areas (Table AI 3).
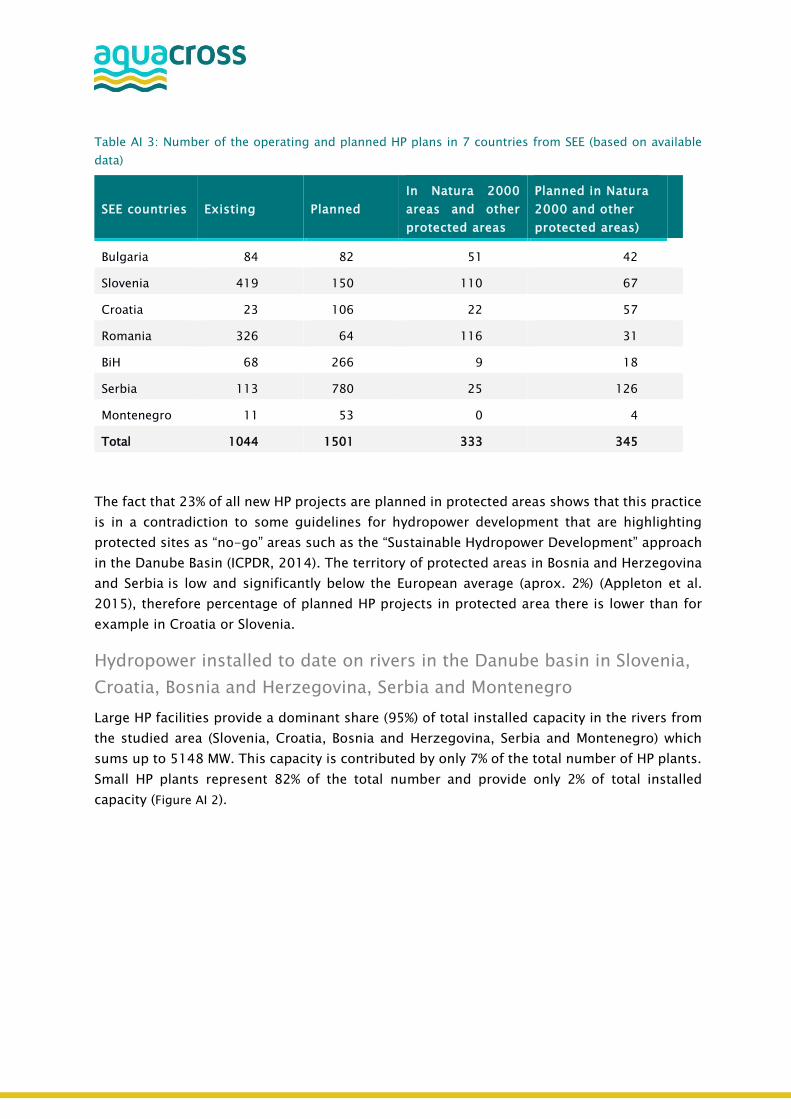
Table AI 3: Number of the operating and planned HP plans in 7 countries from SEE (based on available
data)
SEE countries Existing Planned
In Natura 2000
areas and other
protected areas
Planned in Natura
2000 and other
protected areas)
Bulgaria 84 82 51 42
Slovenia 419 150 110 67
Croatia 23 106 22 57
Romania 326 64 116 31
BiH 68 266 9 18
Serbia 113 780 25 126
Montenegro 11 53 0 4
Total 1044 1501 333 345
The fact that 23% of all new HP projects are planned in protected areas shows that this practice
is in a contradiction to some guidelines for hydropower development that are highlighting
protected sites as “no-go” areas such as the “Sustainable Hydropower Development” approach
in the Danube Basin (ICPDR, 2014). The territory of protected areas in Bosnia and Herzegovina
and Serbia is low and significantly below the European average (aprox. 2%) (Appleton et al.
2015), therefore percentage of planned HP projects in protected area there is lower than for
example in Croatia or Slovenia.
Hydropower installed to date on rivers in the Danube basin in Slovenia,
Croatia, Bosnia and Herzegovina, Serbia and Montenegro
Large HP facilities provide a dominant share (95%) of total installed capacity in the rivers from
the studied area (Slovenia, Croatia, Bosnia and Herzegovina, Serbia and Montenegro) which
sums up to 5148 MW. This capacity is contributed by only 7% of the total number of HP plants.
Small HP plants represent 82% of the total number and provide only 2% of total installed
capacity (Figure AI 2).
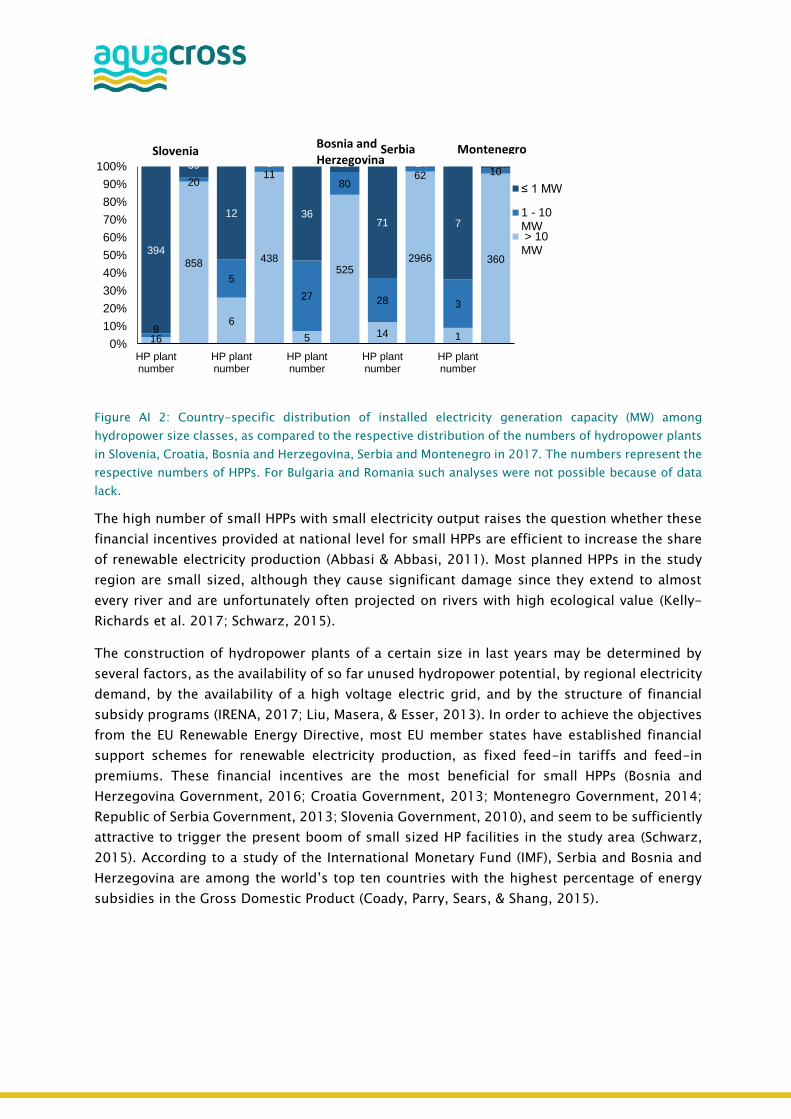
Figure AI 2: Country-specific distribution of installed electricity generation capacity (MW) among
hydropower size classes, as compared to the respective distribution of the numbers of hydropower plants
in Slovenia, Croatia, Bosnia and Herzegovina, Serbia and Montenegro in 2017. The numbers represent the
respective numbers of HPPs. For Bulgaria and Romania such analyses were not possible because of data
lack.
The high number of small HPPs with small electricity output raises the question whether these
financial incentives provided at national level for small HPPs are efficient to increase the share
of renewable electricity production (Abbasi & Abbasi, 2011). Most planned HPPs in the study
region are small sized, although they cause significant damage since they extend to almost
every river and are unfortunately often projected on rivers with high ecological value (Kelly-
Richards et al. 2017; Schwarz, 2015).
The construction of hydropower plants of a certain size in last years may be determined by
several factors, as the availability of so far unused hydropower potential, by regional electricity
demand, by the availability of a high voltage electric grid, and by the structure of financial
subsidy programs (IRENA, 2017; Liu, Masera, & Esser, 2013). In order to achieve the objectives
from the EU Renewable Energy Directive, most EU member states have established financial
support schemes for renewable electricity production, as fixed feed-in tariffs and feed-in
premiums. These financial incentives are the most beneficial for small HPPs (Bosnia and
Herzegovina Government, 2016; Croatia Government, 2013; Montenegro Government, 2014;
Republic of Serbia Government, 2013; Slovenia Government, 2010), and seem to be sufficiently
attractive to trigger the present boom of small sized HP facilities in the study area (Schwarz,
2015). According to a study of the International Monetary Fund (IMF), Serbia and Bosnia and
Herzegovina are among the world’s top ten countries with the highest percentage of energy
subsidies in the Gross Domestic Product (Coady, Parry, Sears, & Shang, 2015).
16
858
6
438
5
525
14
2966
1
360
9
20
5
11
27
80
28
62
3
10
394
59
12
3
36
19
71
24
7
5
0%
10%
20%
30%
40%
50%
60%
70%
80%
90%
100%
HP plantnumber
HP plantnumber
HP plantnumber
HP plantnumber
HP plantnumber
≤ 1 MW
1 - 10MW > 10MW
Slovenia Bosnia and Herzegovina
Serbia Montenegro
Analysis of the impact of hydropower plants on river hydrology in
Slovenia and Croatia
Assessments of assumed environmental effects of future HPPs in SEE are hampered by the fact
that even the basic effects of HPPs on the hydrology of rivers have hardly been studied in that
region (Bonacci & Oskoruš, 2010; Bonacci, Tadic, & Trninic, 1992; Globevnik & Mikoš, 2009;
Žganec, 2012).
The alteration of flow regimes is often claimed to be the most serious and continuing threat to
ecological sustainability of rivers and their associated floodplain wetlands (Sparks, 1995;
Tockner, Pennetzdorfer, Reiner, Schiemer, & Ward, 1999). All species of the fauna and flora of
rivers and their floodplains have adapted during their evolution to specific flow regimes.
Correspondingly, the biotic communities colonizing certain river systems have been shaped by
adaptation to their typical discharge levels, as well as to specific short-term and long-term
dynamics of flow (Allan, 1995; Bunn & Arthington, 2002; Lytle & Poff, 2004; Townsend &
Hildrew, 1994). Hydrological alterations may result in reduced or increased water levels, flow
velocities and in artificial short-term or seasonal dynamics of those variables, which have direct
effects on habitat features and availability both in the river channel and in the floodplain, as
well as on sediment transport and sediment colmation (Magilligan & Nislow, 2005; Nislow,
Magilligan, Fassnacht, Bechtel, & Ruesink, 2002). These impacts usually result in the alteration
and homogenization of aquatic and water-dependent habitats in the affected river corridor, in
the loss of lateral and longitudinal connectivity, leading to a disruption of life cycles (Kinsolving
& Bain, 1993; Scheidegger & Bain, 1995). In consequence, the diversity of typical riverine biota
decreases, exotic species spread, and many ecosystem dwindle not only at the reservoir site,
but are additionally significantly degraded in most of the downstream river sections (Bunn &
Arthington, 2002; Grill et al., 2015; Renöfält, Jansson, & Nilsson, 2010).
Knowledge on the impacts of planned HPPs on the hydrological regime of rivers in SEE would
also represent a pre-requisite to develop approaches aiming at the mitigation or optimization
of HPP operation to reduce environmental effects of flow regime alterations (B. Gao, Yang,
Zhao, & Yang, 2012).
The study covers several river sub-basins within the Danube river basin located in Slovenia and
Croatia which were selected due to the relatively good availability of gauging data there (Table
AI 4, Figure AI 3). The hydrology of the studied rivers in Slovenia and Croatia is shaped by the
Alpine and Continental climate components of the area, the marked orography, and by the
widespread karstification of the river catchments. Rivers range from Alpine (e.g. Drava, Sava)
to Continental karstic rivers (e.g. Gojacka Dobra).
Hence, for Slovenia and Croatia a complete database of the existing HPPs and gauging stations
including their precise positions was collated. From there, longstanding hydrological gauging
stations were chosen that are located downstream of the HPP, with daily data before and after
HPP construction. If available, sub-daily (hourly) data were obtained. Data were provided by
Slovenian Environment Agency (www.arso.gov.si/en/) and Croatian Meteorological and
Hydrological Service (http://meteo.hr/index_en.php).
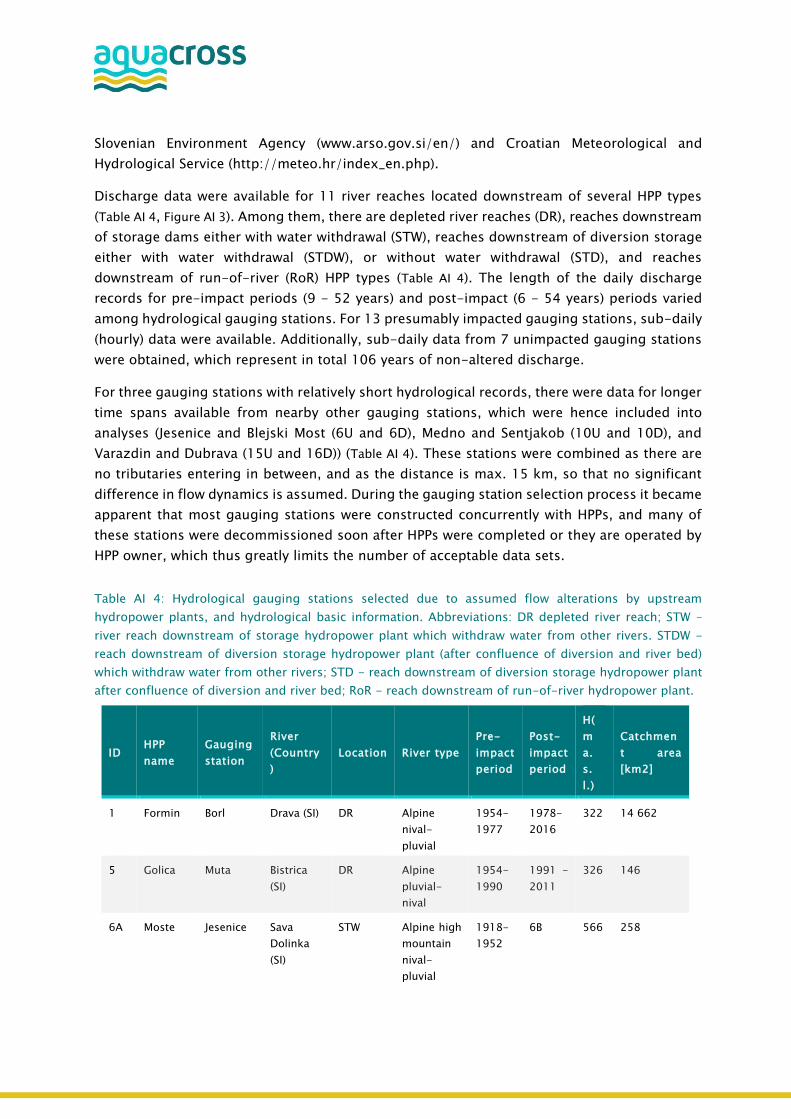
Discharge data were available for 11 river reaches located downstream of several HPP types
(Table AI 4, Figure AI 3). Among them, there are depleted river reaches (DR), reaches downstream
of storage dams either with water withdrawal (STW), reaches downstream of diversion storage
either with water withdrawal (STDW), or without water withdrawal (STD), and reaches
downstream of run-of-river (RoR) HPP types (Table AI 4). The length of the daily discharge
records for pre-impact periods (9 - 52 years) and post-impact (6 - 54 years) periods varied
among hydrological gauging stations. For 13 presumably impacted gauging stations, sub-daily
(hourly) data were available. Additionally, sub-daily data from 7 unimpacted gauging stations
were obtained, which represent in total 106 years of non-altered discharge.
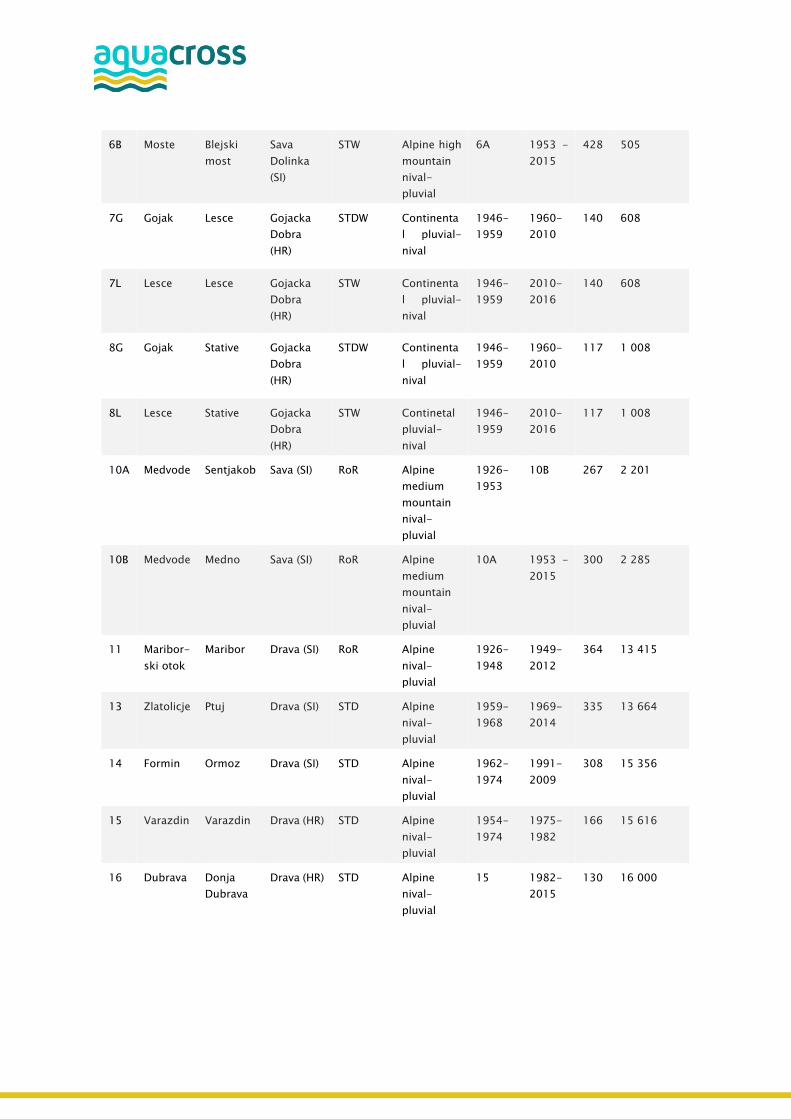
For three gauging stations with relatively short hydrological records, there were data for longer
time spans available from nearby other gauging stations, which were hence included into
analyses (Jesenice and Blejski Most (6U and 6D), Medno and Sentjakob (10U and 10D), and
Varazdin and Dubrava (15U and 16D)) (Table AI 4). These stations were combined as there are
no tributaries entering in between, and as the distance is max. 15 km, so that no significant
difference in flow dynamics is assumed. During the gauging station selection process it became
apparent that most gauging stations were constructed concurrently with HPPs, and many of
these stations were decommissioned soon after HPPs were completed or they are operated by
HPP owner, which thus greatly limits the number of acceptable data sets.
Table AI 4: Hydrological gauging stations selected due to assumed flow alterations by upstream
hydropower plants, and hydrological basic information. Abbreviations: DR depleted river reach; STW –
river reach downstream of storage hydropower plant which withdraw water from other rivers. STDW -
reach downstream of diversion storage hydropower plant (after confluence of diversion and river bed)
which withdraw water from other rivers; STD - reach downstream of diversion storage hydropower plant
after confluence of diversion and river bed; RoR - reach downstream of run-of-river hydropower plant.
ID HPP
name
Gauging
station
River
(Country
)
Location River type
Pre-
impact
period
Post-
impact
period
H(
m
a.
s.
l.)
Catchmen
t area
[km2]
1 Formin Borl Drava (SI) DR Alpine
nival-
pluvial
1954-
1977
1978-
2016
322 14 662
5 Golica Muta Bistrica
(SI)
DR Alpine
pluvial-
nival
1954-
1990
1991 -
2011
326 146
6A Moste Jesenice Sava
Dolinka
(SI)
STW Alpine high
mountain
nival-
pluvial
1918-
1952
6B 566 258
6B Moste Blejski
most
Sava
Dolinka
(SI)
STW Alpine high
mountain
nival-
pluvial
6A 1953 -
2015
428 505
7G Gojak Lesce Gojacka
Dobra
(HR)
STDW Continenta
l pluvial-
nival
1946-
1959
1960-
2010
140 608
7L Lesce Lesce Gojacka
Dobra
(HR)
STW Continenta
l pluvial-
nival
1946-
1959
2010-
2016
140 608
8G Gojak Stative Gojacka
Dobra
(HR)
STDW Continenta
l pluvial-
nival
1946-
1959
1960-
2010
117 1 008
8L Lesce Stative Gojacka
Dobra
(HR)
STW Continetal
pluvial-
nival
1946-
1959
2010-
2016
117 1 008
10A Medvode Sentjakob Sava (SI) RoR Alpine
medium
mountain
nival-
pluvial
1926-
1953
10B 267 2 201
10B Medvode Medno Sava (SI) RoR Alpine
medium
mountain
nival-
pluvial
10A 1953 -
2015
300 2 285
11 Maribor-
ski otok
Maribor Drava (SI) RoR Alpine
nival-
pluvial
1926-
1948
1949-
2012
364 13 415
13 Zlatolicje Ptuj Drava (SI) STD Alpine
nival-
pluvial
1959-
1968
1969-
2014
335 13 664
14 Formin Ormoz Drava (SI) STD Alpine
nival-
pluvial
1962-
1974
1991-
2009
308 15 356
15 Varazdin Varazdin Drava (HR) STD Alpine
nival-
pluvial
1954-
1974
1975-
1982
166 15 616
16 Dubrava Donja
Dubrava
Drava (HR) STD Alpine
nival-
pluvial
15 1982-
2015
130 16 000
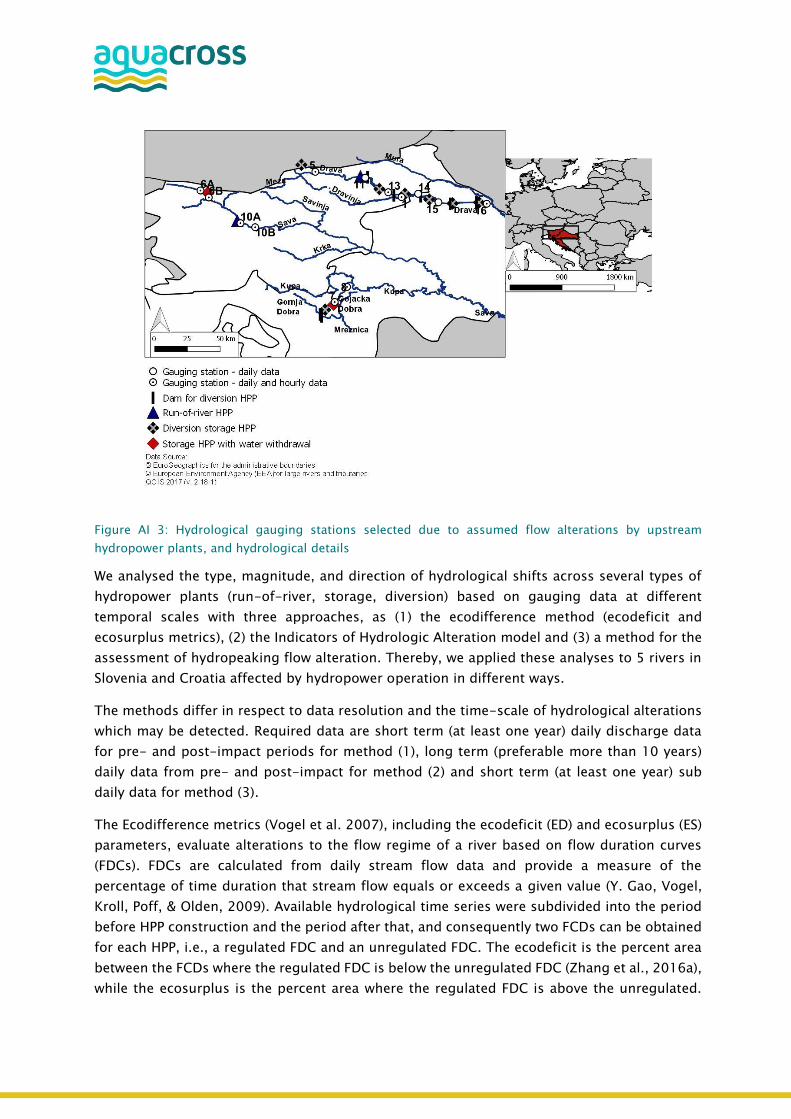
Figure AI 3: Hydrological gauging stations selected due to assumed flow alterations by upstream
hydropower plants, and hydrological details
We analysed the type, magnitude, and direction of hydrological shifts across several types of
hydropower plants (run-of-river, storage, diversion) based on gauging data at different
temporal scales with three approaches, as (1) the ecodifference method (ecodeficit and
ecosurplus metrics), (2) the Indicators of Hydrologic Alteration model and (3) a method for the
assessment of hydropeaking flow alteration. Thereby, we applied these analyses to 5 rivers in
Slovenia and Croatia affected by hydropower operation in different ways.
The methods differ in respect to data resolution and the time-scale of hydrological alterations
which may be detected. Required data are short term (at least one year) daily discharge data
for pre- and post-impact periods for method (1), long term (preferable more than 10 years)
daily data from pre- and post-impact for method (2) and short term (at least one year) sub
daily data for method (3).
The Ecodifference metrics (Vogel et al. 2007), including the ecodeficit (ED) and ecosurplus (ES)
parameters, evaluate alterations to the flow regime of a river based on flow duration curves
(FDCs). FDCs are calculated from daily stream flow data and provide a measure of the
percentage of time duration that stream flow equals or exceeds a given value (Y. Gao, Vogel,
Kroll, Poff, & Olden, 2009). Available hydrological time series were subdivided into the period
before HPP construction and the period after that, and consequently two FCDs can be obtained
for each HPP, i.e., a regulated FDC and an unregulated FDC. The ecodeficit is the percent area
between the FCDs where the regulated FDC is below the unregulated FDC (Zhang et al., 2016a),
while the ecosurplus is the percent area where the regulated FDC is above the unregulated.
Finally, the ecodifference, which mirrors the total change of flow regime, was computed as the
sum of the ecodeficit and ecosurplus (Y. Gao et al., 2009; Zhang, Huang, & Huang, 2016).
When calculated on an overall percentage basis, ecodifference provides a measure of relative
change from the unaltered condition. If ecodifference is higher than 15%, this river section is
estimated as highly altered.
The Indicators of Hydrologic Alteration (IHA) method (IHA 7.1 software) may demonstrate the
hydrologic alterations associated with HPP operation which will clearly affect the functioning of
river ecosystems (Richter, Baumgartner, Powell, & Braun, 1996). Based on daily discharge data,
IHA calculates more than 30 indices which describe the hydrologic regime of a certain gauging
station. The indices generated by IHA consist of five major categories: (1) magnitude of monthly
flows; (2) magnitude and duration of annual extreme and base flow conditions; (3) timing of
annual extreme conditions; (4) frequency and duration of high and low pulses; and (5) rate and
frequency of flow changes (Table AI 5) (Richter et al., 1996).
Thereby, non-parametric statistics were applied to skewed data distributions, which is common
in hydrological data. In order to compare impacts of HPPs on quantitative way, we calculated
for each HPP median value and degree of hydrological alteration (D) which was calculated
according to (Richter, Baumgartner, Braun, & Powell, 1998).
Thereby, it is suggested that a level of D < 33% compared to the unaltered flow regime
represents little or no alteration, 34% > D < 67% moderate alteration, and D > 68% high
alteration (Richter et al., 1998).
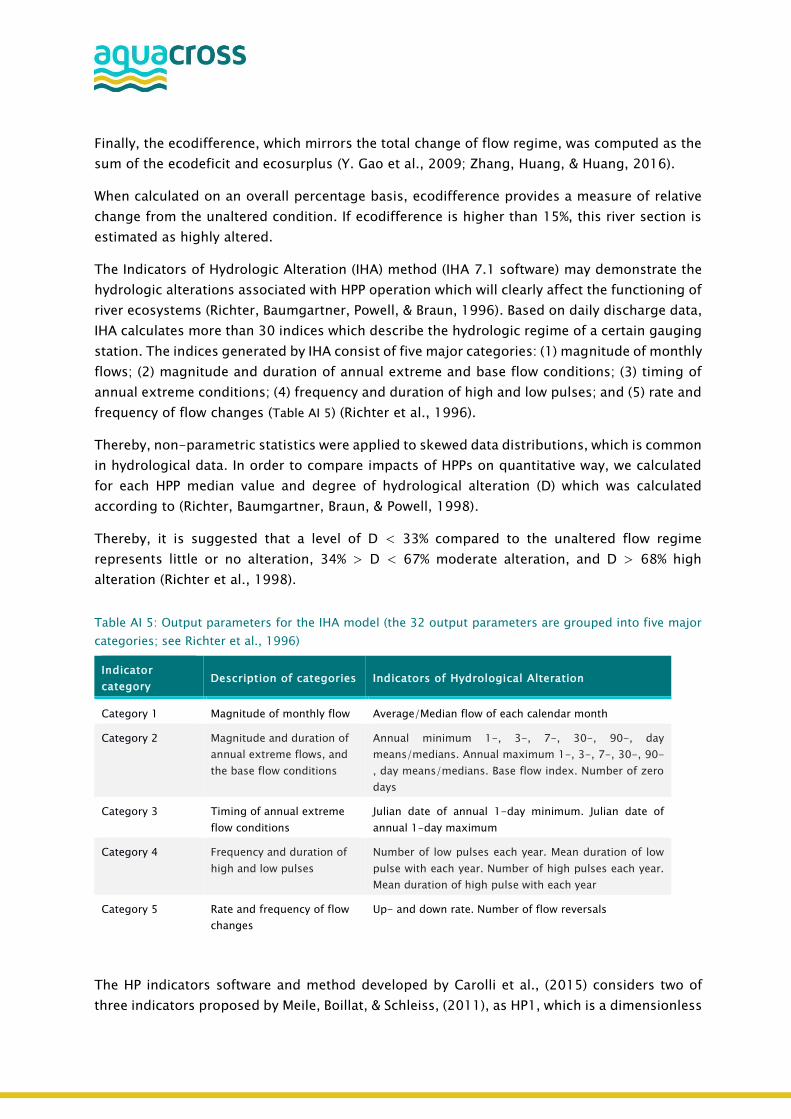
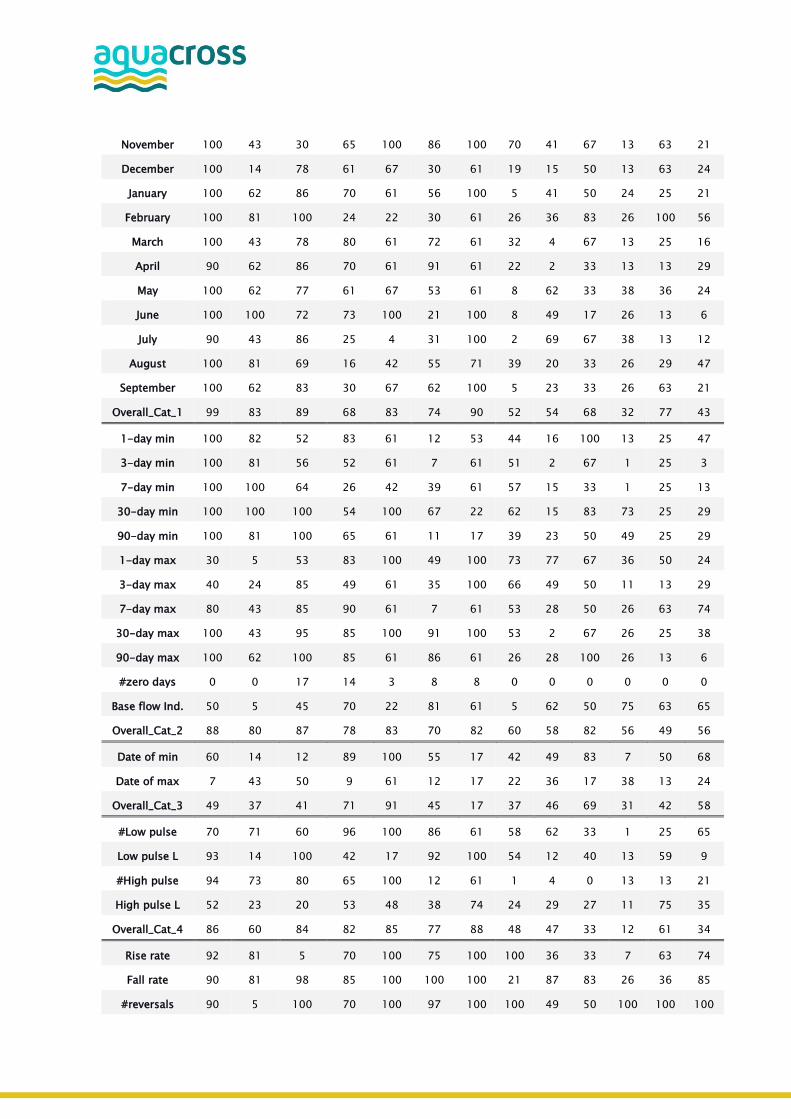
Table AI 5: Output parameters for the IHA model (the 32 output parameters are grouped into five major
categories; see Richter et al., 1996)
Indicator
category Description of categories Indicators of Hydrological Alteration
Category 1 Magnitude of monthly flow Average/Median flow of each calendar month
Category 2 Magnitude and duration of
annual extreme flows, and
the base flow conditions
Annual minimum 1-, 3-, 7-, 30-, 90-, day
means/medians. Annual maximum 1-, 3-, 7-, 30-, 90-
, day means/medians. Base flow index. Number of zero
days
Category 3 Timing of annual extreme
flow conditions
Julian date of annual 1-day minimum. Julian date of
annual 1-day maximum
Category 4 Frequency and duration of
high and low pulses
Number of low pulses each year. Mean duration of low
pulse with each year. Number of high pulses each year.
Mean duration of high pulse with each year
Category 5 Rate and frequency of flow
changes
Up- and down rate. Number of flow reversals
The HP indicators software and method developed by Carolli et al., (2015) considers two of
three indicators proposed by Meile, Boillat, & Schleiss, (2011), as HP1, which is a dimensionless
measure of the magnitude of hydropeaking, and HP2 which reflects the temporal rate of
discharge change. For both metrics the thresholds TRHP1 and TRHP2 were established based
on the analysis of natural or near-natural flow series which enabled to identify the presence of
hydropeaking. Thereby, the degrees of hydropeaking intensity were identified, as hydropeaking
class 1 (absent or low alteration), hydropeaking class 2a and 2b (medium alteration) and
hydropeaking class (strong alteration), following Carolli et al., (2015).
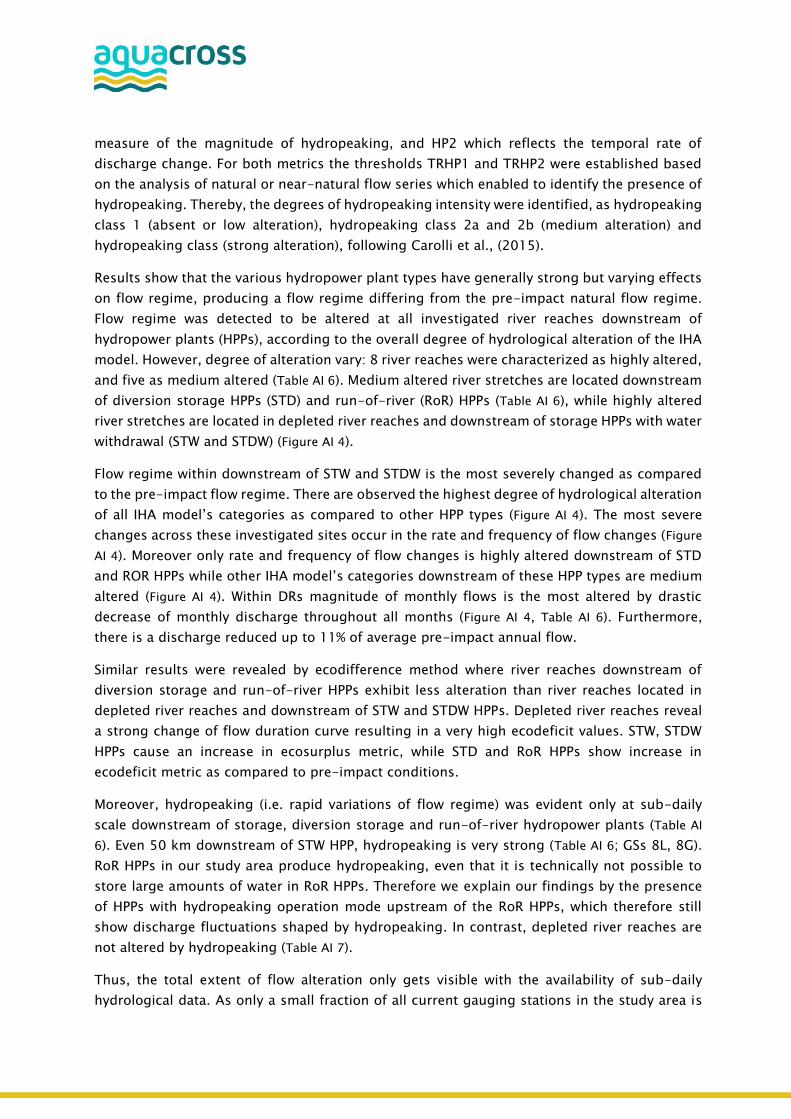
Results show that the various hydropower plant types have generally strong but varying effects
on flow regime, producing a flow regime differing from the pre-impact natural flow regime.
Flow regime was detected to be altered at all investigated river reaches downstream of
hydropower plants (HPPs), according to the overall degree of hydrological alteration of the IHA
model. However, degree of alteration vary: 8 river reaches were characterized as highly altered,
and five as medium altered (Table AI 6). Medium altered river stretches are located downstream
of diversion storage HPPs (STD) and run-of-river (RoR) HPPs (Table AI 6), while highly altered
river stretches are located in depleted river reaches and downstream of storage HPPs with water
withdrawal (STW and STDW) (Figure AI 4).
Flow regime within downstream of STW and STDW is the most severely changed as compared
to the pre-impact flow regime. There are observed the highest degree of hydrological alteration
of all IHA model’s categories as compared to other HPP types (Figure AI 4). The most severe
changes across these investigated sites occur in the rate and frequency of flow changes (Figure
AI 4). Moreover only rate and frequency of flow changes is highly altered downstream of STD
and ROR HPPs while other IHA model’s categories downstream of these HPP types are medium
altered (Figure AI 4). Within DRs magnitude of monthly flows is the most altered by drastic
decrease of monthly discharge throughout all months (Figure AI 4, Table AI 6). Furthermore,
there is a discharge reduced up to 11% of average pre-impact annual flow.
Similar results were revealed by ecodifference method where river reaches downstream of
diversion storage and run-of-river HPPs exhibit less alteration than river reaches located in
depleted river reaches and downstream of STW and STDW HPPs. Depleted river reaches reveal
a strong change of flow duration curve resulting in a very high ecodeficit values. STW, STDW
HPPs cause an increase in ecosurplus metric, while STD and RoR HPPs show increase in
ecodeficit metric as compared to pre-impact conditions.
Moreover, hydropeaking (i.e. rapid variations of flow regime) was evident only at sub-daily
scale downstream of storage, diversion storage and run-of-river hydropower plants (Table AI
6). Even 50 km downstream of STW HPP, hydropeaking is very strong (Table AI 6; GSs 8L, 8G).
RoR HPPs in our study area produce hydropeaking, even that it is technically not possible to
store large amounts of water in RoR HPPs. Therefore we explain our findings by the presence
of HPPs with hydropeaking operation mode upstream of the RoR HPPs, which therefore still
show discharge fluctuations shaped by hydropeaking. In contrast, depleted river reaches are
not altered by hydropeaking (Table AI 7).
Thus, the total extent of flow alteration only gets visible with the availability of sub-daily
hydrological data. As only a small fraction of all current gauging stations in the study area is
actually recording at a sub-daily scale, the actual fraction of gauged river reaches which is
affected by hydropower plants cannot be estimated to date. The combination of several
methods could provide a practical and objective method for the analysis of hydrological
alterations. Hydropeaking flow alteration method could be used complementary to other two
used methods (Meile et al., 2011; Richter et al., 1996) in order to detected sub-daily changes
which are obviously not detectable with other methods.
Table AI 6: The hydropeaking indicator values (HP1, HP2) and overall hydropeaking values for each
gauging stations; gauging stations 11, 14 and 15 do not measure hourly data; THP1 = 0.4; THP2 = 1.6;
*: Significant difference between unaltered and altered periods at the 5% level.
Gauging
Station (GS) 1 5 6 7G 7L 8G 8L 10 13 15/16
HPP Type DR DR STW STDW STW STDW STW RoR STD STD
HP1 0.2* 0.1 0.8* 1.2* 1.3* 0.9* 1.2* 0.5* 1.3* 0.7*
HP2 3.1* 0.1* 5.2* 7.1* 15.6* 4.1* 12.2* 12.0* 94.2* 40.5*
Overall 2b 1 3 3 3 3 3 3 3 3
Figure AI 4: The degree of hydrological alteration of the IHA model's flow categories of different HPP types
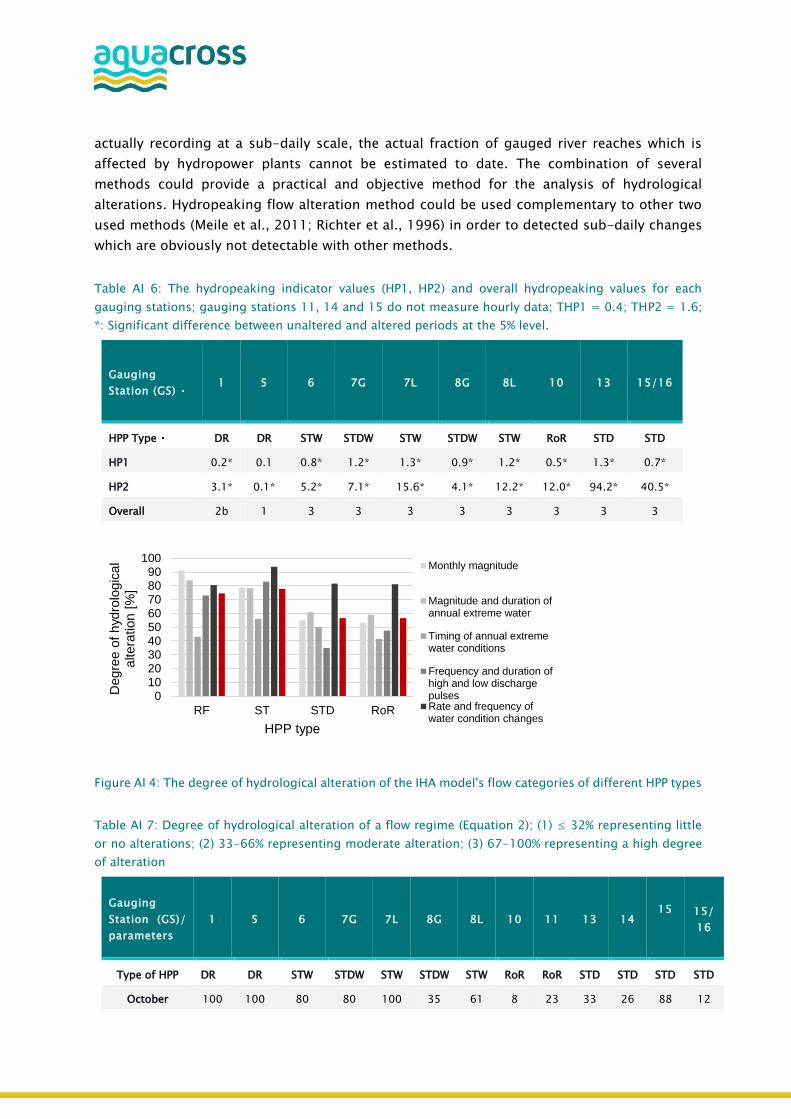
Table AI 7: Degree of hydrological alteration of a flow regime (Equation 2); (1) ≤ 32% representing little
or no alterations; (2) 33-66% representing moderate alteration; (3) 67-100% representing a high degree
of alteration
Gauging
Station (GS)/
parameters
1 5 6 7G 7L 8G 8L 10 11 13 14 15
15/
16
Type of HPP DR DR STW STDW STW STDW STW RoR RoR STD STD STD STD
October 100 100 80 80 100 35 61 8 23 33 26 88 12
0102030405060708090
100
RF ST STD RoR
Degre
e o
f hyd
rolo
gic
al
altera
tion [
%]
HPP type
Monthly magnitude
Magnitude and duration ofannual extreme water
Timing of annual extremewater conditions
Frequency and duration ofhigh and low dischargepulsesRate and frequency ofwater condition changes
November 100 43 30 65 100 86 100 70 41 67 13 63 21
December 100 14 78 61 67 30 61 19 15 50 13 63 24
January 100 62 86 70 61 56 100 5 41 50 24 25 21
February 100 81 100 24 22 30 61 26 36 83 26 100 56
March 100 43 78 80 61 72 61 32 4 67 13 25 16
April 90 62 86 70 61 91 61 22 2 33 13 13 29
May 100 62 77 61 67 53 61 8 62 33 38 36 24
June 100 100 72 73 100 21 100 8 49 17 26 13 6
July 90 43 86 25 4 31 100 2 69 67 38 13 12
August 100 81 69 16 42 55 71 39 20 33 26 29 47
September 100 62 83 30 67 62 100 5 23 33 26 63 21
Overall_Cat_1 99 83 89 68 83 74 90 52 54 68 32 77 43
1-day min 100 82 52 83 61 12 53 44 16 100 13 25 47
3-day min 100 81 56 52 61 7 61 51 2 67 1 25 3
7-day min 100 100 64 26 42 39 61 57 15 33 1 25 13
30-day min 100 100 100 54 100 67 22 62 15 83 73 25 29
90-day min 100 81 100 65 61 11 17 39 23 50 49 25 29
1-day max 30 5 53 83 100 49 100 73 77 67 36 50 24
3-day max 40 24 85 49 61 35 100 66 49 50 11 13 29
7-day max 80 43 85 90 61 7 61 53 28 50 26 63 74
30-day max 100 43 95 85 100 91 100 53 2 67 26 25 38
90-day max 100 62 100 85 61 86 61 26 28 100 26 13 6
#zero days 0 0 17 14 3 8 8 0 0 0 0 0 0
Base flow Ind. 50 5 45 70 22 81 61 5 62 50 75 63 65
Overall_Cat_2 88 80 87 78 83 70 82 60 58 82 56 49 56
Date of min 60 14 12 89 100 55 17 42 49 83 7 50 68
Date of max 7 43 50 9 61 12 17 22 36 17 38 13 24
Overall_Cat_3 49 37 41 71 91 45 17 37 46 69 31 42 58
#Low pulse 70 71 60 96 100 86 61 58 62 33 1 25 65
Low pulse L 93 14 100 42 17 92 100 54 12 40 13 59 9
#High pulse 94 73 80 65 100 12 61 1 4 0 13 13 21
High pulse L 52 23 20 53 48 38 74 24 29 27 11 75 35
Overall_Cat_4 86 60 84 82 85 77 88 48 47 33 12 61 34
Rise rate 92 81 5 70 100 75 100 100 36 33 7 63 74
Fall rate 90 81 98 85 100 100 100 21 87 83 26 36 85
#reversals 90 5 100 70 100 97 100 100 49 50 100 100 100
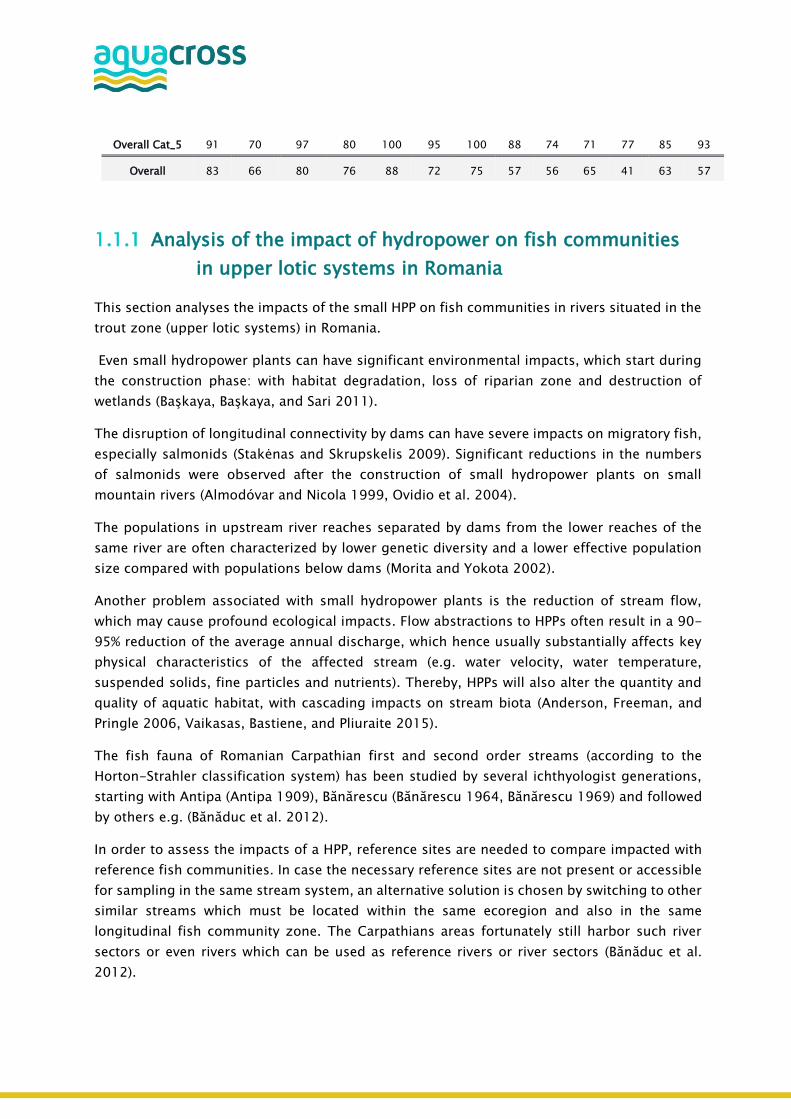
Overall Cat_5 91 70 97 80 100 95 100 88 74 71 77 85 93
Overall 83 66 80 76 88 72 75 57 56 65 41 63 57
1.1.1 Analysis of the impact of hydropower on fish communities
in upper lotic systems in Romania
This section analyses the impacts of the small HPP on fish communities in rivers situated in the
trout zone (upper lotic systems) in Romania.
Even small hydropower plants can have significant environmental impacts, which start during
the construction phase: with habitat degradation, loss of riparian zone and destruction of
wetlands (Başkaya, Başkaya, and Sari 2011).
The disruption of longitudinal connectivity by dams can have severe impacts on migratory fish,
especially salmonids (Stakėnas and Skrupskelis 2009). Significant reductions in the numbers
of salmonids were observed after the construction of small hydropower plants on small
mountain rivers (Almodóvar and Nicola 1999, Ovidio et al. 2004).
The populations in upstream river reaches separated by dams from the lower reaches of the
same river are often characterized by lower genetic diversity and a lower effective population
size compared with populations below dams (Morita and Yokota 2002).
Another problem associated with small hydropower plants is the reduction of stream flow,
which may cause profound ecological impacts. Flow abstractions to HPPs often result in a 90-
95% reduction of the average annual discharge, which hence usually substantially affects key
physical characteristics of the affected stream (e.g. water velocity, water temperature,
suspended solids, fine particles and nutrients). Thereby, HPPs will also alter the quantity and
quality of aquatic habitat, with cascading impacts on stream biota (Anderson, Freeman, and
Pringle 2006, Vaikasas, Bastiene, and Pliuraite 2015).
The fish fauna of Romanian Carpathian first and second order streams (according to the
Horton-Strahler classification system) has been studied by several ichthyologist generations,
starting with Antipa (Antipa 1909), Bănărescu (Bănărescu 1964, Bănărescu 1969) and followed
by others e.g. (Bănăduc et al. 2012).
In order to assess the impacts of a HPP, reference sites are needed to compare impacted with
reference fish communities. In case the necessary reference sites are not present or accessible
for sampling in the same stream system, an alternative solution is chosen by switching to other
similar streams which must be located within the same ecoregion and also in the same
longitudinal fish community zone. The Carpathians areas fortunately still harbor such river
sectors or even rivers which can be used as reference rivers or river sectors (Bănăduc et al.
2012).
The available scientific information on Romanian ichthyofauna before the 1960’s offer the
possibility of a comparison of these documents fish communities, which are taken as reference
data, with the present situation in order to assess the impact generated by the construction of
the HP plants.
A review of scientific publication for Romania was conducted in order to assess the impact of
HP plants on the biodiversity. We identified 44 relevant publications analyzing the effects of
hydropower on Romanians rivers in terms of fish, 9 on macroinvertebrates and 4 on other
biota.
Starting from the review of the scientific publications for Romania, a database for 55
hydropower plants situated in various rivers from Romania was created with information related
to the presence and dominance of the fish species from these river reaches in historic reference
time (Bănărescu 1964) and after the construction of the hydropower (upstream and
downstream) (Bănăduc 1999, 2000, 2005, 2006, 2010, Bănăduc, Mărginean, and Curtean-
Bănăduc 2013, Bănăduc et al. 2014, Curtean-Bănăduc, Costea, and Bănăduc 2008, Curtean-
Bănăduc et al. 2014, Davideanu et al. 2006, Florea 2017, Momeu et al. 2007, Momeu et al.
2009, Voicu and Bănăduc 2014, Pricope et al. 2009, Telcean and Cupsa 2015, Ureche, Battes,
and Pricope 2004, Voicu and Merten 2014, Voicu et al. 2016, Voicu et al. 2017). The database
was completed by data provided by personal communication from the experts who published
the mentioned studies (Bănăduc personal communication).
From these 55 HP plants situated in various river types in terms of fish zonation, 32 are situated
in the trout zone after (Bănărescu 1964). For analyses that river type was selected because:
- the sampling methodology was similar in all case studies,
- in this river type other human pressures, as water pollution, bias are less frequent than in
larger streams,
- there is a similar type of micro hydropower plant with diversion which has a installed power
< 10 MW which is commonly installed on the streams in the trout zone.
Recorded dominances of the present fish species were assessed according to (Šorić 1996): ED
- eudominant (> 20% of total fish number), D - dominant (10 - 20%), SD - subdominant (4 –
10%), R - recedent (1 - 3%), SR - subrecedent (< 1%).
For statistical evaluation these dominance were coded into numbers 5 to 1, and the
nonparametric Wilcoxon signed rank test for paired data was applied.
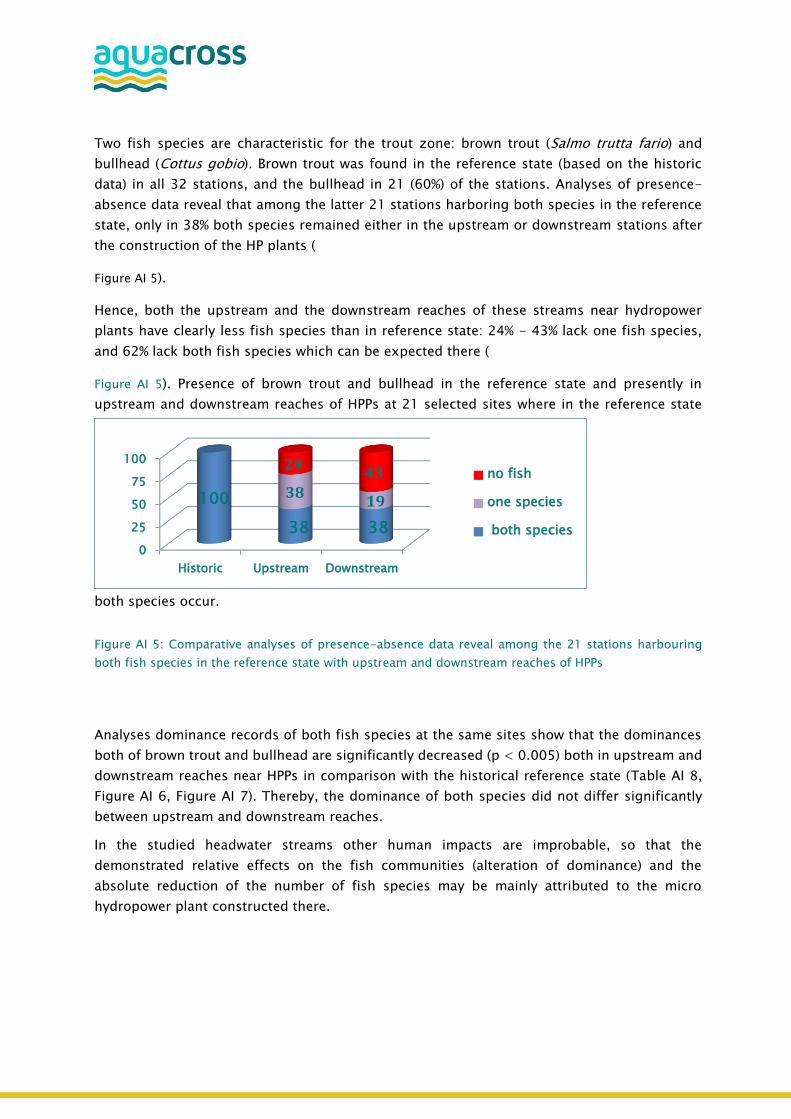
Two fish species are characteristic for the trout zone: brown trout (Salmo trutta fario) and
bullhead (Cottus gobio). Brown trout was found in the reference state (based on the historic
data) in all 32 stations, and the bullhead in 21 (60%) of the stations. Analyses of presence-
absence data reveal that among the latter 21 stations harboring both species in the reference
state, only in 38% both species remained either in the upstream or downstream stations after
the construction of the HP plants (
Figure AI 5).
Hence, both the upstream and the downstream reaches of these streams near hydropower
plants have clearly less fish species than in reference state: 24% - 43% lack one fish species,
and 62% lack both fish species which can be expected there (
Figure AI 5). Presence of brown trout and bullhead in the reference state and presently in
upstream and downstream reaches of HPPs at 21 selected sites where in the reference state
both species occur.
Figure AI 5: Comparative analyses of presence-absence data reveal among the 21 stations harbouring
both fish species in the reference state with upstream and downstream reaches of HPPs
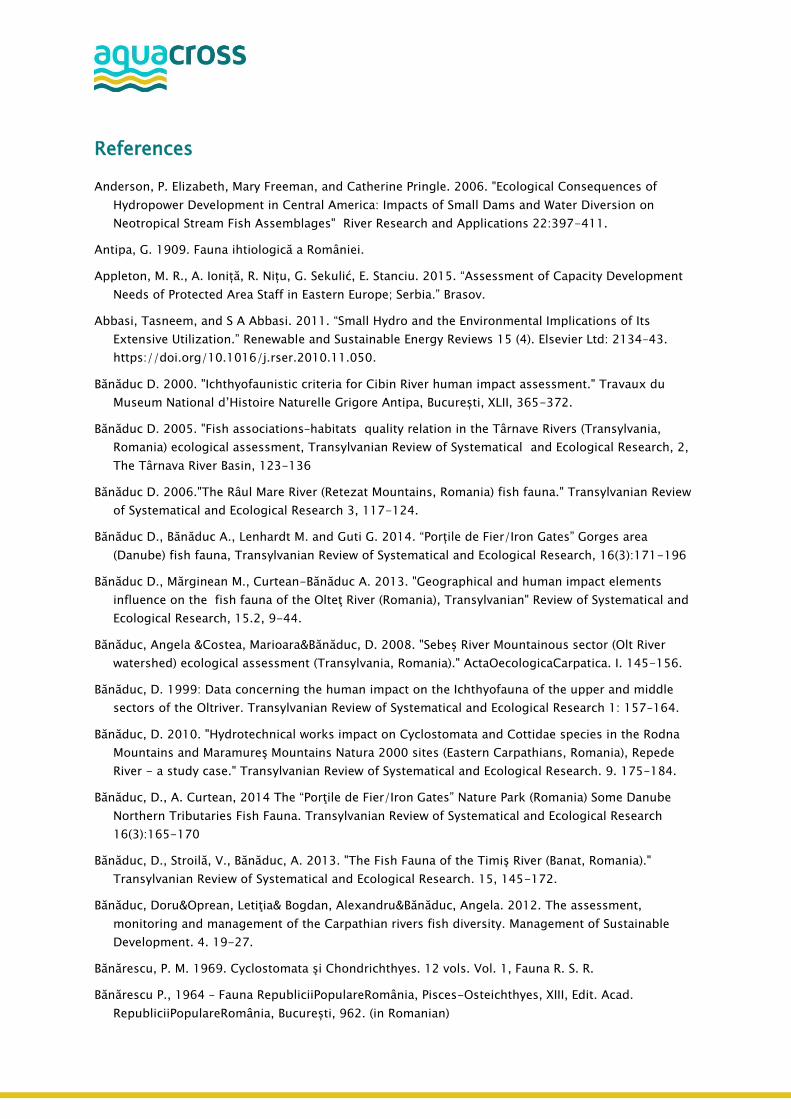
Analyses dominance records of both fish species at the same sites show that the dominances
both of brown trout and bullhead are significantly decreased (p < 0.005) both in upstream and
downstream reaches near HPPs in comparison with the historical reference state (Table AI 8,
Figure AI 6, Figure AI 7). Thereby, the dominance of both species did not differ significantly
between upstream and downstream reaches.
In the studied headwater streams other human impacts are improbable, so that the
demonstrated relative effects on the fish communities (alteration of dominance) and the
absolute reduction of the number of fish species may be mainly attributed to the micro
hydropower plant constructed there.
0
25
50
75
100
Historic Upstream Downstream
100
38 38
3819
2443 no fish
one species
both species

Table AI 8: Wilcoxon signed rank test for paired data on dominance data of Salmo trutta fario and Cottus
gobio
Wilcoxon signed rank test for paired
data Salmo trutta fario Cottus gobio
P value P value
Reference state versus upstream 0.00222 0.000851
Reference state versus downstream 0.0003 0.000186
Upstream versus downstream Not significant Not significant
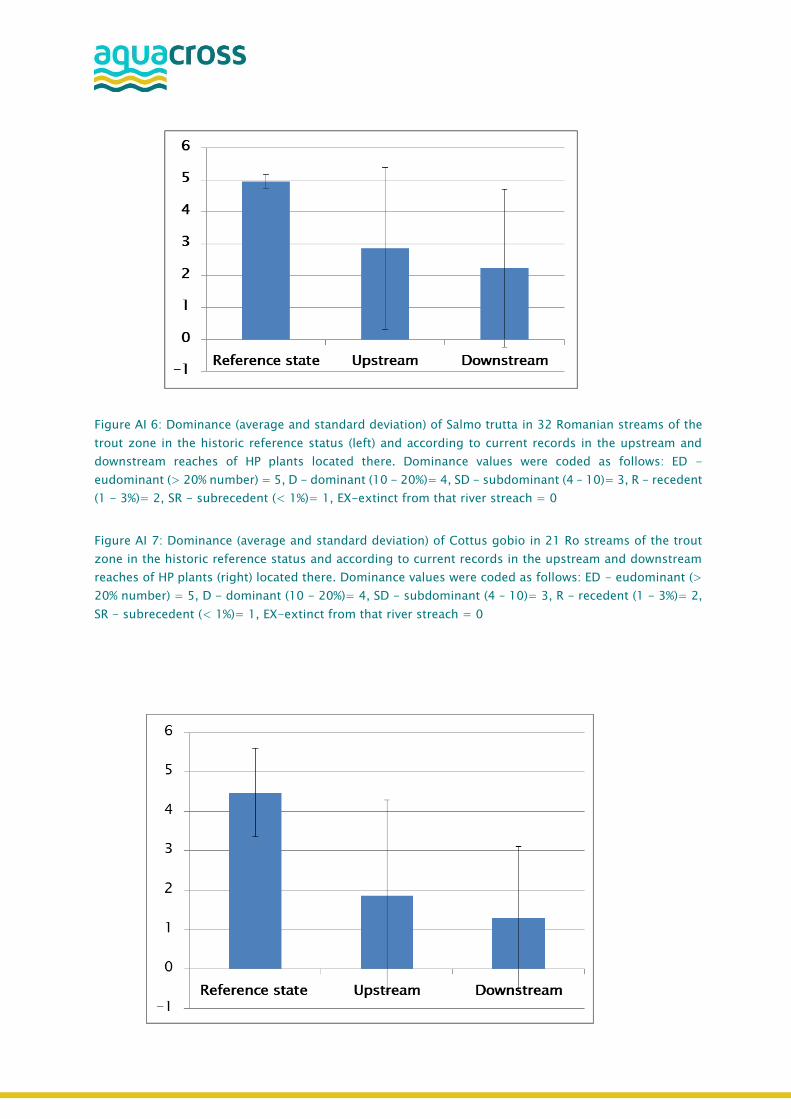
Figure AI 6: Dominance (average and standard deviation) of Salmo trutta in 32 Romanian streams of the
trout zone in the historic reference status (left) and according to current records in the upstream and
downstream reaches of HP plants located there. Dominance values were coded as follows: ED -
eudominant (> 20% number) = 5, D - dominant (10 - 20%)= 4, SD - subdominant (4 – 10)= 3, R - recedent
(1 - 3%)= 2, SR - subrecedent (< 1%)= 1, EX-extinct from that river streach = 0
Figure AI 7: Dominance (average and standard deviation) of Cottus gobio in 21 Ro streams of the trout
zone in the historic reference status and according to current records in the upstream and downstream
reaches of HP plants (right) located there. Dominance values were coded as follows: ED - eudominant (>
20% number) = 5, D - dominant (10 - 20%)= 4, SD - subdominant (4 – 10)= 3, R - recedent (1 - 3%)= 2,
SR - subrecedent (< 1%)= 1, EX-extinct from that river streach = 0
References
Anderson, P. Elizabeth, Mary Freeman, and Catherine Pringle. 2006. "Ecological Consequences of
Hydropower Development in Central America: Impacts of Small Dams and Water Diversion on
Neotropical Stream Fish Assemblages" River Research and Applications 22:397-411.
Antipa, G. 1909. Fauna ihtiologică a României.
Appleton, M. R., A. Ioniță, R. Nițu, G. Sekulić, E. Stanciu. 2015. “Assessment of Capacity Development
Needs of Protected Area Staff in Eastern Europe; Serbia.” Brasov.
Abbasi, Tasneem, and S A Abbasi. 2011. “Small Hydro and the Environmental Implications of Its
Extensive Utilization.” Renewable and Sustainable Energy Reviews 15 (4). Elsevier Ltd: 2134–43.
https://doi.org/10.1016/j.rser.2010.11.050.
Bănăduc D. 2000. "Ichthyofaunistic criteria for Cibin River human impact assessment." Travaux du
Museum National d’Histoire Naturelle Grigore Antipa, București, XLII, 365-372.
Bănăduc D. 2005. "Fish associations–habitats quality relation in the Târnave Rivers (Transylvania,
Romania) ecological assessment, Transylvanian Review of Systematical and Ecological Research, 2,
The Târnava River Basin, 123-136
Bănăduc D. 2006."The Râul Mare River (Retezat Mountains, Romania) fish fauna." Transylvanian Review
of Systematical and Ecological Research 3, 117-124.
Bănăduc D., Bănăduc A., Lenhardt M. and Guti G. 2014. “Porțile de Fier/Iron Gates” Gorges area
(Danube) fish fauna, Transylvanian Review of Systematical and Ecological Research, 16(3):171-196
Bănăduc D., Mărginean M., Curtean-Bănăduc A. 2013. "Geographical and human impact elements
influence on the fish fauna of the Olteţ River (Romania), Transylvanian" Review of Systematical and
Ecological Research, 15.2, 9-44.
Bănăduc, Angela &Costea, Marioara&Bănăduc, D. 2008. "Sebeș River Mountainous sector (Olt River
watershed) ecological assessment (Transylvania, Romania)." ActaOecologicaCarpatica. I. 145-156.
Bănăduc, D. 1999: Data concerning the human impact on the Ichthyofauna of the upper and middle
sectors of the Oltriver. Transylvanian Review of Systematical and Ecological Research 1: 157–164.
Bănăduc, D. 2010. "Hydrotechnical works impact on Cyclostomata and Cottidae species in the Rodna
Mountains and Maramureş Mountains Natura 2000 sites (Eastern Carpathians, Romania), Repede
River - a study case." Transylvanian Review of Systematical and Ecological Research. 9. 175-184.
Bănăduc, D., A. Curtean, 2014 The “Porţile de Fier/Iron Gates” Nature Park (Romania) Some Danube
Northern Tributaries Fish Fauna. Transylvanian Review of Systematical and Ecological Research
16(3):165-170
Bănăduc, D., Stroilă, V., Bănăduc, A. 2013. "The Fish Fauna of the Timiş River (Banat, Romania)."
Transylvanian Review of Systematical and Ecological Research. 15, 145-172.
Bănăduc, Doru&Oprean, Letiţia& Bogdan, Alexandru&Bănăduc, Angela. 2012. The assessment,
monitoring and management of the Carpathian rivers fish diversity. Management of Sustainable
Development. 4. 19-27.
Bănărescu, P. M. 1969. Cyclostomata şi Chondrichthyes. 12 vols. Vol. 1, Fauna R. S. R.
Bănărescu P., 1964 – Fauna RepubliciiPopulareRomânia, Pisces-Osteichthyes, XIII, Edit. Acad.
RepubliciiPopulareRomânia, București, 962. (in Romanian)
Başkaya, Ş, E Başkaya, and Alptuğ Sari. 2011. "The principal negative environmental impacts of small
hydropower plants in Turkey." African Journal of Agricultural Research 6 (14):3284-3290.
Bonacci, Ognjen, Zdenko Tadic, and Dusan Trninic. 1992. “Effects of Dams and Reservoirs on the
Hydrological Characteristics of the Lower Drava River.” Regulated Rivers: Research & Management 7
(4): 349–57. https://doi.org/10.1002/rrr.3450070405.
Bosnia and Herzegovina Government. 2016. “NREAP of Bosnia and Herzegovina.” Sarajevo.
Bunn, Stuart E., and Angela H. Arthington. 2002. “Basic Principles and Ecological Consequences of
Altered Flow Regimes for Aquatic Biodiversity.” Environmental Management 30 (4): 492–507.
https://doi.org/10.1007/s00267-002-2737-0.
Carolli, Mauro, Davide Vanzo, Annunziato Siviglia, Guido Zolezzi, Maria Cristina Bruno, and Knut
Alfredsen. 2015. “A Simple Procedure for the Assessment of Hydropeaking Flow Alterations Applied
to Several European Streams.” Aquatic Sciences 77 (4). Springer Basel: 639–53.
https://doi.org/10.1007/s00027-015-0408-5.
Cernisencu, Irina, Ion Năvodaru, Mircea Staraş, Aurel Nastase, and Mihaela-Laurenta Alexandrov. 2007.
"Study of inland fisheries from Danube Delta – Romania." Scientific Annals of Danube DeIta Institute
13:179-182.
Coady, David, Ian Parry, Louis Sears, and Baoping Shang. 2015. “How Large Are Global Energy
Subsidies?” WP/15/105.
Croatia Government. 2013. “NREAP to 2020.” Zagreb.
Curtean-Bănăduc A. 2014. “Iron Gates” Gorges (Danube River), northern tributaries benthic
macroinvertebrate communities, Transylvanian Review of Systematical and Ecological Research, 16
Curtean-Bănăduc A., Bănăduc D., Ursu L. and Răchită R., 2014 Historical human impact on the Alpine
Capra Stream macroinvertebrates and fish communities (Southern Romanian Carpathians), Acta
Oecologica Carpatica, VII, 111-152
Curtean-Bănăduc, A., O Danci, D Bănăduc, 2015 Eudontomyzondanfordi (Regan, 1911) Species
Populations Ecological Status in Maramureş Mountains Nature Park (Romania).. Transylvanian Review
of Systematical and Ecological Research 17 (2), 139-154
Davideanu G., Miron I., Coman I., Davideanu A. 2006. "Data concerning the fish communities of the
upper part of Bistrița River and tributaries -Romania." Acta Ichtiologica Romanica I, 75-82.
Florea L. 2017. The changes that occured between 2010-2016 in the community interest fish species
from protected area ROSCI0229 Siriu (Romania), Acta Oecologica Carpatica X.II, 87-94.
Gao, Bing, Dawen Yang, Tongtiegang Zhao, and Hanbo Yang. 2012. “Changes in the Eco-Flow Metrics of
the Upper Yangtze River from 1961 to 2008.” Journal of Hydrology 448–449: 30–38.
https://doi.org/10.1016/j.jhydrol.2012.03.045.
Globevnik, Lidija, and Matjaž Mikoš. 2009. “Boundary Conditions of Morphodynamic Processes in the
Mura River in Slovenia.” Catena 79: 265–76. https://doi.org/10.1016/j.catena.2009.06.008.
Griffiths, H I, B Kryštufek, and J M Reed. 2004. Balkan Biodiversity: Pattern and Process in the European
Hotspot. Dordrecht: Kluwer Academic. Slovenia Government. 2010. “NREAP 2010-2020, Slovenia.”
Ljubljana.
Grill, Günther, Bernhard Lehner, Alexander E Lumsdon, Graham K MacDonald, Christiane Zarfl, and
Catherine Reidy Liermann. 2015. “An Index-Based Framework for Assessing Patterns and Trends in

River Fragmentation and Flow Regulation by Global Dams at Multiple Scales.” Environmental
Research Letters 10 (15001): 1–15. https://doi.org/10.1088/1748-9326/10/1/015001.
Khalaf, M., Popa, G.O., Dudu,A., Georgescu, S.E, Bănăduc, D, Costache, M.,2015 Microsatellites
variation in two different populations of Brown trout (Salmo trutta, morphafario, Linnaeus, 1758)
from Făgăraş Mountains, Scientific Papers Animal Science and Biotechnologies 48 (1), 86-89
Liu, H, D Masera, and L Esser, eds. 2013. World Small Hydropower Development Report 2013. Available
from www.smallhydroworld.org: United Nations Industrial Development Organization; International
Center on Small Hydro Power.
Lytle, David A., and N. Le Roy Poff. 2004. “Adaptation to Natural Flow Regimes.” Trends in Ecology and
Evolution 19 (2): 94–100. https://doi.org/10.1016/j.tree.2003.10.002.
Magilligan, Francis J., and Keith H. Nislow. 2005. “Changes in Hydrologic Regime by Dams.”
Geomorphology 71 (1–2): 61–78. https://doi.org/10.1016/j.geomorph.2004.08.017.
Meile, T., J. L. Boillat, and A. J. Schleiss. 2011. “Hydropeaking Indicators for Characterization of the
Upper-Rhone River in Switzerland.” Aquatic Sciences 73 (1): 171–82.
https://doi.org/10.1007/s00027-010-0154-7.
Montenegro Government. 2014. “NREAP to 2020, Montenegro.”
Momeu L., Battes K. W., Pricope F., Avram A., Battes K. P., Cîmpean M., Ureche D., Stoica I. 2007.
"Preliminary data on algal, macroinvertebrate and fish communities from the Arieş catchment area,
Transylvania, Romania."Studia Universitatis Babeş - Bolyai, Biologia, LII, 1, 25 - 36.
Momeu L., Battes K., Battes K., Stoica I., Avram A., Cîmpean M., Pricope F., Ureche D. 2009."Algae,
macroinvertebrate and fish communities from Arieş River catchment area (Transylvania, Romania)."
Transylvanian Review of Systematical and Ecological Research 7, 149-180. *Curtean-Bănăduc D. and
Bănăduc D. personal data.
Morita, Kentaro, and Akira Yokota. 2002. "Population viability of stream-resident salmonids after
habitat fragmentation: A case study with white-spotted charr (Salvelinus leucomaenis) by an
individual based model" Ecological Modelling 155:85-94.
Nechifor, R., Popa, G., Samu, M., Dudu, A., Bănăduc, D., Costache, M., Georgescu, S., 2017. The Genetic
Profiles of two Salmonid Populations from Romania Obtained through Nuclear Markers Analysis.
Scientific Papers Animal Science and Biotechnologies 50, no. 1, 74-78.
N2K 2015.European Economic Interest Group. Guidance document on hydropower development and
Natura 2000.THE N2K GROUP, 4th draft, https://circabc.europa.eu
Ovidio, Michaël, Frédéric Paquer, Hervé Capra, Francis Lambot, Pierre [ Gérard, Etienne Dupont, and
Jean-Claude Philippart. 2004. "Effects of a micro hydroelectric power plant upon population
abundance, mobility and reproduction behaviour of European grayling T. thymallus and brown trout
S. trutta in a salmonid river in Garcia de Jalon D. and Vizcaino Martinez " Fifth International
Symposium on Ecohydraulics, Aquatic Habitats: Analysis and Restoration, Madrid, Spain.
Popa, G.-O., Curtean-Bănăduc, A., Bănăduc, D., Florescu, I. E., Burcea, A., Dudu, A., Georgescu, S. E.,
and Costache, M., Molecular markers reveal reduced genetic diversity in Romanian populations of
brown trout, Salmo trutta L., 1758 (Salmonidae), ActaZoologicaBulgarica, 2016, 68(3), 399-406.
Popa, G.O., Khalaf, M., Dudu, A., Curtean-Bănăduc, A., Bănăduc, D., Georgescu, S.E., Costache, M.,
Brown trout’s populations genetic diversity using mitochondrial markers in relatively similar
geographical and ecological conditions – A Carpathian case study, Transylvanian Review of
Systematical and Ecological Research, 2013, 15(2), 125-132.
Pricope F., Stoica I., Battes K. W., Ureche D., Milca P. 2009. "Ichthyofauna status in the catchment areas
of the rivers from theApuseni Mountains Natural Park."StudiişiCercetări, Biologie, 17, 86-94
Republic of Serbia Government. 2013. “NREAP of the Republic of Serbia.” Belgrade.
Šorić, V. 1996: IhthiofaunarekeGruže, pritokeZapadneMorave (Dunavskisliv) I. Reproduktivni potencija
lvrsta, Leuciscus cephalus, Alburnus alburnu,s Rutilus rutilus. Ichthyologia, Beograd, 28(1): 1-14.
Stakėnas, S., and K. Skrupskelis. 2009. " Impact of small hydro-power plants on salmonid fishes
spawning migrations." Mokslas–Lietuvos Ateitis 1 (4):80-85.
Scheidegger, Karl J, and Mark B Bain. 1995. “Larval Fish Distribution and Microhabitat Use in Free-
Flowing and Regulated Rivers.” Copeia 1: 125–35.
Slovenia Government. 2010. “NREAP 2010-2020, Slovenia.” Ljubljana.
Telcean I., Cupşa D. 2015. "Captive populations of fishes in the Crişul Repede River (Tisa River Basin)",
Pisces Hungarici 9, 75-80.
Ureche D., Battes K.W., Pricope F., Stoica I. 2004. "Prospective monitoring of fish communities from
Buzău River basin" Analele Stiintifice, Univ. Al.I. Cuza Iasi, s. Biologie animala, Tom L, 229-241
Vaikasas, Saulius, Nijole Bastiene, and Virginija Pliuraite. 2015. "Impact of small hydropower plants on
physicochemical and biotic environments in flatland riverbeds of Lithuania." Journal of Water Security
1:1-13.
Voicu R., Bănăduc D. 2014. Restoring longitudinal connectivity of the Someşul Mic River near the dam in
Mănăstirea Village (Transylvania, Romania), Acta Oecologica Carpatica VII, 153-172.
Voicu R., Merten E., 2014. Creating a system for upstream – downstream fish migration over the first
and the second discharge sills downstream of Mănăștur Dam on the Someșul Mic River, Cluj-Napoca,
Transylvania, Romania), Transylvanian Review of Systematical and Ecological Research, The Wetlands
Diversity, 16.2, 163-182.
Voicu R., Miles K., Sotir R.,Curtean-Bănăduc A., Bănăduc D. 2016."Proposing a technical solution for
restoring longitudinal connectivity in the Brădeni/Retiş."Transylvanian Review of Systematical and
Ecological Research, The Wetlands Diversity. 18.1:57-68.
Voicu R., Voicu L., Curtean-Bănăduc A., Bănăduc D. 2017."Restoring the fish fauna connectivity of the
Hârtibaciu River–Retiș Dam study case (Transylvania, Romania).”, Environmental Science Journals:
Acta oecologica carpatica X.II, vol. 10 (2): 73-86.
Vogel et al. 2007 Gao, Yongxuan, Richard M. Vogel, Charles N. Kroll, N. LeRoy Poff, and Julian D. Olden.
2009. “Development of Representative Indicators of Hydrologic Alteration.” Journal of Hydrology 374
(1–2): 136–47.
Zhang, Zhenyu, Yaling Huang, and Jinliang Huang. 2016. “Hydrologic Alteration Associated with Dam
Construction in a Medium-Sized Coastal Watershed of Southeast China.” Water 8 (317): 1–18.
https://doi.org/10.3390/w8080317 Zhang et al., 2016a), Richter, Brian D., Jeffrey V. Baumgartner,
Jennifer Powell, and David P. Braun. 1996. “A Method for Assessing Hydrologic Alteration within
Ecosystems.” Conservation Biology 10 (4): 1163–74.
Annex 2: Impact of cyanobacteria blooms on the social-ecological system of the Danube Delta
This chapter summarises the supply and demand side for ecosystem services in the Danube
Delta. Further, a specific analysis was accomplished on the current state of biodiversity
conservation of aquatic ecosystems in the Danube Delta, by engaging stakeholders in the
knowledge, combat or mitigation of eutrophication, climate change and the most visible effects
in surface waters: algal (Cyanobacteria) blooms.
Building the knowledge base of the socio-ecological system
The reference configuration of the Inland Danube Delta–Socio Ecological System based on an
integrated model of socioeconomic biodiversity drivers, pressures and impacts have:
• a high degree of complementarity between local socioeconomic metabolism and major
ecosystem and landscape functions, e.g. over 50% of the region's total supply with resources
and services are delivered by the local natural capital, and less than 10% of the total amount of
energy (high quality energy content of the biomass which reflects the useful work that can be
performed) accumulated by primary producers (NPP) was directly or indirectly diverted towards
humans.
• a strong resilience against local and catchment-wide socioeconomic drivers and pressures
and the hydrological pulse of the Danube river (Haberl H. et. al. 2009).
Despite growing recognition of their societal and ecological importance, deltaic flood plains
are declining worldwide at alarming rates (Tockner K. et al. 2008). Loss of wetland ecosystem
services is strongly related to the climate change and eutrophication, two major anthropogenic
stressors that work dependently to favour cyanobacterial blooms in freshwater bodies (Moss
et al. 2011; Mantzouki et al. 2014).
When it comes to manage the occurrence of this major problem in freshwater ecosystems, the
socio-economic dimensions of cyanobacteria blooms and the benefits of mitigation measures
on ecosystem services in the delta are being totally ignored.
The assessment of Danube delta’s ecosystem services and trends was accomplished under
Norwegian-Romanian cooperation, emphasizing two periods characterized by fundamentally
different socio-political and economic frames: the socialist period (1960-1989) where policies
focused on economic development and the market-economy period where policies shifted
towards ecological restoration after 1990.
The Danube Delta provides critically important services which benefits accrue from local
communities to humanity. In this respect, over 60% of the Delta’s ecosystem services have
declined over the studied period. The socio-economic benefits from ecological restoration
policies are already becoming apparent (***, 2013), but must be improved because of the
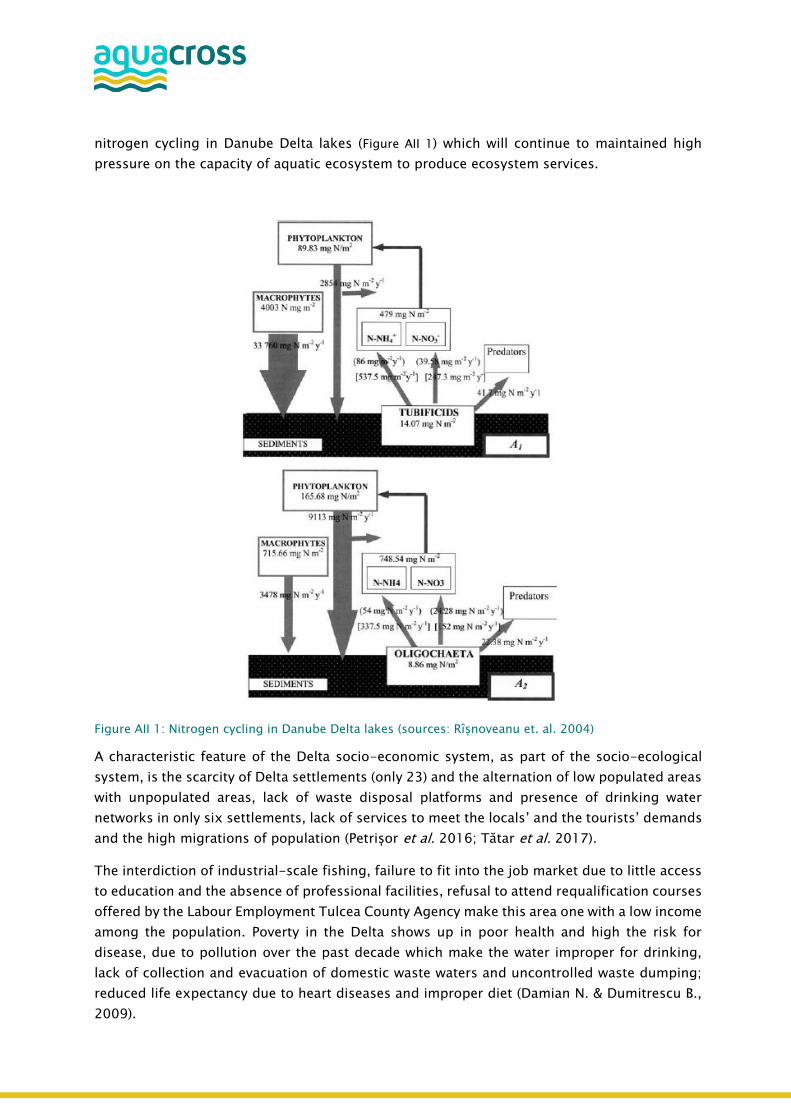
nitrogen cycling in Danube Delta lakes (Figure AII 1) which will continue to maintained high
pressure on the capacity of aquatic ecosystem to produce ecosystem services.
Figure AII 1: Nitrogen cycling in Danube Delta lakes (sources: Rîșnoveanu et. al. 2004)
A characteristic feature of the Delta socio-economic system, as part of the socio-ecological
system, is the scarcity of Delta settlements (only 23) and the alternation of low populated areas
with unpopulated areas, lack of waste disposal platforms and presence of drinking water
networks in only six settlements, lack of services to meet the locals’ and the tourists’ demands
and the high migrations of population (Petrișor et al. 2016; Tătar et al. 2017).
The interdiction of industrial-scale fishing, failure to fit into the job market due to little access
to education and the absence of professional facilities, refusal to attend requalification courses
offered by the Labour Employment Tulcea County Agency make this area one with a low income
among the population. Poverty in the Delta shows up in poor health and high the risk for
disease, due to pollution over the past decade which make the water improper for drinking,
lack of collection and evacuation of domestic waste waters and uncontrolled waste dumping;
reduced life expectancy due to heart diseases and improper diet (Damian N. & Dumitrescu B.,
2009).
Apart from these, there are a small number of local entrepreneurs, with neither the expertise
nor the funds to embark upon the development of local sustainable and eco-friendly ventures.
In the Danube Delta the industrial activities are poorly represented and the private agricultural
production is taking place in various forms: intensive, organic, traditional-primitive for the
subsistence of its inhabit-ants (Lup et al. 2016).
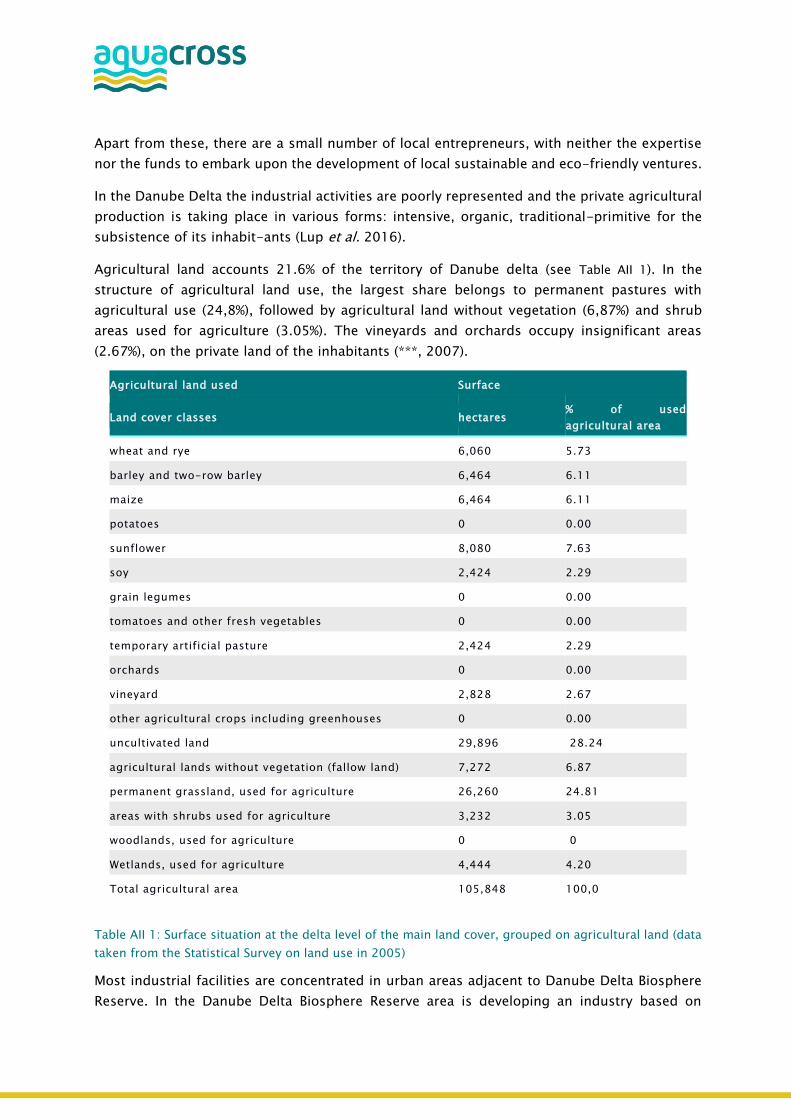
Agricultural land accounts 21.6% of the territory of Danube delta (see Table AII 1). In the
structure of agricultural land use, the largest share belongs to permanent pastures with
agricultural use (24,8%), followed by agricultural land without vegetation (6,87%) and shrub
areas used for agriculture (3.05%). The vineyards and orchards occupy insignificant areas
(2.67%), on the private land of the inhabitants (***, 2007).
Agricultural land used Surface
Land cover classes hectares % of used
agricultural area
wheat and rye 6,060 5.73
barley and two-row barley 6,464 6.11
maize 6,464 6.11
potatoes 0 0.00
sunflower 8,080 7.63
soy 2,424 2.29
grain legumes 0 0.00
tomatoes and other fresh vegetables 0 0.00
temporary artificial pasture 2,424 2.29
orchards 0 0.00
vineyard 2,828 2.67
other agricultural crops including greenhouses 0 0.00
uncultivated land 29,896 28.24
agricultural lands without vegetation (fallow land) 7,272 6.87
permanent grassland, used for agriculture 26,260 24.81
areas with shrubs used for agriculture 3,232 3.05
woodlands, used for agriculture 0 0
Wetlands, used for agriculture 4,444 4.20
Total agricultural area 105,848 100,0
Table AII 1: Surface situation at the delta level of the main land cover, grouped on agricultural land (data
taken from the Statistical Survey on land use in 2005)
Most industrial facilities are concentrated in urban areas adjacent to Danube Delta Biosphere
Reserve. In the Danube Delta Biosphere Reserve area is developing an industry based on
exploitation and valorisation of natural resources, primarily fisheries, agricultural and reed.
(***, 2013)
Aquaculture in the Danube Delta was established in 1961 on an area of 560 ha but due to the
poor results obtained in terms of productivity the development of this sector has declined
significantly. The yield in fish farms is between 100-200 kg/ha, while the yield of the carp
under natural conditions can exceeds 700 kg/ ha (Lup et al. 2016).
Case study specific analysis going beyond: D –P –S Danube Delta
and Co-Design
Danube Delta is facing serious cyanobacteria bloom risks due to eutrophication and climate
change, thus being vulnerable to ecological decline, which also involves challenging issues of
biodiversity conservation, restructuration of the wetlands and improving the human well-
being. Due to the hydro-morphological structure of the delta, to the release of sedimentary
phosphorus and the opportunity of cyanobacteria to use nitrogen from atmosphere as a
nutrient source cyanobacteria have been spread in all available niches (Török et al. 2017).
Further, aggregation of cyanobacteria - concentrated by wind activity - could have high impact
on aquatic biodiversity- considering its potential toxic effect, which increases the risk of toxin
related health problems - in resting or feeding areas of the wildlife protected species if no
action to mitigate their effect is taken.
Hence, the focus of the Danube Delta case study has been co-designed with 24 stakeholders
divided in 6 groups, such as public authorities (12 persons), natural resource management (2
persons), Danube Delta Biosphere reserve authority (1 person), research and education (2
persons), NGO’s (1 person), inspection and environmental control (6 persons). The authorities
were represented by mayors from Local Councils, Tulcea Environmental Protection Agency. The
natural resource management institutions were the Romanian Waters - Dobrogea Water Branch
and Danube Delta Biosphere Reserve Authority, mean-while the research institutions engaged
were National Institute for Marine Research and Development “Grigore Antipa” and National
Institute for Research and Development in electrical Engineering, which is currently developing
and validating viable solutions for the production of biogas from algal biomass in the Danube
Delta Biosphere Reserve in collaboration with Danube Delta National Institute. National
Environmental Guard is a specialized inspection and environmental control body that can take
action to halt or suspend activity as a result of pollution and environmental damage.
This study analysed the perceptions of stakeholders on algal bloom in aquatic systems in the
Danube Delta in order to apprehend potential adaptation and mitigation strategies for the
future, and to highlight what type of political support is required for the adoption of these
measures. The results could be used in other lakes and coastal waters coastal sites to help plan
and mitigate algal blooms in the future.
The participants responded to the designed algal bloom questionnaire through person to
person questionnaire deliveries. Based on used stakeholder expertise was created a draft of

Bow Tie diagram (Figure AII 2) to visualise the cause-control-mitigation measures-
consequences for the phenomena of algal bloom to the aquatic ecosystems in Danube Delta.
Figure AII 2: Bow Tie Diagram of algal bloom in Danube Delta Aquatic Ecosystems
A Bow Tiw diagram consists of a fault tree on the left side identifying the possible events
causing the top event and an event tree on the right side showing the possible consequences
of the top event based on the failure or success of safety barriers (Liu Z, 2017). In our case, the
top event is represented by loss/reduction of aquatic biodiversity due to eutrophication. In the
left side were mentioned the potential causes such as waste water discharges partially
threatened or untreated, lack of water body connectivity, increase in water temperature, factors
which favor the occurrence of algal bloom) and in the right side are the consequences resulting
from the event. The algal bloom problem can result in many interlinking consequences. The
controls measures positioned on the left are the solutions preventing the issue form occurring,
meanwhile the mitigation column represent the measures which should be considered in order
to recover once the event took place. Both control and mitigation measures use a mixture of
legislation, water management plans and changes in behaviour and mentalities in order to
manage the risk. Control and mitigation measures are specific to a certain cause or
consequence and may not be applicable to all of them. In this phase of the analyse there were
not drawn linking lines between these components of the diagram.
The escalation factors can be considered as restrictive ones that can damage the efficiency of
both control and mitigation measures, such as institutional conflicts regarding the ownership
status of water bodies that put barriers to the implementation of control or mitigation
measures.
References
Haberl H., Gaube V., Díaz-Delgado R., Krauze K., Neuner A., Peterseil J., Plutzar C., Singh S. J.,
Vadineanu A., 2009, Towards an integrated model of socioeconomic biodiversity drivers, pressures
and impacts. A feasibility study based on three European long-term socio-ecological re-search
platforms, Ecological Economics 68: 1797 – 1812
Liu Z., LI M. , 2017, Dynamic Medical Risk Assessment based on Bow-tie Approach and Bayesian
Network. In: Qi E., Shen J., Dou R. (eds) Proceedings of the 23rd International Conference on In-
dustrial Engineering and Engineering Management 2016. Atlantis Press, Paris
Lup A., Miron L., Alim I. D., 2016, Danube Delta. Economic Resources, Annals of the Academy of
Romanian Scientists. Series on Agriculture, Silviculture and Veterinary Medicine Sciences, 5(2): 39-46
Mantzouki E., Visser P. M., Bormans M., Ibelings B. W., 2016, Understanding the key ecological traits of
cyanobacteria as a basis for their management and control in changing lakes, Aquatic Ecology, 50
(3): 333-350. https://doi.org/10.1007/s10452-015-9526-3
Moss B., Kosten S., Meerhoff M., Battarbee R. W., Jeppesen E., Mazzeo N., Havens K., Lacerot G., Liu Z.,
De Meester L., Paerl H., Scheffer M., 2011, Allied attack: climate change and eutrophi-cation, Inland
Waters, 1:2, 101-105, https://doi.org/10.5268/IW-1.2.359
Petrișor A.-I., Petre R., Meiţă V., 2016, Difficulties in achieving social sustainability in a biosphere
reserve, International Journal of conservation Sciences 7(1): 123-136
Tătar C.-F., Herman G. V., Dehoorne O., Zarrilli L., 2017, Ecotourism in the Danube Delta, Analele
Universităţii din Oradea, Seria Geografie, Year XXVII, (1), pp. 122-132
Tockner, Klement, Bunn, Stuart E., Gordon, Christopher, Naiman, Robert J., Quinn, Gerry P. and
Stanford, Jack A. 2008, Flood plains : critically threatened ecosystems. In Polunin, Nicholas V.C. (ed),
Aquatic ecosystems : trends and global prospects, Cambridge University Press, New York, N.Y.,
pp.45-61.
Török L., Török Zs. Carstea E.M., Savastru D., 2017. Seasonal Variation of Eutrophication in Some Lakes
of Danube Delta Biosphere Reserve, Water Environment Research 89(1):87, DOI:
10.2175/106143016X14733681696248.
***, 2007, Land Use in 2007, National Institute of Statistics, Bucharest
****, 2013, Comunităţi umane – Patrimoniul cultural şi spiritual al Rezervaţiei Biosferei Delta Dunării,
260 p. Report Phase II / 09 2013 - project No. PN 09 26 01 07 (coord. TÖRÖK Liliana) contract No
26N/ANCS/2009 (INCDDD - Tulcea). Tulcea, Romania.
Annex 3: Analysis of causal linkages for the navigable Danube
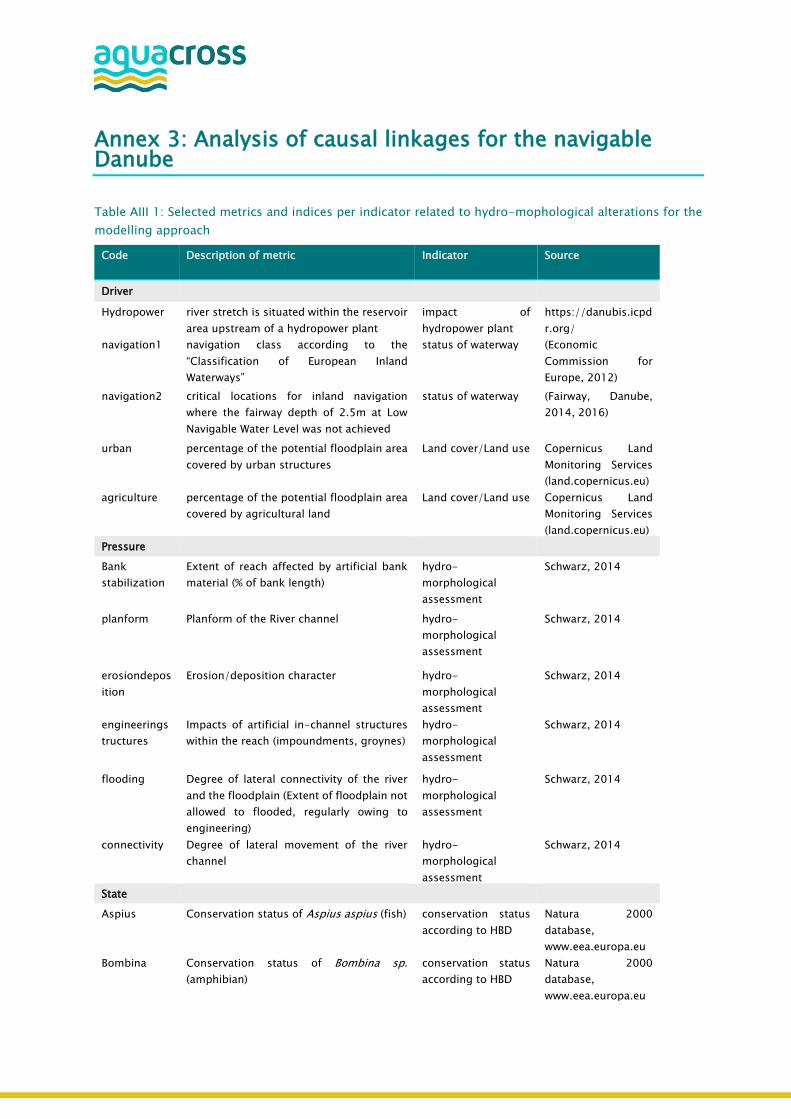
Table AIII 1: Selected metrics and indices per indicator related to hydro-mophological alterations for the
modelling approach
Code Description of metric Indicator Source
Driver
Hydropower river stretch is situated within the reservoir
area upstream of a hydropower plant
impact of
hydropower plant
https://danubis.icpd
r.org/ navigation1 navigation class according to the
“Classification of European Inland
Waterways”
status of waterway (Economic
Commission for
Europe, 2012)
navigation2 critical locations for inland navigation
where the fairway depth of 2.5m at Low
Navigable Water Level was not achieved
status of waterway (Fairway, Danube,
2014, 2016)
urban percentage of the potential floodplain area
covered by urban structures
Land cover/Land use Copernicus Land
Monitoring Services
(land.copernicus.eu)
agriculture percentage of the potential floodplain area
covered by agricultural land Land cover/Land use Copernicus Land
Monitoring Services
(land.copernicus.eu) Pressure
Bank
stabilization Extent of reach affected by artificial bank
material (% of bank length) hydro-
morphological
assessment
Schwarz, 2014
planform Planform of the River channel hydro-
morphological
assessment
Schwarz, 2014
erosiondepos
ition
Erosion/deposition character hydro-
morphological
assessment
Schwarz, 2014
engineerings
tructures Impacts of artificial in-channel structures
within the reach (impoundments, groynes) hydro-
morphological
assessment
Schwarz, 2014
flooding Degree of lateral connectivity of the river
and the floodplain (Extent of floodplain not
allowed to flooded, regularly owing to
engineering)
hydro-
morphological
assessment
Schwarz, 2014
connectivity Degree of lateral movement of the river
channel hydro-
morphological
assessment
Schwarz, 2014
State
Aspius Conservation status of Aspius aspius (fish) conservation status
according to HBD
Natura 2000
database,
www.eea.europa.eu
Bombina Conservation status of Bombina sp.
(amphibian) conservation status
according to HBD Natura 2000
database,
www.eea.europa.eu
Gymnocephal
us_bal
Conservation status of Gymnocephalus
schraetzer(fish)
conservation status
according to HBD
Natura 2000
database,
www.eea.europa.eu
Gymnocephal
us_sch Conservation status of Gymnocephalus
baloni (fish) conservation status
according to HBD Natura 2000
database,
www.eea.europa.eu
Lutra Conservation status of Lutra lutra
(mammal)
conservation status
according to HBD
Natura 2000
database,
www.eea.europa.eu
Misgurnus Conservation status of Misgurnus fossilis
(fish) conservation status
according to HBD Natura 2000
database,
www.eea.europa.eu Rhodeus Conservation status of Rhodeus amarus
(fish)
conservation status
according to HBD
Natura 2000
database,
www.eea.europa.eu
Triturus Conservation status of Triturus dobrogicus
(amphibian)
conservation status
according to HBD
Natura 2000
database,
www.eea.europa.eu
Zingel_st Conservation status of Zingel streber (fish) conservation status
according to HBD Natura 2000
database,
www.eea.europa.eu
Zingel_zi Conservation status of Zingel zingel (fish) conservation status
according to HBD Natura 2000
database,
www.eea.europa.eu
Haliaeetus Population status of Haliaeetus albicilla
(bird) population
according to HBD Natura 2000
database,
www.eea.europa.eu Alcedo Population status of Alcedo atthis (bird) population
according to HBD
Natura 2000
database,
www.eea.europa.eu
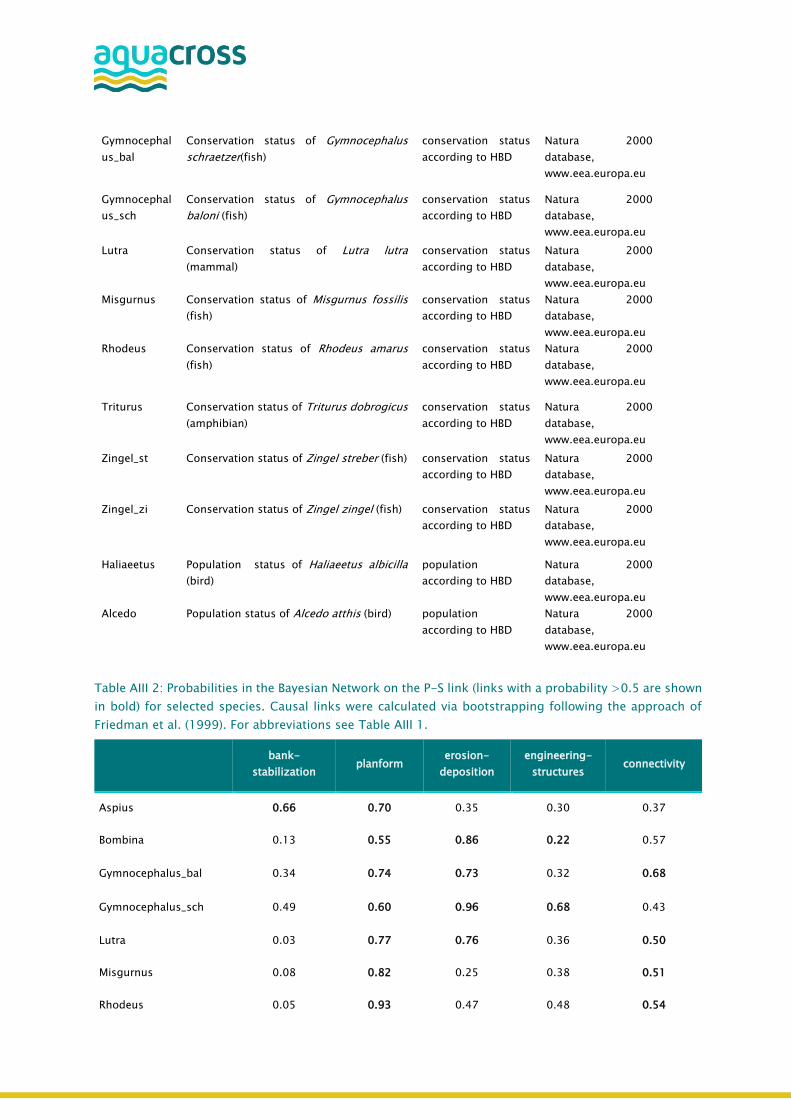
Table AIII 2: Probabilities in the Bayesian Network on the P-S link (links with a probability >0.5 are shown
in bold) for selected species. Causal links were calculated via bootstrapping following the approach of
Friedman et al. (1999). For abbreviations see Table AIII 1.
bank-
stabilization planform
erosion-
deposition
engineering-
structures connectivity
Aspius 0.66 0.70 0.35 0.30 0.37
Bombina 0.13 0.55 0.86 0.22 0.57
Gymnocephalus_bal 0.34 0.74 0.73 0.32 0.68
Gymnocephalus_sch 0.49 0.60 0.96 0.68 0.43
Lutra 0.03 0.77 0.76 0.36 0.50
Misgurnus 0.08 0.82 0.25 0.38 0.51
Rhodeus 0.05 0.93 0.47 0.48 0.54

Triturus 0.18 0.65 0.89 0.48 0.50
Zingel_st 0.25 0.73 0.51 0.18 0.37
Zingel_zi 0.06 0.83 0.78 0.65 0.55
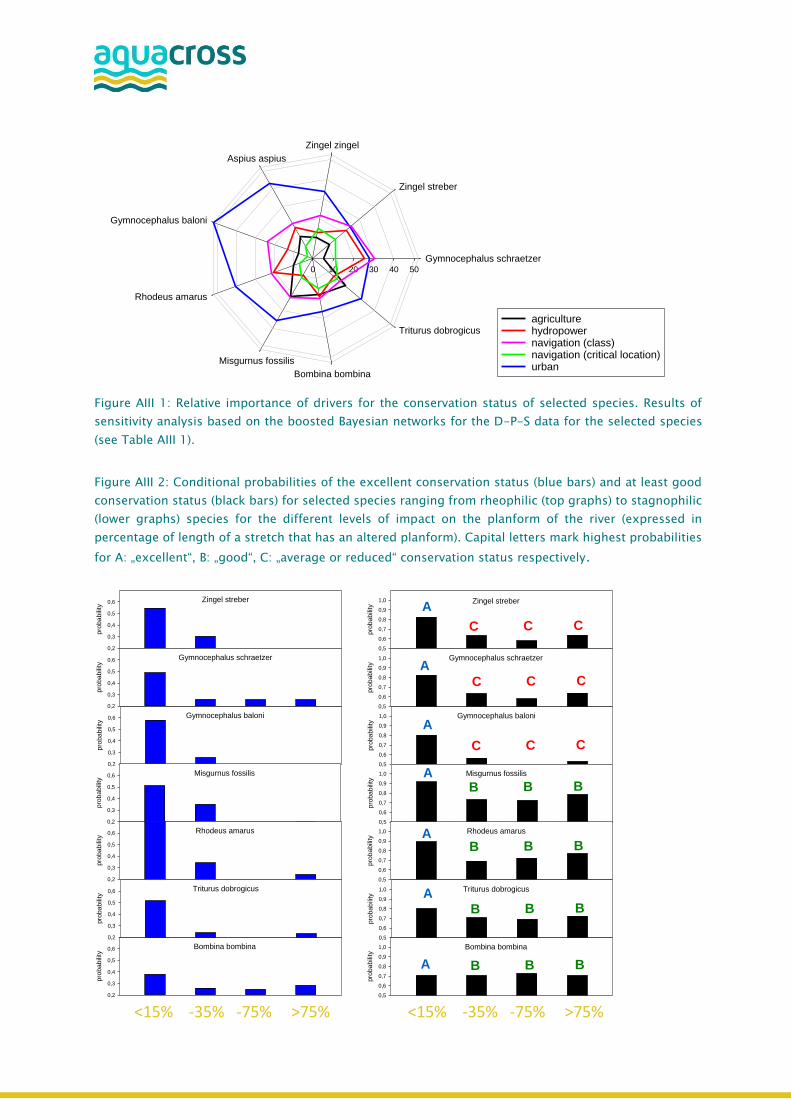
Figure AIII 1: Relative importance of drivers for the conservation status of selected species. Results of
sensitivity analysis based on the boosted Bayesian networks for the D-P-S data for the selected species
(see Table AIII 1).
Figure AIII 2: Conditional probabilities of the excellent conservation status (blue bars) and at least good
conservation status (black bars) for selected species ranging from rheophilic (top graphs) to stagnophilic
(lower graphs) species for the different levels of impact on the planform of the river (expressed in
percentage of length of a stretch that has an altered planform). Capital letters mark highest probabilities
for A: „excellent“, B: „good“, C: „average or reduced“ conservation status respectively.
Gymnocephalus schraetzer
Zingel streber
Zingel zingel
Aspius aspius
Gymnocephalus baloni
Rhodeus amarus
Misgurnus fossilis
Bombina bombina
Triturus dobrogicus
0 10 20 30 40 50
agriculturehydropower
navigation (critical location)urban
navigation (class)
Bombina bombina
pro
bab
ility
0,5
0,6
0,7
0,8
0,9
1,0
Gymnocephalus baloni
pro
bab
ility
0,5
0,6
0,7
0,8
0,9
1,0
Zingel streber
1,5 2,0 2,5 3,0 3,5 4,0 4,5 5,0 5,5
pro
bab
ility
0,5
0,6
0,7
0,8
0,9
1,0
Misgurnus fossilis
pro
bab
ility
0,5
0,6
0,7
0,8
0,9
1,0
Gymnocephalus schraetzer
pro
bab
ility
0,5
0,6
0,7
0,8
0,9
1,0
Rhodeus amarus
pro
bab
ility
0,5
0,6
0,7
0,8
0,9
1,0
Triturus dobrogicus
pro
bab
ility
0,5
0,6
0,7
0,8
0,9
1,0
C C C
C C C
C C C
B B B
B B B
B B B
B B B
A
A
A
A
A
A
A
- -
Bombina bombina
pro
ba
bili
ty
0,2
0,3
0,4
0,5
0,6
Gymnocephalus baloni
pro
ba
bili
ty
0,2
0,3
0,4
0,5
0,6
Zingel streber
1,5 2,0 2,5 3,0 3,5 4,0 4,5 5,0 5,5
pro
ba
bili
ty
0,2
0,3
0,4
0,5
0,6
Misgurnus fossilis
pro
ba
bili
ty
0,2
0,3
0,4
0,5
0,6
Gymnocephalus schraetzer
pro
ba
bili
ty
0,2
0,3
0,4
0,5
0,6
Rhodeus amarus
pro
ba
bili
ty
0,2
0,3
0,4
0,5
0,6
Triturus dobrogicus
pro
ba
bili
ty
0,2
0,3
0,4
0,5
0,6
- -
Contact
Coordinator Duration Website
LinkedIn ResearchGate
Dr. Manuel Lago, Ecologic Institute 1 June 2015 to 30 November 2018 http://aquacross.eu/
@AquaBiodiv
www.linkedin.com/groups/AQUACROSS-8355424/about https://goo.gl/IcdtZC
AQUACROSS PARTNERS
Ecologic Institute (ECOLOGIC) | Germany
Leibniz Institute of Freshwater Ecology and Inland
Fisheries (FVB-IGB) | Germany
Intergovernmental Oceanographic Commission
of the United Nations Educational, Scientific and
Cultural Organization (IOC-UNESCO) | France
Wageningen Marine Research (WMR) | Netherlands
University of Natural Resources & Life Sciences,
Institute of Hydrobiology and Aquatic Ecosystem Management
(BOKU) | Austria
Fundación IMDEA Agua (IMDEA) | Spain
Universidade de Aveiro (UAVR) | Portugal
ACTeon – Innovation, Policy, Environment
(ACTeon) | France
University of Liverpool (ULIV) | United Kingdom
University College Cork, National University
of Ireland (UCC) | Ireland
Royal Belgian Institute of Natural Sciences
(RBINS) | Belgium
Stockholm University, Stockholm Resilience
Centre (SU-SRC) | Sweden
Danube Delta National Institute for Research
& Development (INCDDD) | Romania
Eawag – Swiss Federal Institute of Aquatic
Science and Technology (EAWAG) | Switzerland
International Union for Conservation of Nature
(IUCN) | Belgium
BC3 Basque Centre for Climate Change
(BC3) | Spain