annex i. case studies - mercy corps · annex i. case studies case study ......
TRANSCRIPT
Annex 1 : Case Study : Chennai, India A 1
ANNEX I. CASE STUDIES Case Study. Chennai, India
PART I
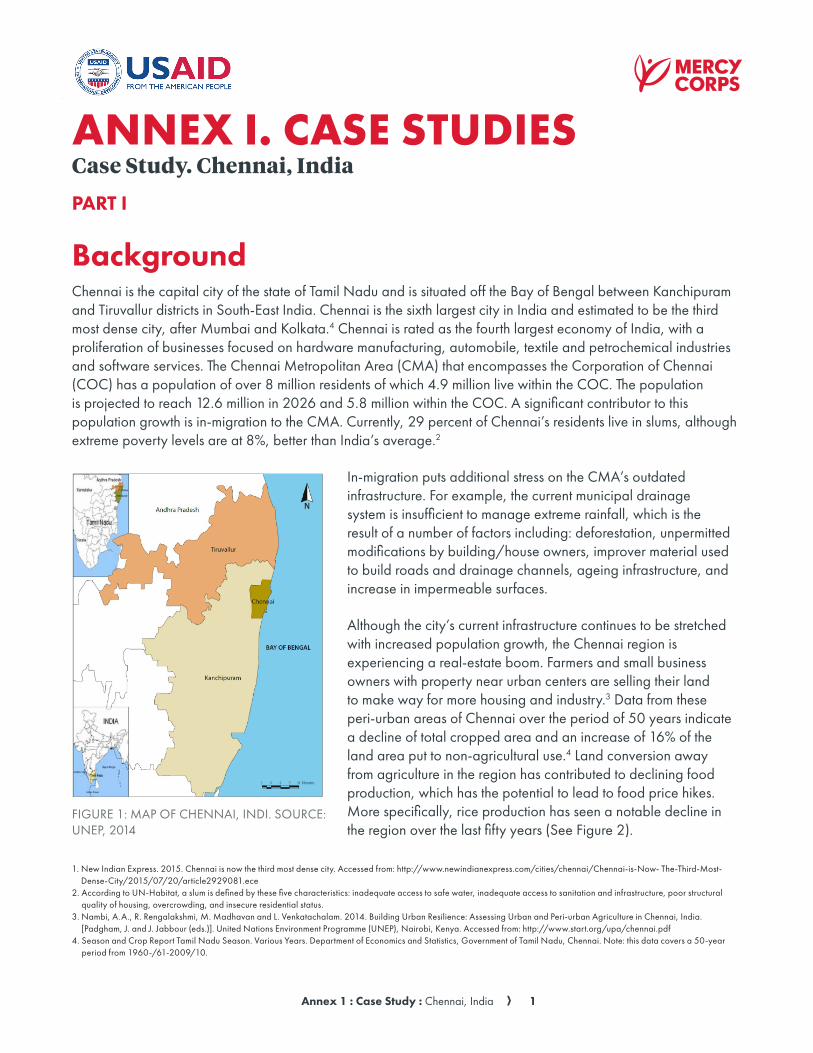
BackgroundChennai is the capital city of the state of Tamil Nadu and is situated off the Bay of Bengal between Kanchipuram and Tiruvallur districts in South-East India. Chennai is the sixth largest city in India and estimated to be the third most dense city, after Mumbai and Kolkata.4 Chennai is rated as the fourth largest economy of India, with a proliferation of businesses focused on hardware manufacturing, automobile, textile and petrochemical industries and software services. The Chennai Metropolitan Area (CMA) that encompasses the Corporation of Chennai (COC) has a population of over 8 million residents of which 4.9 million live within the COC. The population is projected to reach 12.6 million in 2026 and 5.8 million within the COC. A significant contributor to this population growth is in-migration to the CMA. Currently, 29 percent of Chennai’s residents live in slums, although extreme poverty levels are at 8%, better than India’s average.2
In-migration puts additional stress on the CMA’s outdated infrastructure. For example, the current municipal drainage system is insufficient to manage extreme rainfall, which is the result of a number of factors including: deforestation, unpermitted modifications by building/house owners, improver material used to build roads and drainage channels, ageing infrastructure, and increase in impermeable surfaces.
Although the city’s current infrastructure continues to be stretched with increased population growth, the Chennai region is experiencing a real-estate boom. Farmers and small business owners with property near urban centers are selling their land to make way for more housing and industry.3 Data from these peri-urban areas of Chennai over the period of 50 years indicate a decline of total cropped area and an increase of 16% of the land area put to non-agricultural use.4 Land conversion away from agriculture in the region has contributed to declining food production, which has the potential to lead to food price hikes. More specifically, rice production has seen a notable decline in the region over the last fifty years (See Figure 2).
FIGURE 1: MAP OF CHENNAI, INDI. SOURCE: UNEP, 2014
1. New Indian Express. 2015. Chennai is now the third most dense city. Accessed from: http://www.newindianexpress.com/cities/chennai/Chennai-is-Now- The-Third-Most-Dense-City/2015/07/20/article2929081.ece
2. According to UN-Habitat, a slum is defined by these five characteristics: inadequate access to safe water, inadequate access to sanitation and infrastructure, poor structural quality of housing, overcrowding, and insecure residential status.
3. Nambi, A.A., R. Rengalakshmi, M. Madhavan and L. Venkatachalam. 2014. Building Urban Resilience: Assessing Urban and Peri-urban Agriculture in Chennai, India. [Padgham, J. and J. Jabbour (eds.)]. United Nations Environment Programme (UNEP), Nairobi, Kenya. Accessed from: http://www.start.org/upa/chennai.pdf
4. Season and Crop Report Tamil Nadu Season. Various Years. Department of Economics and Statistics, Government of Tamil Nadu, Chennai. Note: this data covers a 50-year period from 1960-/61-2009/10.
Annex 1 : Case Study : Chennai, India A 2
The water demand for Chennai City exceeds the supply available within the current infrastructure. The Tamil Nadu Water Supply and Drainage Board (TWDA Board) supplies 645 million liter per day of the 848 million liter per day needed for the existing population, of which the city’s main water supply sources are from the Red Hills and Chembarambakkam Lakes. In order to fulfill the 200 million liter per day deficit, groundwater is used. There are an estimated 6,500 deep agricultural bore wells within the city, which the private sector has capitalized on. Water from these wells is purchased to deliver, at a cost, to residents in the city. Water has become an increasingly burdensome cost for some of the poorest populations living in the slums of Chennai where the free water supply is often only available for short periods of the day.5
GovernanceThe Chennai Metropolitan Development Authority is a government agency responsible for coordinating planning and development across Chennai. However, the CDMA suffers from internal conflict of interest and competing mandates, including from the Tamil Nadu Water Supply and Drainage Board. In practice, as wards and towns expand across the metropolitan area, infrastructure is developed without proper consideration of watershed functions and natural drainage pathways. Additionally, funds provided to government programs are often mismanaged. This is largely attributed to power dynamics within the city that prevent transparency and accountability for use of public funds. Information is often kept at the higher levels of the bureaucratic chain and not easily accessible. Compounding this problem is limited representation from the urban poor in decision-making at the government level even though 40 percent of the COC budget is allocated for projects and programs for the slums. Despite these shortcomings, the authorities in Chennai, following the 2004 Tsunami, have put greater emphasis on disaster management while a City Master Plan is under development.
Shocks and StressesWith rapid urban growth, the residents of Chennai are increasingly vulnerable to greater pollution, coastal erosion and seawater intrusion. They are also highly susceptible to the effects of climate change and frequent extreme weather effects.6 Of note, the 2015 floods in Chennai resulted in over 300 deaths, 1.8 million displaced individuals, and at least $3 billion in damages and losses.7 Small and medium size enterprise (SME) owners were particularly affected as many struggled to recover their businesses after losing key assets, and connections to their supply chains and clients. The occurrence of such flooding is expected to increase as rainfall increases. Yearly precipitation is projected to rise from 1.6 to 4.0 percent by 2020 and will continue to increase over the next several decades. From 2040 to 2070, annual rainfall is estimated to increase 70mm; in the period from 2070 to 2100 to about 90mm.8 Stagnant floodwater also poses a risk to the health of people as it becomes a breeding ground for both communicable and vector-borne diseases.
Further, studies show that due to climate change cyclonic disturbances surrounding the Indian Ocean during summer monsoon are likely to be more intense with greater frequency over the Bay of Bengal than in the Arabian Sea. Temperatures are also expected to increase by 1.1 degree Celsius in 2040 and 3.4 degree Celsius in 2100. The time period most effected by temperature rise is from March to May, with areas in the North-Eastern and Western districts of Tamil Nadu experiencing heat stress most drastically.
Storm surges are also predicted to raise the sea-level along the Bay of Bengal, leading to greater coastal erosion and structural damage. Sea-level is predicted to rise from 1.1 to 1.25m by 2100 on the Tamil Nadu coast. A one meter sea-level rise implies an inundation of 1091 sq km for that area. Seawater inundation along with rapid groundwater depletion will result in increased salinization of groundwater sources.9 This has the potential to not only
5. Technische Universitaet Dortmund. 2014. Urban resilience and adaptation to climate change in Chennai, India. Accessed from: http://www.igcs-chennai.org/wp-content/uploads/2015/01/Final-Report_F04-Chennai_2014_TU-Dortmund_Urban-Resilience.pdf
6. Nambi, A.A., R. Rengalakshmi, M. Madhavan and L. Venkatachalam. 2014 7. OKAPI. 2016. Chennai Overview. 8. Technische Universitat Dortmund. 2014.

Annex 1 : Case Study : Chennai, India A 3
impact coastal aquifers but also has devastating effects on coastal agriculture and fisheries, and in turn, impact food security in the region. Overall, it is estimated that sea-level rise will result in economic losses of around $8.8 billion.10
Increasing water scarcity driven at least partly by rapid immigration and demand for water is a major stress. This has led to groundwater sources being degraded and depleted at an alarming rate, leading to greater water scarcity as an increasing number of bore-wells become non-functional.11 One study has shown that groundwater level in Chennai dropped from 3.8m to 4.2m cubic liters in the span of one year.12 The overexploitation of groundwater has also resulted in increased salinity of the aquifers from saltwater intrusion along the coastal areas of Chennai.13
TABLE 1 PROVIDES A BRIEF OVERVIEW OF SHOCKS AND STRESSES THAT ARE PREDICTED TO IMPACT VULNERABILITY DUE TO CLIMATE CHANGE. SOURCE: INSTITUTE OF DEVELOPMENT STUDIES14
Vulnerable AreasThe Climate Disaster and Resilience Initiative has conducted research on the administrative zones within the COC. Results indicate that citizens living in the slum areas in the North and in the older, densely populated zones in the center are often more vulnerable. These zones have a greater potential to be exposed to natural disasters such as storms, drought, heat waves, and floods.15 Slum dwellers in Chennai are particularly vulnerable because slums are located in areas that are environmentally hazardous and lack protective infrastructure. Many of these slums are in low-lying coastal zones and thus, increasingly vulnerable to sea-level rise, extreme weather events, and flooding.
Finally, micro, small and medium enterprise owners, and those who work in such firms, are vulnerable in Chennai. First, many of Chennai’s small businesses in old industrial zones are located closer to water bodies that pose the risk of flooding. SMEs are particularly vulnerable to asset loss or operational disruption due to extreme weather events. This causes a disruption in supply chains, a decline of production and finally loss of key clients that are difficult to reestablish, particularly without adequate insurance to speed recovery. As a result, many collapse, and thus leave households dependent for them on employment even more vulnerable.
9. Ibid.10. Bryavan et al. 2010. ‘The Impact of Sea Level Rise on Infrastructure, Ecosystem and Land along the Tamil Nadu Coast’, Centre for Development Finance (CDF), IFMR and
Humanities and Social Sciences, IIT Madras (published online 2011).11. Nambi, A.A., R. Rengalakshmi, M. Madhavan and L. Venkatachalam. 2014.12. State Ground and Surface Water Resource Data Centre. Note: Data if from the first quarter in 2006 to the first quarter in 2007.13. Roa, S.V.N, Saheb, S.M. and Ramasastri, KS. 2004. Aquifer restoration from seawater intrusion: A preliminary field scale study of the Minjur Aquifer System, North of Chen-
nai, tamilnadu, India. 8-SWIM. Cartagena, Spain. Eds. Araguas, Custodio and Manzano. IGME.14. Tanner, T.M., Mitchell, T., Polack, E., and Guenther, B. 2008.15. Technische Universitat Dortmund. 2014.
City Existing Hazards Examples of Predicted Future Risk Exacerbating Factors
Slow onset Increase in frequency or intensity of
Chennai • Slum Expansion
• Extreme Precipitation
•Cyclones
•Landslides
• Floods Tsunami
• Land price hikes
Heat zones/hotspots •Flooding
•Cyclone
•Disease
•Soil salinity
• Depletion of aquifers and water scarcity
• Water supply contamination (due to proximity to degraded sewage pipes)
• Unauthorized construction
• Encroachment of settlements onto low-lying areas close to water bodies

Annex 1 : Case Study : Chennai, India A 4
Case Study. Chennai, India
PART IIIn order to address Chennai’s resilience deficit, a number of donors, civil society organizations and other development institutions are partnering with communities and the government to take on the challenge. Given the devastation of the 2015 floods, a local organization in Chennai is partnering closely with the government and the private sector to help address flood risk. The particular focus of the program is to protect SMEs from future flooding, and thus increase the resilience of the vast city population that depends on these. In addition to partnering with government officials and institutions, the organization also closely works with the Tamil Nadu Small and Tiny Industries Associatio. (TANSITA and the Guindy Insturial Estate) and Ambattur Estate Industrial Manufacturer’s Association (AEIMA).
The local organization is working with the government to mobilize a multi-stakeholder platform for mapping the city’s vulnerabilities using a multi-sector, systems approach. Initial closed-door consultations with senior public sector officials have motivated the government to gather more systematic scientific evidence that can further incentivize multi-stakeholder collaboration. It was agreed upon that as a starting point, data pertaining to components such as water flows and land use functions must be consolidated, to clearly enumerate and define problems that require action. Plans are in place to support the Chennai City Development Authority, an overarching body at least in part responsible for the city’s development of regional map that visualizes water flows, natural and manmade drainage systems, tanks, etc. Technical expertise and a system for tracking this information systematically over time is critical.
A sound system for improved data collection on water levels and flows is insufficient. The data must also be used to improve zoning, and inform future investment in infrastructure and any city development plans. New development needs to be in compliance with drainage regulations, and green space that helps absorb excess run off must be allocated. The data must also inform zoning off of appropriate land for industry that benefits business but minimizes additional risks to the City. The government should incentivize small firms to relocate from highly vulnerable areas along the river bed, to more appropriate industry zones that pose less risk to the business, allow them to maintain cost effective access to supply chains without exacerbating flood risk in other parts of the metropolitan zone. The government also has to improve its processes for approving business licences and permits that would help SME owners relocate to cheaper, less risk-prone, private estates or clusters.
There is also a critical need to work with the private sector to build the capacity of SMEs to protect themselves from various risks linked to natural disasters. Not only should the availability of appropriate insurance products for business increase, insurance service providers need improved systems for tracking and assessing damage to speed insurance pay outs. Banks and microfinance institutions can provide business with access to a recovery stimulation package following a severe event. Working with Micro-Finance Institutions (MFIs) and banks to permit deferred payment for loans can give businesses time to recover without going further into debt. Disaster liquidity mechanisms that allow financial institutions to lend to others can ensure banks and MFIs have enough cash flow to meet the needs of their clients following disasters. At the same time, businesses must incorporate the costs of floods, water scarcity and other risks into their overall business operational models. Businesses can take steps to protect critical assets from flood events simply by improving building infrastructure and storage. Working with business associations to increase awareness and build capacity of small and medium enterprises for improved risk mitigation is critical.
Ensuring the application of more sound urban development plans and policies will require citizens and small businesses associations to better organize, advocate, and hold the government accountable to meet improved development standards. The city risk assessment discussed above must be shared not just with metropolitan
Annex 1 : Case Study : Chennai, India A 5
authorities, but also at the ward-level with local government and communities. Local organizations should use the data to identify neighbourhood-level projects for flood risk reduction, particularly in slum areas, but also to advocate for appropriate risk reduction measures be carried out outside of their administrative zone. For example, ward councillors and community-based organizations should be encouraged to work together on implementing local storm water drainage systems in their own community, but these can easily be undermined if poor coordination across administrative boundaries continues to unnecessarily channel excess run off into particular neighbourhoods.
Neighbourhood associations can also work together to increase awareness around the need for improved sanitation and solid waste management practices that pollute the limited water supply and increase the risk of diseases. Mobilizing civic engagement by engaging young people in water, sanitation and waste management campaigns provides one entry-point. This can also be taken forward through community-driven awareness campaigns and through private service provider models for solid waste collection. There is precedent that community-based action can have impact. For example, a community initiative in the South of Chennai implemented a rain water harvesting scheme that has raised ground water levels over the span of 4 years.16 Improved awareness and valuation of risks can help drive the willingness for households to pay for services. Finally, neighbourhood associations can serve as an entry point for better disaster preparedness. Every household should be aware of minimal measures it can take to reduce potential losses following floods. Evacuation routes must be established. Ward councillors can be directly connected to city level disaster management services through simple technology.
16. Tanner, T.M., Mitchell, T., Polack, E., and Guenther, B. 2008.

Annex 2 : Case Study : Semarang, Indonesia A 6
ANNEX 2. CASE STUDIES Case Study. Semarang, Indonesia
PART I
BackgroundSemarang is a large port city whose economic base is related to its strategic position as Central Java’s principal gateway for exports and imports. It has grown dramatically in recent years and attracts migrants from throughout Java and beyond. Its economic base includes agro-industry and manufacturing, as well as a sizeable shrimp farming and fishing industry that has been affected by degradation of the marine environment. The city is characterized by its lush lowlands dotted with Dutch colonial buildings and dense urban neighborhoods. It is also home to mangrove forests that are vital to the health of its coastal areas and livelihoods of its people.
Currently, Semarang city has a population of approximately 1.8 million inhabitants within its 16 districts. The population is expected to grow at an annual rate of 1.41 percent. Of the 1.5 inhabitants, 78,000 are considered extremely poor, a rate of 4.3 percent. Despite this low poverty rate, housing, water, and drainage infrastructure to support Semarang’s growing population is largely inadequate. The city does not have the capacity to sufficiently supply water to its residents, to properly dispose of all the waste, and to provide for adequate sanitation systems. Currently, public water companies can produce 196,000,000 liters/
day and still require another 53,000,000 liters/day to meet the needs of the population. This does not account for the water needs of industry and agro-processing. Ground water is also over-used, which has in turn caused land subsidence and overflow of sea water onto land in the coastal areas.
Compounding the water problem is a waste management challenge. The city is only capable of disposing approximately 90% of all the waste produced. This has consequences for the health of the population. Additionally, insufficient drainage systems during the rainy season, combined with solid waste management services, coupled with poor waste management behaviour, lead to greater flooding in certain areas of the city.
The extent and quality of public services in Semarang are not evenly spread between the city’s neighbourhoods, nor within them. For example, with respect to health there seem to be much greater incidences of health issues such as malaria and dengue in areas where standing water and sanitation are problems but where there is also little access to medical services. Many households contend with the multiple convergent challenges of expensive and poor access to water, immersion in standing water as well as poor quality health care available.
FIGURE 1 MAP OF SEMARANG, INDONESIA. SOURCE: WORLD ATLAS
Annex 2 : Case Study : Semarang, Indonesia A 7
The Indonesian government is well resourced, but has a service delivery problem. At the city level, collaboration in Semarang is stunted among government agencies and civil and private sector actors. Budgeting and city planning rarely extended beyond five years, and short election cycles have made long-term planning difficult. City department officials work in silos, and few are aware of the need for coordination amongst institutions. This has led to city plans being incongruent, as decisions around water management, for example, are often made independently of decisions around city zoning or infrastructure development. Traditionally, the government has not had strong mechanisms or incentives for
collaboration, and city development decisions are often controlled by political elites. Landscape level analysis, or basic scientific information about drainage patterns, groundwater levels, soil types and erosion rates, for example is not easily accessible. Even where it is, it is not synthesized in a manner that motivates government collaboration and decision-making.
Shocks and StressesThe city’s temperature has been increasing over the last 100 years, with a cumulative increase of 1.0 degree Celsius in the dry season and 0.4 degree Celsius in the wet season. It is predicted that the temperature will continue to increase between 0.5-0.7 degree Celsius in 2025; between 1.1-1.2 degree Celsius in 2050; and 1.9-2.9 degree Celsius in 2100.
Changes in temperature will have an impact on precipitation intensity. In Semarang, rainfall data from the last 100 years shows a general increase in wet days and rainfall intensity during the wet season. This gives rise to greater probability of floods in the region. In contrast, the number of wet days is decreasing in the dry season, placing Semarang in a flood-drought cycle, with water scarcity being a major concern in the dry season both for household consumption and for industry. High levels of ground water extraction have led to land subsidence in parts of the city, where entire neighbourhoods are slowly sinking into the ground. Ultimately, increased rainfall not only leads to flooding and greater seawater inundation, but also has the potential to increase the risk of landslides along the city’s hillsides, particularly following a dry spell.
In addition to contributing to challenges of water scarcity, droughts have a particularly devastating effect on harvests in the city’s peripheries, often increasing in-migration and demand for temporary labor. This depresses wages, but also puts additional pressure on the city as government is unable to meet the growing demand of informal settlers.
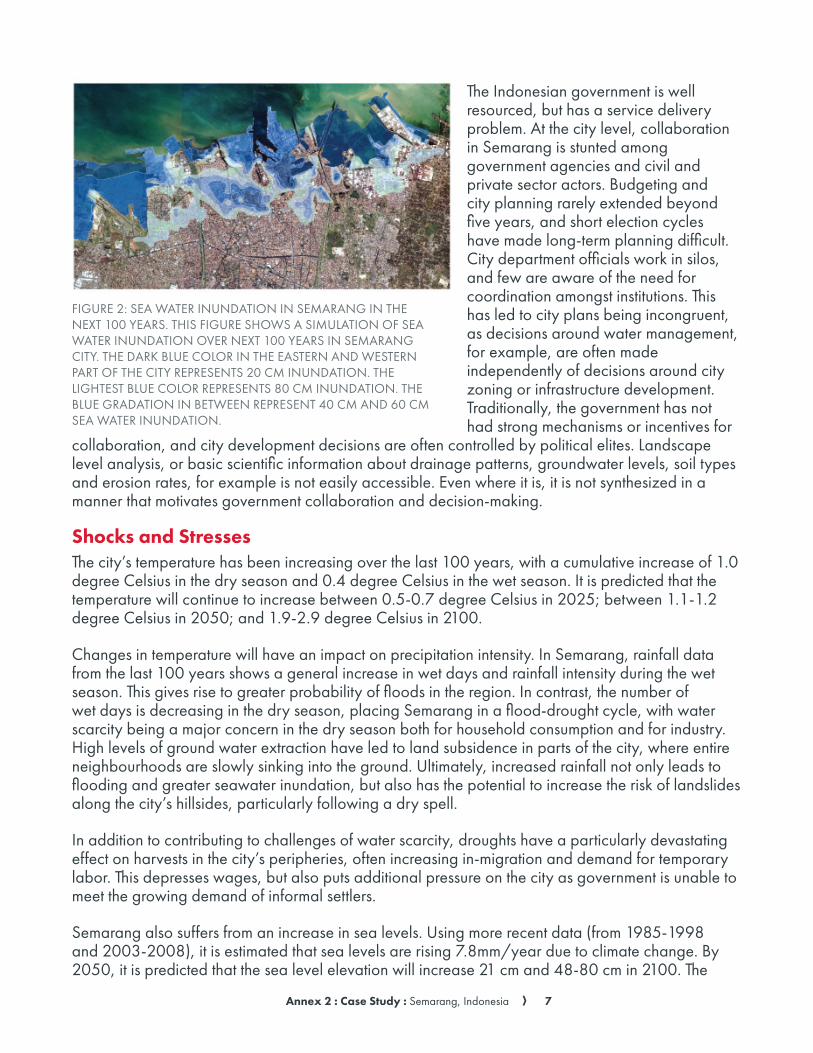
Semarang also suffers from an increase in sea levels. Using more recent data (from 1985-1998 and 2003-2008), it is estimated that sea levels are rising 7.8mm/year due to climate change. By 2050, it is predicted that the sea level elevation will increase 21 cm and 48-80 cm in 2100. The
FIGURE 2: SEA WATER INUNDATION IN SEMARANG IN THE NEXT 100 YEARS. THIS FIGURE SHOWS A SIMULATION OF SEA WATER INUNDATION OVER NEXT 100 YEARS IN SEMARANG CITY. THE DARK BLUE COLOR IN THE EASTERN AND WESTERN PART OF THE CITY REPRESENTS 20 CM INUNDATION. THE LIGHTEST BLUE COLOR REPRESENTS 80 CM INUNDATION. THE BLUE GRADATION IN BETWEEN REPRESENT 40 CM AND 60 CM SEA WATER INUNDATION.

Annex 2 : Case Study : Semarang, Indonesia A 8
most serious physical impacts of sea level rise are coastal erosion, inundation and displacement of wetlands and lowlands, increased coastal storm flooding and damage, and increased salinity of estuaries and aquifers. Salinization and land conversion in catchment areas is contributing to potable water scarcity. The development of industrial zones and ponds for shrimp farming has destroyed much of the protective mangroves along Semarang’s coastline, increasing its vulnerability to coastal flooding and tidal waves. Ecosystem degradation is a severe problem, and many of the shrimp ponds can no longer operate.
The impact of shocks and stresses is wide reaching. They have damaging effects on livelihoods, infrastructure, health, and the economy of Semarang. Vector-borne diseases such as dengue fever and malaria are an increasing threat to the population.
Vulnerable Areas and PopulationIn the vulnerability analysis, the following were identified as the post vulnerable geographies and populations:
• Lowland regions which are exposed to coastal flood and sea level rise – within them, coastal fishing communities living at or close to sea level.
• Communities along urban rivers are adversely affected during the rainy season by flash flooding
Hazard Most Affected Sectors
Other Areas Affected Most Vulnerable Groups
Key Issues that worsen impact
Flooding due to Sea Level Rise
•Fisheries
•Small industries
•Transportation
•Housing
•Tourism
•Agriculture
•Fishery port
•Public service
•Unemployment
• City revenue tends to decrease
•Worsening sanitation
•Salinization
• People dependent on fisheries
•Driver
•Women
•Entrepreneur
•Farmer
• Poor waste management
• Lack of good drainage, infrastructure
Coastal Erosion
•Fisheries
•Resource: electricity
•Tourism
•Economy
• Environment (Mangrove areas destroyed)
•Residence along the coast
• People dependent on fisheries
•Fisherman
• People dependent on tourism
• Structural transformation
•Land tenure
•Jobless
• Increase of operational fishery
• Decrease of revenue
Drought •Agriculture •Health
•Industry
•Forestry
•Housing
•Poor people
•Entrepreneur
•Farmers
•Salinization
•Clean water supply
• Lack of early warning system
• Structural transformationLandslide •Housing •Transportation • Poor people
FIGURE 3. SUMMARY OF MOST PROMINENT CLIMATE-RELATED SHOCKS AND STRESSES.
Annex 2 : Case Study : Semarang, Indonesia A 9
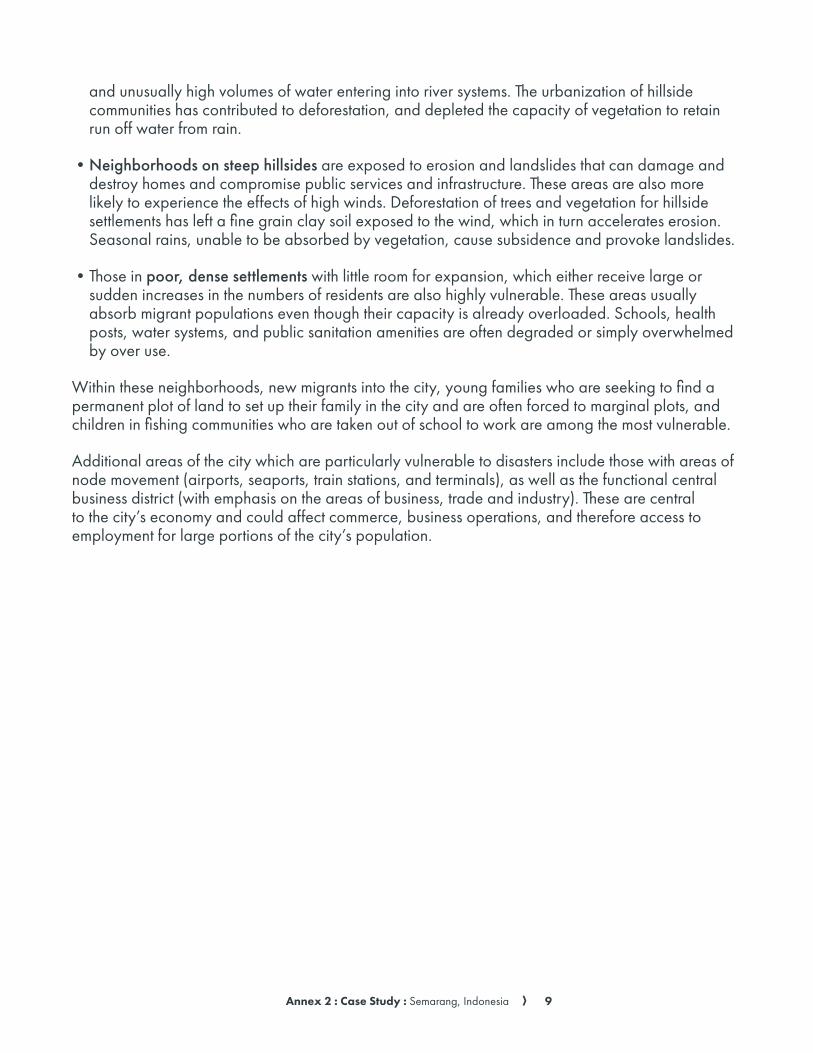
and unusually high volumes of water entering into river systems. The urbanization of hillside communities has contributed to deforestation, and depleted the capacity of vegetation to retain run off water from rain.
• Neighborhoods on steep hillsides are exposed to erosion and landslides that can damage and destroy homes and compromise public services and infrastructure. These areas are also more likely to experience the effects of high winds. Deforestation of trees and vegetation for hillside settlements has left a fine grain clay soil exposed to the wind, which in turn accelerates erosion. Seasonal rains, unable to be absorbed by vegetation, cause subsidence and provoke landslides.
• Those in poor, dense settlements with little room for expansion, which either receive large or sudden increases in the numbers of residents are also highly vulnerable. These areas usually absorb migrant populations even though their capacity is already overloaded. Schools, health posts, water systems, and public sanitation amenities are often degraded or simply overwhelmed by over use.
Within these neighborhoods, new migrants into the city, young families who are seeking to find a permanent plot of land to set up their family in the city and are often forced to marginal plots, and children in fishing communities who are taken out of school to work are among the most vulnerable.
Additional areas of the city which are particularly vulnerable to disasters include those with areas of node movement (airports, seaports, train stations, and terminals), as well as the functional central business district (with emphasis on the areas of business, trade and industry). These are central to the city’s economy and could affect commerce, business operations, and therefore access to employment for large portions of the city’s population.
Annex 2 : Case Study : Semarang, Indonesia A 10
Case Study. Semarang, Indonesia
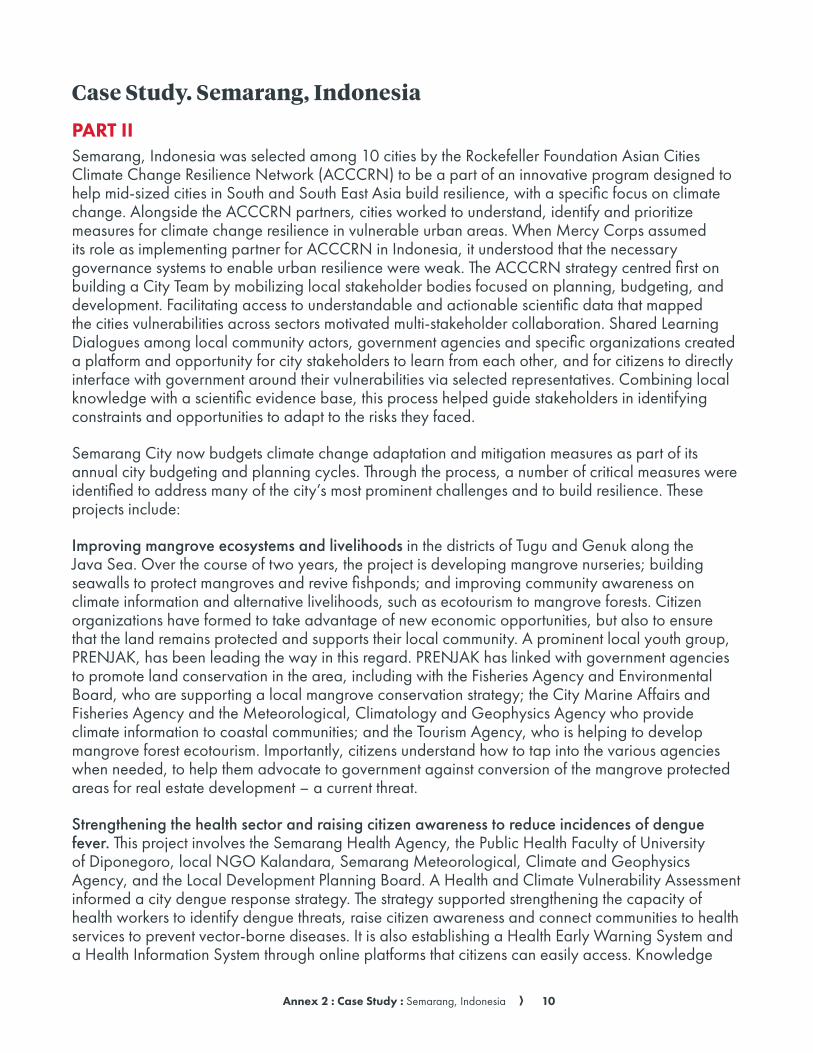
PART IISemarang, Indonesia was selected among 10 cities by the Rockefeller Foundation Asian Cities Climate Change Resilience Network (ACCCRN) to be a part of an innovative program designed to help mid-sized cities in South and South East Asia build resilience, with a specific focus on climate change. Alongside the ACCCRN partners, cities worked to understand, identify and prioritize measures for climate change resilience in vulnerable urban areas. When Mercy Corps assumed its role as implementing partner for ACCCRN in Indonesia, it understood that the necessary governance systems to enable urban resilience were weak. The ACCCRN strategy centred first on building a City Team by mobilizing local stakeholder bodies focused on planning, budgeting, and development. Facilitating access to understandable and actionable scientific data that mapped the cities vulnerabilities across sectors motivated multi-stakeholder collaboration. Shared Learning Dialogues among local community actors, government agencies and specific organizations created a platform and opportunity for city stakeholders to learn from each other, and for citizens to directly interface with government around their vulnerabilities via selected representatives. Combining local knowledge with a scientific evidence base, this process helped guide stakeholders in identifying constraints and opportunities to adapt to the risks they faced.
Semarang City now budgets climate change adaptation and mitigation measures as part of its annual city budgeting and planning cycles. Through the process, a number of critical measures were identified to address many of the city’s most prominent challenges and to build resilience. These projects include:
Improving mangrove ecosystems and livelihoods in the districts of Tugu and Genuk along the Java Sea. Over the course of two years, the project is developing mangrove nurseries; building seawalls to protect mangroves and revive fishponds; and improving community awareness on climate information and alternative livelihoods, such as ecotourism to mangrove forests. Citizen organizations have formed to take advantage of new economic opportunities, but also to ensure that the land remains protected and supports their local community. A prominent local youth group, PRENJAK, has been leading the way in this regard. PRENJAK has linked with government agencies to promote land conservation in the area, including with the Fisheries Agency and Environmental Board, who are supporting a local mangrove conservation strategy; the City Marine Affairs and Fisheries Agency and the Meteorological, Climatology and Geophysics Agency who provide climate information to coastal communities; and the Tourism Agency, who is helping to develop mangrove forest ecotourism. Importantly, citizens understand how to tap into the various agencies when needed, to help them advocate to government against conversion of the mangrove protected areas for real estate development – a current threat.
Strengthening the health sector and raising citizen awareness to reduce incidences of dengue fever. This project involves the Semarang Health Agency, the Public Health Faculty of University of Diponegoro, local NGO Kalandara, Semarang Meteorological, Climate and Geophysics Agency, and the Local Development Planning Board. A Health and Climate Vulnerability Assessment informed a city dengue response strategy. The strategy supported strengthening the capacity of health workers to identify dengue threats, raise citizen awareness and connect communities to health services to prevent vector-borne diseases. It is also establishing a Health Early Warning System and a Health Information System through online platforms that citizens can easily access. Knowledge

Annex 2 : Case Study : Semarang, Indonesia A 11
and behavioural change around the use of nets and clearing areas of stagnant water is targeted through schools, youth campaigns and community networks.
Improving preparedness and response to flash and tidal floods in five sub-districts along the Beringin Drainage Subsystem, one of the city’s most vulnerable areas. Over 35 months, this project strengthened community and local government preparedness by developing flood information systems, early warning systems, and evacuation strategies, as well as identifying temporary shelters for the most vulnerable. The project’s model can be potentially used by the City Disaster Management Board for city-wide disaster preparedness, and may also be replicated in other cities in Indonesia. A key feature of the system is connecting trained community representatives to city-level disaster response services, as well as connecting upstream and downstream citizens to inform each other of rising river levels. The program has also implemented rainwater gauges for monitoring water-levels that can easily be maintained and observed by citizens to warn them of impending floods.

Annex 3 : Case Study : Batangas, Philippines A 12
ANNEX 3. CASE STUDIES Case Study. Batangas, Philippines
PART I
The Strengthening Urban Resilience for Growth with Equity (SURGE)1 is a five-year project aimed to foster the development of conditions for broad-based, inclusive and resilient economic growth in second-tier cities in the surrounding areas outside of Metro Manila, Cebu, and Davao.
The four key areas under SURGE include:
1. Strengthening local capacity in inclusive and resilient urban development, including the promotion of disaster risk reduction (DRR) and climate change adaptation and ensuring access to sustainable water supply and sanitation services;
2. Promoting low-emission local economic development strategies together with streamlined administrative and regulatory procedures and improving infrastructure and transport systems;
3. Expanding economic connectivity and access between urban and rural areas;
4. Strengthening multi-sectorial capacity to provide health and other basic services to ensure social inclusion.2
These activities are in support of USAID/Philippines’ Cities Development Initiative (CDI) whose “whole government” partnership between the United States and the Philippines is aimed to shift the Philippines to a sustained and more inclusive growth trajectory. Through the above activities, SURGE intends to promote second-tier cities as engines of growth to support urban resilience as well as growth for adjacent rural areas. Having an urban-led development strategy can address problems that afflict the Philippines like unemployment, economic concentration, and uneven income distribution. This is particularly urgent where a pronounced urban-rural divide and a high-concentration of growth like in areas surrounding Manila have left much of the country lagging in prosperity.3 The cities under the SURGE project include: Batangas City south of Manila, Iloilo in the Visayas region and Cagayan de Oro in the Northern Mindanao region.
BackgroundMetro Manila, Cebu, and Davao have the largest economies in the Philippines but the country’s second-tier cities are quickly emerging as engines of economic growth and development. Thus, there is growing focus on these cities to help drive the country’s economy which has stalled in recent years. Despite having impressive average annual Gross Domestic Product (GDP) growth rate of seven percent from 2011 to 2013, unemployment and under-employment remain high, at around seven and 20 percent, respectively.4 The national poverty level has also remained relatively flat. This combined effect is often described as “hollow” or “jobless” growth.
Income inequity, according to national statistics, also show that while the top 20 percent of Filipinos make up more than half of the nation’s total income, the bottom 20 percent only make up six percent. This disparity further showcases that although economic gains have been made in the Philippines, most Filipinos have not benefited from it.
1. USAID Philippines. 2015. “Strengthening Urban Resilience for Growth with Equity (SURGE) Project.” Partnership for Growth. Final Factsheet. October.

Annex 3 : Case Study : Batangas, Philippines A 13
Batangas Batangas Province is located in the Calabarzon region in the western island of Luzon. Its capital, Batangas City, is located on the coast where more than 73 percent of the land is on slopes.2 The area is considered an important site for the practice of the Tagalog language as a key cultural and historical center.
Its close proximity to Manila, the presence of historical heritage sites and volcanoes, and beaches makes tourism a prominent industry for this coastal area. Agriculture also plays an important role with the production of a number of crops: palay, corn, coconut, mango, and banana. Livestock production in the area includes primarily chicken, but also cattle, goat, duck, and the carabao water buffalo.3 The area’s energy industries have made Batangas Province an industrial port of the region and a competitive hub for the Philippines. It hosts oil refineries and a coal power station,4 both of which have caused controversy over environmental risks due to oil spills and coal-induced damages.5
With a 2.24 percent annual growth rate (2000-2010), Batangas Province is expected to double in population in 31 years (as of 2013).6 The most recent population data indicates that of the 2,377,395 residents, more than 32 percent live in urban areas. From 2000 to 2010, urban areas have grown at a faster pace than rural areas in Batangas.7
Coastal areas are particularly vulnerable to climate change impacts due to their exposure to sudden shocks and to prolonged stresses. A paper done on the impacts of climate change hazards on coastal communities found that the hazards in the Batangas area include sea level rise and coastal erosion.8 This area is also particularly affected by typhoons, storm surges, flooding, and sea encroachment inland. It’s important to note that there is a greater risk due to the confluence of multiple shocks and stresses over time and the devastating consequences these have on households and communities.9
Additionally, Ramirez et al. have found a number of confounding environmental issues in relation to the hazards in the Batangas area. These include:
A sand quarrying;
A illegal charcoal making using mangroves and other species;
A illegal fishing using blasting and cyanide (non-resident), and
A use of fine mesh net and superlight in fishing10
These confounding factors are believed to further aggravate climate change: sand quarrying hastened coastal erosion, illegal fishing was a confounding factor to sea level rise and on declining fish populations, and coal production has led to decreased mangrove areas.11
2. Ranada, P. 2014. “Batangas port industry threatened by climate change.” Rappler News. 18 January. Accessed at: http://www.rappler.com/nation/48232-batangas-climate-adaptation-study
3. Philippine Statistics Authority, Republic of the Philippines. 2016. Quickstat Batangas – Monthly Update of Most Requested Statistics. April.4. Batangas Provincial Information Office. 2013. Batangas City. Accessed on 18 May 2016 at: http://www.batangas.gov.ph/index.php/about-us/2nd-district/batangas-city 5. CNN Philippines. 2016. “Chevron PH confirms oil leak in Batangas refinery.” 4 February. Accessed at: http://cnnphilippines.com/news/2016/02/03/chevron-oil-spill-
leak-batangas-refinery.html6. Philippine Statistics Authority, Republic of the Philippines. 2013. “Population of Batangas reached 2.4 Million (Results from the 2010 Census of Population and Housing).”
Accessed on 18 May, 2016 at: https://psa.gov.ph/content/population-batangas-reached-24-million-results-2010-census-population-and-housing#sthash.cImFhH2l.dpuf 7. Philippine Statistics Authority, Republic of the Philippines. 2016. Quickstat Batangas – Monthly Update of Most Requested Statistics. April. 8. Ramirez, P. J. B.R., Arias, J. K. B., Dipasupil, S. R., Perez , M. L., Regoniel , P.A., Sajise, A. J. U., and Zamora G. J. N.d. Impacts Of Climate Hazards And Adaptation In
Selected Coastal Areas In The Philippines.9. Ramirez, P. J. B.R., Arias, J. K. B., Dipasupil, S. R., Perez , M. L., Regoniel , P.A., Sajise, A. J. U., and Zamora G. J. N.d. Impacts Of Climate Hazards And Adaptation In
Selected Coastal Areas In The Philippines. 10. Ibid. Page 9.
Annex 3 : Case Study : Batangas, Philippines A 14
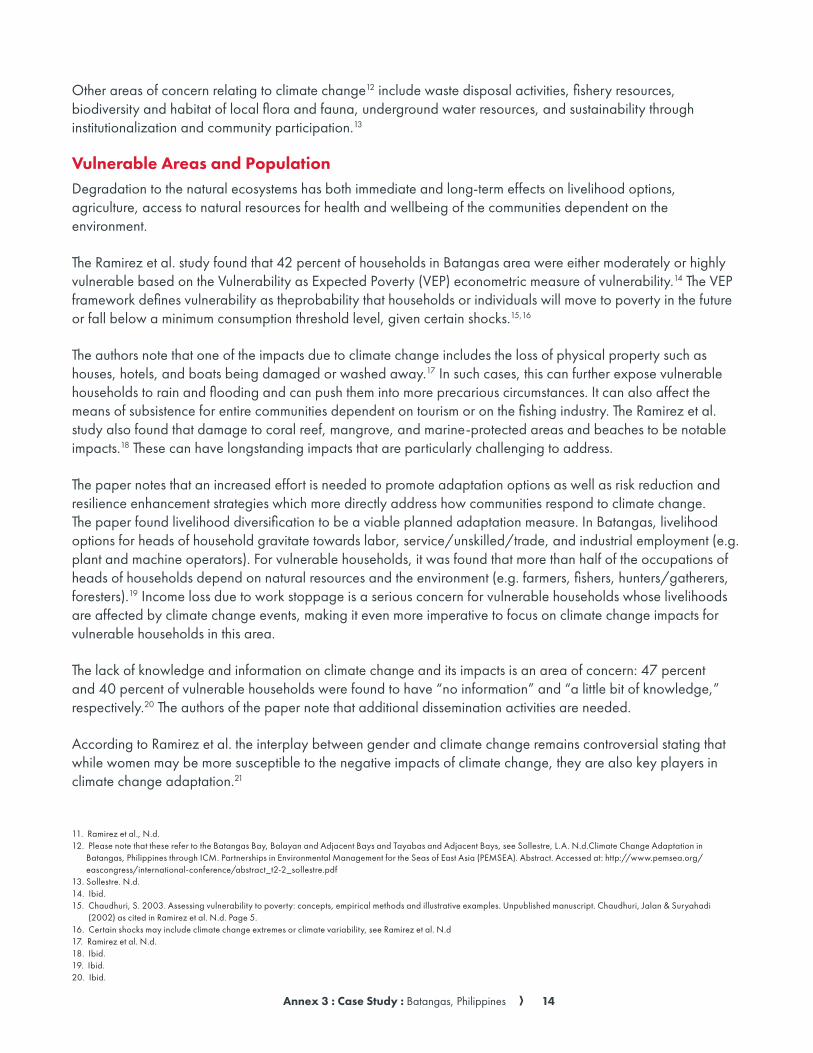
Other areas of concern relating to climate change12 include waste disposal activities, fishery resources, biodiversity and habitat of local flora and fauna, underground water resources, and sustainability through institutionalization and community participation.13
Vulnerable Areas and PopulationDegradation to the natural ecosystems has both immediate and long-term effects on livelihood options, agriculture, access to natural resources for health and wellbeing of the communities dependent on the environment.
The Ramirez et al. study found that 42 percent of households in Batangas area were either moderately or highly vulnerable based on the Vulnerability as Expected Poverty (VEP) econometric measure of vulnerability.14 The VEP framework defines vulnerability as theprobability that households or individuals will move to poverty in the future or fall below a minimum consumption threshold level, given certain shocks.15,16
The authors note that one of the impacts due to climate change includes the loss of physical property such as houses, hotels, and boats being damaged or washed away.17 In such cases, this can further expose vulnerable households to rain and flooding and can push them into more precarious circumstances. It can also affect the means of subsistence for entire communities dependent on tourism or on the fishing industry. The Ramirez et al. study also found that damage to coral reef, mangrove, and marine-protected areas and beaches to be notable impacts.18 These can have longstanding impacts that are particularly challenging to address.
The paper notes that an increased effort is needed to promote adaptation options as well as risk reduction and resilience enhancement strategies which more directly address how communities respond to climate change. The paper found livelihood diversification to be a viable planned adaptation measure. In Batangas, livelihood options for heads of household gravitate towards labor, service/unskilled/trade, and industrial employment (e.g. plant and machine operators). For vulnerable households, it was found that more than half of the occupations of heads of households depend on natural resources and the environment (e.g. farmers, fishers, hunters/gatherers, foresters).19 Income loss due to work stoppage is a serious concern for vulnerable households whose livelihoods are affected by climate change events, making it even more imperative to focus on climate change impacts for vulnerable households in this area.
The lack of knowledge and information on climate change and its impacts is an area of concern: 47 percent and 40 percent of vulnerable households were found to have “no information” and “a little bit of knowledge,” respectively.20 The authors of the paper note that additional dissemination activities are needed.
According to Ramirez et al. the interplay between gender and climate change remains controversial stating that while women may be more susceptible to the negative impacts of climate change, they are also key players in climate change adaptation.21
11. Ramirez et al., N.d.12. Please note that these refer to the Batangas Bay, Balayan and Adjacent Bays and Tayabas and Adjacent Bays, see Sollestre, L.A. N.d.Climate Change Adaptation in
Batangas, Philippines through ICM. Partnerships in Environmental Management for the Seas of East Asia (PEMSEA). Abstract. Accessed at: http://www.pemsea.org/eascongress/international-conference/abstract_t2-2_sollestre.pdf
13. Sollestre. N.d.14. Ibid. 15. Chaudhuri, S. 2003. Assessing vulnerability to poverty: concepts, empirical methods and illustrative examples. Unpublished manuscript. Chaudhuri, Jalan & Suryahadi
(2002) as cited in Ramirez et al. N.d. Page 5.16. Certain shocks may include climate change extremes or climate variability, see Ramirez et al. N.d 17. Ramirez et al. N.d.18. Ibid. 19. Ibid.20. Ibid.

Annex 3 : Case Study : Batangas, Philippines A 15
Climate change differences between male and female headed HHs in the Batanga area22
Household assets, means of transportation, and membership to formal social protection program: Urban Households (National)23
Household effects
A Mobile telephone: 90.9%
A Radio: 62.4%
A Personal computer, laptop: 32.5%
Means of transportation A Motorcycle, tricycle: 28.9%
A Bicycle, trisikad (pedicab): 21.2%
A Car/truck, jeep, van: 11.5%
Beneficiary of the Pantawid Pamilyang Pilipino Program (4Ps) or the Conditional Cash Transfer (CCT) program of the government:
A Total: 10.9%
Demographic information (Calabarzon Region)24
A Average household size: 4.64 people
A Population density (square kilometer): 763 people
A Median age: 24.5 years
A Dependency ratio:25 58.3
Wealth Quintiles: Urban Households (Calabarzon Region)26
A Lowest: 5.2%
A Second: 13.9%
A Middle: 20.1%
A Fourth: 29.1%
A Highest: 31.8%
Site Male Female
Distribution of vulnerable households based on gender of household head (in percentage share) 83 17
Incidence of vulnerability for male- and female-headed households (in percent) 43 39
21. Ibid.22. Ibid. 23. ICF International. 2014. Philippines National Demographic Health Survey 2013.24. Philippine Statistics Authority, Republic of the Philippines. 2016. Quickstat Batangas – Monthly Update of Most Requested Statistics. April.25. This figure includes both young and old dependents. 26. ICF International. 2014. Philippines National Demographic Health Survey 2013.

Annex 3 : Case Study : Batangas, Philippines A 16
Education: Urban Households (National)27
A No education: 4%
A Some elementary: 17.7%
A Completed elementary: 10.4%
A Some high school: 15.1%
A Completed high school: 23.1%
A College/higher: 29.7
A Don’t know/missing:0.1%
Education (Calabarzon Region)28
A No education: 3.4%
A Some elementary: 18.1%
A Completed elementary: 12.4%
A Some high school: 14.8%
A Completed high school: 26%
A College/higher: 25.2%
A Don’t know/missing:0.1%
Water and Sanitation: Urban Households (National)29
Improved drinking water source - total: 98.6% A Bottled water: 52.2%
A Piped into dwelling/yard/plot: 31.2%
A Tube well or borehole: 8.6%
Improved sanitation facility A Not shared facility: 72.9%
A Shared facility: 21.3%
A (Non-improved facility: 5.2%)
27. Ibid.28. Ibid. 29. Ibid.
Annex 4 : Test A 17
Name:____________________________________
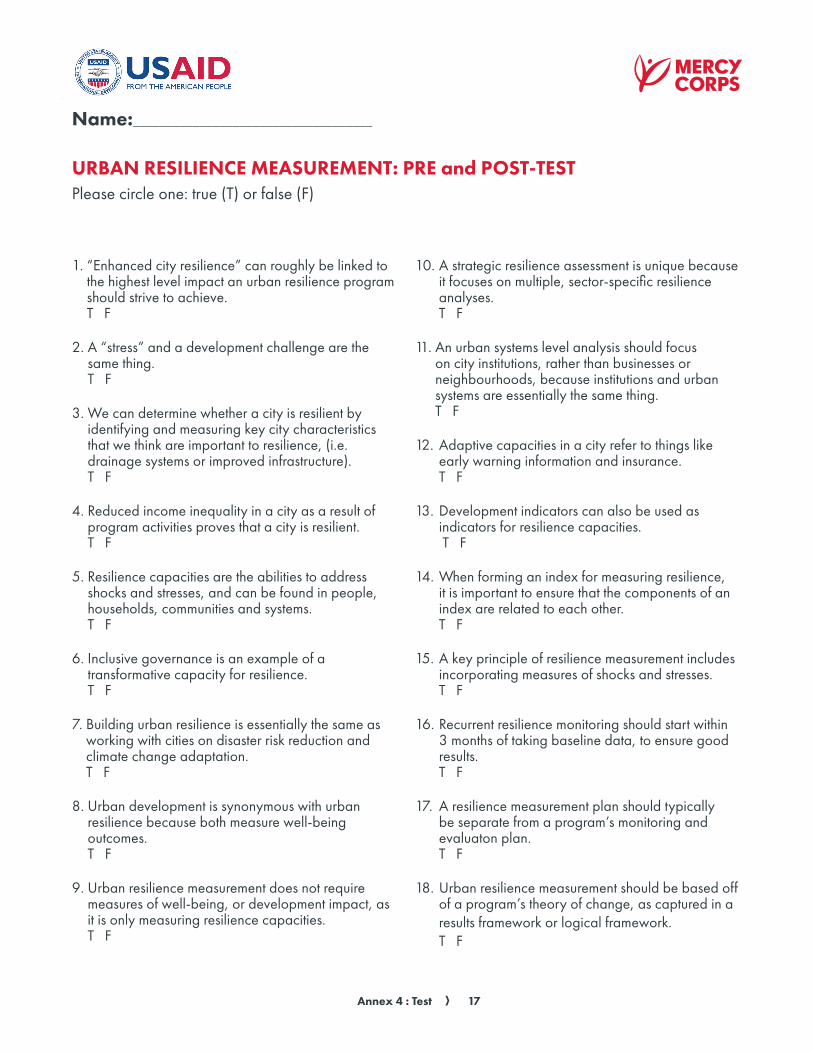
URBAN RESILIENCE MEASUREMENT: PRE and POST-TESTPlease circle one: true (T) or false (F)
1. “Enhanced city resilience” can roughly be linked to the highest level impact an urban resilience program should strive to achieve. T F
2. A “stress” and a development challenge are the same thing. T F
3. We can determine whether a city is resilient by identifying and measuring key city characteristics that we think are important to resilience, (i.e. drainage systems or improved infrastructure). T F
4. Reduced income inequality in a city as a result of program activities proves that a city is resilient. T F
5. Resilience capacities are the abilities to address shocks and stresses, and can be found in people, households, communities and systems. T F
6. Inclusive governance is an example of a transformative capacity for resilience. T F
7. Building urban resilience is essentially the same as working with cities on disaster risk reduction and climate change adaptation. T F
8. Urban development is synonymous with urban resilience because both measure well-being outcomes. T F
9. Urban resilience measurement does not require measures of well-being, or development impact, as it is only measuring resilience capacities. T F
10. A strategic resilience assessment is unique because it focuses on multiple, sector-specific resilience analyses. T F
11. An urban systems level analysis should focus on city institutions, rather than businesses or neighbourhoods, because institutions and urban systems are essentially the same thing. T F
12. Adaptive capacities in a city refer to things like early warning information and insurance. T F
13. Development indicators can also be used as indicators for resilience capacities. T F
14. When forming an index for measuring resilience, it is important to ensure that the components of an index are related to each other. T F
15. A key principle of resilience measurement includes incorporating measures of shocks and stresses. T F
16. Recurrent resilience monitoring should start within 3 months of taking baseline data, to ensure good results. T F
17. A resilience measurement plan should typically be separate from a program’s monitoring and evaluaton plan. T F
18. Urban resilience measurement should be based off of a program’s theory of change, as captured in a results framework or logical framework. T F