case studies in strategic marketing planning for radically new products lee cooper anderson school...
TRANSCRIPT

Case Studies in Strategic Marketing Planning for Radically New
Products
Lee CooperAnderson School at UCLA
Intel Corporation ColloquiumJuly 13, 1999

Intel Prototype Project

Six Planning Stages
1 The first step involves articulating the goal as simply and comprehensively as possible. – The top-level objectives that flow from that goal
should also be developed at this stage.
New Product Success
Value

2. Fill out the Critical Issues Grid• Develop a general description of the product
or service.• List the key issues and assumptions coming
from political, behavioral, economic, sociological, or technological sources. This becomes an outline for short written statements about the critical issues.
• Share this document within the planning group (find out if there is agreement on the critical issues).
Inside IntelRegulatory Issues Strategic Partners
TALC Threat
End-User Acceptance
Future TechnologyCompetitive Threat

3. Mapping the Critical Issues into a Bayesian Network• What affects what is the central issue at this
stage. • Since the network can be progressively
refined, the preliminary work is just in seeing what issues are interconnected.
• Finding the nodes that are the key to decision making is an important part of this step.
Inside IntelRegulatory Issues Strategic Partners
New Product Success
Value
TALC Threat
End-User Acceptance

Prototypical Intel Project
Inside IntelRegulatory Issues
Future Technology
Strategic Partners
New Product Success
Value
Competitive Threat
TALC Threat
TALC Loss
End-User Acceptance

Prototypical Intel Project
IHVs OSVsISVsOEMs
Inside IntelRegulatory Issues
Future Technology
Strategic Partners
New Product Success
Proof of Concept PoC Costs
Value
Competitive Threat
TALC Threat
TALC Loss
End-User Acceptance

Prototypical Intel Project
IHVs OSVsISVsOEMs
Inside IntelRegulatory Issues
Future Technology
Strategic Partners
New Product Success
Proof of Concept PoC Costs
Value
Competitive Threat
TALC Threat
TALC Loss
End-User Acceptance
End-User Test
Test Costs
Test Results

Prototypical Intel Project
IHVs OSVsISVsOEMs
Inside IntelRegulatory Issues
Future Technology
Strategic Partners
New Product Success
OSV PoC
OSV Costs
Value
Competitive Threat
TALC Threat
TALC Loss
End-User Acceptance
End-User Test
Test Costs
Test Results
OEM PoC
OEM Costs
IHV PoC
IHV Costs
ISV PoC
ISV Costs
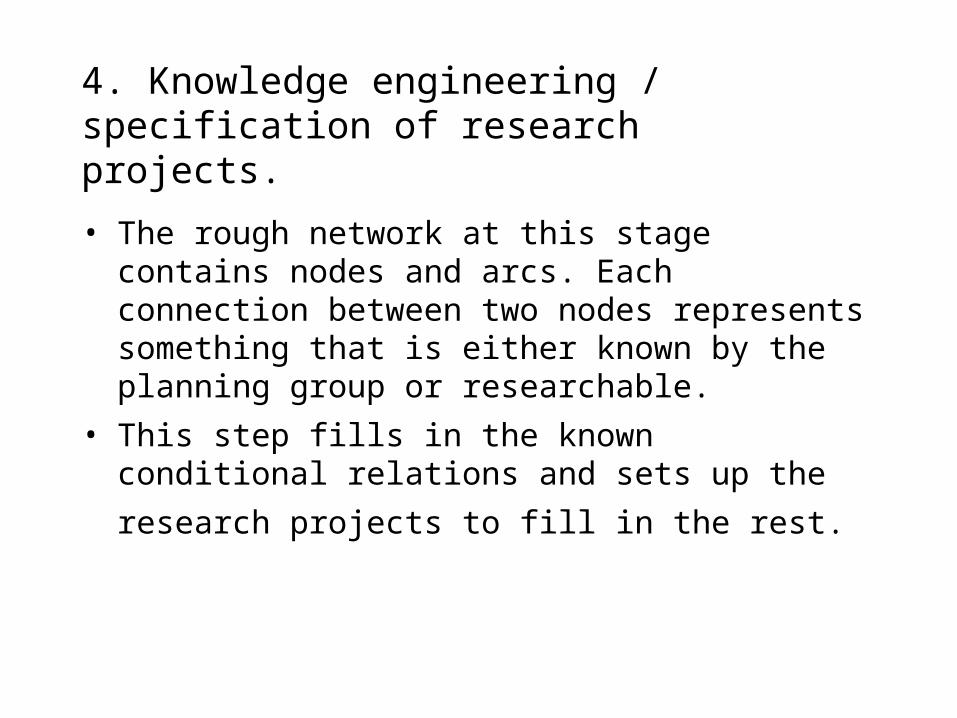
4. Knowledge engineering / specification of research projects.
• The rough network at this stage contains nodes and arcs. Each connection between two nodes represents something that is either known by the planning group or researchable.
• This step fills in the known conditional relations and sets up the research projects to
fill in the rest.

Inside Intel
Engineers accept Managers accept
PerformanceTech elegance
Op. to innovate
New_skill_struggle
Current methods work
Investment issues
Risks
Assess benefits
Lowers costs

OSV Interaction
MS adopts by T-0 Sun adopts by T-0 SCO adopts by T-0
SCO adopts by T-1Sun adopts by T-1MS adopts by T-1
Fear-control/integrity

Final Stages
5 Run scenarios.– Test the sensitivity of the key nodes to changes in
the underlying assumptions.
6 Revise and refine the network, as new knowledge becomes available.– The ability to dynamically update the network is a
key asset.

Costs
OSV CostsOEM Costs IHV Costs ISV Costs
Test CostsTALC Loss
Engage OEM No OEM Engage IHV No IHV Engage OSV No OSV Engage ISV No ISVUtility -200 0 -150 0 -200 0 -100 0
OEM PoC IHV PoC OSV PoC ISV Poc
Lo Threat Hi ThreatUtility 0 -50000
TALC ThreatUser Testing No Test
Utility -200 0
End User Testing

Value
Value
Big Win Little Win LossUtility 200000 2000 -2000
New Product Success

Basic Probabilities
Future Technology Competitive Threat Regulatory Issues
IHVs OSVs ISVsOEMs
Engage OEM No OEM Engage IHV No IHV Engage OSV No OSV Engage ISV No ISVDesign Win 0.8 0 0.85 0 0.6 0 0.85 0
No Win 0.2 1 0.15 1 0.4 1 0.15 1
ISV PoCOEM PoC IHV PoC OSV PoC
Stage 0 0.8 Existing 0.05 Green Light 0.8 M & E Yes 0.5Stage 1 0.15 Announced 0.15 Caution 0.2 M Yes - E No 0.15Stage 2 0.05 Unannounced 0.8 M No - E Yes 0.1
M & E No 0.25
Future Technology Competitive Threat Regulatory Issues Inside Intel
Inside Intel

Conditional Probabilities
Future Technology
Competitive Threat
TALC Threat
Competitive ThreatFuture Technology Stage 0 Stage 1 Stage 2 Stage 0 Stage 1 Stage 2 Stage 0 Stage 1 Stage 2
Lo Threat 0.7 0.4 0 0.9 0.7 0.4 0.9 0.6 0.5Hi Threat 0.3 0.6 1 0.1 0.3 0.6 0.1 0.4 0.5
Existing Announced UnannouncedTechnology Adoption Life Cycle Threat

Probabilities for Strategic Partners
C8
OEMs
ISVs
OSVs
IHVs Design Win No Win Design Win No Win Design Win No Win Design Win No Win
Support 1 0.8 0.6 0.5 0.9 0.7 0.3 0.2
Neutral 0 0.2 0.3 0.4 0.1 0.3 0.6 0.6
Opposition 0 0 0.1 0.1 0 0 0.1 0.2
C8OEMsISVsOSVsIHVs Design Win No Win Design Win No Win Design Win No Win Design Win No Win
Support 0.8 0.7 0.3 0.2 0.2 0.1 0.1 0Neutral 0.1 0.2 0.4 0.5 0.6 0.7 0.3 0
Opposition 0.1 0.1 0.3 0.3 0.2 0.2 0.6 1
Design Win
Strategic Partners
Design Win No Win
Design Win No Win
Design Win No Win
Design Win No Win Design Win No Win
Strategic PartnersNo Win
Design Win No Win
Lee Cooper:IHVs and ISVs cannot create oppostion in this example
Lee Cooper:IHVs and ISVs cannot create oppostion in this example
Lee Cooper:IHVs and ISVs cannot create oppostion in this example
IHVs OSVsISVsOEMs
Strategic Partners

Probabilities for New Product Success
C9
End-User Acceptance
TALC Threat
Inside Intel
Strategic Partners
Regulatory IssuesGreen Light Caution
Green Light Caution
Green Light Caution
Green Light Caution
Green Light Caution
Green Light Caution
Big Win 0.98 0.88 0.88 0.79 0.74 0.66 0.78 0.71 0.71 0.64 0.59 0.53
Little Win 0.02 0.11 0.11 0.19 0.17 0.23 0.22 0.29 0.29 0.35 0.33 0.39
Loss 0.00 0.01 0.01 0.02 0.10 0.11 0.00 0.01 0.01 0.01 0.08 0.08
New Product Success
Win Likely
Lo Threat
Support Neutral Opposition
M Yes & E No
Support Neutral Opposition
M & E Yes
Inside IntelRegulatory Issues Strategic Partners
New Product SuccessTALC Threat
End-User Acceptance
Test Results

Default Probabilities

Default Decision Utilities

Impact of Positive User Test

Impact of Agreement Inside Intel and Positive User Acceptance

What you gain
• Explicit, rather than implicit assumptions• A visual overview of how assumptions and
empirical evidence interconnect• A roadmap showing what research will
reduce uncertainties• A quantitative method for integrating
subjective estimates and objective findings.• A Bayesian tool for showing how changes in
assumptions impact important planning events.
