case studies across three u.s. regions€¦ · local climate adaptation efforts in the city of san...
TRANSCRIPT

LEAR
NIN
G FR
OM
SUC
CESS IN
CLIM
ATE-INFO
RM
ED D
ECISIO
N-M
AK
ING
EAST-WEST C
ENTER
GR
ECN
I, SHO
RE, A
ND
DU
NC
AN
Learning from Success in Climate-Informed Decision-Making: Case Studies Across Three U.S. Regions
Zena Grecni, Leah Shore, and Benét Duncan

Learning from Success in Climate-Informed Decision-Making: Case Studies Across Three U.S. Regions
ZENA GRECNI, LEAH SHORE, AND BENÉT DUNCAN
2019

The East-West Center promotes better relations and understanding among the people and nations of the United States, Asia, and the Pacific through cooperative study, research, and dialogue. Established by the U.S. Congress in 1960, the Center serves as a resource for information and analysis on critical issues of common concern, bringing people together to exchange views, build expertise, and develop policy options.
The Center’s 21-acre Honolulu campus, adjacent to the University of Hawai‘i at Mānoa, is located midway between Asia and the U.S. mainland and features research, residential, and international conference facilities. The Center’s Washington, DC, office focuses on preparing the United States for an era of growing Asia Pacific prominence.
The East-West Center hosts the core office of the Pacific RISA grant, providing administrative and research capabilities for the program. Pacific RISA is one of the 11 Regional Integrated Sciences and Assessments (RISA) teams that conduct research that builds the nation’s capacity to prepare for and adapt to climate variability and change. This work is supported by funding from the National Oceanic and Atmospheric Administration.
EastWestCenter.orgPacificRISA.org
Single copies can be downloaded from the East-West Center website, at EastWestCenter.org. Print copies are available upon request by emailing Zena Grecni ([email protected]).
For information, please contact:
East-West Center1601 East-West RoadHonolulu, Hawai‘i 96848-1601
Telephone: 808.944.7197
[email protected]/Publications
ISBN 978-0-86638-290-8 (print) and 978-0-86638-291-5 (electronic)
© 2019 East-West Center
Recommended Citation:Grecni, Z., L. Shore, and B. Duncan, 2019. Learning from Success in Climate-Informed
Decision-Making: Case Studies Across Three U.S. Regions. Honolulu: East-West Center. 34 pp. Available at https://www.eastwestcenter.org/climate-case-studies.

Table of Contents
NOAA RISA Teams ....................................................................................................................... iv
Executive Summary ................................................................................................................... vii
About This Project ....................................................................................................................... 1
Case Studies ................................................................................................................................2
Local Climate Adaptation Efforts in the City of San Angelo ................................................2
Enhancing the Resilience of Iconic Coastal Ecosystems on Hawai‘i Island .......................7
Managing Water in the Colorado River Water Conservation District ............................... 12
Increasing Conservation Resilience in the Southern Great Plains ................................... 16
El Niño Forecasting in the Pacific Islands ........................................................................... 21
Learning Across Scales and Regions: Themes and Discussion ................................................25
I: Identify how to provide data and knowledge in localized, relevant formats. .............25
II: Empower local champions to initially drive climate science application, and encourage the integration of climate considerations into workflows to sustain initiatives in the long run. ............................................................................ 26
III: Commit to sustained participation in “boundary networks” to improve prediction capabilities and build relationships of trust. ..............................................27
IV: Encourage diverse and sometimes unlikely collaborations. ....................................27
V. Recognize that climate knowledge brokers are often non-scientists. ...................... 28
Appendix A: Interview Guide ..................................................................................................... 31
Acknowledgments .....................................................................................................................33
About the Authors .....................................................................................................................34

Climate ImpactsResearch Consortium
(CIRC)
Alaska Center forClimate Assessmentand Policy (ACCAP)
California-NevadaApplications Program
(CNAP)
NOAA RISA Teams
The authors of this report are from three of the 11 National Oceanic and Atmospheric Administration’s Regional Integrated Sciences and Assess-ments (NOAA RISA) teams. The NOAA RISA program supports research that helps expand and build the nation’s capacity to prepare for and adapt to climate variability and change. The network of 11 teams works with stakeholders and decision-makers in regions across the United States to ensure that research and information are responsive to their needs.
The Pacific Regional Integrated Sciences and Assessments (Pacific RISA) program serves Hawai‘i and the U.S.-affiliated Pacific Islands. The core Pacific RISA office is based at the East-West Center in Honolulu and supports and enhances Pacific Island communities’ abilities to under-stand, plan for, and respond to changing climate conditions. Pacific RISA’s work is conducted through interdisciplinary research and in part-nership with local, national, and regional stake-holders. Pacific RISA emphasizes the engagement of communities, governments, and businesses in developing effective policies to build resilience in key sectors. http://www.pacificrisa.org/
The Southern Climate Impacts Planning Program (SCIPP) is a joint research program that serves the climate research and information needs of the South Central United States. SCIPP concentrates on addressing weather and climate concerns, including severe storms,
droughts, floods, hurricanes, and extreme tem-peratures, and works to improve communities’ abilities to plan for, absorb, recover from, and successfully adapt to adverse effects of these events, both now and in the future. http://www. southernclimate.org/
Western Water Assessment (WWA) is an ap-plied research program that addresses societal vulnerabilities to climate variability and climate change, particularly those related to water re-sources. While WWA is based at the Cooperative Institute for Research in Environmental Science (CIRES) in the University of Colorado Boulder, the program works across Colorado, Utah, and Wyoming. WWA’s mission is to conduct inno-vative research in partnership with decision- makers, helping them make the best use of science to manage for climate impacts. http://wwa.colorado.edu
A
B
C
Hawaii
NorthernMariana Islands
Pacific RISA
AmericanSamoa
Federated Statesof Micronesia
Republicof Palau
MarshallIslands
Guam
A

Great Lakes RegionalIntegrated Sciences
and Assessments(GLISA)
Climate Assessmentfor the Southwest
(CLIMAS) Southern ClimateImpacts Planning Program
(SCIPP)
Western WaterAssessment
(WWA) Mid-Atlantic Regional IntegratedSciences and Assessments(MARISA)
Carolinas IntegratedSciences and Assessments(CISA)
Consortium on Climate Riskin the Urban Northeast(CCRUN)
B
C


LEARNING FROM SUCCESS IN CLIMATE-INFORMED DECISION-MAKING | vi i
Executive Summary
ABOUT THIS PROJECT
The network of three sustained assessment specialists, housed under the National Oceanic and Atmospheric Administration’s Regional Integrated Sciences and Assessments (NOAA RISA) program, has identified successes—local managers who are providing and applying climate information, with valuable outcomes, across a range of geographic scales and sectors. Five of these successes are detailed in case studies as an opportunity for learning in the climate planning space. Based in three regions—the U.S. Pacific Islands, the South Central U.S., and the Rocky Mountain West—the case studies provide inspiration toward creating actionable climate science. Each case study contains a variety of themes that contributed to its success. Five common themes that emerged in analysis of the case studies are highlighted below.
CASE STUDY OVERVIEWS
Local Climate Adaptation Efforts in the City of San AngeloThe City of San Angelo, Texas, is home to an array of extreme weather events, including heavy rainfall, wildfires, drought, and ice storms. As the frequency and intensity of such events change, industries of San Angelo are growing increasingly vulnerable to climate- related impacts. From 2015–2017, a regional project funded by the NOAA Sectoral Appli-cations Research Program (SARP) worked alongside the city’s planning and development administrator, Ms. AJ Fawver, to identify how climate data can assist in creating more de-fined community-based resilience efforts. Fawver helped to galvanize discussions and iden-tify how best to apply climate information (Theme 2), and the project included a variety of
sectors, providing an understanding of city-wide issues (Theme 4). Regional climate projec-tions were formulated based upon participant-identified climate thresholds (Theme 1), and the final result of the project included utilizing $10,000 in seed funding to create a two-part adaptation project within the city.
Enhancing the Resilience of Iconic Coastal Ecosystems on Hawai‘i IslandThe western coast of Hawai‘i Island is host to unique anchialine pool ecosystems that serve a central role in the continuation of traditional practices of the region’s Native Hawaiians. Sea level rise has the potential to expand the areas of some anchialine pools, increasing avail-able habitat for rare and endangered species, but it also increases the threat of invasive fish spreading to new pools in the future. The Nature Conservancy coordinated a team of scien-tists and coastal community groups to create an online tool for visualizing the local effects of sea level rise on coastal resources and communities (Theme 1). The tool has been applied by conservation managers for a range of uses, including to prioritize pools for restoration.
vii i | EAST-WEST CENTER
One such pool recently became the first on Hawai‘i Island since the 1990s to see the return of culturally significant red shrimp after invasive fish removal (Theme 5).
Managing Water in the Colorado River Conservation DistrictThe Colorado River is an iconic symbol and major source of water throughout the American Southwest. The Colorado River Water Conservation District is a public water policy and planning agency created by the State of Colorado in 1937 to develop and protect water allo-cated to the state under the Colorado River Compact. As it looks to the future, the District sees climate change as a key challenge. Mr. Dave Kanzer and Mr. Don Meyer, engineers at the District, use weather and climate data to make decisions that advance the District’s mis-sion across a wide range of areas, including cloud seeding to help increase snowpack, reser-voir operations, and long-term water supply and demand planning. Consideration of climate change and use of climate information have become integrated parts of Meyer and Kanzer’s workflow (Theme 2). Meyer and Kanzer use what they call “integrators”—information pro-viders that understand their needs and the landscape of information available—to identify and translate reputable weather and climate information (Theme 3).
Increasing Conservation Resilience in the Southern Great PlainsThe Southern Great Plains consists of diverse ecosystems and natural resources, spanning a wide range of landscapes. As populations within this region (such as in Dallas and Austin) rapidly expand, along with a changing climate, challenges to conservation have increased considerably. In 2011, the Gulf Coast Prairie Landscape Conservation Cooperative (GCP LCC) was created to sustain the region’s natural resources and to encourage coordination among a wide range of partners. Mr. Bill Bartush, the GCP LCC coordinator, led the Co-operative’s efforts in bringing together diverse conservation agencies and organizations to address important issues across varying jurisdictional and geographical boundaries—an uncommon collaboration that resulted in the successful creation of more strategic services (Theme 4). The GCP LCC network identified top-priority issues and successfully trans-lated relevant data into useful and available formats (Theme 1). The successful practices of the GCP LCC provide an innovative framework for addressing conservation in a quickly changing environment.
El Niño Forecasting in the Pacific IslandsBeginning in the early 1990s, Pacific Island governments and their partners have used El Niño forecasts for planning and emergency preparedness ahead of drought. Forecasts have saved lives and helped to avoid costs. Mr. Chip Guard was part of a team that encouraged island governments and residents to make use of these seasonal forecasts provided by the Pacific ENSO Applications Climate (PEAC) Center. The long-term participation of a network that spans weather and climate services and the local governments has enabled monitoring and re-porting on local climate conditions, ultimately improving the forecasts over time (Theme 2). Now, the use of ENSO information in planning is commonplace (Themes 1 and 3); however, challenges in responding to the threat of drought remain.

LEARNING FROM SUCCESS IN CLIMATE-INFORMED DECISION-MAKING | ix
LEARNING ACROSS SCALES AND REGIONS: THEMES
Five practical lessons for anyone seeking to better integrate climate considerations into deci-sion-making are:
I. Identify how to provide data and knowledge in localized, relevant formats. All of these case studies underscore how localized knowledge of the resources and systems being managed was used to identify the best formats and applications of climate science and technical information in the real world.
II. Empower local champions to initially drive climate science application, and encour-
age the integration of climate considerations into workflows to sustain initiatives
in the long run. Often someone within a management institution (city governments and conservation organizations, for example) initially drives the integration of climate science. In the long run, it is the organizations that permanently change how they do business that appear to get farther in implementing resilience-building.
III. Commit to sustained participation in “boundary networks” to improve prediction
capabilities and build relationships of trust. The ability for climate information providers and potential users to interact through networks and meetings shapes science usability, and we noted this helped to develop familiarity and trust in climate science in several of the case studies.
IV. Encourage diverse and sometimes unlikely collaborations. Collaborations involving partners with a range of expertise and responsibilities can help refine narratives about climate to increase their salience to audiences and communities. Furthermore, these partnerships provide avenues for organizations to contribute with only a moderate impact on any one organization’s time or resources. Boundary programs, such as the NOAA RISA programs, often provide a convening function and can contribute to the development of such collaborations.
V. Recognize that climate knowledge brokers are often non-scientists. Climate-savvy managers are increasingly assuming the role of “knowledge brokers,” connecting peers and wider user communities to climate science and products. Scientists should be will-ing and prepared to support an increasing number of “clients” who seek credible, trust-ed sources of climate information.
NEXT STEPS
These case studies represent a small selection of the broad range of practitioners who are producing or using climate information in a sustained and effective manner. Additional case studies from other regions and sectors could support even more knowledge exchange. There is much more learning to be done, and this work is just the beginning.

LEARNING FROM SUCCESS IN CLIMATE-INFORMED DECISION-MAKING | 1
Learning from Success in Climate-Informed Decision-Making: Case Studies Across Three U.S. Regions
About This Project
The National Oceanic and Atmospheric Administration’s Regional Integrated Sciences and Assessments (RISA) program (see “NOAA RISA Teams,” pages iv–v) is home to a network of three sustained assessment specialists. Based in Hono lulu, Hawai‘i, at the Pacific RISA; in Norman, Oklahoma, at the Southern Climate Impacts Plan ning Program RISA; and in Boulder, Colorado, at the Western Water Assessment RISA, this network of specialists con-nects weather and climate information users and producers to support decision-making and inform future research and assessment priorities in regionally relevant ways. Together with their RISA colleagues, they work closely with agencies and institutions in their regions, as well as with local stakeholders, to conduct research, assessments, and stakeholder engage-ment projects that enhance regional resilience and support risk management.
Through this work, the sustained assessment specialists have identified successes—local man-agers who are providing and applying climate information, with valuable outcomes, across a range of geographic scales and sectors in each of the three regions. A selection of these bright spots is presented here in five case studies as an opportunity for learning in the climate plan-ning space. Practitioners generously shared their experiences in interviews that guided the development of each case study. A consistent methodology and interview guide were used in each of the semi-structured interviews to allow comparison across organizations and regions. The interview guide is provided in Appendix A.
Looking across the case studies, it is clear that practitioners are building resilience while working within different contexts and in different places. Five themes emerged, and they are highlighted within the case studies and in a detailed analysis (see “Learning Across Scales and Regions: Themes and Discussion”). It is important to note that each theme was prominent across practically all of the case studies, although only a selection of themes is detailed within each case study to illustrate key lessons for climate information providers and users.
While these case studies encompass a broad range of sectors, scales, and locations, there are many more practitioners who are producing or using climate information in a sustained and effective manner. Additional case studies from other regions and sectors could support even more knowledge exchange. There is much more learning to be done, and this work is just the beginning.

2 | EAST-WEST CENTER
CASE STUDIES
Local Climate Adaptation Efforts in the City of San Angelo
IDENTIFYING WHEN WEATHER GOES FROM A NUISANCE TO A PROBLEM
Heavy rainfall, severe storms, heat waves, drought, wildfires, and ice storms—this is a sample of the variety of weather events one might experience in San Angelo, Texas, in any given year. Located inside the Concho Valley, the city sits at the boundary of two air masses, where the weather systems of Central and West Texas meet to produce an array of extreme weather events.1 As the frequency and intensity of such events change and the metropolitan area’s population of over 100,000 grows, the many industries of San Angelo are increasingly vul-nerable to climate-related impacts. For example, excess heat endangers the health of city employees working outside, winter weather and flash flooding lead to road closures, water quality and supply issues impact the city during drought, and structures and land can be destroyed during wildfires. Recognizing this growing vulnerability, NOAA’s Sectoral Appli-cations Research Program (SARP) funded a regional project from 2015 to 2017 focusing on reducing the impacts of such threats and increasing local resilience to extreme events now and into the future.
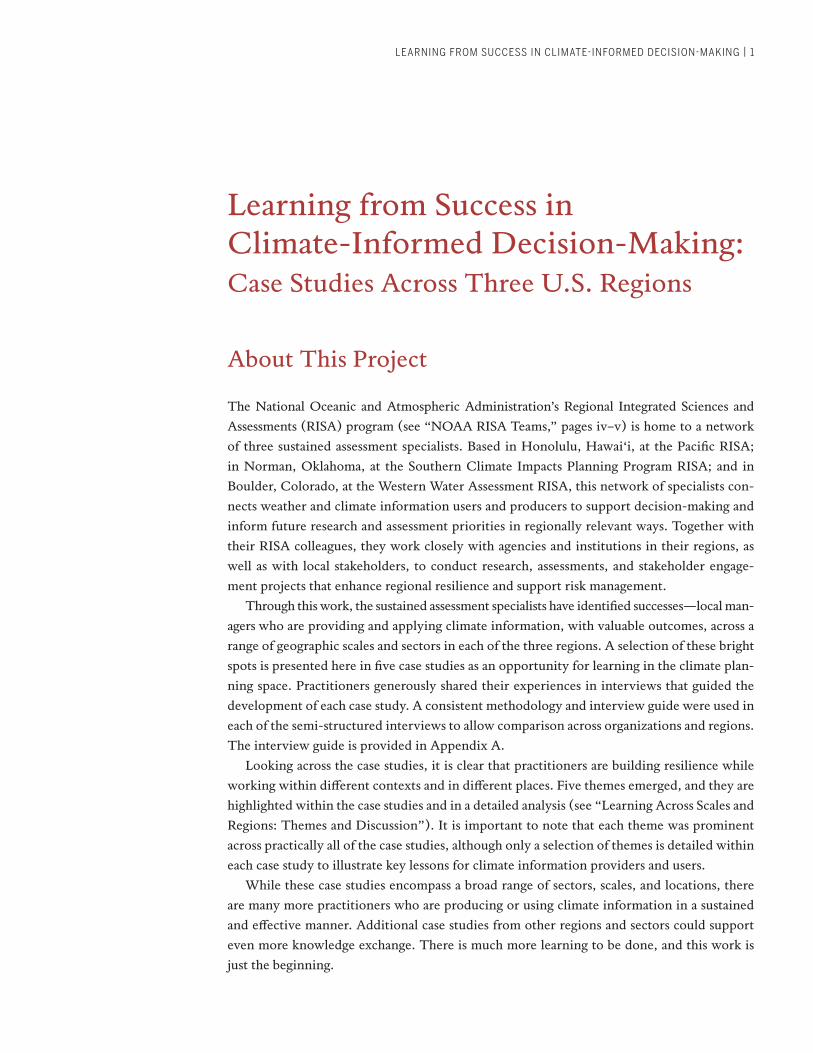
AJ Fawver presented
weather-related issues
during a project work-
shop (a) and, during
the same workshop,
participants discussed
initiatives to build
resilience toward top
climate threats (b).
Source: Adaptation
International
a
LEARNING FROM SUCCESS IN CLIMATE-INFORMED DECISION-MAKING | 3
AJ Fawver, the City of San Angelo’s planning and development administrator at the time of the project’s launch, says that prior to this period, the city seldom incorporated climate information into current and long-range planning, project and site design, permitting, or staff and resource management. The SARP-funded project opened a dialogue for individuals to identify how weather and climate events impact their various professions, and it provided an avenue for exploring local adaptation efforts over a two-year period. Fawver served as the lead contact for the project team, expressing that it “fit nicely into her field,” and resonated with her interest in “the effects of climate change, particularly how it interrelates to the long-range planning of the community and how physical development elements are created or modified in response to it.” She provided critical assistance, enabling the team to collaborate with a group that mainly consisted of city staff members and department heads from sectors well-represented throughout the city.
The City of San Angelo was selected as one of four cities in the South Central region of the United States for this project. The project team was led by Adaptation International and involved the Southern Climate Impacts Planning Program, the Institute for Social and Envi-ronmental Transition, and ATMOS Research. This group aimed to bring together the various sectors within the city to discuss a key question, “When does weather go from being a nui-sance to a problem?” Subsequently, participants were asked to quantify each weather impact into a “critical threshold.” These thresholds were then used as the basis for producing locally relevant climate projections to ultimately assist in creating more defined community-based resilience and adaptation efforts.2
CONSIDERING WEATHER AND CLIMATE IMPACTS ON THE CITY’S WORK
The project began with a historical analysis of the weather and climate extremes that occur in San Angelo. Statistical evidence over the past century revealed that the city has already
‘When does weather go
from being a nuisance
to a problem?’
b

4 | EAST-WEST CENTER
experienced significant changes, such as an increased frequency of extremely hot days (exceed-ing 100 degrees Fahrenheit) and ice storms.3 Fawver emphasized that the background information helped reduce potential uncer-tainty as “it was a way to ground initial conversations in statis-tical data, making it clear there had been significant changes and showing why the city staff and departments should participate.” It ultimately led to the collabora-tive opportunity to discuss future events and identify local thresh-olds for each department.
Fawver also noted that con-centrating on the local scale al-lowed individuals to “focus on
how weather and climate issues impact operations and affect each of their jobs individually, and opened the door for identifying relevant thresholds more clearly.” Thresholds identified as threatening to the work, health, and/or safety of various city departments included, for example, four inches of rainfall within a 24-hour period and temperatures exceeding 90, 100, and 105 degrees Fahrenheit.4 The project team then formulated regional climate projections for each identified threshold, showing the expected frequency of the threshold—under both lower and higher emissions scenarios—through the year 2100. They presented the findings to participants as a basis for discussion about how the information can best be utilized in formu-lating city priorities. The project also provided $10,000 in seed funding to jump-start city-led initiatives to increase resilience to future impacts.
CLIMATE ADVOCATES DRIVE SAN ANGELO’S ADAPTATION EFFORTS
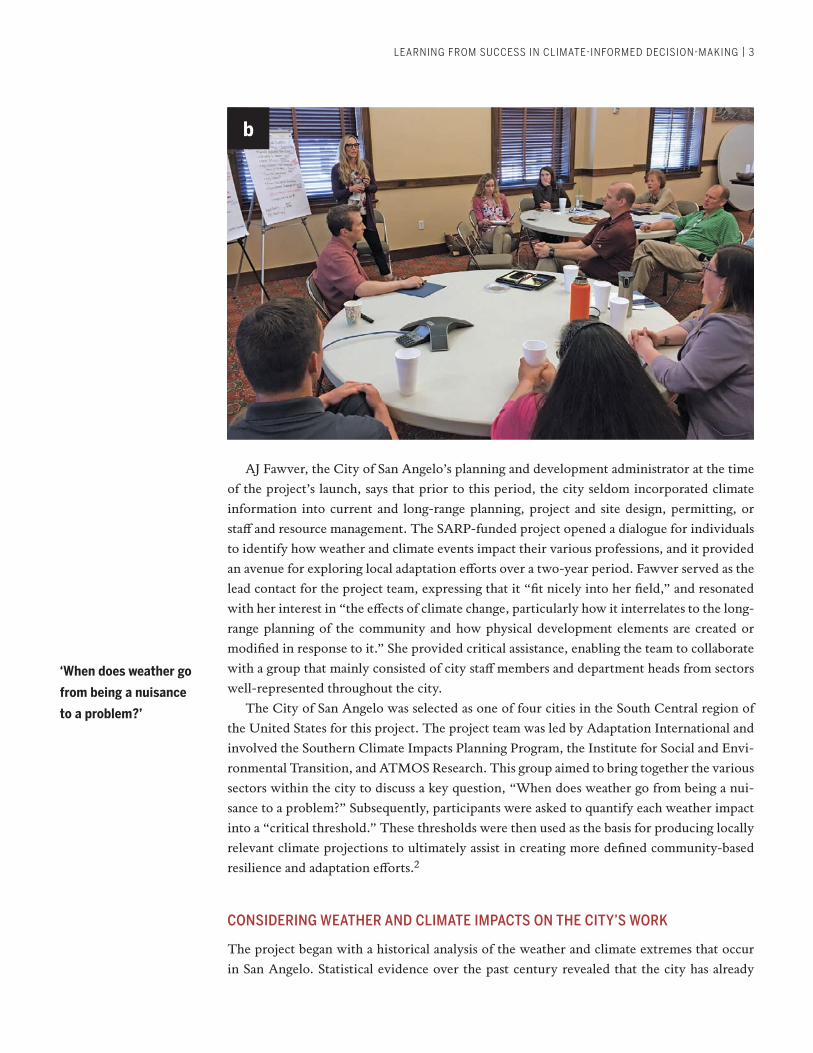
Although there was a positive response to the idea of creating climate adaptation measures across a multitude of departments, it was agreed that the project could be simplified by limit-ing the initial effort to one agency. A practical project suggestion that arose from discussions was to integrate the climate projections through city operations, as that is within the city’s control and ability to effect change. The city agreed to match the seed funding for a two-part adaptation project to: (1) display an evapotranspiration weather station at a public center to monitor weather data and increase the public’s knowledge, and (2) set up a rainwater harvest-ing system in a new public park to collect water for use in landscaping and to promote water conservation.5 Following the success of these pilot projects, the city further secured a grant from the San Angelo Area Foundation and matched the funding to build a second rainwater harvesting system at another public park. Beyond these preliminary activities, Fawver said
A portion of the resilience
project funds were used
to implement an evapo-
transpiration weather
station at a soccer park
within the city. Source:
The City of San Angelo
LEARNING FROM SUCCESS IN CLIMATE-INFORMED DECISION-MAKING | 5
that the continued application of funds toward long-term climate resilience evidently must be driven by a constant advocate within the city, whether it be an individual or organization.
Fawver expressed that although the project lasted only two years, the city accomplished a great amount of work in a short timeline and involved a group with initially little familiarity with the topic. Further, it revealed that one does not have to be a subject matter specialist to incorporate climate adaptation efforts into one’s work. Finally, the results of this project pro-vided insight into how climate information providers and users can better understand each other’s needs and work together to apply climate data at local levels.
THEMES FOR CLIMATE KNOWLEDGE PROVIDERS AND USERS
Empower local champions to initially drive climate science application, and encourage the integration of climate considerations into workflows to sustain initiatives in the long run.The unique opportunity for the SARP project team to work alongside Fawver directly cor-related to the successful outcomes. Fawver explained that her position as a planner includes considering development within the limitations of the natural environment and recognizing how current extreme weather events may interact with infrastructure, such as impervious and building surfaces. This background, along with her pre-existing understanding of climate science, helped to galvanize initial discussions and identify how to best apply climate infor-mation. Further, although the funded projects focused on short-term applications, Fawver identified the importance of retaining a position within the city to sustain and guide long-term climate resilience initiatives.
Encourage diverse and sometimes unlikely collaborations.It is common among city departments to work independently of one another, yet Fawver’s
San Angelo also utilized
funds from the resilience
project to install a rain-
water harvesting system
at The Bosque, a centrally
located city park. Source:
Adaptation International

6 | EAST-WEST CENTER
central position allowed her to bring various department heads together. The City of San Angelo had never before held this type of organized meeting, and such actions led to a more successful project due to the wide range of viewpoints, as well as knowledge of city issues and funding opportunities, that the group encompassed. Identify how to provide data and knowledge in localized, relevant formats.The use of climate projection data is often influenced by how directly applicable it is to users’ needs. The experiences in San Angelo highlight the importance of both educating users on how to understand climate information and presenting data that fits with city priorities. The new approach to incorporating participant-driven thresholds into downscaled projec-tion models created results unique to San Angelo and encouraged the use of climate data in local efforts. Interpretations of climate data also revealed that although the city found the information to be extremely helpful, further education on initial data limitations would better assist user application in longer-term adaptation efforts. Additionally, previous local adaptation projects from cities similar in size to San Angelo were presented during partic-ipant discussions and influenced the final project selection. Fawver emphasized the impor-tance of providing such examples, as local governments are more likely to adapt examples from other cities. Showing what has worked elsewhere provides a safer pathway of following previously tested measures and improves trust in allocating funds.
TOOLS AND RESOURCES
Project Overview: Critical Thresholds, Extreme Weather, and Building Resilience: https://cpo.noaa.gov/Meet-the-Divisions/Climate-and-Societal-Interactions/SARP/Extreme- Events-Thresholds
City of San Angelo, Texas: https://www.cosatx.us/
NOAA’s Sectoral Applications Research Program: https://cpo.noaa.gov/Meet-the-Divisions/ Climate-and-Societal-Interactions/SARP
REFERENCES
1 L. Kos and M. Shafer, The Climate of San Angelo, Texas, March 2017, http://www.southernclimate
.org/documents/Climate_San_Angelo.pdf.
2 S. Petersen, K. MacClune, G. Garfin et al., Critical Thresholds, Extreme Weather, and Building Resil-
ience: How Using Critical Thresholds to Customize Climate Projections of Extreme Events to User Needs
Can Support Decisions and Build Resilience, a Sectoral Applications Research Program Project support-
ed by the National Oceanic and Atmospheric Administration’s Climate Program Office, 2017, Award
Number: NA14OAR4310248.
3 Kos and Shafer, The Climate of San Angelo.
4 Ibid.
5 Petersen et al., Critical Thresholds.
The experiences in
San Angelo highlight
the importance of
educating users about
how to understand
climate information
and presenting data
that fits priorities
LEARNING FROM SUCCESS IN CLIMATE-INFORMED DECISION-MAKING | 7
Enhancing the Resilience of Iconic Coastal Ecosystems on Hawai‘i Island
LOKO WAI ‘ŌPAE: HIDDEN WATERS THAT SUSTAIN LIFE
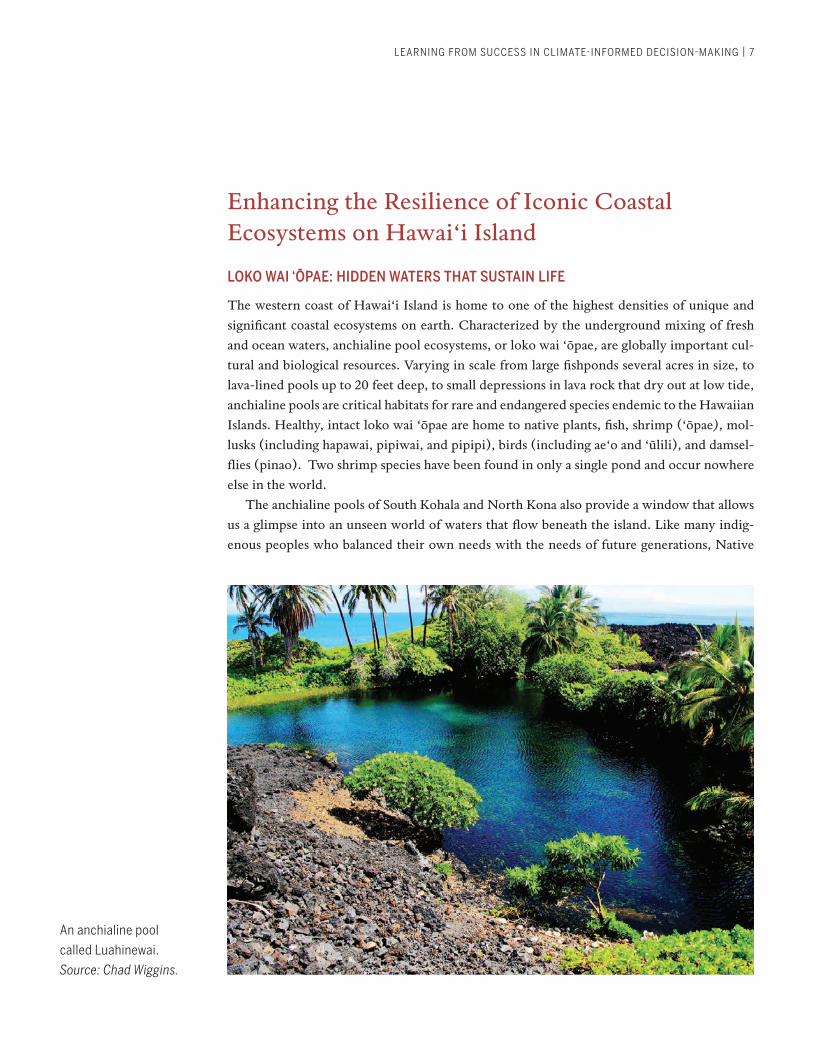
The western coast of Hawai‘i Island is home to one of the highest densities of unique and significant coastal ecosystems on earth. Characterized by the underground mixing of fresh and ocean waters, anchialine pool ecosystems, or loko wai ‘ōpae, are globally important cul-tural and biological resources. Varying in scale from large fishponds several acres in size, to lava-lined pools up to 20 feet deep, to small depressions in lava rock that dry out at low tide, anchialine pools are critical habitats for rare and endangered species endemic to the Hawaiian Islands. Healthy, intact loko wai ‘ōpae are home to native plants, fish, shrimp (‘ōpae), mol-lusks (including hapawai, pipiwai, and pipipi), birds (including ae‘o and ‘ūlili), and damsel-flies (pinao). Two shrimp species have been found in only a single pond and occur nowhere else in the world.
The anchialine pools of South Kohala and North Kona also provide a window that allows us a glimpse into an unseen world of waters that flow beneath the island. Like many indig-enous peoples who balanced their own needs with the needs of future generations, Native
An anchialine pool
called Luahinewai.
Source: Chad Wiggins.

8 | EAST-WEST CENTER
Hawaiians have an inseparable connection to the lands and waters that sustain life. Water, or wai, is sacred, and the Hawaiians of these lands knew that although there was no surface flow, ample water could be found in caves and anchialine pools to sustain life at the coast.
And loko wai ‘ōpae did sustain life in the arid West Hawai‘i lands. In addition to provid-ing water for drinking, irrigating plants, and bathing, anchialine pool fauna were instrumen-tal in sustaining a nearshore fishery for ‘ōpelu, or mackeral scad. Using the red shrimp (‘ōpae ‘ula) from loko wai ‘ōpae, fishermen of these lands identified a way to farm fish in the open ocean without cages or pens, using the resources at hand to feed and train the fish to assure a bountiful harvest year after year. It was the duty of the fishing families to care for these habitats, just as they tended their nets and canoes to ensure the ability to feed a community. This knowledge is still held within the fishing families of this region, where the continued existence of loko wai ‘ōpae is necessary to perpetuate this practice.
Two National Historical Parks in the Kohala region, at Kaloko-Honokōhau and Pu‘uhonua o Hōnaunau, were established to acknowledge the need to protect anchialine pools and other important cultural resources and practices.
Residential and tourism-related development on Hawai‘i Island has overlapped with an area of once-abundant fishponds and anchialine pools. In the past, pools were filled in and paved over. Today, waters can become contaminated by polluted runoff from coastal land use. Non-native, introduced species are found in the vast majority of anchialine pools along the Kona coast. Introduced fish (tilapia, guppies, and mollies) compete with and prey on rare endemic species such as the red shrimp (‘ōpae ‘ula). Some estimates indicate that as many as 98 percent of anchialine pools on the island can no longer support ‘ōpae ‘ula because of the spread of introduced fish.1
POOLS MAY EXPAND AND STRUGGLE UNDER NEW THREATS, AS SEA LEVELS RISE
Climate change represents both an opportunity and a threat for anchialine pools. The area of suitable pool habitat will expand as sea levels rise, increasing the available habitat for na-tive species. On the other hand, the threat of introduced fish species spreading to new pools
is heightened if waters connect pristine pools to pools where introduced fish are already present.
Chad Wiggins oversees The Nature Conservancy’s marine program for Hawai‘i Island. Until recently, he viewed the threat of sea level rise mainly as a potential catalyst for action to drive more investment and support for implementing conservation plans. “Many actions in existing plans were developed based on current conditions, and we need to be thought-ful about how climate change will affect our conservation targets, threats, and strategies,” Wiggins explains.
In the past year, frequent high-water events were observed across the Hawaiian Islands. On Hawai‘i Island, roads that are vital to transporting goods from the main harbor to all of West Hawai‘i were inundated at high tide, and inland flooding caused damage and exacerbated erosion in low-lying communities. This heightened Wiggins’s concerns about the accelerating effects that climate change will have, not just on coastal lands, but on coastal communities as well. Wiggins and the conservation partners with whom he works needed to know what to expect so that they could adapt their management actions accordingly by
Estimates indicate
that as many as 98
percent of anchialine
pools can no longer
support ‘ōpae ‘ula
(red shrimp)
LEARNING FROM SUCCESS IN CLIMATE-INFORMED DECISION-MAKING | 9
prioritizing, scaling up, or preparing for habitat loss. Wiggins believes that “anchialine pools provide a window for us to visualize sea level impacts on coastal areas that is easy for us to picture here in West Hawai‘i.”
INTERACTIVE MAPPING HELPS COMMUNITIES VISUALIZE RISKS TO ECOSYSTEMS
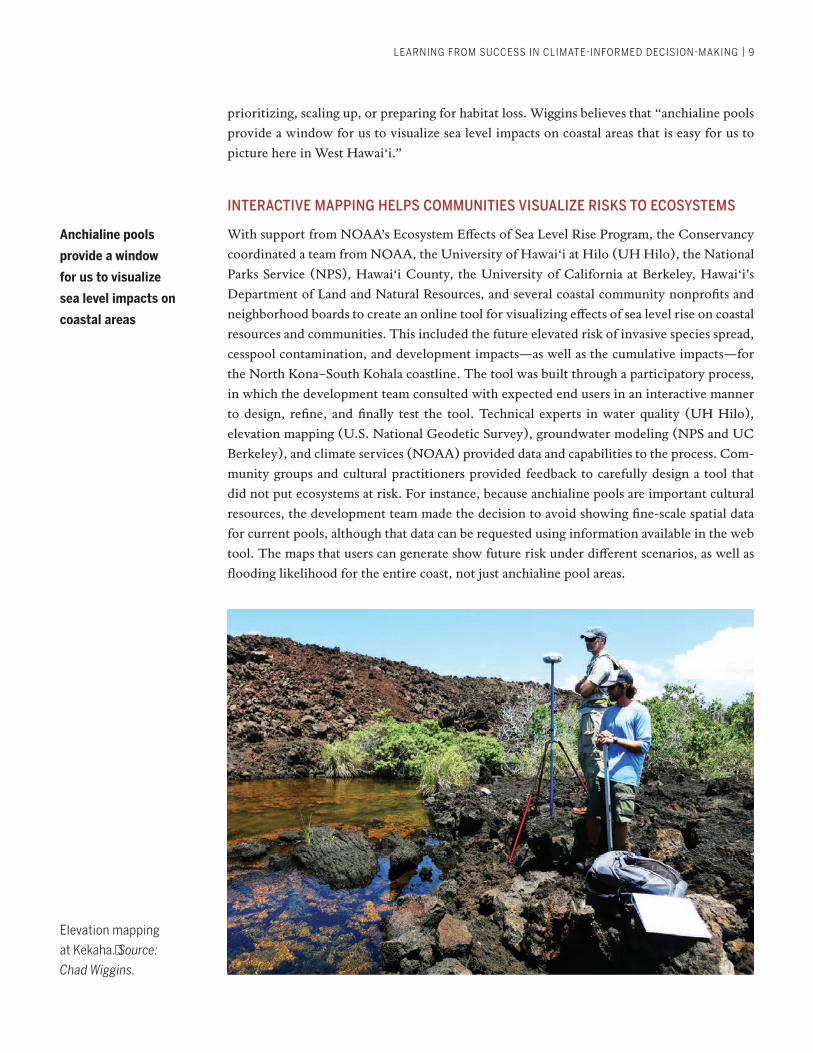
With support from NOAA’s Ecosystem Effects of Sea Level Rise Program, the Conservancy coordinated a team from NOAA, the University of Hawai‘i at Hilo (UH Hilo), the National Parks Service (NPS), Hawai‘i County, the University of California at Berkeley, Hawai‘i’s Department of Land and Natural Resources, and several coastal community nonprofits and neighborhood boards to create an online tool for visualizing effects of sea level rise on coastal resources and communities. This included the future elevated risk of invasive species spread, cesspool contamination, and development impacts—as well as the cumulative impacts—for the North Kona–South Kohala coastline. The tool was built through a participatory process, in which the development team consulted with expected end users in an interactive manner to design, refine, and finally test the tool. Technical experts in water quality (UH Hilo), elevation mapping (U.S. National Geodetic Survey), groundwater modeling (NPS and UC Berkeley), and climate services (NOAA) provided data and capabilities to the process. Com-munity groups and cultural practitioners provided feedback to carefully design a tool that did not put ecosystems at risk. For instance, because anchialine pools are important cultural resources, the development team made the decision to avoid showing fine-scale spatial data for current pools, although that data can be requested using information available in the web tool. The maps that users can generate show future risk under different scenarios, as well as flooding likelihood for the entire coast, not just anchialine pool areas.
Elevation mapping
at Kekaha. Source:
Chad Wiggins.
Anchialine pools
provide a window
for us to visualize
sea level impacts on
coastal areas

10 | EAST-WEST CENTER
Since the tool’s release, various groups have applied it for a range of uses. The Conser-vancy is using it to designate native planting areas at the Kīholo Fishpond Estuary Preserve. A network of conservation groups (including the Conservancy) used it to identify three ex-isting pools to prioritize for restoration by removing introduced fish. With leadership from Hawai‘i’s State Parks Division and support from Nature Conservancy staff, one of the three has been fully restored, recently becoming the first anchialine pool on Hawai‘i Island since the 1990s to see the return of ‘ōpae ‘ula after invasive fish removal. Community boards have used the tool to comment on coastal zoning applications, and planners from Hawai‘i County and the National Parks Service have used it to identify vulnerable areas. A local school used the viewer in a virtual field trip to an inaccessible coastal area with diverse anchialine eco-systems. Maps from the viewer were used to update coastal strategies in the collaboratively developed 2019 South Kohala Conservation Action Plan. Building on this work, several of these partners have developed a proposal to expand the tool to cover all of Hawai‘i Island and include wave-driven flooding, and to update both the ecological and economic costs of flooding while showing the ability of coastal ecosystems to mitigate flood impacts.
THEMES FOR CLIMATE KNOWLEDGE PROVIDERS AND USERS
Recognize that climate knowledge brokers are often non-scientists.Restoration of globally significant anchialine pool habitats had stalled, with no successful projects in more than 30 years. At the same time, high-water flood events threatened to fur-ther degrade the remaining intact ecosystems. While sea level rise modeling had been done previously for Hawai‘i Island, models were at a coarse scale, did not include groundwater (which exacerbates sea level rise), and did not show specifically how sea level rise would affect anchialine pools. Coastal communities and some natural resource managers found the models difficult to use. To build sufficient support for management actions and ensure
Jody Kaulukukui and Sam
Gon looking at ‘ōpae ‘ula
in Luahinewai. Source:
Chad Wiggins.
The tool shows
the future risk of
invasive species
spread, cesspool
contamination, and
development impacts

LEARNING FROM SUCCESS IN CLIMATE-INFORMED DECISION-MAKING | 11
efficiency, managers needed a tool for visualizing the future locations and conditions of an-chialine pools and sea level rise impacts. Together, they made an investment and partnered with technical experts to build a tool to aid coastal planning and management decisions. The publicly accessible tool, designed by conservation managers, now has been used by groups ranging from civil society to government and has inspired others to seek ways to incorporate climate information into local plans and policies.
Identify how to provide data and knowledge in localized, relevant formats. The development team listened to resource managers and coastal communities, and they en-gaged cultural practitioners to learn what information was useful with regard to sea levels and how they would like that information shared. They learned, for example, that it was not simply the amount of sea level rise that concerned managers. The change in frequency of high sea level events—how often it would cross a threshold and connect pools—was key to the potential spread of invasive species and pool expansion. Managers were able to apply the high sea level scenarios to figure out which areas were threatened first and could then prioritize which pools should receive additional conservation measures. This made conser-vation actions more efficient and effective in the region. This is one of many uses for this kind of sea level rise information in West Hawai‘i and across the state.
Note: The authors wish to thank Chad Wiggins of The Nature Conservancy for his extensive feed-
back, which significantly contributed to this case study’s writing.
TOOLS AND RESOURCES
Ecosystem Effects of Sea Level Change (Mapping Tool): https://maps.coastalresilience.org/hawaii/
The Nature Conservancy in Hawai‘i: https://www.nature.org/en-us/about-us/where-we-work/united-states/hawaii/
REFERENCES
1 Hawai‘i Department of Land and Natural Resources (DLNR), “Anchialine Pond Shrimps,” in
Hawaii’s Comprehensive Wildlife Conservation Strategy, 2005, https://dlnr.hawaii.gov/wildlife/files/
2013/09/Fact-Sheet-anchialine-shrimps.pdf.

12 | EAST-WEST CENTER
Managing Water in the Colorado River Water Conservation District
THE COLORADO RIVER: AN ICONIC SYMBOL AND CRITICAL NATURAL RESOURCE
Extending for 1,450 miles through seven U.S. states, the Colorado River is an iconic symbol and major source of water throughout the American Southwest. The river provides water that is critical not only for ranchers and farmers, but also for a myriad of other human and wildlife uses in these states. It also provides an abundance of recreation opportunities, in-cluding trout fishing, kayaking, and rafting.
The Colorado River Water Conservation District is a public water policy and planning agency created by the State of Colorado in 1937 to develop and protect water allocated to the state under the Colorado River Compact. The District serves 15 counties and covers 30 per-cent of the state’s land, from the continental divide to the borders of Wyoming in the north and Utah in the west, excluding the San Juan River sub-basin. Its mission is “to lead in the protection, conservation, use, and development of the water resources of the Colorado River basin for the welfare of the District, and to safeguard for Colorado all waters of the Colorado River to which the state is entitled.” As it looks to the future, the District sees climate change as a key challenge, as specified in their strategic plan.
CLIMATE CHANGE ADDS COMPLEXITY TO RIVER MANAGEMENT
Dave Kanzer, the District’s deputy chief engineer, and Don Meyer, the District’s senior wa-ter resources engineer, use weather and climate data to make decisions that advance the Dis-trict’s mission across a wide range of areas, including cloud seeding to help increase snow-pack, operating reservoirs to meet multiple objectives while trying to maintain target flows for endangered species, and long-term water supply and demand planning. Changes in the timing and amount of snow, the timing of spring melt, and the presence of severe weather and drought all affect reservoir management and the availability of water in the Colorado River basin.
Understanding the impacts of climate change on hydrology can be tricky because precipi-tation projections for the region carry a lot of uncertainty. However, the clear warming signal seen across climate models indicates that in the future there will be less water and it will be more difficult to store and deliver. Managers must also consider short-term weather patterns in their management decisions. For now, their decisions to support a safe, reliable water supply in western slope counties and beyond are driven by these short-term weather patterns overlaid on the bigger imprint of climate change. As Kanzer notes, long-term averages and statistical patterns do not necessarily represent what is happening now, so District engineers
Understanding the
impacts of climate
change on hydrology
can be tricky
because precipitation
projections carry a lot
of uncertainty

LEARNING FROM SUCCESS IN CLIMATE-INFORMED DECISION-MAKING | 13
must look at both data from the past 10–15 years as well as climate projections to inform their planning efforts.
USING DATA TO MAXIMIZE OPPORTUNITY AND MINIMIZE RISK
Across all of their water supply and demand management activities, Kanzer and Meyer strive to maximize opportunity and minimize risk. High-quality data have become a key ingredient. Long-term climate projections are essential for facility planning, while short- and mid-term forecasts are used in making day-to-day water management decisions. Important information sources for Kanzer and Meyer include the NOAA Colorado Basin River Forecast Center, the NOAA Climate Prediction Center, the U.S. Department of Agriculture (USDA) Natural Resources Conservation Service, the Colorado Climate Center, Western Water Assessment, the USDA Northern Plains Climate Hub, the U.S. Drought Monitor, and the Drought Mit-igation Center, among others.
Reservoir maintenance is one key management activity for engineers at the Colorado River Water Conservation District. For example, as of 2019, the main underwater gate of the Wolford Mountain Reservoir in Kremmling, Colorado, needs to be replaced, and this requires lower water levels so that divers can work efficiently. As he plans this project, Meyer must time the work carefully to ensure that ice cover on the reservoir has melted enough to deploy barges and cranes for the divers to work from, but not so late in the season that runoff raises water levels too high for this essential maintenance work to efficiently occur. Other maintenance activities require the outlet conduit to be drained, which means the reservoir has to be spilling. Short- and mid-term forecast products are important for planning the tim-ing of efforts such as these.
Engineers and water resource specialists at the District also work to coordinate disparate reservoir operations, bringing all major facility operators together to optimize flow in the Colorado and Gunnison Rivers, and thus aiding endangered species recovery program activ-ities for the humpback chub and the Colorado pikeminnow. The operators’ goal is to simu-
Located near Kremmling,
Colorado, Wolford
Mountain Reservoir is
owned and operated by
the Colorado River Water
Conservation District.
Source: Maciej Ciupa,
2011, used under a CC
BY-NC-SA 2.0 license.
Longterm projections
are essential for facility
planning, while short
and midterm forecasts
are used in making day
today water manage
ment decisions

14 | EAST-WEST CENTER
late a more natural flow in the river without sacrificing the ability to fill reservoirs, all while avoiding flooding and/or late-season water shortages. They use projections of future water demands and consumptive uses while studying snowpack information to forecast seasonal water supplies. Using tools from the Bureau of Reclamation, the State of Colorado, and vari-ous other datasets, engineers are able to estimate projected reservoir levels, which helps them understand the volume of water available for consumptive use versus the volume necessary for endangered species and other uses. District engineers use a wide range of information for this work, including: a short-term, 10-day river flow forecast (which is driven by a snowmelt model, which in turn is driven by climate inputs); monthly precipitation and temperature forecasts; and seasonal, annual, and 24-month water supply forecasts. These are influenced by El Niño Southern Oscillation (ENSO) indicators, soil moisture modeling products from the Colorado Basin River Forecast Center, and evolving hydro-climatic analytical tools. Thanks in part to the efforts of the District and a network of partners in the Upper Colorado Endangered Fish Recovery Program, the razorback sucker was recently recommended for reclassification from endangered to threatened.
Cloud seeding is a weather modification method that helps encourage precipitation to fall over particular areas by adding tiny particles to the atmosphere, around which moisture in the air can condense and freeze into additional ice crystals. The District uses cloud seeding to help increase snowpack above reservoirs where water is stored and released, and in areas where no reservoir storage exists to build the snowpack so that it remains on the ground lon-ger into the year. In his work with the District’s cloud seeding program, Kanzer endeavors to augment the snowpack without causing it to become too thick or dangerous. He must also avoid seeding snow if it might adversely affect transportation corridors in mountain passes, increase avalanche danger, or exceed maximum thresholds set by the State of Colorado regu-lators. He uses weather and climate information to inform these efforts, as well as data about avalanche danger from the Colorado Avalanche Information Center.
THEMES FOR CLIMATE KNOWLEDGE PROVIDERS AND USERS
Empower local champions to initially drive climate science application, and en-courage the integration of climate considerations into workflows to sustain ini-tiatives in the long run. Consideration of climate change and use of climate information have become an integrat-ed part of Meyer and Kanzer’s workflow at the District. They highlight that support from management and the District’s Board of Directors has directed District engineers to use and integrate weather and climate information into their work via strategic planning documents. Commit to sustained participation in “boundary networks” to improve predic-tion capabilities and build relationships of trust.There are a lot of climate and weather data sources, and it can be easy to lose track of what and where they are. As Meyer says, “There is a big soup of information out there that people share.” As a result, Meyer and Kanzer use what they call “integrators”—information provid-ers that understand their information needs and the landscape of information available—to help identify and translate reputable weather and climate information in ways that they can
‘There is a big soup of
information out there
that people share’

LEARNING FROM SUCCESS IN CLIMATE-INFORMED DECISION-MAKING | 15
use. Without them, say Meyer and Kanzer, it would be very difficult to navigate the huge quantity of data out there, some of which is trustworthy and some of which is not.
TOOLS AND RESOURCES
Colorado River Water Conservation District: https://www.coloradoriverdistrict.org/

16 | EAST-WEST CENTER
Increasing Conservation Resilience in the Southern Great Plains
A UNIQUE REGION CHALLENGED BY A GROWING POPULATION AND CHANGING CLIMATE
Situated in the middle of North America, the Southern Great Plains is a unique region link-ing the East to the West. A diverse landscape—from open prairies to forests to tidal wet-lands—this area hosts a wide range of wildlife and conservation characteristics and is the location of major waterways, including the lower Rio Grande, Brazos, and major tributaries of the Mississippi, such as the Red and Arkansas Rivers. The region also serves as an import-ant economic driver, having abundant tourist destinations and opportunities for outdoor recreation, and provides water to its many cities, including Austin, Dallas, and Tulsa. As the populations of these cities rapidly expand, the environment is stressed by increased demands on land and resources. This demonstrates the importance of the region’s ecosystems and the services they provide. For example, expanding urbanization and concrete have negatively impacted the infiltration of water into groundwater systems, lowering flow rates and increas-ing contamination.1
In addition to population stresses, the region is impacted by a changing climate. Shifts in seasonal weather patterns and extreme events affect the normal river and creek flows, consequently impacting their drainage into the region’s main body of water, the Gulf of Mexico.2 Exceptional drought conditions in 2011 led to a mul-titude of extreme impacts to-taling more than $12 billion in damages across Oklahoma and
Texas,3 including massive cattle destocking and the largest wildfire in Texas history, the Bastrop County Complex fire.4 Historical drought and wildfires from 2011 to 2015 included a period of time that resembled the Dust Bowl era in certain areas.5 These events highlighted the region’s vulnerability and increased awareness of the challenges of conservation during an unprecedented period of change in the region’s environment.
The GPC LCC developed
a decision-support tool
for the Gulf Coast mottled
duck population, to ad-
dress the threats caused
by urbanization. Source:
Victor Fazio licensed
under CC BY-NC-SA 2.0.
Historical drought and
wildfires from 2011 to
2015 included a period
of years that resembled
the Dust Bowl era

LEARNING FROM SUCCESS IN CLIMATE-INFORMED DECISION-MAKING | 17
OPPORTUNITY TO SUSTAIN CONSERVATION INTERESTS ESTABLISHED THROUGH REGIONAL ORGANIZATION
Recognizing the need and opportunity to sustain this region’s natural resources across the Southern Great Plains, the Gulf Coast Prairie Landscape Conservation Cooperative (GCP LCC) formed in 2011. A presidential executive order created the partnership as one of 22 teams across the country to address conservation needs. Covering south-central Kansas, central Oklahoma, eastern Texas, and northeastern Mexico, as well as the coastal regions of Louisiana and Mississippi, the GCP LCC aimed to “stitch together” this region’s diverse conservation agencies and organizations. Bill Bartush, GCP LCC coordinator, explained that its vision and mission was to “enable a collaboration that would help address stresses across multiple jurisdictions and large landscapes, bringing together people, agencies, and organi-zations that normally focus individually on regional issues.”
Bartush led the GCP LCC Steering Committee, as well as science and information tech-nology teams. He attributes their success to three strong principles: “maintaining regular collaboration among conservation partners on current and upcoming issues; establishing sci-ence-based priorities to focus resources on those highest-priority needs; and translating the science in a way that influences the behavior of users.” These priorities allowed the GCP LCC to work on innovative activities, bringing together agencies that normally pursue con-servation projects independently of each other—such as NOAA, the U.S. Geological Survey, the Department of Interior Climate Adaptation Science Centers, the U.S. Department of Agriculture Climate Hubs, and state wildlife and fish agencies. The GCP LCC provided an avenue for addressing a variety of conservation issues across the region.
COLLABORATION PROVIDED A PATHWAY TO STRONGER CONSERVATION EFFORTS
Collaborations arising through the GCP LCC helped galvanize partners around the need to identify high-priority lands or conservation issues and to prioritize areas that may have
The Blanco River, near
the city of Blanco, Texas,
during the 2011 drought.
Source: Earl McGehee,
2011, used under a CC BY
2.0 license.

18 | EAST-WEST CENTER
been debatable in years before. In other words, the agency partners were able to recommend top-priority issues in a changing environment to align decision-makers across the region. For example, they found that the western Gulf Coast mottled duck population was being threatened by the reduction of suitable habitats, caused by urbanization. The GCP LCC developed a decision-support tool that was used for the mottled duck, as well as for other species with similar habitats. This tool was then adopted by several granting organizations, such as the National Fish and Wildlife Foundation and the U.S. Fish and Wildlife Service, which provided extra points in grant competitions if tool recommendations were used and/or referenced in proposals.
Another example, Bartush explained, stems from a successful partnership between the GCP LCC and the Southern Climate Impacts Planning Program (SCIPP). During the be-ginning of the 2011 drought and wildfires, SCIPP, with the capacity to host monthly we-binars, collaborated with the GCP LCC to disseminate important information. Webinars reported weather outlooks, impacts, and potential concerns on a variety of topics, such as the loss of water in Texas’s rice country and its impact on waterfowl. In 2015, conversations between partners revealed the need for an improved reservoir tool, as users had to undertake the tedious process of checking multiple sites for water levels. SCIPP utilized its resources to develop a tool that compiled all data from reservoirs onto a single webpage. The GCP LCC Conservation Planning Atlas is a similar compilation tool developed by the GCP LCC partners. Created in 2010, this web-based portal enabled the Cooperative to make available biological, habitat, and social data from various agencies, presented in a way that could be “readily downloaded, accessed, and reviewed on a common platform.” Bartush emphasized that while these tools may now seem matter-of-fact, they represented breakthroughs for the user communities.
The Pontotoc Ridge
Preserve located in
Pontotoc County,
Oklahoma, represents
one of the many land-
scapes of the Southern
Great Plains. Source:
amy_buthod licensed
under CC BY-NC-SA 2.0.
Webinars reported
weather outlooks
and impacts, such
as water loss in rice
country and its impact
on waterfowl

LEARNING FROM SUCCESS IN CLIMATE-INFORMED DECISION-MAKING | 19
Further examples can be found throughout GCP LCC’s network of partners, showing how they have successfully translated data into useful and available formats. These new ways of combining and leveraging resources utilized the best of each entity and maximized the ability to raise concerns and share information with a broader audience. Although the GCP LCC no longer exists, its innovative framework, including the Conservation Planning Atlas that is still available, will influence conservation for years to come as climate issues and pop-ulation growth continue to affect the environment of the Southern Great Plains.
THEMES FOR CLIMATE KNOWLEDGE PROVIDERS AND USERS
Identify how to provide data and knowledge in localized, relevant formats.The partnership’s existence revolved around creating synthesized data in a more local, rele-vant way. Each example above, in addition to other numerous outputs, began with identify-ing a pertinent conservation issue, discovering user vulnerability, and presenting the relevant data in a way that improved its accessibility and application. Bartush emphasized that the group’s ability to obtain user feedback ensured the development of products tailored to the region’s most pressing needs.
Encourage diverse and sometimes unlikely collaborations.The collaboration focused on a wide range of conservation issues concerning wildlife, fish, the air, and the land, and worked across many states. This allowed agencies to work freely with each other, unrestricted by geographical or sectoral boundaries.6 Additionally, the part-nership prioritized the engagement of all conservation entities within the Southern Great Plains, which had never been done before. From the inland prairie ranges to the coastal wet-lands, the GCP LCC strived to bring people together over the topic of conservation. These uncommon collaborations of both agencies and individuals throughout the region resulted in a synergistic partnership that enabled the successful sharing of resources, learning from each other, and creating more strategic services.
Lake Arrowhead, located
in Clay County, Texas,
is one of the reservoirs
displayed on the Water
Reservoir Data Visualiza-
tion Tool. Source: Nicolas
Henderson licensed under
CC BY 2.0.
From inland prairie
ranges to coastal
wetlands, the co
operative strived to
bring people together
over conservation

20 | EAST-WEST CENTER
TOOLS AND RESOURCES
Gulf Coast Prairie Landscape Conservation Cooperative: https://gulfcoastprairielcc.org/
Gulf Coast Prairie LCC Conservation Planning Atlas: https://gcplcc.databasin.org/
SCIPP’s Water Reservoir Data Visualization Tool: http://reservoir.srcc.lsu.edu/
REFERENCES
1 Southern Great Plains Conservation Partnership (SGPCP) website, https://gulfcoastprairielcc.org/
(Accessed May 16, 2019).
2 Ibid.
3 M. Shafer, D. Brown, and C. McNutt, “Managing the 2011 Drought: A Climate Services Partner-
ship,” in Climate in Context: Science and Society Partnering for Adaptation, ed. A.S. Parris et al. (West
Sussex, UK: John Wiley & Sons Ltd., 2014).
4 NOAA National Centers for Environmental Information (NCEI) website, “U.S. Billion-Dollar
Weather and Climate Disasters,” 2019, https://www.ncdc.noaa.gov/billions/.
5 Shafer et al., “Managing the 2011 Drought.”
6 SGPCP website.

LEARNING FROM SUCCESS IN CLIMATE-INFORMED DECISION-MAKING | 21
El Niño Forecasting in the Pacific Islands
EL NIÑO HITS THE PACIFIC
When Charles (Chip) Guard first began working as a weather forecaster in the Pacific Islands in the late 1980s, no one had heard of El Niño, yet everyone had experienced its impacts. In 1982 and 1983, a strong El Niño brought devastating drought to the Pacific Islands. Residents had little to no warning, and the consequences were widespread. In places where water sup-plies are already strained, the impacts of drought can cascade into food shortages and public health emergencies, bring economies to a halt, and even ignite or escalate conflict. As the 1982–83 drought persisted, international aid organizations and militaries scrambled to de-liver much-needed water, food, and medical supplies. Provisions trickled in over the vast distances that separate the affected areas, including American Samoa, the Federated States of Micronesia, Guam, and the Republic of the Marshall Islands.
Guard joined the National Weather Service Forecast Office in Guam when the 1982–83 disaster was still fresh in the communities’ memories. In early 1997, a pattern of warming in the ocean waters of the eastern Pacific suggested that a very strong El Niño was on the way. The pattern resembled the strong and sudden warming in the Pacific during the previous decade’s event, only this time the Pacific Island nations received an advance warning. As part of a small meteorological team at the University of Guam (UOG) and the University of Ha-wai‘i at Mānoa, Guard and his team took this information directly to the islands, talking with people “eyeball-to-eyeball.” When they couldn’t get a meeting with government leaders, they went to religious groups. Guard and his team used the 1982–83 drought as an example of what communities could expect in the coming year. Leaders on coral atoll islands, where water supplies are very limited even under normal conditions, listened with alarm.
Communicating the forecasts made a critical difference. People began conserving water ahead of time. Most importantly, governments issued emergency declarations in advance of the onset of drought, paving the way for the delivery of water and food before the worst im-pacts hit. Guard is not aware of any lives lost in the U.S.-affiliated Pacific Islands as a result of the 1997–98 drought, which in all other respects was as severe as the 1982–83 event.
PACIFIC ENSO APPLICATIONS CLIMATE (PEAC) CENTER PROVIDES AN EARLY WARNING, ENABLING PACIFIC ISLAND COMMUNITIES TO LESSEN THE IMPACTS OF DROUGHT
The more effective approach to early warning of El Niño events did not arise by accident. Following the experience of 1982–83, U.S.-affiliated Pacific Island government leaders called upon U.S. partners to develop tailored climate forecasts that could enhance community resil-ience. They responded, establishing the Pacific ENSO Applications Center (later changing
Communicating
forecasts made a
critical difference,
paving the way for
water and food
delivery before the
worst impacts hit

22 | EAST-WEST CENTER
its name to Pacific ENSO Applications Climate Center, or PEAC Center), a collaboration of the University of Hawai‘i at Mānoa, NOAA and its National Weather Service, the Uni-versity of Guam, the Pacific Basin Development Council, and the East-West Center. Using cutting-edge science, the PEAC Center provided the technical capacity to predict seasonal patterns in rainfall, sea levels, and tropical cyclone activity up to a year in advance. At that time, Guard was located at the University of Guam as a research associate. He worked with national and state governments to gain access to the islands, and once there, enlisted many local government agencies (emergency and water managers, health agencies, weather people, etc.) and non-government (service and religious) organizations as liaisons and communica-tors between the new PEAC Center and island governments.
Tailored climate predictions and services were especially needed in a region uniquely vulnerable to climate extremes associated with the El Niño Southern Oscillation (ENSO). ENSO is an ocean-atmosphere climate phenomenon that has a warm phase (El Niño), a cold phase (La Niña), and a neutral phase. This cycle recurs about every three to seven years, and the El Niño phase typically persists for 12–16 months. In the Pacific region, ENSO affects rainfall, ocean temperature, sea levels, storminess, wave size, and winds. Islands that rely heavily on rainfall may increase pumping from groundwater wells during drought, causing electricity use to rapidly increase and stressing freshwater wells and distribution systems.1 El Niño also affects agriculture and fisheries, causing crop stress and failure as well as distur-bances in fish migrations.2 Early warning is especially crucial in the Republic of the Marshall Islands (RMI) and other atoll islands, which depend on rainfall for more than 90 percent of their water supply and whose remoteness means shipping in food and fresh water can take weeks.
To address the need for seasonal forecasts in the Pacific Islands, PEAC began publishing a quarterly newsletter reporting the climate-related impacts from the previous quarter and is-suing an outlook for the upcoming 12 months. Still, PEAC needed local assistance monitoring climate patterns to improve their forecasts, so in 2005 they set up monthly conference calls in which forecast officers throughout the islands reported on current rainfall, storms, and other climate patterns. The calls enabled PEAC to use real-time local data to improve the statisti-cal models for rainfall and sea levels. Together, participants on each monthly call reviewed
Chip Guard, speaking
with Chuuk State officials
in the Federated States
of Micronesia. Source:
Pacific ENSO Applications
Climate Center.
Tailored climate
predictions were
especially needed
in a region uniquely
vulnerable to climate
extremes

LEARNING FROM SUCCESS IN CLIMATE-INFORMED DECISION-MAKING | 23
a proposed forecast for the upcoming quarter and formed a final consensus forecast. A NOAA Corps officer was designated to take on the task of convening these monthly calls and disseminating the quarterly newsletter, adding critical capacity.
USE OF FORECASTS IN EMERGENCY PREPAREDNESS NOW COMMONPLACE
The provision and use of early warnings for El Niño events have repeatedly been put to the test, as El Niños struck in 2002–03, 2009–10, and 2015–16. Forecasting is now so institu-tionalized that U.S. embassies, FEMA (Federal Emergency Management Agency), USAID (United States Agency for International Development), and Pacific Island governments ac-tively seek out the forecasts to plan for the seasons ahead.
For the 2016 El Niño, the RMI Weather Service Office received early detection of the El Niño event from the PEAC Center and distributed early warnings to local authorities and communities well ahead of time, identifying the atolls forecasted to be hardest hit. The Government of the Marshall Islands responded proactively and initiated emergency response measures in early 2016. Acting on these forecasts, small exporters stored raw materials before the drought, which allowed them to maintain their production.3 Still, the drought was se-vere and had wide-ranging impacts. In the months that followed, stored water was depleted, salinity rose in groundwater wells, crops and livestock sustained damage, illness increased, and households reported loss of income. Despite the early warning successes, Guard said that messaging well ahead of ENSO events remains challenging and that all droughts are not ENSO-related.
THEMES FOR CLIMATE KNOWLEDGE PROVIDERS AND USERS
Identify how to provide data and knowledge in localized, relevant formats. The sharp contrasts over small distances that characterize island microclimates mean that the response to El Niño differs for each of the U.S.-affiliated Pacific Islands. Managers need-ed localized predictions to help them mobilize an early response and avoid losses. The PEAC
Center’s use of localized monitoring and newsletter-style forecasts ensured that their mes-sages were relevant to local decision-makers.
Although the forecasting technology evolved and the PEAC Center added new features such as a drought index, the format in which the forecasts are delivered remained the same. Current PEAC Center Director Jim Potemra explains that when they tried to move from printed newsletters to online formats, users urged them to keep the newsletter print-based. In a region where web-based communications are sometimes unreliable, print was some-thing everyone could rely on. Only in 2019, when the PEAC Center became fully part of the National Weather Service and rebranded as the PEAC Service, did it phase out hard copies of the newsletter after more than 20 years of continuously producing them.
Commit to sustained participation in “boundary networks” to improve prediction capabilities and build relationships of trust. Since El Niño forecasting depends on monitoring a host of ocean and atmospheric variables as they develop, and on using those observations to improve the model over time, it has
Partners throughout
the U.S.affiliated
Pacific Islands monitor
local climate and report
their observations

24 | EAST-WEST CENTER
taken many years to fully develop skill in the models. Partners throughout the U.S.-affiliated Pacific Islands contributed to the refinement by monitoring local climate and reporting their observations month after month. (The PEAC Center had its one-hundredth monthly call in 2013.) The sustained interaction that the PEAC Center had with weather service and weather forecast offices promoted continued participation in the project and signaled the importance of monitoring to enable earlier and more accurate predictions.4
Empower local champions to initially drive climate science application, and encourage the integration of climate considerations into workflows to sustain initiatives in the long run.The fact that Guard and the PEAC Center team delivered seasonal forecasts for decades was key to institutionalizing this capacity within weather offices and government ministries. Governments avoided economic impacts and loss of lives by heeding Guard’s and the PEAC Center’s early warnings ahead of the onset of El Niño, and began to seek out their seasonal forecasts. At a time when few scientists traveled to remote atolls, his and the PEAC team’s direct, personal interactions with island residents created trust in the relationship that governments needed before issuing disaster declarations and spending money prior to the drought striking. Now, in addition to long-range PEAC predictions ahead of droughts, gov-ernments also seek out the National Weather Service’s drought information statements and the U.S. Drought Monitor designations of severity levels during events.
TOOLS AND RESOURCES
Pacific ENSO Applications Climate Center: https://www.weather.gov/peac/
REFERENCES
1 H. Annamalai, V. Keener, M.J. Widlansky, and J. Hafner, “El Niño Strengthens in the Pacific: Prepar-
ing for the Impacts of Drought,” AsiaPacific Issues 122 (December 2015), http://www.eastwestcenter
.org/publications/el-ni%C3%B1o-strengthens-in-the-pacific-preparing-the-impacts-drought.
2 Ibid.
3 N. Leenders, P. Holland, and P. Taylor, Post Disaster Needs Assessment of the 2015–2016 Drought, re-
port produced by the Republic of the Marshall Islands, 2017, https://www.gfdrr.org/en/publication/
post-disaster-needs-assessment-2015-2016-drought.
4 U.S. National Oceanic and Atmospheric Administration (NOAA), Pacific Islands Climate Storybook,
July 2015, http://pacificislandsclimate.org/storybook/Pacific_Islands_Climate_Storybook.pdf.
At a time when few
scientists traveled
to remote atolls, the
PEAC team’s personal
interactions with
residents created trust
LEARNING FROM SUCCESS IN CLIMATE-INFORMED DECISION-MAKING | 25
Learning Across Scales and Regions: Themes and Discussion
The preceding case studies have highlighted how usable climate information and products were developed and how they were applied in key decisions at varying geographic scales across three U.S. regions. These examples demonstrate and reaffirm factors previously shown to contribute toward making science usable. Stable funding for a span of several years, or decades in some cases, contributed toward recruiting and retaining talented, committed staff in many of the organizations involved. Other factors identified as contributing toward these successes are discussed in this section. The cases provide new insights, which we have sum-marized as five practical lessons for anyone seeking to better integrate climate considerations into decision-making.
I. IDENTIFY HOW TO PROVIDE DATA AND KNOWLEDGE IN LOCALIZED, RELEVANT FORMATS.
Appears in:• Local Climate Adaptation Efforts in the City of San Angelo• Enhancing the Resilience of Iconic Coastal Ecosystems on Hawai‘i Island• Increasing Conservation Resilience in the Southern Great Plains• El Niño Forecasting in the Pacific Islands
Across all the cases examined, management decisions grounded in science relied on data that were first translated and then applied to address problems in specific sectors and locales. Users of climate information (municipal staff and resource managers) achieved this through partnering with the producers of the information (climate scientists and technical experts), as well as by drawing on their own knowledge of the biophysical and social systems that their interventions targeted. Studies reviewing research on the use of climate information in decisions have found that the degree to which information is perceived as fitting the specific needs of the user is central to the uptake of climate products for decision-making.1,2,3,4 Deci-sion-makers often want information at fine geographic scales, and they perceive information localized to the resources and systems they are managing to be most usable.5
Co-production, in which scientists and user communities interact to develop usable information and tools, provides a model for producing local and relevant formats. To un-derstand which brackish water pools were most threatened on Hawai‘i Island, The Nature Conservancy and its science partners overlaid future projections for sea level rise with land cover and ecosystem data to rate and map ponds according to future risks. Developing the management tool involved understanding managers’ local knowledge of current threats to
Decisionmakers often
want information at
fine geographic scales,
localized to the re
sources and systems
they are managing

26 | EAST-WEST CENTER
the pools and the factors affecting the stressors, tailoring this to fit the scale of the ecosystem, and integrating additional risk factors with the projections to create the ponds’ risk profiles. Similarly, to better assist community-based resilience efforts in San Angelo, Texas, a team of scientists produced localized climate projections based on input from city department staff. As practitioners identified which weather events and associated thresholds impacted various city operations, they gained an understanding of how climate information can be applied to their work. The process led to the production of future climate information that better ad-dressed their specific needs.
II. EMPOWER LOCAL CHAMPIONS TO INITIALLY DRIVE CLIMATE SCIENCE APPLICATION, AND ENCOURAGE THE INTEGRATION OF CLIMATE CONSIDERATIONS INTO WORK-FLOWS TO SUSTAIN INITIATIVES IN THE LONG RUN.
Appears in:• Local Climate Adaptation Efforts in the City of San Angelo• Managing Water in the Colorado River Water Conservation District• El Niño Forecasting in the Pacific Islands
Someone who initially champions climate information in the context of an organization’s or network’s work can increase the chance that climate science will be included in decisions. For example, the City of San Angelo’s planning and development administrator, AJ Fawver, became this champion, seeking out and securing funding to support a cross-departmental project and then serving as focal point and facilitator for collaboration among city depart-ment heads and staff.
While partnerships with science institutions enable access to data and information to support decisions, the impetus to seek out these partnerships and apply climate information often originates within management institutions (city governments and conservation orga-nizations, for example). External forces in the form of climate or weather events, funding opportunities, or national programs often influence the timing and urgency of such actions.
Once the initial hurdles of figuring out when and how to incorporate climate consider-ations into an organization’s work are overcome, an opportunity opens for climate informa-tion to become a part of the normal workflow. Whether the support and processes to account for climate risk become institutionalized appears to be a key factor in the continuation of these initiatives. The Rockefeller Foundation’s 100 Resilient Cities Initiative (100RC) pro-vided selected cities with initial funding for a Chief Resilience Officer to lead initiatives that identify and address shocks and stresses—including those stemming from climate variability and change. The Urban Institute examined the progress of cities that received support from 100RC five years after the program’s launch. They observed that the cities that permanent-ly changed how they did business, by institutionalizing new resilience-focused positions or decision-making structures into the city government, were farther along than other cities in implementing their climate resilience strategies.6 In the Pacific Islands region, the relation-ships and communication lines that Chip Guard established became the basis for a region-al climate information system that now directly informs the hazard management programs of U.S.-affiliated Pacific Islands. At the Colorado River Water Conservation District, the
Cities that
permanently changed
how they did business
were farther along in
implementing climate
resilience strategies

LEARNING FROM SUCCESS IN CLIMATE-INFORMED DECISION-MAKING | 27
consideration of climate change and use of climate information have become integrated parts of the staff’s workflow, informing their long-range water management activities.
III. COMMIT TO SUSTAINED PARTICIPATION IN “BOUNDARY NETWORKS” TO IMPROVE PREDICTION CAPABILITIES AND BUILD RELATIONSHIPS OF TRUST.
Appears in: • Managing Water in the Colorado River Water Conservation District• El Niño Forecasting in the Pacific Islands
In several long-standing efforts to make use of climate information, we noted a dedication to participating in cooperative data collection or other attempts to assess and understand a system, involving the same key users and producers over a long period. El Niño forecasting in the Pacific Islands has for more than a decade maintained a network of scientists, forecast-ers, and users who contribute data and expert judgement toward consensus forecasts. This case lends further evidence to the idea that relationships developed between various user and producer partners over time can help to develop trust in climate products and information, and can counterbalance misunderstanding and the perceived irrelevance of scientific infor-mation.7,8 The sustained interaction between partners in the Pacific Islands, sharing data and challenges, has also contributed toward overcoming a key barrier to forecast usability: low prediction skill. And, the interactions sometimes help stakeholders understand the limits of climate science, especially when there are gaps between what users desire and what climate science can provide.9
Interventions that bring climate information providers and potential users together to interact through networks and meetings have been shown to shape science usability.10,11,12 Boundary organizations—programs that provide a neutral, legitimate space for engagement between scientists and decision-makers, while remaining accountable to each group—play a crucial role in keeping these networks going.13 The Pacific ENSO Applications Climate Center served this role for El Niño forecasting in the Pacific Islands.
Engineers at the Colorado River Water Conservation District have long-standing rela-tionships with what they call “integrators”—boundary programs, including Western Water Assessment (a NOAA RISA team), that understand and help them to navigate the broad landscape of information available. These long-standing relationships have built trust and helped the integrators to identify, translate, and share technical information that is most rel-evant to the District and other potential users.
IV. ENCOURAGE DIVERSE AND SOMETIMES UNLIKELY COLLABORATIONS.
Appears in:• Local Climate Adaptation Efforts in the City of San Angelo • Increasing Conservation Resilience in the Southern Great Plains
Collaborations involving partners with a range of expertise areas and management responsi-bilities can help refine narratives about climate to increase their salience to various audiences
Relationships
between user and
producer partners can
counterbalance the
perceived irrelevance
of scientific information

28 | EAST-WEST CENTER
and communities. Including partners with varying fields of expertise can speak to the range of priorities surrounding an issue. In addition, the presence of multiple partners provides an avenue for each partner organization to contribute unique resources (expertise, financial or logistical support) and makes it possible to undertake efforts with only a moderate impact on any one organization.14 Boundary programs, such as the NOAA RISA programs, often provide a convening function and can contribute to the development of such collaborations. This has played out in the cases of the Gulf Coast Prairie Landscape Conservation Cooper-ative network and the collaboration of departments across the City of San Angelo.
While some collaborations seem natural, such as between forecasters and water managers, potential benefits can arise from unlikely or less intuitive networks. These two case studies reveal that the shared priority of improving climate resilience can overcome geographical, sectoral, and governmental silos and lead to rewarding collaborations that improve the use of local climate data. For San Angelo, bringing together an assortment of departments repre-senting diverse sectors for a climate resilience project had never been done before. Similarly, the Gulf Coast Prairie LCC network focused on the new collaborative effort of creating synergistic activities across the region’s climate information providers, including the South-ern Climate Impacts Planning Program (a NOAA RISA program), to address a variety of conservation issues that span state boundaries. The wide range of viewpoints and skill sets represented in the collaborations in both of these cases contributed strategically to outcomes by expanding resources and funding opportunities and by promoting learning.
Capacity for organizing and sustaining collaborations will vary across different organi-zations. Participating in coordination activities, even at a low commitment of time and staff as these cases demonstrate, can have outsized impacts toward promoting the integration of climate considerations into decisions.
V. RECOGNIZE THAT CLIMATE KNOWLEDGE BROKERS ARE OFTEN NON-SCIENTISTS.
Appears in:• Enhancing the Resilience of Iconic Coastal Ecosystems on Hawai‘i Island
The notion that climate scientists are best positioned to lead the delivery of science prod-ucts is fading, and climate-savvy managers are increasingly assuming the role of “knowledge brokers,” connecting their peers and wider user communities to climate science and prod-ucts. This is demonstrated in the actions of The Nature Conservancy on Hawai’i Island, which published the mapping tool assessing climate-related and other risks for ecosystems along the South Kona coast. Community groups and local governments then applied the tool in their own planning and sometimes consulted with The Nature Conservancy staff on the potential for expanding the tool or tailoring the underlying climate model outputs to their specific needs.
Although the manager-as-knowledge-broker is a prominent theme in just one of the case studies we examined, it is noted in other cases of knowledge products co-developed by cli-mate science users and producers.15,16 Staff of water management organizations in the Huron River watershed participated in a series of meetings convened by boundary organizations to facilitate production and application of locally relevant climate information toward building
While some
collaborations seem
natural, potential
benefits can arise
from unlikely or less
intuitive networks
Climatesavvy
managers are
increasingly assuming
the role of ‘knowledge
brokers’

LEARNING FROM SUCCESS IN CLIMATE-INFORMED DECISION-MAKING | 29
resilience. As water management staff and engineers learned about and gained confidence with climate science and modeling, they began to share information and products with oth-ers in their organizations and with users outside the original boundary network.17 As users and producers work together, they might maximize efficiency in the spread of information by empowering managers in this role and building into product design the potential for use by additional stakeholders. At the same time, scientists should be willing and prepared to support an increasing number of “clients” who seek credible, trusted sources of climate in-formation.
REFERENCES
1 L. Dilling and M.C. Lemos, “Creating Usable Science: Opportunities and Constraints for Climate
Knowledge Use and Their Implications for Science Policy,” Global Environmental Change 21, no. 2
(2011): 680–689, https://doi.org/10.1016/j.gloenvcha.2010.11.006.
2 M.C. Lemos, C.J. Kirchhoff, and V. Ramprasad, “Narrowing the Climate Information Usability
Gap,” Nature Climate Change 2, no. 11 (2012): 789–794, https://doi.org/10.1038/nclimate1614.
3 A.S. Mase and L.S. Prokopy, “Unrealized Potential: A Review of Perceptions and Use of Weather
and Climate Information in Agricultural Decision Making,” Weather, Climate, and Society 6, no. 1
(2013): 47–61, https://doi.org/10.1175/WCAS-D-12-00062.1.
4 U.S. National Oceanic and Atmospheric Administration (NOAA), Pacific Islands Climate Storybook,
July 2015 report, http://pacificislandsclimate.org/storybook/Pacific_Islands_Climate_Storybook.
pdf.
5 Dilling and Lemos, “Creating Usable Science.”
6 C. Martín and S. McTarnaghan, Institutionalizing Urban Resilience: A Midterm Monitoring and Eval-
uation Report of 100 Resilient Cities (Washington, DC: Urban Institute, 2018), http://www.100resil-
ientcities.org/midterm-report/.
7 Dilling and Lemos, “Creating Usable Science”; U.S. NOAA, Pacific Islands Climate Storybook.
8 U.S. NOAA, Pacific Islands Climate Storybook.
9 C.J. Kirchhoff, M.C. Lemos, and S. Kalafatis, “Narrowing the Gap between Climate Science and
Adaptation Action: The Role of Boundary Chains,” Climate Risk Management 9 (2015): 1–5, https://
doi.org/10.1016/j.crm.2015.06.002.
10 Dilling and Lemos, “Creating Usable Science.”
11 M.C. Lemos and B.J. Morehouse, “The Co-production of Science and Policy in Integrated Climate
Assessments,” Global Environmental Change 15, no. 1 (2005): 57–68, https://doi.org/10.1016/j.gloen-
vcha.2004.09.004.
12 J.L. Lowrey, A.J. Ray, and R.S. Webb, “Factors Influencing the Use of Climate Information by Colo-
rado Municipal Water Managers,” Climate Research 40, no. 1 (2009): 103–119, https://doi.org/10.3354/
cr00827.
13 Kirchhoff et al., “Narrowing the Gap between Climate Science and Adaptation Action.”
30 | EAST-WEST CENTER
14 M. Shafer, D. Brown, and C. McNutt, “Managing the 2011 Drought: A Climate Services Partner-
ship,” in Climate in Context: Science and Society Partnering for Adaptation, ed. A.S. Parris et al. (West
Sussex, UK: John Wiley & Sons Ltd., 2014).
15 Kirchhoff et al., “Narrowing the Gap between Climate Science and Adaptation Action.”
16 S.E. Kalafatis, M.C. Lemos, Y.-J. Lo, and K.A. Frank, “Increasing Information Usability for Climate
Adaptation: The Role of Knowledge Networks and Communities of Practice,” Global Environmental
Change 32 (2015): 30–39, https://doi.org/10.1016/j.gloenvcha.2015.02.007.
17 Kirchhoff et al., “Narrowing the Gap between Climate Science and Adaptation Action.”
LEARNING FROM SUCCESS IN CLIMATE-INFORMED DECISION-MAKING | 31
Appendix A: Interview Guide
The sustained production and use of weather and climate information: Identifying elements of success across multiple sectors
Questions for Climate Information Providers
1. What activities does {insert project name} engage in to provide climate information, and what outputs do you produce (including data, products, workshops, etc.)? a. Who are your collaborators?
2. Who uses the products and other outputs created by {insert project name}, and how have they used them? Do you know of any times that the products and other outputs have been used to inform any decisions? Can you think of any examples when the products and other outputs have impacted an individual’s or group’s knowledge or understanding of weather and climate?
3. Has that remained the same throughout the project, or has it evolved in response to user needs? If so, how has the produced information changed and why?
4. What types of engagement do you use with the internal project participants and other external audiences or stakeholders? How often does this engagement occur?
5. What motivates you to produce climate information? a. Is there a legal mandate for your job to produce climate information?b. Is anyone required to use the information you produce?
6. What elements enable your program to be effective (i.e., successful)?a. Is there support from stakeholders for this work? If so, could you provide examples?b. What other general types of support do you receive (financial or in-kind)? c. Who are your biggest advocates?
7. Have you faced any barriers to providing climate information or expanding your work? (political, staff capacity, technological, etc.)a. Have you overcome any of these barriers and, if so, how?
8. Are you aware of any challenges that others have faced in using the information that you produce (i.e., too hard to find information, information they want is not represented, spatial problems, lack of technical skills, etc.)?

32 | EAST-WEST CENTER
a. What improvements could be made with the climate information you use (e.g., years of data, spatial coverage, display of data, etc.) to better meet the needs of your work?
Questions for Climate Information Users
1. What is your position? What do you do on a daily basis? What types of decisions do you make?
2. What kinds of weather or climate information do you use, and how do you use it? a. Do you consider historical and future weather/climate information in your deci-
sion-making, or primarily one over the other? b. What timescales of information do you use, such as daily, monthly, and seasonal pat-
terns, or long-term trends (historical and future)?
3. What has motivated you to use this weather or climate information in your profession?a. Does your profession require this use, or have you chosen to use climate information
on your own?
4. Which organizations or programs do you rely on for information about weather and climate? a. What are the specific products that you use? b. For each program/organization, how often do you use information from them? c. How do you learn about updated climate information/sources (through your organiza-
tion, online/self, emails, newsletter, reports, etc.)?
5. Can you give any examples of when the products or information from the sources you named earlier have impacted your understanding of weather and climate, and/or impacted your decision-making processes? If none can be identified yet, can you think of how using climate/weather information might impact your work?
6. Who has supported (financial or otherwise) your organization’s use of climate and weath-er information? For example, do you get support from:a. Your organization’s leadership? b. Organizational stakeholders? c. Who else has influenced your use of information in decisions?
7. Do you face any barriers to incorporating climate information in your work (political, staff capacity, etc.)?a. Have you overcome any of these barriers and, if so, how?
8. What challenges exist with using the climate data sources you mentioned or sources that you wish existed (i.e., too hard to find information, information wanted is not represent-ed, spatial problems, etc.)?a. What improvements could be made with the climate information you use (e.g., years
of data, spatial coverage, display of data, etc.) to better meet the needs of your work?
LEARNING FROM SUCCESS IN CLIMATE-INFORMED DECISION-MAKING | 33
Acknowledgments
The authors would like to thank all of the individuals who generously shared their time and expertise in the preparation of this report. Specifically, we thank those who we interviewed in the development of the case studies:
• Bill Bartush (Gulf Coast Prairie Landscape Conservation Cooperative) • AJ Fawver (formerly City of San Angelo)• Charles “Chip” Guard (National Weather Service Forecast Office, Guam) • Dave Kanzer (Colorado River Water Conservation District)• John Marra (National Oceanic and Atmospheric Administration [NOAA] National
Centers for Environmental Information) • Don Meyer (Colorado River Water Conservation District) • Jim Potemra (University of Hawai‘i at Mānoa)• Chad Wiggins (The Nature Conservancy)
We also thank the individuals who assisted in reviewing and providing additional guidance to the report: Lisa Dilling, Daniel Ervin, Victoria Keener, and Mark Shafer. We acknowl-edge and thank the East-West Center publications staff, particularly Elisa Johnston and Carol Wong, as well as Susan Yamamoto for the report design. Further, we express our gratitude to Chelsea Combest-Friedman and Caitlin Simpson with the NOAA Climate Program Office for financially supporting the production of this report.
This work is supported by funding from the National Oceanic and Atmospheric Ad-ministration for Southern Climate Impacts Planning Program (SCIPP) under grant number NA18OAR4310337, for the Pacific Regional Integrated Sciences and Assessments (RISA) pro-gram under grant number NA15OAR4310146, and for Western Water Assessment under grant number NA15OAR4310144.
34 | EAST-WEST CENTER
About the Authors
BENÉT DUNCAN, Ph.D.
Benét Duncan is the Managing Director and former Sustained Assessment Specialist for West-ern Water Assessment. She manages the program’s day-to-day activities and participates in in-novative research in collaboration with stakeholders and decision-makers in Colorado, Utah, and Wyoming, helping them to make the best use of science in managing climate impacts. She also coordinates the program’s climate assessment activities, including developing guid-ance for sustained assessment in the U.S. southwest region. Dr. Duncan received a Ph.D. in Atmospheric and Oceanic Sciences from the University of Colorado Boulder. She previous-ly worked as a program scientist at a science-policy non-profit in California and complet-ed a postdoctoral fellowship with the NOAA/UCAR Postdocs Applying Climate Expertise (PACE) program. [email protected]
ZENA GRECNI, M.E.M.
Zena Grecni is the Sustained Climate Assessment Specialist for the Pacific RISA. She coordi-nates regional climate assessments for Hawai‘i and the U.S.-Affiliated Pacific Islands. For the Pacific Islands Regional Climate Assessment (PIRCA), a network of federal, state, and local partners, Ms. Grecni serves as a regional focal point and synthesizes climate information to support Pacific Island adaptation initiatives. She was a regional chapter author for the Fourth National Climate Assessment. Ms. Grecni received a Master of Environmental Management (M.E.M.) from Yale School of Forestry and Environmental Studies. She previously worked as
a communications specialist for the Pacific RISA and completed fellowships with the Global Islands Partnership (GLISPA) and the Secretariat of the Pacific Regional Environment Pro-gram (SPREP). [email protected]
LEAH SHORE, M.S.
Until February 2019, Leah Shore was the Climate Assessment Specialist for the Southern Climate Impacts Planning Program (SCIPP). Her work focused on the assessment of stake-holder risk and vulnerability to extreme weather and climate events, and how the use of cli-mate hazard data can better meet the needs of users in decision-making and adaptation efforts across Oklahoma, Texas, Arkansas, Louisiana, and coastal Mississippi. Ms. Shore received a Master’s in Climate Change and Society from North Carolina State University and a Bachelor of Science in meteorology from the University of Oklahoma. She previously worked as a me-teorologist for Early Alert, Inc. [email protected]
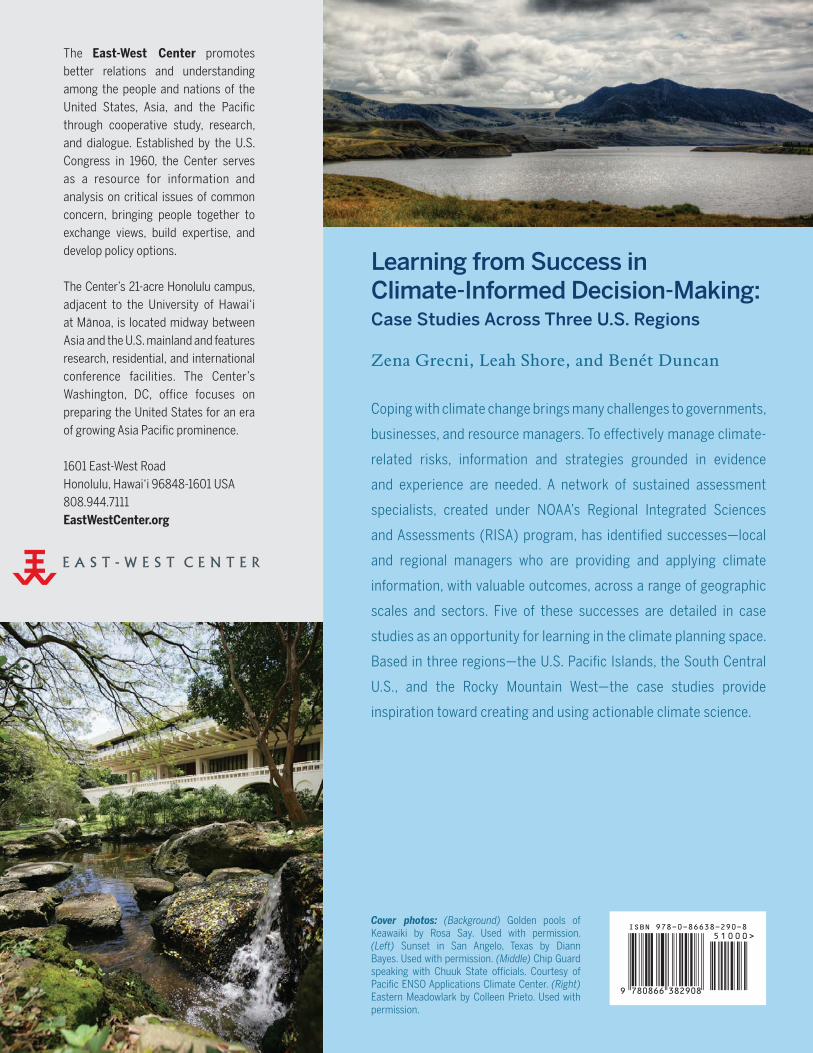
The East-West Center promotes better relations and understanding among the people and nations of the United States, Asia, and the Pacific through cooperative study, research, and dialogue. Established by the U.S. Congress in 1960, the Center serves as a resource for information and analysis on critical issues of common concern, bringing people together to exchange views, build expertise, and develop policy options.
The Center’s 21-acre Honolulu campus, adjacent to the University of Hawai‘i at Mānoa, is located midway between Asia and the U.S. mainland and features research, residential, and international conference facilities. The Center’s Washington, DC, office focuses on preparing the United States for an era of growing Asia Pacific prominence.
1601 East-West RoadHonolulu, Hawai‘i 96848-1601 USA808.944.7111EastWestCenter.org
Learning from Success in Climate-Informed Decision-Making: Case Studies Across Three U.S. Regions
Zena Grecni, Leah Shore, and Benét Duncan
Coping with climate change brings many challenges to governments,
businesses, and resource managers. To effectively manage climate-
related risks, information and strategies grounded in evidence
and experience are needed. A network of sustained assessment
specialists, created under NOAA’s Regional Integrated Sciences
and Assessments (RISA) program, has identified successes—local
and regional managers who are providing and applying climate
information, with valuable outcomes, across a range of geographic
scales and sectors. Five of these successes are detailed in case
studies as an opportunity for learning in the climate planning space.
Based in three regions—the U.S. Pacific Islands, the South Central
U.S., and the Rocky Mountain West—the case studies provide
inspiration toward creating and using actionable climate science.
Cover photos: (Background) Golden pools of Keawaiki by Rosa Say. Used with permission. (Left) Sunset in San Angelo, Texas by Diann Bayes. Used with permission. (Middle) Chip Guard speaking with Chuuk State officials. Courtesy of Pacific ENSO Applications Climate Center. (Right) Eastern Meadowlark by Colleen Prieto. Used with permission.
LEAR
NIN
G FR
OM
SUC
CESS IN
CLIM
ATE-INFO
RM
ED D
ECISIO
N-M
AK
ING
EAST-WEST C
ENTER
GR
ECN
I, SHO
RE, A
ND
DU
NC
AN
9 780866 382908
51000>ISBN 978-0-86638-290-8