case 27
DESCRIPTION
Case studyTRANSCRIPT

..--- - - - - - - - - - - - --- - _ ._ - -
EMI Group plc In ellis [nternet age , lhe consumer is using music content more lhan ever before-wherlier lhal's
playlisling, [Jodcasling, personalizing, sharing, duwnluading or juSt simply enjuyinR it. The digiwl
revolwion has cau.led a compleLe change LU lhe culwre, opera liuns , and attiwde uf nwsic
companies n' crywhere. It hasn't been eas y, and we must cerwinly continue LU fig/a !Jiracy in all its
forms. BlIl there can be no doubt that with eWll greater commitment co innuvat ion and a true fun iS
on the consumer, digiLaI dislriblllion is becoming Llle besl lhing ella I ever happened LU lhe music
business and the music fan . - Eric Niwli, CEO. EMl Groupl
In early spring 2007, Martin Stewart drove through the darkened streets of Kensington in West London. As chief financial office r (CFO) for global music giant EMI, Stewart already knew most of the news that would break at the comp any' s April 18 ea rnings announcement. Annual underlying revenue for the company was down 16% to
GBPl .8 billion (British pounds). Earnings per share (EPS) had also dropped from 10.9 pence (p) in 2006 to -36.3p in FY2007. Those disappointin g numbers were roughly in line with the guidance Stewart had given investors in February. The performance reflected the g lobal decline in music industry revenues, as well as the extraordinary cost of the restructurin g program EMI was pursuing to realign its investment priorities and focus its resources to achieve the best returns in the future.
The earnings announcement would be accompanied by announcing the amount of the dividend, which had not yet been determined. The board would meet soon to review EMI' s annual results, and Stewart was to recommend an appropriate final dividend for the fisc al year.' On an annual basis, EMI had consistently paid an 8p-per-share dividend
'Iruernational Federation of Phonographic Industry (I FP!), " IFPI: 07 Digital Music Report," January 2007.
21n the United Kingdom, companies typically declared dividends twice a year, first with the mid-year results and second with the full-year results. Typically, EMI paid an interim divideild of2p per share and a final dividend of 6p per share. In addition, both EMI'o interim and finaldividends were paid out to shareholders in the following fiscal year. In November 2006, EMI's board committed to paying the interim dividend of 2p per share following its 2007 fiscal midyear results with actual payment to shareholders expected in April 2007. Both the 2p interim dividend and the recommended final dividend would be reflected in the 200S financial statements.
This case was written by Elizabeth W. Shurnadine (MBA '0 Il. under the supervision of Professor Michael J. Schill, and is based on public information. Copyr ight © 200S by the University of Virginia Darden School Foundation, Charlottesville, VA. All rights reserved. Tv order copies. send an e-mail to [email protected]. No part of /his publica tion /1/(I \' be reproduced, stored ill a retrieval system , used ill U spreadsheet , or transmitted in any [orm or bv 0/1 \ ' means-s-cle ctronic. mechanical , pho to copving, reco rding, or otherwi se-i-without the pe rmission 11 1he Durden Schoo! Foundation.
363

364 Part Five Management of the Firm's Equity: Dividends Repurchases, Initial Olfferings
to ordinary shareholders since 2002 (Exhibit 1). Now in light of EMI's recent performance, Stewart questioned whether EMI should continue to maintain what would represent a combined GBP63 million annual dividend payment. Although omitting the dividend would preserve cash, Stewart appreciated the negative effect the decision might have on EMI's share price, which was currently at 227p. Stewart recognized that EMI faced considerable threat of takeover. Although its board had recently been able to successfully reject an unsolicited 260p-per-share merger offer from its U:S. rival Warner Music, there continued to be considerable outside interest in taking over EM!. It seemed that boosting EMI's share price was imperative, if EMI wanted to maintain its independence.
EMI With a storied history that included names such as the Beatles, the Beach Boys, Pink Floyd, and Duran Duran, it was not difficult to understand why EM! considered its current and historical catalog of songs and recordings among the best in the world. EMI, Warner Music Group, Sony BMG Music Entertainment, and Universal Music Group, collectively known as "the majors," dominated the music industry in the early 2 1st century and accounted for more than two-thirds of the world's recorded music and publishing sales.:' Exhibit 2 contains a list of the global top-IO albums with their respective record labels for 2003-06.
Recorded music and music publishing were the two main revenue drivers for the music industry. EM! divided its organization into two divisions devoted to each of these operations. EMI Music, the recorded music side, sought out artists it believed would be long-term commercial-recording successes. One of EMI' s record labels marketed the artist's recordings to the public and sold the releases through a variety of retail outlets. EMJ's extensive music catalog consisted of more than three million songs. Recorded-music division sales came from both new and old recordings; existing catalog albums constituted 30% to 35% of the division's unit sales. Exhibit 3 contains a list of EMI's most-successful recording artists in FY2007.
EMI Music Publishing focused on the actual songs as opposed to the recordings. There generall y were three categories of publishing-rights owners in the music industry: the lyric's author, the music 's composer, and the publisher who acquired the right to exploit the song. These publishing-rights owners were entitled to royalties whenever and however their music was used. Music publishers categorized their revenue streams as mechanical royalties (sales of recorded music), performance royalties (performances of a song on TV, radio, at a live concert, or in other public venues such as a bars), and synchronization royalti es (use of a song in audiovisual works such as advertisements or computer games) . EMI included a fourth catego ry of royalties labeled "other," which incl uded sales of sheet music and
' William B. Drewry, Jolanta Masojada, Nick Bertolotti. and Giasone Salati. Credit Suisse Equity Research. "Global Music Industry. 'Just the Two of Us.' '' 16 June 2006. Sony BMG Music Entertainment was a jo int venture owned by Sony Corporation and Berte lsmann. Universal Music was owned by Vivendi.

365 Ca se 27 EMI Gro up pic
increasingly in the 21 st century, mobile ring tones and ring backs. Similar to the recorded-mu sic division, the music-publ ishing division identified songwriters with probable commercial potential and signed them to long-term contracts. The division then assisted the songwriters in marketing their works to record companies and other media firms. EMI' s curre nt publishing catalog encompassed more than one million musical compos itions. Exhibit 3 also contains a list of EMI's most-successful songwriters in the FY2007. EMI' s publishing business generated one-fourth of the total group revenue. Revenue in the publishing business was stable, and operating profi ts were positive.
In addition to seeking out and signing flourishing recording artists and songwriters to long-term agreements, both EMI divisions also expanded and enhanced their individual catalogs and artist rosters by strategic transactions. Two key acquisitions for EMI's recorded-music division were the 1955 acquisition of a leading American record label, Capitol Records, and the J992 acquisition of Virgin Music Group, then the largest independent record label. Both transactions added key recording stars such as Frank Sinatra, Nat King Cole, Janet Jackson, and the Rolling Stones. The musicpublishing division similarly targeted existing publishing assets with large, proven commercial potential such as the purchase of Motown founder, Berry Gordon's music catalog in various stages in 1997, 2003, and 2004.
Since the company's founding in 1897, EMI' s model had been that of "constantly seeking to expand their catalog, with the hits of today forming the classics of tomorrow." Both divisions pursued the goal of having the top-selling artists and songwriters and the deepest, most-recognized catalog assets. EMI welcomed technological innovations, which often drove increased music sales as consumers updated their music collections with the latest music medium (e.g., replacing an LP or cassette with the same recording on compact disc). But the latest technology, digital audio on the Internet, was different and revolutionary. Digital audio on the Internet demanded rethinking the business model of all the majors, including EMJ.
Di gital Audio and the Music Industry
Digital audio had been around since the advent of the com pact disc (CD) in the early 1980s. But, it was the 1990s combination of digital audio, Internet, and MP3 fi le format that brought the music industry to a new crossroa ds. The MP3 format had nearly the same sound quality as CDs; however, its small fil e size allowed it to be easily downloaded from the Internet, stored on a computer hard drive, and transferred to a digital audio player, generally referred to as an MP3 player.
Peer-to-peer file sharing Internet services, most notably Napster, were introduced in the late 1990s. First available in mid-1 999, Napster facilitated the exchange of music fi les. The use of Napster's fi le-sharing program exploded, and Napster claimed 20 million users by July 2000. Napster 's swift growth did not go unnoticed by the music industry. While the Recording Industry Association of America (RIAA) was
4 EM1 Group PL C, "A nnual Report 200 7."

366 Part Five Management of the Finn 's Equity: Dividends Repurchases. Initial Offferings
eventually successful in using the court system to force Napster to remove copyrighted material, it did not stop peer-to-peer fil e sharing. New services were quickly developed to replace Napster. The International Federation of the Phonographic Industry (IFPI), an organization that represents the recording industry worldwide, estimated that almost 20 billion songs were downloaded illegally in 2005.
EMI had an early presence on the Internet in 1993. In 1999, EMI artist David Bowie's album, hou rs . . . , was the first album by a major recording artist to be released for download from the Internet. None of the record labels were prepared, however, for how quickly peer-to-peer file sharing would change the dynamics of the music industry and become a seemingly permanent thorn in the music industry's side. In the wake of Napster's demise, music labels, including EMI, attempted different subscription services. But, most services failed for numerous reasons including cost, CD-burning restrictions, and incompatibility with most of the available MP3 players. It was not until spring 2003 when Apple launched its user-friendly Web site, iTunes Music Store, that legitimate digital audio sales really took off in the United States, the world 's largest market for music. iTunes began its global expansion in 2004 and sold its one-billionth download in February 2006. By the beginning of 2007, there were 500 legitimate online music services in over 40 countries, according to the IFPI, with $2 billion in digital music sales in 2006.
Despite the rise of legally downloaded music, the global music market continued to shrink due to the rapid decline in physical sales. Nielsen SoundScan noted total album units sold (excluding digital-track equivalents) declined almost 25% from 2000 to 2006.5 IFPI optimistically predicted that digital sales would compensate for the decrease in physical sales in 2006. Yet, in early 2007, IFPI admitted that " holy grail" had not yet occurred with 2006 overall music sales estimated to have declined by 3%.6 IFPI now hoped digital sales would overtake the decline in physical sales in 2007. Credit Suisse 's Global Music Industry Forecasts incorporated this view with a relatively fl at music market in 2007 and minor growth of l.I % to 1.5% in 2008 and 2009.7
The Credit Suisse analyst also noted that the music industry 's operating margins were expected to rise as digital sales became more signifi cant and related production and distribution costs declined ." Lehman Brothers was more conservative and assumed a fl at market for the next few years, commenting that the continued weakness into early 2007 implied the "market could remain tough for the next couple of years.?"
There was fear among many in the industry that consumers' abilities to "unbundle" their music purchases-the ability to purchase two or three favorite songs from an album online versus purchasing the entire album at a physical retail store-would put
5S rian Hiatt and Evan Serpick, "The Record Industry's Decline." Rolling.S tone.corn, 19 June 2007 (accessed 21 August 2008),
(, International Federation of Phonographic Industry ([FP\), "IFPI: 07 Digital Music Report ," January 2007.
7William S. Drewry. Jolanra Masojada, Dennis Sabo. and Ashish Gupta. Credit Suisse Equity Research, "Warner Music Group." 9 February 2007.
"Drewry, et al., "Just the Two of Us,"
"Richard Jones and Tamsin Garrity. Lehman Brothers Equity Research, "E lvll Group." 15 February 2007,

Case 27 EMt Group pic 367
negative pressure on music sales for the foreseeable future. A Bear Stearns research report noted:
While music consumption, in terms of listening time , is increasing as the iPod and other
portable devices have become mass-market products, the industry has still not found a way
of monetizing this consumption. Instead. growing piracy and the unbundling of the album,
combined with the growing power of big retailer s in the physical and iTunes in the digital
worlds, have left the industry in a funk. There is no immediate solution that we are aware
of on the horizon and in our view, visibility on sales remains POOL IO
Developments at EMI
The beginning of the new millennium had been incredibly difficult particularly within EMI' s recorded-music division where revenues had declined 27% from GBP2,282 million in 2001 to GBPI,660 million in 2006. Exhibits 4 and 5 show EMI's financial statements through FY2007. Fortunately, download able digital audio did not have a similar ruinous effect on the publishing division. EMI's publishing sales were a small buffer to the company's performance and hovered in a tight range of GBP420 million to GBP391 million during that period. CEO Eric Nicoli's address at the July 2006 Annual General Meeting indicated good things were in store for EMl in both the short term and the long term. Nicoli stressed EMI's exciting upcoming release schedule s, growth in digital sales, and success with restructuring plans.
EMI's digital sales were growing and represented an increasingly larger percentage of total revenues. In 2004, EMI generated group digital revenues of GBP 15 million, which represented just less than I% of total group revenues. By 2006, EMI had grown the digital revenue to GBPl12 million, which represented 5.4% of total group revenues. The expected 2007 digital sales for EMI were close to 10% of group revenues.
Given the positive expectation s for its 2007 fiscal year, financial analysts had expected EMI's recorded-music division to see positive sales growth in the year. EMI' s surprising negative earnings guidance on January 12 quickly changed its outlook . EMI disclosed that the music industry and EMI 's second-half-of-the-year releases had underperformed compared with expectations. While the publishing division was on track to achieve its goals, EMI's recorded-music division revenues were now expected to decline 6% to 10% from one year ago. The market and investor community reacted swiftly to the news. With trading volume nearly 10 times the previous day 's volume, EMI' s market capitalization ended up down more than 7%.
EMI further shocked the investment community with another profit warning just one month later. On February 14, the company announced that the recorded-music division's FY2007 revenues would actually decrease by around 15% year-over-year. EMI based its new dismal forecast on worsening market condition s in North America, where SoundScan calculated the physical music market had declined 20% in 2007. The investment community punished EMI more severely with this second surpri se
I('Nicholas Bell and Richard Gordon, CFA. Bear Stearns International Limited European Equity Research, "EMI," 27 February 2007.

368 Part Five Management of the Firm's Equity: Dividends Repurchases, Initial Offferings
profit warning, and EMI' s stock price dropped another 12%. British newspaper the Daily Telegraph reported shareholders were increasingly disgruntled with performance surprises. One shareholder allegedly said, "I think [Nicolij' s a dead duck. [EMI] is now very vulnerable to a [takeover] bid and Nicoli is not in any position to defend anything. I think the fin ance director [Martin Stewart] has also been tainted because it suggests they did not get to the bottom of the numbers." EMI analyst Redwan Ahmed of Oriel Securitie s continued contending EMI management 's recent news, " it's disastrous .. . they give themselves a big 6% to 10% range and a month later say it's 15%. They have lost all credibility. I also think the dividend is going to get slashed to about 5p.'.t I Exhibit 6 contains information on EMI's shareholder profile.
As its fiscal year came to a close, EMI's internal reports indicated that its February J4 guidance was close to the mark. The recorded-musi c division's revenue was down, and profits were negative. The publishing-division revenue was essentially fl at, and its division' s margin improved as a result of a smaller cost base. The company expected underlying group earnings before interest, taxes, depreciat ion, and amortization (EBITDA), before exceptional items, to be GBP 174 million, which exceeded analyst estimates. Digital revenue had grown by 59% and would represent 10% of revenue. EMI management planned to make a joint announcement with Apple in the next few days that it was going to be the first major music company to offer its digital catalog free from digital rights management and with improved sound quality. The new format would sell at a 30% premium . EMI management expected this move would drive increased digital sales.
Management was pleased with the progress of the restructuring program announced with the January profit warning. The plan was being implemented more quickly than expected and accordingly, more cost savings would be realized in FY2008. The program was going to cost closer to GBP 125 million, as opposed to the GBPI50 million previously announced. Upon completion, the program was expected to remove GBP 110 million from EMI' s annual cost base; the majority of the savings would come from the recorded-music division. The plan reduced layers in the management structure and encouraged the recorded-music and publishing divisions to work more closely together for revenue and cost syne rgies .V One headline-worthy change in the reorganization was the surprise removal of the recorded-mu sic division head, Alain Levy, which put Nicoli in charge of that division.
The Dividend Decision
Since the board had already declared an interim dividend of 2p per share in November 2006, the question was whether to maintain the past payout level by recommending an additional 6p final EMI dividend be paid. Considering EMI's struggling financial situation, there was good reason to question the wisdom of paying a dividend. Exhibit 7
II Alistair Osborne, "N icoli 'a dead duck' as EMI Issues New Warning," Daily Telegraph, 16 February 2007.
12Prior restructuring efforts over the past three years had collectively saved the company GB P180 million annually: however, they had resulted in a one-ti me implementation cost of GBP 300 million.

369 Case 27 EMI Group pic
provides a forecast of the cash flow effects of maintaining the dividend based on market-based forecasts of performance. Yet omitting the dividend was likely to send a message of lost confidence by management. Such a move seemed to be the last thing EMf needed to do because it could accelerate the ongoing stock price decline. ' :' Exhibit 9 depicts trends in the EM1 share price from May 2000 to May 2006. Many believed that music industry economics were on the verge of turning the corner. A decision to maintain the historic al 8p dividend would emphasize management's expectation of business improvement, despite the disappointing recent financial news. Forecasts for global economic growth cont inued to be s trong (Exhibit 10), and reimbursements to shareholders through dividends and repurchases were on the upswing among media peers (Exhibit 11).
As Stewart navigat ed his way home, the radio played another hit from a wellknown EM1 artist. Despite the current difficulti es, Stewart was convinced there was still a lot going for EMf.
I'Historically, there was strong evidence of significant negative stock price reactions [0 dividend cancellations (see Balasingham Balachandran , John Cadle, and Michael Theobal d, "Interim Dividend Cuts and Omissions in the U.K.: ' European Financial Management 2: 23- 38, for a study using only British firms; and Roni Michaely, Richard Thaler, and Kent Womack, "Price Reactions to Dividend Initiations and Omissions: Overreact ion of Drift')" Journal oj Finance 50: 573-608, for a larger study using U.S. firms). Both academics and practitioners vigorously debated the impact of dividend policy. In fact. Nobel laureate economists had argued that dividend policy should maintain little relevance to investors. Exhibit 8 conta ins a summary of Modigliani and Miller arguments.

-.I (,ol
<:>
EXHIBIT 1 I Financial and Stock Data per Share (in pence)
Wgtd. Avg. Fiscal Avg. Shares Year Basic Underlying Dividend Stock Price! Payout Ratio Using Dividend Outstanding
Underlying End EPS Diluted EPS per Share High Low Average Basic EPS Oil. EPS Yield (millions)
2001 10.1 21.9 16.0 691 .00 427 .00 566.0 158% 73% 2.8% NA 2002 (25.5) 11.8 8.0 505.00 214 .00 367.1 nmf 68% 2.2% 782 .8 2003 29 .3 15.7 8.0 365.00 80.00 194.7 27% 51% 4.1% 784.0 2004 (9.1) 15.5 8.0 278 .25 91.25 166.2 nmf 52% 4.8% 784.4 2005 9.6 13.1 8.0 281 .25 191 .00 236 .1 83% 61% 3.4% 785.6 2006 10.9 15.7 8.0 266.00 207 .00 244.2 73% 51% 3.3% 786.8 2007 (36 .3) 5.8 2.0p + TBD 313 .75 210 .75 263 .5 TBD TBD TBD 794 .8
,Stock price data is for the fiscal year period. For example, 2007 data is from April 1, 2006, to March 31, 2007. Stock price data was available for 2001 only from May 15. 2000 , to March 3 1, 2001.
Source s of data: Company Web site and Yahoo ' Finance .

371 Case 27 EMI Group pic
EXHIBIT 2 Top-10 Physical Album Sales (2003-06)
Artist Album Title Company
2006 1 Soundtrack High School Musical Walt Disney/Universal/EMI 2 Red Hoi Chili Pepper s Stadium Arcad ium Warner 3 The Beatles Love EMI 4 James Blunt Back to Bedlam Warner 5 Justin Timberlake FutureSexlLoveSounds SonyBMG 6 Beyonce B'Day SonyBMG 7 U2 U2 18 Singles Universal 8 Rascal Flails Me and My Gang Lyric StreeVHollywood/Universal/EMI 9 II Divo Amore Universal
10 Andrea Bocelli Amore Universal
2005 1 Cold play X&Y EMI 2 Mariah Carey The Emancipation Of Mimi Universal 350 Cent The Massacre Universal 4 Black Eyed Peas Monkey Business Universal 5 Green Day American Idiot Warner 6 Madonna Confessions on a Dancefloor Warner 7 Kelly Clarkson Breakaway SonyBMG 8 Eminem Curtain Call Universal 9 James Blunt Back to Bedlam Warner
10 Robbie Williams Intensive Care EMI
2004 1 Usher Confessions SonyBMG 2 Norah Jones Feels Like Home EMI 3 Eminem Encore Universal 4 U2 How To Dismantle An Atomic Bomb Universal 5 Avril Lavigne Under My Skin SonyBMG 6 Robbie Williams Greatest Hits EMf 7 Shania Twain Greatest Hits Universal 8 Destiny's Child Destiny Fulfilled SonyBMG 9 Guns N' Roses Greatest Hits Universal
10 Maroon 5 Songs About Jane SonyBMG
2003 1 Norah Jones Come Away With Me EMI 250 Cent Get Rich Or Die Tryin' Universal 3 Linkin Park Meteora Warner 4 Dido Life For Rent BMG 5 Beyonce Knowles Dangerously in Love Sony 6 Coldplay A Rush of Blood to the Head EMf 7 Evanescence Fallen Sony 8 Britney Spears In The Zone BMG 9 Avril Lavigne Let Go BMG
10 Celine Dion One Heart Sony
Source of data: International Federation of Phonographic Industry (IFPI) Web site.

372 Part Five Management of the Firm's Equity: Dividends Repurchases, Initial Offferings
EXHIBIT 3 EMI Top Recording and Publishing Successes in FY2007
Unit Sates"
Artist Album Title (millions)
The Beatles Norah Jones Corinne Bailey Rae Robbie Williams Keith Urban Lily Allen The Kooks RBD Joss Stone Utada Hikaru Depeche Mode Janet Jackson 30 Seconds to Mars Herbert Gronemeyer Sarah Brightm an Gerard Rene-Gordon Bob Segar Iron Maiden Diam's Renaud
Love 5.0 Not Too Late 4.2 Corinne Bailey Rae 2.7
Rudebox 2.5 Love, Pain & The Whole Crazy Thing 2.0 Alr ight, Still 1.7 Inside In/Inside Out 1.6 Celestial 1.3 Introducing Joss Stone 1.3 Ultra Blue 1.3 The Best of Depeche Mode Volume 1 1.2 20 yo. 1.2 A Beautiful Lie 1.2 12 1.1 Diva: The Single s Colle ction 1.0 Toppers Kerst Album 1.0 Face The Promis e 1.0 A Matter of Life and Death 0.9 DansMa Bulle 0.8 Rouge Sang 0.8
EMI Music Publishing's Most-Successful Songwriters of FY2007
Songwriter Song
Amy Wine hous e Rehab Beyonce Irreplaceable Brad Paisley The World Death Cab for Cut ie Soul Meets Body Enrique Iglesias Do You Know (Ping Pong Song) Good Charlotte Lifestyles of the Rich and Famous Hinder Lips of an Angel James Blunt Goodbye My Lover Jay-Z Show Me What You Got Kanye West Wouldn 't Get Far Kelly Clarkson Never Again Ludacr is Money Maker Natasha Bedi ngfield These Words Norah Jones Thinking About You Ozzy Osbourne I Don't Wanna Stop Panic! At The Disco I Write Sins Not Tragedie s Pink U + UrHand Rob Th oma s Lonely No More Take That Patience The Fray How To Save A Life
'A ll sales figures are for the 12 months ended March 31, 2007 . Unit sales include digita l albums and digital track album equivalent.
Source of data: Company annual report.

373 Case 27 EMl Group pic
EXHIBIT 4 Consolidated Income Statements (in millions of GBP, except per-share data)
For Years Ended March 31,
2003 2004 2005 2006 2007
Underlying Revenue 2,175 2,121 2 ,001 2,080 1,75 2
Group profit fro m op eratio ns before exceptional items and amortization 255 249 22 5 251 151
Exc eptional items (21 ) (138) (18) 3 (307)
Amortiza tion and impairment (43) (51) (48) (50) (53)
Share of profit from associates & jv 1 (0) 1 1 2
Profit (loss) from operations 191 60 161 204 (207)
Exceptional items: (Losses) on disposal or closu re of bus iness (25) (40)
Gains on d isposal of PP&E and investments 235 24 2 50
Prof it (loss) before finance charges 401 43 161 206 (157)
Finance charges (77) (96) (62) (88) (107)
Profit (loss) before taxation 324 (53) 99 118 (264)
Taxation (83) (20) (24) (28) (23)
Profit (loss) after taxat ion 241 (73) 75 90 (287)
Underlying EBITDA 1 297 284 250 276 174 Underlying PBT 2 179 163 141 159 63
Earning s per ordinary share : Ba sic 29 .3p (9 .1)p 9.6p 10.9p (36 .3)p
Underlying diluted 15.7p 15.5p 13 .1p 15.7p 5.8p
Dividend per ordinary share 8.0p 8.0p 8.0p 8.0p 2 .0p + TBD
Net borrowinqs" 860 749 858 880 904 Interest cover 4 3 .9 X 3 .3 x 2.9 X 3.0 x 1.9 x Dividend covers. 6 2.0 X 1.9 x 1.6 X 2.0 x TBD
' Underlying EBITDA is group profit from operations before depreciation. operating exceptional items and amortization. 2Underlying profit before taxes (PST) is before exceptional items and amortization. 3Net borrowings is the sum of long-term and short-term borrowings including finance leases less cash, cash equivalents, and liquid
funds investments. "Interest cover is underlying ESITDA (before exceptional items) divided by finance charges (excluding non-standard charges). 5Dividend cover is underlying diluted earnings per ordinary share divided by dividend declared per ordinary share. GEMI noted the company targeted an ongoing dividend cover of 2.0x in its 2004 Annual Report.
Sources of data: Company annual reports and Web site.
2007
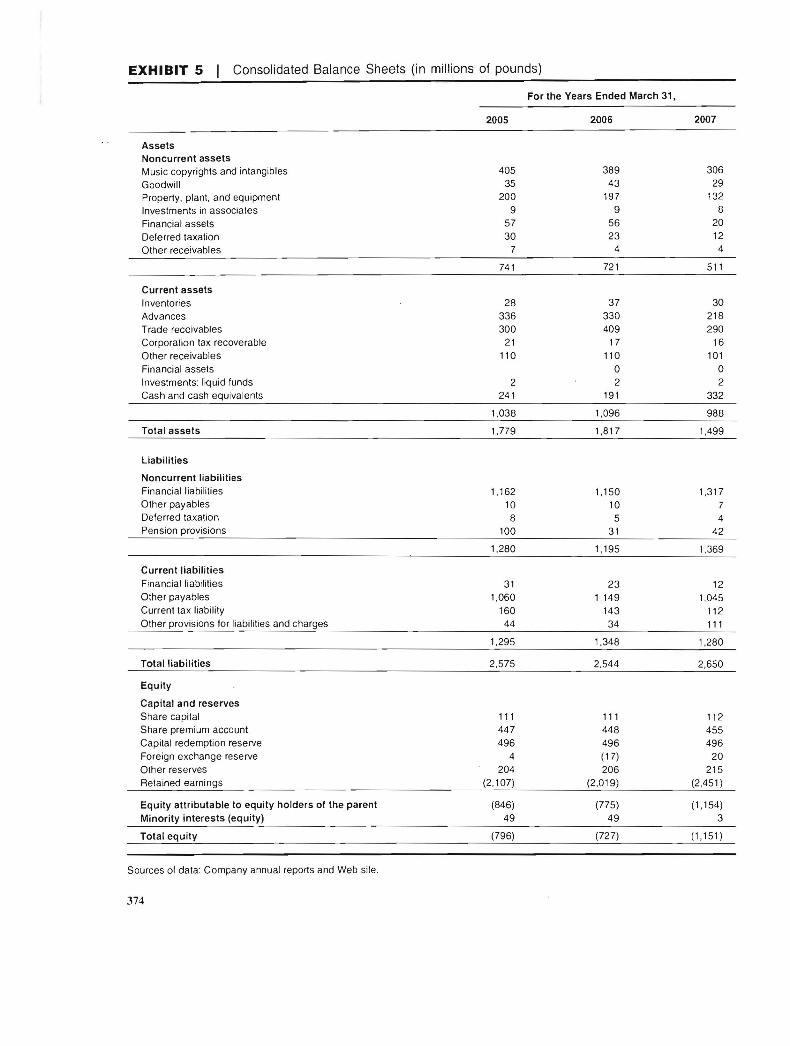
EXHIBIT 5 Consolidated Balance Sheets (in millions of pounds)
For the Years Ended March 31,
2005 2006
Assets Noncurrent assets Music copyrights and intangib les Good will Propert y, plant, and equipment Investments in associates Financial asse ts Defer red taxation Other receivables
405 35
200 9
57
30 7
389 306 43 29
197 132
9 8 56 20 23 12
4 4
74 1 72 1 511
Cu rrent assets Inventories Advances Trade receivables Corporation tax recoverable Othe r receivables Financial asse ts Investments: liquid funds Cash and cash equ ivale nts
28 336 300
2 1 110
2 24 1
37 30 330 218 409 290
17 16 110 101
0 0 2 2
191 332
1,038 1,096
Total assets 1,779 1,817 1,499
Liabil ities
Noncurrent liabil i t ies Financial liabilities Other payabies Deferred taxati on Pension pro visions
1,162 10 8
100
1,150 10 5
3 1
1,3 17 7 4
42
1,280 1,195 1,369
Current liabilities Financial liabilit ies 3 1 23 12 Other payabies 1,060 1,149 1,045 Current tax liability 160 143 112 Other provisions lor liabi lities and cha rges 44 34 111
1,295 1,348 1,280
Total liabilities 2,575 2,54 4 2,650
Eq u ity
Cap ital and reserves Share capital Share premium acco unt Capi tal redemption reserve Foreig n exchange reserve Other reserves Retained earn ings
111 447 496
4 204
(2, 107)
111 112 448 455 496 496 (17) 20 206 215
(2,019) (2,451)
Equity attributable to equity holders of the parent (846) (775) (1,154) Minority interests (equi ty) 49 49 3
Total equity (796) (727) (1,151)
Sources of data : Company annu al reports and Web site.
374
988

375 Case 27 EM! Group pic
EXHIBIT 6 I Analysis of Ordinary Sharehold ings on May 18, 2006
Categories of Shareholders Number
Small 1 to 500 shares 501 to 1,000 shares 1,001 to 10,000 shares 10,001 to 100,000 shares 100,001 to 1,000,000 shares
Large 1,000 ,001 shares and over
9,720 4,243 4 ,648
434 291 123
Total 19,459
Percentage
50.0 21.8 23.9
2.2 1.5 0.6
shareholders
Total Shares Held by this Category Percentage
1,923,604 0.2 3,100,499 0.4
10,864,585 1.4 15,502,961 2.0
101,194 ,240 12.8 660,339 ,675 83.3
792,925,564 shares
Percentage of Capital
Substantial Shareholders1 No. of Shares Held
FMR Corp./Fidelily International Ltd . 114,065 ,999 14.39 Wellington Management Company, LLP 74,460 ,205 9.39 Deutsche Bank AG 49,278,472 6.21 HBOS pic/Insight Investment Management Ltd. 40,609,739 5.12 The Capital Group Companies, Inc. 40,512,803 5.11 Prudent ial pic group of companies 37,310,271 4.71 Legal & General Investment Management Ltd. 27,687 ,735 3.49
'Substantial shareholders are defined as owning 3% or more of ordinary shares and/or 3% or more of the vot ing rights of ordinary shares .
Source of data: Company annual reports.

376 Part Five Man agement of the Firm 's Equit y: Dividends Repurchases, Initial OHlerings
EXHIBIT 7 EMI Projected Sources-and-Uses Statement Assuming Annual 8.0p Dividend Is Maintained (end of year March 31)
2006 2007 2008 Est. 2009 Est.
Assumptions Revenue growth 1.7% 0.7%
New equity issued 06 8.9
Sh are repurchases 05 5.5 0.0 0.0
Dividends 62.9 63.2 63.2 63.2
Financial Statements Revenue 2,079.9 1,751.5 1,781.3 1,793.7 Net income 90.0 (287.0) (80A) 26.3
Noncurrent as sets 721 511 476 479
Current assets ---...L.illlli ~ ~ ~ Total ass ets 1,817 1,499 1,488 1,514
Debt obligations 1,150 1,317 1,442 1,494 Other noncurrent liabil ities 46 52 52 52 Current liabil ities 1,348 1,280 1,289 1,299
Total equity (726) (1,151) (1,295) (1,332)
Sources and Uses Statement Sources Net income 90.0 (287.0) (80A) 26.3 New equ ity issued 0.6 8.9 0.0 0.0 Other adjustments to equity 42.5 (77.6) 0.0 0.0 Increase in debt obligations (12.0) 167.3 124.6 52.2 Increase in oth . NC liabil ities (72.6) 6.7 0.0 0.0 Increase in current liab ilities ~ .rse,u ~ _ 10.0
Total sources 101A (249.8) 53.1 88.5
Uses Increase in noncurrent assets (19.9) (210.9) (34.1) 2.8 Increa se in current assets 57 .9 (107.6) 24.0 22.5 Share repurchases 0.5 5.5 0,0 0.0 Div idends ~ ~ ~3. 2 ~
Total uses 101A (249.8) 53.1 88.5
Noles: 'The dividend use in 2007 reflects the 8.0p dividend declared in IotaI for the fiscal year 2006, which was actually paid in the fiscal year
2007. The impact of the board's decision would be in the 2008 fiscal year.
22008 and 2009 forecasts are from ABN AMRO Equity Research and case writer's estimates. Lehman Brothers forecasted net profit of GBP(110) million and GBP81 million for 2008 and 2009, respectively,
Sources of data: Company annual reports and Web site; Bridie Barrett, Justin Diddams, and Paul Gooden, ABN AMRO Bank NV, "EMI, A Special Situation," 16 February 2007; Richard Jones and Tamsin Garrity, Lehman Brothers Equity Research, "EMI Group,"
15 February 2007.

Case 27 EM! Group pic 377
EXHIBIT 8 Excerpts from Fischer Black's "The Dividend Puzzle"l
Why do corporations pay dividends? Why do investors pay attention to dividends?
Perhaps the answers to these questions are obvious . Perhaps dividends represent the return to the investor who puts his money at risk in the corporation. Perhaps corporations pay dividends to reward existing shareholders, and 10 encourage others 10buy new issues of common stock at high prices . Perhaps investors pay attention to dividends because only through dividends or the prospect of dividends do they receive a return on their investment or the chance to sell their shares at a higher price in the future.
Or perhaps the answers are not so obvious . Perhaps a corporation that pays no dividends is demonstrating confidence that it has attractive investment opportunities that might be missed if it paid dividends . If it makes these investments, it may increase the value of the shares by more than the amount of the lost dividends . If that happens, its shareholders may be doubly better off. They end up with capital appreciation greater than the dividends they missed out on, and they find they are taxed at lower effective rates on capital appreciation than on dividends .
In fact, I claim that the answers to these questions are not obvious at all. The harder we look at the dividend picture, the more it seems like a puzzle , with pieces that just don't fit together. Suppose you are offered the following choice. You may have $2 today, and a 50-50 chance of $54 or $50 tomorrow. Or you may have nothing today, and a 50-50 chance of $56 or $52 tomorrow. Would you prefer one of these gambles to the other? Probably you would not. Ignoring such factors as the cost of holding the $2 and one day's interest on $2, you would be indifferent between these two gambles.
The choice between a common stock that pays a dividend and a stock that pays no dividend is similar, at least if we ignore such things as transaction costs and taxes . The price of the dividend-paying stock drops on the ex-dividend date by about the amount of the dividend .The dividend just drops the whole range of possible stock prices by that amount. The investor who gets a $2 dividend finds himself with shares worth about $2 less than they would have been worth if the dividend hadn't been paid, in all possible circumstances.
This, in essence, is the Miller-Modigliani theorem. It says that the dividends a corporation pays do not affect the value of its shares or the returns to investors , because the higher the dividend , the less the investor receives in capital appreciation, no matter how the corporation's business decision turns out. When we say this, we are assuming that the dividend paid does not influence the corporation's business decisions. Paying the dividend either reduces the amount of cash equivalents held by the corporation, or increases the amount of money raised by issuing securities.
If this theorem is correct, then a firm that pays a regular dividend equal to about half of its normal earnings will be worth the same as an otherwise similar firm that pays no dividends and will never pay any dividends . Can that be true? How can a firm that will never pay dividends be worth anything at all? Actually, there are many ways for the stockholders of a firm to take cash out without receiving dividends. The most obvious is that the firm can buy back some of its shares. Under the assumption of the Modigliani-Miller theorem, a firm has value even if it pays no dividends. Indeed, it has the same value it would have if it paid dividends.
1Fischer Black, "The Dividend PUZZle," Journal of Ponfol io Mana gement (winter 1976).

378 Part Five Management of the Firm's Equity: Dividends Repurchases. Initial Offferings
EXHIBIT 9 EMI Share Price Performance
700 r----- - - - - - - - - - - - - - - - - --- - -------,
Q,I
o c: Q,I a.
600
- - - - - - - - - ---- - --- - - --- - -
400
100 - - -- - ---
0 '-------"-------'-- - --'---- --"- - ----' - - - '-- -----' c;:§~
~'O.:;,

Case 27 EMI Group pic 379
EXHIBIT 10 I Global Economic Indicators and Projections
Annual Growth Rate, Percentage
Real GOP Inflation
2005 2006 2007E 2008E 2005 2006 2007E 2008E
World 4.9 5.5 5.0 5.1 3.5 3.9 3.5 3.3 United States 3.2 3.3 2.6 3.3 3.4 3.2 1.9 2.3 Japan 3.2 3.5 2.0 2.5 (0.1) 0.1 0.2 0.5 EU 27 2.1 3.5 3.0 2.7 2.5 2.6 2.1 2.4 United Kingdom 1.9 2.7 2.7 2.1 2.1 2.3 1.9 2.0
Interest Rate Forecasts, Percentage
3-Month Rates 10 Year Bond Yields
2005 2006 2007E 2008E. 2005 2006 2007E 2008E avg. avg. avg. avg. avg . avg. avg. avg.
United States 3.51 5.20 5.23 5.38 4.24 4.79 4.49 5.24 Japan 0.05 0.30 0.74 1.03 1.39 1.76 1.62 1.98 Euro Zone 2.18 3.08 4.02 4.37 3.38 3.78 3.86 4.53 United Kingdom 4.80 4.85 5.44 4.91 4.40 4.50 4.58 5.18
Real Economy Forecasts
Consumption Expenditure Wage Growth
2005 2006 2007E 2008E 2005 2006 2007E 2008E
Un ited States 3.5 3.2 3.3 3.1 2.8 3.9 3.8 4.0
Japan 3.5 3.2 2.0 3.0 0.2 0.8 0.7 1.2
Euro Zone 1.5 1.8 1.8 2.2 na na na na
United Kingdom 1.4 2.1 2.5 2.0 4.1 4.1 4.4 4.0
Source of data: Societe Generate Economic Research. "Global Economic Outlook," 14 March 2007.

c '-' ce EXHIBIT 11 I Comparative Global Media Data
2006 Fiscal Year
Data Currency
Fisc al Year End
Revenues (millions)
Operating Margin
Net Profit Marg in
LT DebU Book Eq.
LT Debtl Mkt. Eq.
Avg . PIE Rat io ( x)
EMI Group pic -
Pou nd 31-Mar 2,080 9.8% 4.3% nmf 0.72 22.4
Bertelsmann' Euro 31·Dec 19,297 9.7% 12.6% 0.97 na na Clea r Channel Dollar 31-Dec 7.067 31 .8% 9.8% 0.91 0.42 22.2 Disney Dollar 29·Sep 34,285 20.2% 9.8% 034 0.16 17.1 IAC/interA ctiveCorp . Dollar 31-Dec 6.278 15.7% 3.1% 0. 10 0.08 48.9 News Corp. Dollar 30-Jun 25 ,327 18.3% 10.6% 0.38 0.17 23.3 Sony Co rporation Yen 31-Mar 7,475,436 2.5% 1.7% 0.24 na nm! Tim e Warner Dollar 31-Dec 44,224 27.3% 11.6% 0.58 0.42 14.9 Viacom Dollar 31-Dec 11,467 28.1% 12.9% 1.06 0.27 18.5 Vivendi Euro 31-Dec 20,044 21.8% 13.0% 0.22 na 12.2 Warne r Music Dollar 30·Sep 3,516 14.4% 1.3% 38.60 0.65 72.2 XM Satellite Radio Dollar 31-Dec 933 nm! nm! nmf 0.29 nmf
EMI Group pic Bertelsmann ' Clear Channe l Disney IACl lnterActiveCorp. News Corp. Sony Corporation Time Warner vi acorn" Vivendi Warner Music" XM Sate llite Radio
Data Share Repu rchases (mill ions)" Div idends Paid (millions)" Average Dividend Yield 5 Payout Ratio'
Currency FY2004 FY2005 FY2006 FY2004 FY2005 FY2006 FY2004 FY2005 FY2006 FY2004 FY2005 FY2006
Pound 0 0 1 63 63 61 4.8% 3.4% 3.3% nm! 83% 73% Euro 0 0 0 324 287 120 na na na 27% 28% 5%
Dolla r 1,841 1,070 1,371 256 343 383 1.2% 2.1% 2.4% 31% 54% 55% Dollar 335 2,420 6,898 430 490 5 19 0.9% 0.9% 1.0% 19% 18% 16% Dollar 430 1,848 983 0 0 0 0.0% 0.0% 0.0% 0% 0% 0% Dolla r 0 535 2,027 202 240 431 0.2% 0.2% 0.8% 13% 11% 16%
Yen 8,523 416 394 23,106 22,978 24,810 0.6% 0.6% 0.5% 14% 20% 20% Dollar 0 2, 141 13,660 0 466 876 0.0% 0.6% 1.2% 0% 16% 17% Dollar na na 2,3 18 na na 0 na na 0.0% na na 0% Euro 27 108 0 0 689 1,152 2.8% 4.0% 4.3% 46% 52% 53%
Dollar na 0 0 na 0 74 na 0.0% 2.9% na 0% 168% Dollar 0 0 0 0 0 0 0.0% 0.0% 0.0% 0% 0% 0%
' Bertelsmann is a private German company.
2Viacom spl it into two compan ies, Viacom and CBS Corporation on 12/31/2005 .
3Warner Music completed its initial public offer ing (IPO) in May 2005.
"Dividends paid and share repurchases data is sourced from the individual company's cash flow statemen t.
5Average divide nd yield calculated as dividends decla red per share for a year divided by the average annual price of the stock in the same year.
Gp ayout ratio calculated as the sum of all cas h dividends declared, but not necessa rily yet paid, for a company's fiscal year, divided by net profit for that year.
Sources of data: Value Lin e Investment Survey and compa ny Web sites .