cardiovascular risk in advanced naïve hiv … renato maserati5, canio martinelli6, paola corsi6,...
TRANSCRIPT

Cardiovascular Risk in Advanced Naïve HIV-Infected
Patients Starting Antiretroviral Therapy: Comparison of Three
Different Regimens -PREVALEAT II Cohort.
Chiara Bellacosa
Università degli Studi di Bari
Clinica Malattie Infettive

MORTALITA’
COMORBIDITA’
CARDIOVASCOLARE
MORTALITA’
COMORBIDITA’

IMMUNORICOSTITUZIONE
INFIAMMAZIONECRONICA
ATTIVAZIONEENDOTELIALE
RISCHIOCARDIO
VASCOLARE

Paolo Maggi1, Chiara Bellacosa1, Armando Leone1, Anna Volpe1, Elena Delfina Ricci2, Nicoletta
Ladisa1, Stefania Cicalini3, Elisabetta Grilli3, Rosaria Viglietti4, Antonio Chirianni4, Lara Ines
Bellazzi5, Renato Maserati5, Canio Martinelli6, Paola Corsi6, Benedetto Maurizio Celesia7,
Federica Sozio8, Gioacchino Angarano1.
1) Institute of Infectious Diseases University of Bari, Policlinico Consorziale, Bari, Italy
2) CISAI (Coordinamento Italiano per lo Studio dell’Allergia in Infezione da HIV)
3) INMI L. Spallanzani, IRCCS Roma2, Roma, Italy
4) Department of Infectious Diseases, Ospedale Cotugno Napoli3, Napoli, Italy
5) Institute of Infectious Diseases, Policlinico San Matteo, Pavia, Italy
6) Institute of Infectious Diseases, Ospedale Careggi, Firenze, Italy
7) Department of Infectious Diseases, Ospedale Garibaldi-Nesima, Catania, Italy
8) Department of Infectious Diseases, Ospedale Civile Spirito Santo, Pescara, Italy

Demografici
Ematochimici
Markersd’infiammazione
endoteliale
Dopplercarotideo
FMD
PARAMETRI

EFAVIRENZ ATAZANAVIR/r
DARUNAVIR/r
EMTRICITABINA/TENOFOVIR

EFV
N=31
ATV
N=49
DRV
N=39
Total
N=119
P
Age (Median-InterQuartile Range) 48 35-55 46 41-50 50 43-57 46 36-51 0.46
N % N % N % N %
Males 25 80.6 35 71.4 33 84.6 93 78.2 0.30
Caucasian 25 80.6 43 87.8 36 92.3 104 87.4 0.34
RF for HIV acquisition
IDU
Sexual
4
24
12.9
77.4
7
41
14.3
83.7
6
29
15.4
74.4
17
94
14.3
79.0 0.55
Current alcohol consumption 5 16.1 6 12.2 6 15.4 17 14.3 0.86
Current smoker 10 32.3 17 34.7 14 35.9 41 34.5 0.90
BMI≥25.0 7 22.6 12 24.5 16 41.0 35 29.4 0.15
Family history of CVD 1 3.2 1 2.0 1 2.6 3 2.5 0.99
AIDS at presentation 8 25.8 11 22.4 8 20.5 27 22.7 0.87
Table 1
Baseline characteristics of 119 patients:
treatment groups and overall population (1/2)

EFV
N=31
ATV
N=49
DRV
N=39
Total
N=119
P
CD4+ cell/mm3≥200 0 100 0 100 0 100 0 100 1.0
HIVRNA<25 cp/mm3 0 100 0 100 0 100 0 100 1.0
Pathologic FMD 13 41.9 22 44.9 26 66.7 61 51.3 0.13
IMT and/or plaques 14 45.2 24 49.0 16 41.0 54 45.4 0.76
total cholesterol >200 mg/dL 6 19.4 7 14.3 6 15.4 19 16.0 0.83
HDL < 40 mg/dL 22 71.0 37 75.5 29 74.4 88 73.9 0.90
triglycerides > 200 mg/dL 6 19.4 15 30.6 4 10.3 25 21.0 0.07
LDL > 160 mg/dL 0 0.0 2 4.1 1 2.6 3 2.5 0.53
glycemia > 100 mg/dL 7 22.6 5 10.2 6 15.4 18 15.1 0.32
Pathologic D-dimer >500 14 45.2 25 51.0 21 53.8 60 50.4 0.85
Pathologic hsCRP >300 5 16.1 19 38.8 15 38.5 39 32.8 0.08
Table 1
Baseline characteristics of 119 patients:
treatment groups and overall population (2/2)
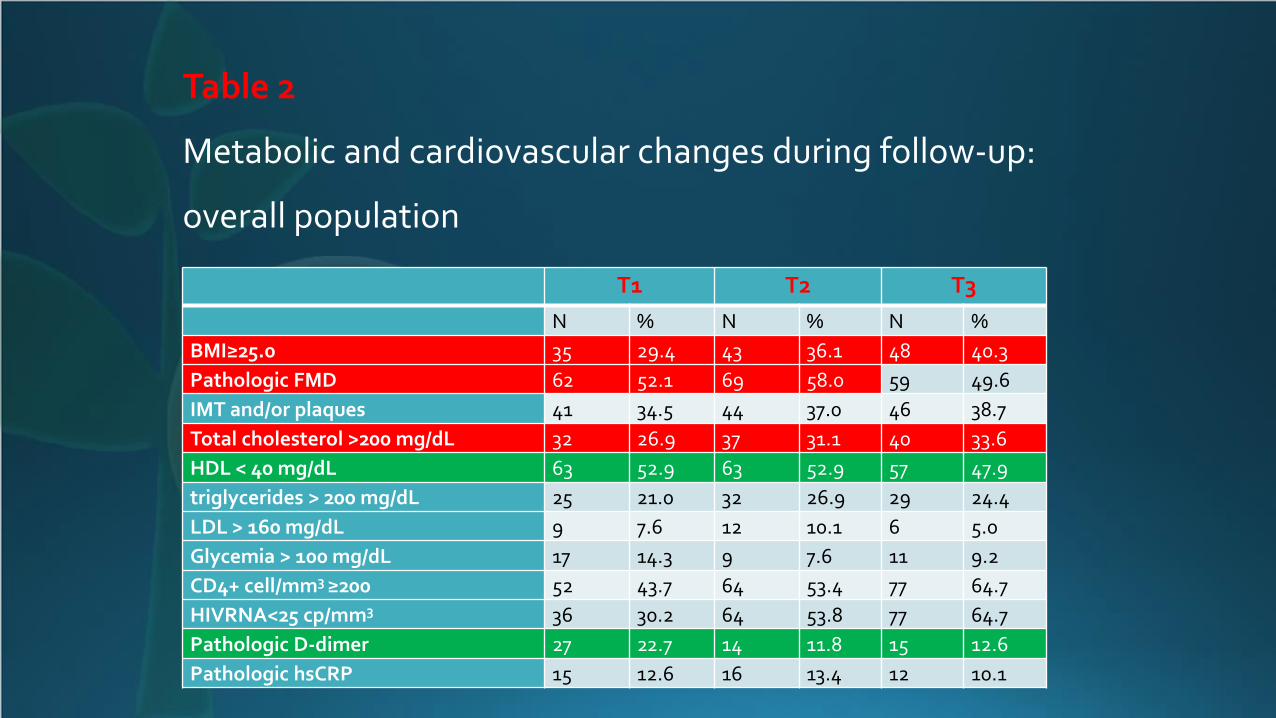
T1 T2 T3
N % N % N %
BMI≥25.0 35 29.4 43 36.1 48 40.3
Pathologic FMD 62 52.1 69 58.0 59 49.6
IMT and/or plaques 41 34.5 44 37.0 46 38.7
Total cholesterol >200 mg/dL 32 26.9 37 31.1 40 33.6
HDL < 40 mg/dL 63 52.9 63 52.9 57 47.9
triglycerides > 200 mg/dL 25 21.0 32 26.9 29 24.4
LDL > 160 mg/dL 9 7.6 12 10.1 6 5.0
Glycemia > 100 mg/dL 17 14.3 9 7.6 11 9.2
CD4+ cell/mm3≥200 52 43.7 64 53.4 77 64.7
HIVRNA<25 cp/mm3 36 30.2 64 53.8 77 64.7
Pathologic D-dimer 27 22.7 14 11.8 15 12.6
Pathologic hsCRP 15 12.6 16 13.4 12 10.1
Table 2
Metabolic and cardiovascular changes during follow-up:
overall population
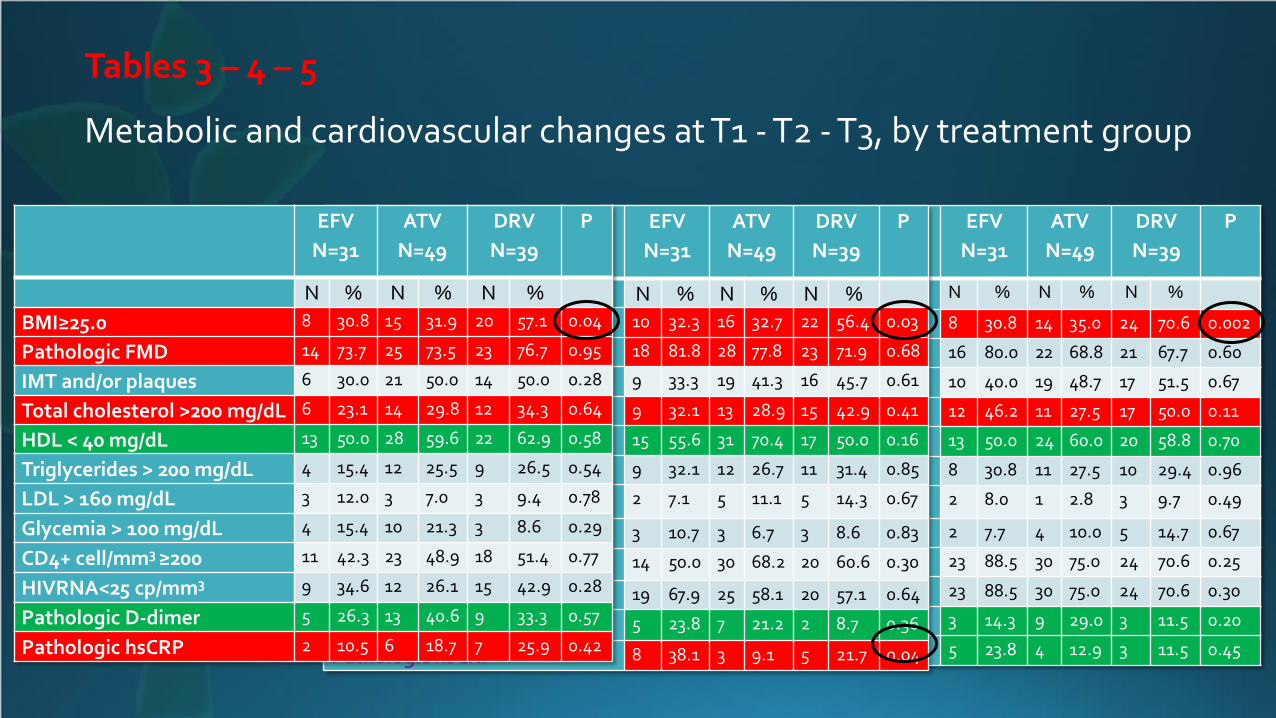
EFV
N=31
ATV
N=49
DRV
N=39
P
N % N % N %
BMI≥25.0 8 30.8 14 35.0 24 70.6 0.002
Pathologic FMD 16 80.0 22 68.8 21 67.7 0.60
IMT and/or plaques 10 40.0 19 48.7 17 51.5 0.67
total cholesterol >200 mg/dL 12 46.2 11 27.5 17 50.0 0.11
HDL < 40 mg/dL 13 50.0 24 60.0 20 58.8 0.70
triglycerides > 200 mg/dL 8 30.8 11 27.5 10 29.4 0.96
LDL > 160 mg/dL 2 8.0 1 2.8 3 9.7 0.49
glycemia > 100 mg/dL 2 7.7 4 10.0 5 14.7 0.67
CD4+ cell/mm3≥200 23 88.5 30 75.0 24 70.6 0.25
HIVRNA<25 cp/mm3 23 88.5 30 75.0 24 70.6 0.30
Pathologic D-dimer 3 14.3 9 29.0 3 11.5 0.20
Pathologic hsCRP 5 23.8 4 12.9 3 11.5 0.45
EFV
N=31
ATV
N=49
DRV
N=39
P
N % N % N %
BMI≥25.0 10 32.3 16 32.7 22 56.4 0.03
Pathologic FMD 18 81.8 28 77.8 23 71.9 0.68
IMT and/or plaques 9 33.3 19 41.3 16 45.7 0.61
total cholesterol >200 mg/dL 9 32.1 13 28.9 15 42.9 0.41
HDL < 40 mg/dL 15 55.6 31 70.4 17 50.0 0.16
triglycerides > 200 mg/dL 9 32.1 12 26.7 11 31.4 0.85
LDL > 160 mg/dL 2 7.1 5 11.1 5 14.3 0.67
glycemia > 100 mg/dL 3 10.7 3 6.7 3 8.6 0.83
CD4+ cell/mm3 14 50.0 30 68.2 20 60.6 0.30
HIVRNA<25 cp/mm3 19 67.9 25 58.1 20 57.1 0.64
Pathologic D-dimer 5 23.8 7 21.2 2 8.7 0.36
Pathologic hsCRP 8 38.1 3 9.1 5 21.7 0.04
EFV
N=31
ATV
N=49
DRV
N=39
P
N % N % N %
BMI≥25.0 8 30.8 15 31.9 20 57.1 0.04
Pathologic FMD 14 73.7 25 73.5 23 76.7 0.95
IMT and/or plaques 6 30.0 21 50.0 14 50.0 0.28
Total cholesterol >200 mg/dL 6 23.1 14 29.8 12 34.3 0.64
HDL < 40 mg/dL 13 50.0 28 59.6 22 62.9 0.58
Triglycerides > 200 mg/dL 4 15.4 12 25.5 9 26.5 0.54
LDL > 160 mg/dL 3 12.0 3 7.0 3 9.4 0.78
Glycemia > 100 mg/dL 4 15.4 10 21.3 3 8.6 0.29
CD4+ cell/mm3≥200 11 42.3 23 48.9 18 51.4 0.77
HIVRNA<25 cp/mm3 9 34.6 12 26.1 15 42.9 0.28
Pathologic D-dimer 5 26.3 13 40.6 9 33.3 0.57
Pathologic hsCRP 2 10.5 6 18.7 7 25.9 0.42
Tables 3 – 4 – 5
Metabolic and cardiovascular changes at T1 - T2 - T3, by treatment group

Figure 1
Percentage of patients with normal value of blood biomarkers:
overall population

Figure 2
Percentage of patients
with normal value of blood
biomarkers, by treatment
group
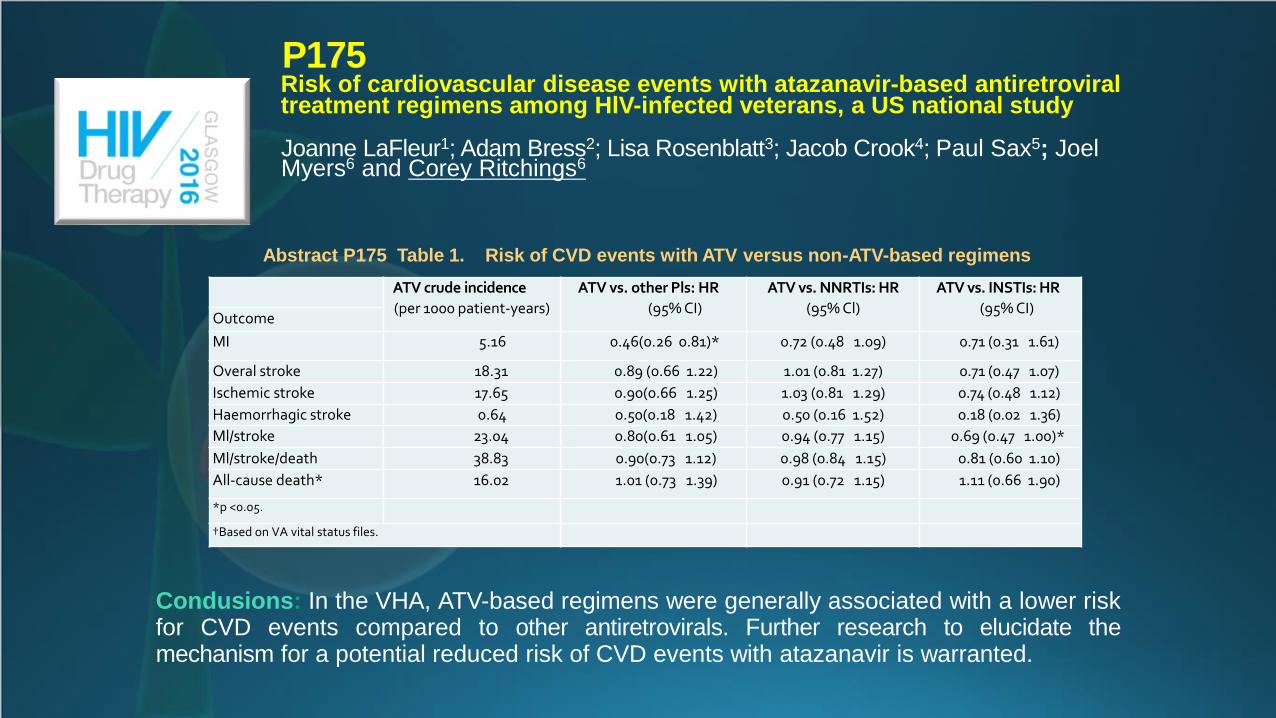
P175Risk of cardiovascular disease events with atazanavir-based antiretroviral treatment regimens among HlV-infected veterans, a US national study
Joanne LaFleur1; Adam Bress2; Lisa Rosenblatt3; Jacob Crook4; Paul Sax5; Joel Myers6 and Corey Ritchings6
ATV crude incidence
(per 1000 patient-years)
ATV vs. other Pls: HR
(95% CI)
ATV vs. NNRTIs: HR
(95% Cl)
ATV vs. INSTIs: HR
(95% CI)Outcome
MI 5.16 0.46(0.26 0.81)* 0.72 (0.48 1.09) 0.71 (0.31 1.61)
Overal stroke 18.31 0.89 (0.66 1.22) 1.01 (0.81 1.27) 0.71 (0.47 1.07)
Ischemic stroke 17.65 0.90(0.66 1.25) 1.03 (0.81 1.29) 0.74 (0.48 1.12)
Haemorrhagic stroke 0.64 0.50(0.18 1.42) 0.50 (0.16 1.52) 0.18 (0.02 1.36)
Ml/stroke 23.04 0.80(0.61 1.05) 0.94 (0.77 1.15) 0.69 (0.47 1.00)*
Ml/stroke/death 38.83 0.90(0.73 1.12) 0.98 (0.84 1.15) 0.81 (0.60 1.10)
All-cause death* 16.02 1.01 (0.73 1.39) 0.91 (0.72 1.15) 1.11 (0.66 1.90)
*p <0.05.
†Based on VA vital status files.
Condusions: In the VHA, ATV-based regimens were generally associated with a lower riskfor CVD events compared to other antiretrovirals. Further research to elucidate themechanism for a potential reduced risk of CVD events with atazanavir is warranted.
Abstract P175 Table 1. Risk of CVD events with ATV versus non-ATV-based regimens


Sarebbe utile un Follow Up più lungo
L’infiammazione cronica è il principale determinante del rischio cardio vascolare legato al deficit immunitario
Il rischio cardiovascolare è più alto nel primo anno e si può ipotizzare che con la stabilizzazione dell’infiammazione potrebbe diminuire
Quindi avviare la ARV al più presto potrebbe servire a ridurre l’infiammazione
Conclusioni
