cardiometabolic risk management: a functional and lifestyle approach · a functional and lifestyle...
TRANSCRIPT
Cardiometabolic Pathways and Solutions:Insulin Resistance • Endothelial Dysfunction • Glycation & AGEs • Dyslipidemia(s)
Microbiome Influences • Biomarkers for Risk Assessment • Protocol Summaries
Dietary & Physical Activity Recommendations
Nutrient Monographs for:Arginine • Berberine • Bergamot • Chromium • CoQ10 • Lipoic Acid • Magnesium • Nattokinase
Niacin • Omega-3s • Vandium • Vitamin D • Vitamin K2 • And 12 more nutrient therapies
Cardiometabolic Risk Management:A Functional and Lifestyle ApproachPrinciples and Protocols for Healthcare Professionals
Thomas G. Guilliams Ph.D.
Foreword by: Shilpa P. Saxena, MD
By Thomas G. Guilliams Ph.D.
Cardiometabolic Risk Management: A Functional and Lifestyle Approach
Principles and Protocols for Healthcare Professionals
The Point Institute was founded by Thomas Guilliams, Ph.D. as an independent research organization focused on examining and disseminating information about the use of natural therapeutic options for treating and preventing chronic disease. Along with therapies generally defined as lifestyle interventions, the Point Institute specializes in the evidence and application of nutraceuticals (dietary supplements, herbs, vitamins, minerals, etc.) as therapeutic and preventative agents in clinical practice.
Cardiometabolic Risk Management: A Functional and Lifestyle Approach Point Institute
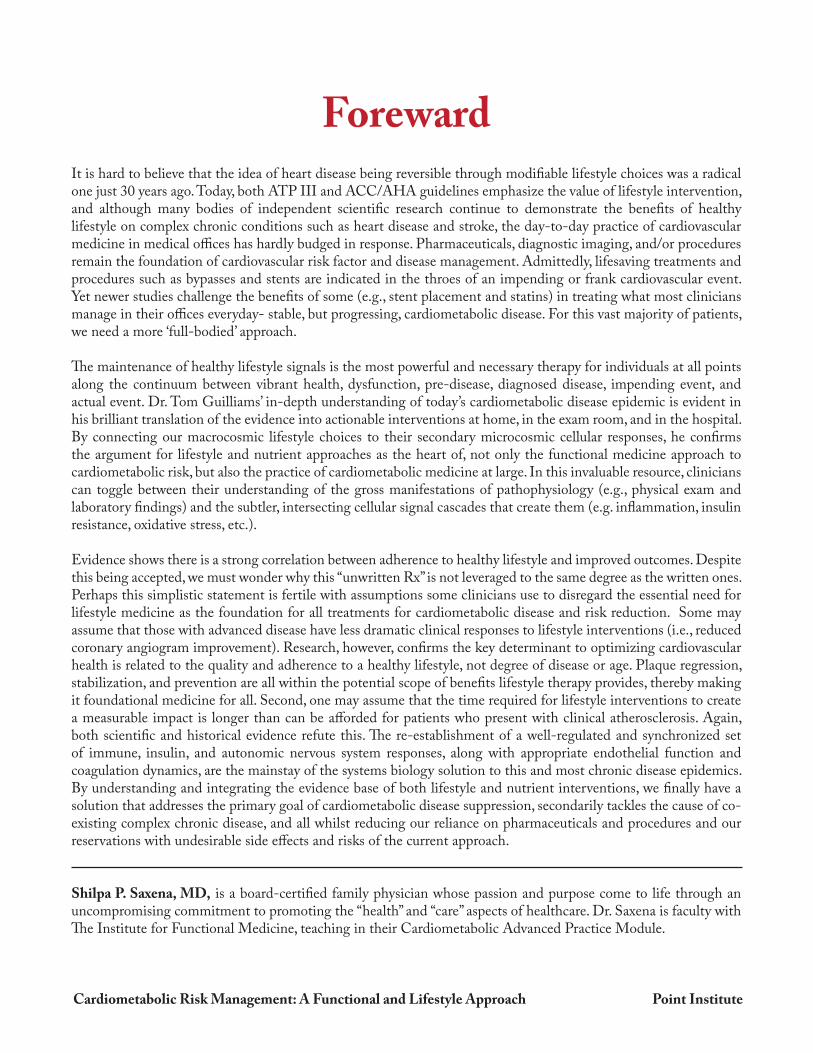
It is hard to believe that the idea of heart disease being reversible through modifiable lifestyle choices was a radical one just 30 years ago. Today, both ATP III and ACC/AHA guidelines emphasize the value of lifestyle intervention, and although many bodies of independent scientific research continue to demonstrate the benefits of healthy lifestyle on complex chronic conditions such as heart disease and stroke, the day-to-day practice of cardiovascular medicine in medical offices has hardly budged in response. Pharmaceuticals, diagnostic imaging, and/or procedures remain the foundation of cardiovascular risk factor and disease management. Admittedly, lifesaving treatments and procedures such as bypasses and stents are indicated in the throes of an impending or frank cardiovascular event. Yet newer studies challenge the benefits of some (e.g., stent placement and statins) in treating what most clinicians manage in their offices everyday- stable, but progressing, cardiometabolic disease. For this vast majority of patients, we need a more ‘full-bodied’ approach.
The maintenance of healthy lifestyle signals is the most powerful and necessary therapy for individuals at all points along the continuum between vibrant health, dysfunction, pre-disease, diagnosed disease, impending event, and actual event. Dr. Tom Guilliams’ in-depth understanding of today’s cardiometabolic disease epidemic is evident in his brilliant translation of the evidence into actionable interventions at home, in the exam room, and in the hospital. By connecting our macrocosmic lifestyle choices to their secondary microcosmic cellular responses, he confirms the argument for lifestyle and nutrient approaches as the heart of, not only the functional medicine approach to cardiometabolic risk, but also the practice of cardiometabolic medicine at large. In this invaluable resource, clinicians can toggle between their understanding of the gross manifestations of pathophysiology (e.g., physical exam and laboratory findings) and the subtler, intersecting cellular signal cascades that create them (e.g. inflammation, insulin resistance, oxidative stress, etc.).
Evidence shows there is a strong correlation between adherence to healthy lifestyle and improved outcomes. Despite this being accepted, we must wonder why this “unwritten Rx” is not leveraged to the same degree as the written ones. Perhaps this simplistic statement is fertile with assumptions some clinicians use to disregard the essential need for lifestyle medicine as the foundation for all treatments for cardiometabolic disease and risk reduction. Some may assume that those with advanced disease have less dramatic clinical responses to lifestyle interventions (i.e., reduced coronary angiogram improvement). Research, however, confirms the key determinant to optimizing cardiovascular health is related to the quality and adherence to a healthy lifestyle, not degree of disease or age. Plaque regression, stabilization, and prevention are all within the potential scope of benefits lifestyle therapy provides, thereby making it foundational medicine for all. Second, one may assume that the time required for lifestyle interventions to create a measurable impact is longer than can be afforded for patients who present with clinical atherosclerosis. Again, both scientific and historical evidence refute this. The re-establishment of a well-regulated and synchronized set of immune, insulin, and autonomic nervous system responses, along with appropriate endothelial function and coagulation dynamics, are the mainstay of the systems biology solution to this and most chronic disease epidemics. By understanding and integrating the evidence base of both lifestyle and nutrient interventions, we finally have a solution that addresses the primary goal of cardiometabolic disease suppression, secondarily tackles the cause of co-existing complex chronic disease, and all whilst reducing our reliance on pharmaceuticals and procedures and our reservations with undesirable side effects and risks of the current approach.
Shilpa P. Saxena, MD, is a board-certified family physician whose passion and purpose come to life through an uncompromising commitment to promoting the “health” and “care” aspects of healthcare. Dr. Saxena is faculty with The Institute for Functional Medicine, teaching in their Cardiometabolic Advanced Practice Module.
Foreward
Cardiometabolic Risk Management: A Functional and Lifestyle Approach Point Institute
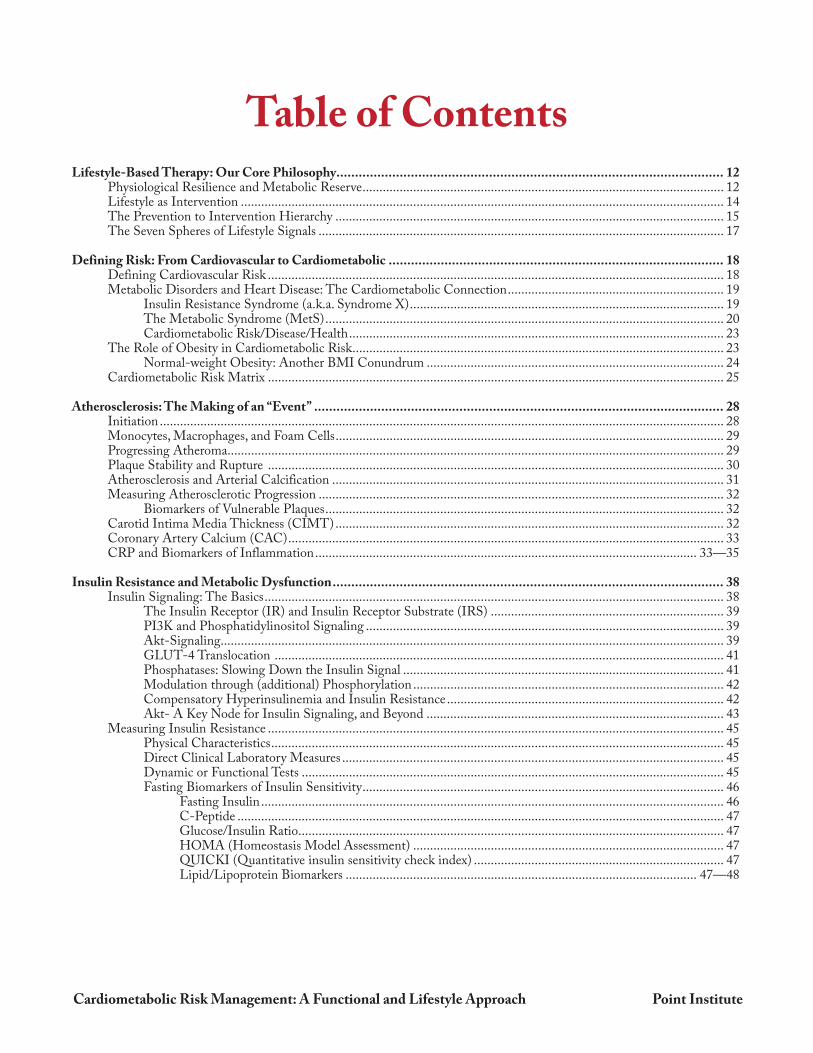
Table of ContentsLifestyle-Based Therapy: Our Core Philosophy ........................................................................................................ 12 Physiological Resilience and Metabolic Reserve ........................................................................................................... 12 Lifestyle as Intervention ............................................................................................................................................... 14 The Prevention to Intervention Hierarchy ................................................................................................................... 15 The Seven Spheres of Lifestyle Signals ........................................................................................................................ 17
Defining Risk: From Cardiovascular to Cardiometabolic .......................................................................................... 18 Defining Cardiovascular Risk ....................................................................................................................................... 18 Metabolic Disorders and Heart Disease: The Cardiometabolic Connection ................................................................ 19 Insulin Resistance Syndrome (a.k.a. Syndrome X) ............................................................................................. 19 The Metabolic Syndrome (MetS) ...................................................................................................................... 20 Cardiometabolic Risk/Disease/Health ............................................................................................................... 23 The Role of Obesity in Cardiometabolic Risk .............................................................................................................. 23 Normal-weight Obesity: Another BMI Conundrum ........................................................................................ 24 Cardiometabolic Risk Matrix ....................................................................................................................................... 25
Atherosclerosis: The Making of an “Event” .............................................................................................................. 28 Initiation ....................................................................................................................................................................... 28 Monocytes, Macrophages, and Foam Cells ................................................................................................................... 29 Progressing Atheroma................................................................................................................................................... 29 Plaque Stability and Rupture ....................................................................................................................................... 30 Atherosclerosis and Arterial Calcification .................................................................................................................... 31 Measuring Atherosclerotic Progression ........................................................................................................................ 32 Biomarkers of Vulnerable Plaques ...................................................................................................................... 32 Carotid Intima Media Thickness (CIMT) ................................................................................................................... 32 Coronary Artery Calcium (CAC) ................................................................................................................................. 33 CRP and Biomarkers of Inflammation ................................................................................................................. 33—35 Insulin Resistance and Metabolic Dysfunction ......................................................................................................... 38 Insulin Signaling: The Basics ........................................................................................................................................ 38 The Insulin Receptor (IR) and Insulin Receptor Substrate (IRS) ..................................................................... 39 PI3K and Phosphatidylinositol Signaling .......................................................................................................... 39 Akt-Signaling ..................................................................................................................................................... 39 GLUT-4 Translocation ..................................................................................................................................... 41 Phosphatases: Slowing Down the Insulin Signal ............................................................................................... 41 Modulation through (additional) Phosphorylation ............................................................................................ 42 Compensatory Hyperinsulinemia and Insulin Resistance .................................................................................. 42 Akt- A Key Node for Insulin Signaling, and Beyond ........................................................................................ 43 Measuring Insulin Resistance ....................................................................................................................................... 45 Physical Characteristics ...................................................................................................................................... 45 Direct Clinical Laboratory Measures ................................................................................................................. 45 Dynamic or Functional Tests ............................................................................................................................. 45 Fasting Biomarkers of Insulin Sensitivity ........................................................................................................... 46 Fasting Insulin ......................................................................................................................................... 46 C-Peptide ................................................................................................................................................ 47 Glucose/Insulin Ratio .............................................................................................................................. 47 HOMA (Homeostasis Model Assessment) ............................................................................................ 47 QUICKI (Quantitative insulin sensitivity check index) .......................................................................... 47 Lipid/Lipoprotein Biomarkers ........................................................................................................ 47—48
Cardiometabolic Risk Management: A Functional and Lifestyle Approach Point Institute
Table of ContentsLipids, Lipoproteins and Cardiometabolic Risk ........................................................................................................ 51 The Structure, Function and Nomenclature of Lipoproteins ........................................................................................ 51 The Function of Apolipoproteins ................................................................................................................................. 53 APOE Genotype and Cardiovascular Risk .................................................................................................................... 55 Chylomicrons (CMs) and the Exogenous Pathway ...................................................................................................... 57 Chylomicron Assembly ...................................................................................................................................... 58 Triglyceride Delivery by Chylomicrons .............................................................................................................. 58 Endogenous Pathway: Delivering Triglycerides and Cholesterol .................................................................................. 59 VLDL and Triglyceride Transport ..................................................................................................................... 59 Cholesterol Transport via LDL Particles ........................................................................................................... 61 High-Density Lipoprotein (HDL): A Biologically Diverse Lipoprotein ..................................................................... 61 HDL Synthesis .................................................................................................................................................. 61 HDL and Reverse Cholesterol Transport .......................................................................................................... 62 Biomarkers for Lipoprotein-Related Atherogenic Risk ................................................................................................ 64 (TC, LDL-C, HDL-C, non-HDL-C, TG, Lp(a), apoB, apoA-1) .................................................................... 64 Lipoprotein Numbers and Sizes ................................................................................................................................... 65 LDL Particle Numbers (LDL-P) ...................................................................................................................... 65 LDL Particle Subfractions by Size ..................................................................................................................... 65 VLDL-Related Biomarkers ............................................................................................................................... 66 Remnant Particles/ Remnant Cholesterol .......................................................................................................... 66 Oxidized LDL particles (oxLDL)...................................................................................................................... 66
The Role of the LDL Receptor(s)............................................................................................................................. 69 LDLR and Cholesterol Transport ................................................................................................................................ 69 Role of PCSK9 in LDLR Recycling ............................................................................................................................ 71 Familial Hypercholesterolemia (FH) ............................................................................................................................ 71 Genetic Testing for FH ................................................................................................................................................ 72
The Basics of Endothelial Dysfunction .................................................................................................................... 74 Nitric Oxide and eNOS ................................................................................................................................................ 74 Arginase and L-Arginine Availability ........................................................................................................................... 76 Asymmetric Dimethylarginine (ADMA) and Related Compounds ............................................................................ 77 The Importance of Tetrahydrobiopterin (BH4) ............................................................................................................ 77 Translating Shear Stress: Nrf2 and KLF2 ..................................................................................................................... 79 Endothelial Progenitor Cells (EPCs) and Endothelial Function .................................................................................. 81 Non-Invasive Measurements of Endothelial (Dys)Function ........................................................................................ 81 Flow-Mediated Dilation (FMD) ....................................................................................................................... 81 Peripheral Arterial Tonometry (PAT) ................................................................................................................ 82 Measures of Arterial Stiffness/Elasticity ....................................................................................................................... 83
Glycation and Advanced Glycation End Products (AGEs) ........................................................................................ 86 The Formation of AGEs .............................................................................................................................................. 86 Association between AGEs and Cardiovascular Outcomes: Epidemiology ................................................................. 87 Dietary Sources of AGEs ............................................................................................................................................. 88 Mechanisms Mediating the Cardiovascular Effects of AGEs ...................................................................................... 89 Receptor-Independent Pathway ......................................................................................................................... 89 Receptor-Mediated Pathway .............................................................................................................................. 90 C-truncated, Soluble RAGE (sRAGE) ........................................................................................................................ 91 Lifestyle and Nutrient Therapies Associated with Reduced AGEs ...................................................................... 92—94
Cardiometabolic Risk Management: A Functional and Lifestyle Approach Point Institute
Table of ContentsThe Gut Microbiota in Cardiometabolic Health ....................................................................................................... 98 Microbiome Composition, Obesity, and Cardiometabolic Risk.................................................................................... 98 Limitations to Stool-based Microbiome Analysis ........................................................................................................ 99 Beyond the Phylum-Level Differences ....................................................................................................................... 100 Early Life Microbiota Influences ................................................................................................................................ 100 Is Akkermansia Supplementation a Potential Therapy? ............................................................................................... 101 Mechanisms Connecting the Gut Microbiota with Cardiometabolic Risk ................................................................ 103 Short-Chain Fatty Acid Metabolism ............................................................................................................... 104 Endotoxemia and Immune Activation ............................................................................................................. 105 Bile Acid Metabolism and Signaling .............................................................................................................. 106 Production of TMAO from Dietary Precursors ............................................................................................... 107 Metabolism of Phytonutrients ......................................................................................................................... 108
Lifestyle Interventions for Cardiometabolic Risk ................................................................................................... 113
Dietary Strategies for Optimizing Cardiometabolic Health .................................................................................... 114 The Epidemiological Link Between Diet and Cardiometabolic Risk ........................................................................ 114 Do Calories (or where they come from) Matter? ........................................................................................................ 115 Cardiometabolic Dietary Patterns .............................................................................................................................. 118 Low Carbohydrate Diet ................................................................................................................................... 118 Mediterranean Diet .......................................................................................................................................... 118 What about the Paleo Diet? ............................................................................................................................. 120 The Low-Glycemic Impact Mediterranean Diet ............................................................................................. 121 Meal Replacements: Advantages and Disadvantages ....................................................................................... 122 Ketogenic Diets ................................................................................................................................................ 123 Fasting and Intermittent Fasting ...................................................................................................................... 124 Skipping Breakfast and Cardiometabolic Risk ................................................................................................. 126
Physical Activity and Cardiometabolic Risk ........................................................................................................... 131 Epidemiology and Physical Activity ........................................................................................................................... 131 Physical Activity: Terms Commonly Used ................................................................................................................. 132 Sedentary Lifestyle and Physical Inactivity as an Independent Risk .......................................................................... 132 Physical Activity and Exercise Intervention Trials ...................................................................................................... 133 Weight Loss and Obesity ................................................................................................................................. 134 Insulin Sensitivity and Glycemic Control ........................................................................................................ 134 Serum Lipids .................................................................................................................................................... 136 Inflammatory Signaling ................................................................................................................................... 136 Antioxidant Status ........................................................................................................................................... 137 Exercise Recommendations ........................................................................................................................................ 138 Sleep and Cardiometabolic Risk ............................................................................................................................ 143 Mechanisms Connecting Sleep Duration and Cardiometabolic Risk ........................................................................ 144
A Functional Approach to Cardiometabolic Risk .................................................................................................... 145 The Metabolic Continuum ......................................................................................................................................... 145 Functional Strategies for Improving Cardiometabolic Resilience ............................................................................... 146
Cardiometabolic Risk Management: A Functional and Lifestyle Approach Point Institute
Table of ContentsRisk Assessment and Suggested Protocols .............................................................................................................. 147 Prioritizing and Scoring Cardiometabolic Risk ................................................................................................ 148—149 Suggested Insulin Resistance Score (IRS) Categories ................................................................................................ 150 Insulin Sensitizing—Suggested Support Protocols ..................................................................................................... 152 Low Insulin Resistance Score .......................................................................................................................... 152 Moderate Insulin Resistance Score .................................................................................................................. 153 High Insulin Resistance Score ......................................................................................................................... 154 Beyond Insulin-Sensitizing: Basic Protocols for Other Risk Categories .................................................................... 155 The Benefit of Group Visits and Education .................................................................................................... 155 Type 2 Diabetes: Crossing the Threshold of the Metabolic Continuum .................................................................... 156 Dyslipidemia and Lipoprotein Biomarkers ................................................................................................................. 157 Therapies to Reduce Lipoprotein (a) ............................................................................................................... 158 Therapies to Reduce Oxidized LDL (oxLDL) ................................................................................................ 159 Therapies to Reduce CRP .......................................................................................................................................... 160 Pre-Hypertension and Cardiometabolic Hypertension .............................................................................................. 161 Dietary Supplements for Blood Pressure or Endothelial Function .................................................................. 162 Therapies to Reduce Homocysteine ........................................................................................................................... 163 MTHFR- Polymorphism and Homocysteine ................................................................................................. 165
Nutrient Monographs: Index of Ingredients ........................................................................................................... 167 Arginine and Citrulline .............................................................................................................................................. 168 Berberine (HCl) ......................................................................................................................................................... 175 Bergamot .................................................................................................................................................................... 184 Chromium (Trivalent, Cr+3) ........................................................................................................................................ 189 Cinnamon ................................................................................................................................................................... 196 Coenzyme Q10 ........................................................................................................................................................... 203 Conjugated Linoleic Acid ........................................................................................................................................... 217 Garlic ......................................................................................................................................................................... 226 Guggul ........................................................................................................................................................................ 235 Gymnema ................................................................................................................................................................... 237 Hawthorn (Crataegus spp.) .......................................................................................................................................... 240 Lipoic Acid (LA) ........................................................................................................................................................ 245 Magnesium ................................................................................................................................................................. 254 Nattokinase ................................................................................................................................................................. 262 Niacin (Vitamin B3) ................................................................................................................................................... 266 Omega-3 Fatty Acids: Status and Supplementation ................................................................................................... 269 Sources of Marine Omega-3 Ingredients ......................................................................................................... 269 Quality Control Issues of Fish Oil and Related Products ................................................................................ 272 Bioavailability Studies ...................................................................................................................................... 272 Cardiometabolic Differences: EPA vs. DHA ................................................................................................... 275 Recommendations for Selecting Therapeutic Marine Omega-3 Fatty Acid .................................................... 278 Using Omega-3 Index for Dosing.................................................................................................................... 279 Plant Sterols (Phytosterols) and Stanols ..................................................................................................................... 282 Policosanols ................................................................................................................................................................. 287 Probiotics .................................................................................................................................................................... 291 Red Yeast Rice (RYR) ................................................................................................................................................. 296 Tocotrienols ................................................................................................................................................................ 301 Vanadium .................................................................................................................................................................... 308 Vitamin D: Status and Supplementation .................................................................................................................... 312 Vitamin E: Status and Supplementation .................................................................................................................... 323 Vitamin K: Status and Supplementation .................................................................................................................... 335
LIFESTYLE-BASED THERAPY: OUR CORE PHILOSOPHY 15
Cardiometabolic Risk Management: A Functional and Lifestyle Approach Point Institute
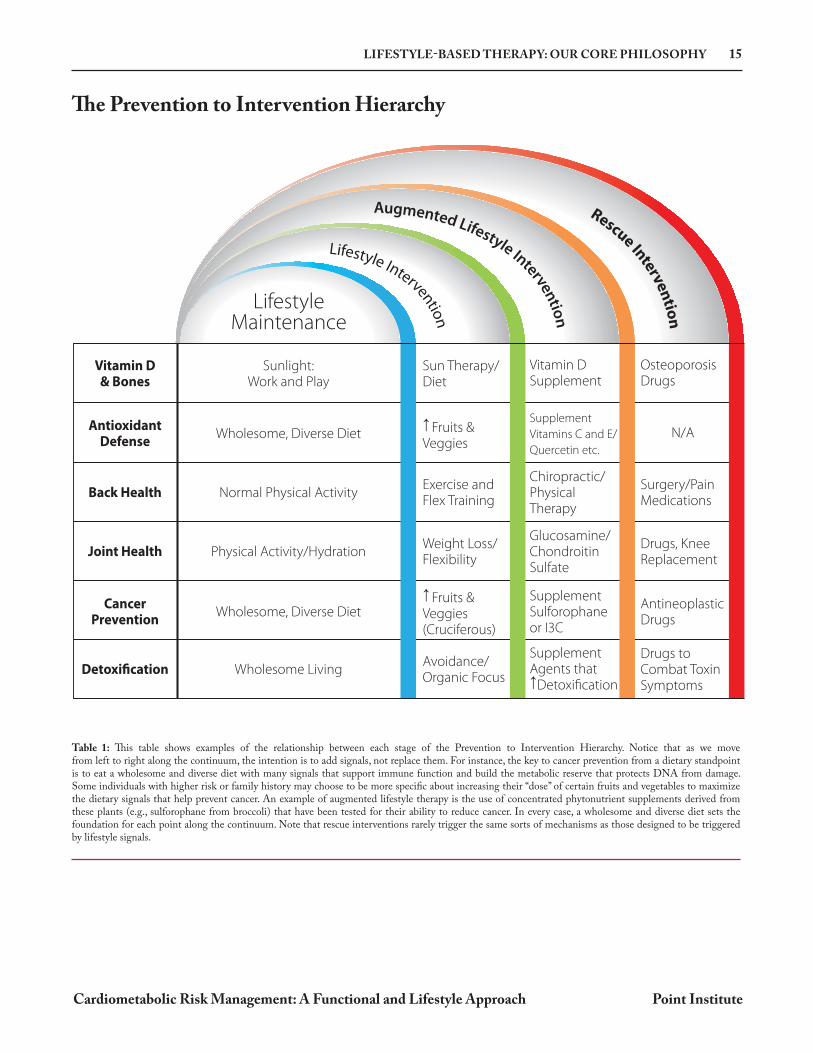
The Prevention to Intervention Hierarchy
Table 1: This table shows examples of the relationship between each stage of the Prevention to Intervention Hierarchy. Notice that as we move from left to right along the continuum, the intention is to add signals, not replace them. For instance, the key to cancer prevention from a dietary standpoint is to eat a wholesome and diverse diet with many signals that support immune function and build the metabolic reserve that protects DNA from damage. Some individuals with higher risk or family history may choose to be more specific about increasing their “dose” of certain fruits and vegetables to maximize the dietary signals that help prevent cancer. An example of augmented lifestyle therapy is the use of concentrated phytonutrient supplements derived from these plants (e.g., sulforophane from broccoli) that have been tested for their ability to reduce cancer. In every case, a wholesome and diverse diet sets the foundation for each point along the continuum. Note that rescue interventions rarely trigger the same sorts of mechanisms as those designed to be triggered by lifestyle signals.
Rescue Interven
tion
Augmented Lifestyle Interventio
n Lifestyle Intervention
LifestyleMaintenance
Vitamin D& Bones
Sun Therapy/Diet
Vitamin DSupplement
OsteoporosisDrugs
N/A
Sunlight:Work and Play
AntioxidantDefense
Fruits &Veggies
Supplement
Vitamins C and E/
Quercetin etc.
Wholesome, Diverse Diet
Back HealthExercise andFlex Training
Chiropractic/PhysicalTherapy
Surgery/PainMedications
Normal Physical Activity
Joint HealthWeight Loss/Flexibility
Glucosamine/ChondroitinSulfate
Drugs, KneeReplacement
Physical Activity/Hydration
CancerPrevention
Fruits &Veggies(Cruciferous)
SupplementSulforophaneor I3C
AntineoplasticDrugs
Wholesome, Diverse Diet
DetoxificationAvoidance/Organic Focus
SupplementAgents that
Detoxification
Drugs toCombat ToxinSymptoms
Wholesome Living
28 ATHEROSCLEROSIS: THE MAKING OF AN “EVENT”
Cardiometabolic Risk Management: A Functional and Lifestyle Approach Point Institute
Atherosclerosis: The Making of an “Event”
Within the sphere of diseases and mechanisms described as “cardiometabolic” there are many processes that lead to metabolic dysfunction in a variety of organs and tissues (e.g., liver, pancreas, brain, etc.). However, the primary clinical outcomes that define the “cardio” portion of cardiometabolic risk are typically events related to atherosclerosis (acute coronary syndrome, myocardial infarction, angina, stroke, etc.). The more recent use of the acronym ASCVD (atherosclerotic cardiovascular disease) is often used to differentiate these conditions from other cardiovascular conditions with non-atherosclerotic mechanisms (e.g., congestive heart failure, arrhythmia, etc.). Since the clinician will encounter many clinical trials designed to measure ASCVD events, or biomarkers linked to ASCVD progression, understanding how atherosclerotic lesions form is an important step in understanding how to prevent or treat such conditions. In this section, we will briefly outline the biological processes involved in atherosclerotic plaque formation; whereas precursor metabolic processes, such as endothelial dysfunction, insulin resistance and dyslipidemia, will be considered in subsequent sections.
Atherosclerosis describes a condition in which atheromatous plaques form at vulnerable locations within the inner lining of the arterial wall. The description of these plaques and the pathophysiological steps in their formation (and potential rupture) have been intensively studied for well over a century.1 Since that time, numerous theories have been postulated and debated as to the initiation, mediation, and potential resolution of atherosclerosis; many of which are translated from data generated from animal models (of varying degree of similarity to human pathophysiology), cell culture studies or human biopsies, autopsies, surgeries, and scans.2 While a consensus has not emerged on each aspect of this process, what has emerged over these past few decades reveals that the atherosclerotic process is a complex immune response to a variety of perturbations along the arterial wall. The participation of a variety of immune cells and signaling cascades (e.g., inflammation), lipoproteins and their components, smooth muscle cells, calcium deposits, and other cellular debris have given investigators many suspects to interrogate and many potential targets for therapeutic intervention.
Initiation While atherosclerosis is a pathophysiological process that affects the arterial wall in at-risk individuals, it should first be understood that in most subjects,
these lesions form at very specific locations along the architecture of the vascular system. Atherosclerotic plaques usually form along curved or branching portions of the arteries where there is a change in blood flow and a reduction in sheer stress along the vascular endothelium. This altered blood flow (sometimes called turbulent or disturbed flow) creates a different signaling pattern within endothelial cells that appears to facilitate favorable conditions for the development of an atheroma (see page 74 for endothelial dysfunction and related signals). However, since many subjects do not have atherosclerotic lesions, this architecture is not sufficient to initiate the disease process. Therefore, most researchers suggest that an atheromatous plaque must be initiated as a response to some additional perturbation or signal. This is generally referred to as the “response-to-injury” hypothesis, first proposed in the early 1970’s.3 Such injuries were thought to include mechanical injuries, lipid/lipoprotein accumulation (or modification/oxidation of lipoprotein particles), microbial infections, toxins, or noxious metabolites (e.g., homocysteine).4 The response-to-injury theory has gained wide acceptance as the initiator of an atherosclerotic lesion, though alternative hypotheses related to turbulent flow, lipid accumulation, and other physiological processes are still favored by others.5 While our goal is not to invent a new theory of atherosclerotic initiation, it appears that the best way to describe what has emerged from
30 ATHEROSCLEROSIS: THE MAKING OF AN “EVENT”
Cardiometabolic Risk Management: A Functional and Lifestyle Approach Point Institute
Plaque Stability and Rupture15
There are several parameters that determine the stability of each growing atherosclerotic plaque.† Primary among these is the apoptotic death of macrophages/foam cells and the development of the necrotic core.16 As lipid-laden macrophages undergo programmed apoptosis, they release their cellular contents into the intima space. These cells and their debris are supposed to be removed through a process called efferocytosis, carried out mostly by other tissue macrophages. When this process is inefficient, more
and more dead macrophages (and their lipid and cellular debris) accumulate to form a growing necrotic core. This is sometimes accompanied by vascular smooth muscle cell death, reducing the production of extracellular matrix proteins that form the atheroma’s fibrous cap. Together, a large necrotic core and a thin fibrous cap are the hallmarks of a plaque that is vulnerable to a spontaneous rupture and thrombotic occlusion of the artery.17 Local hypoxia within the plaque, along with other signals of vascular remodeling, also leads to angiogenic neovascularization of the atherosclerotic area, resulting in more plaque growth and remodeling.18 Hemorrhages in these small capillaries are more common in vulnerable plaques with large necrotic cores and increased macrophage and erythrocyte infiltration.19
† Note: While at-risk subjects may have numerous atheromatous plaques, each of those plaques may be at distinct stages and vulnerabilities. Unfortunately, it may only require the rupture of a single plaque to result in a fatal event.
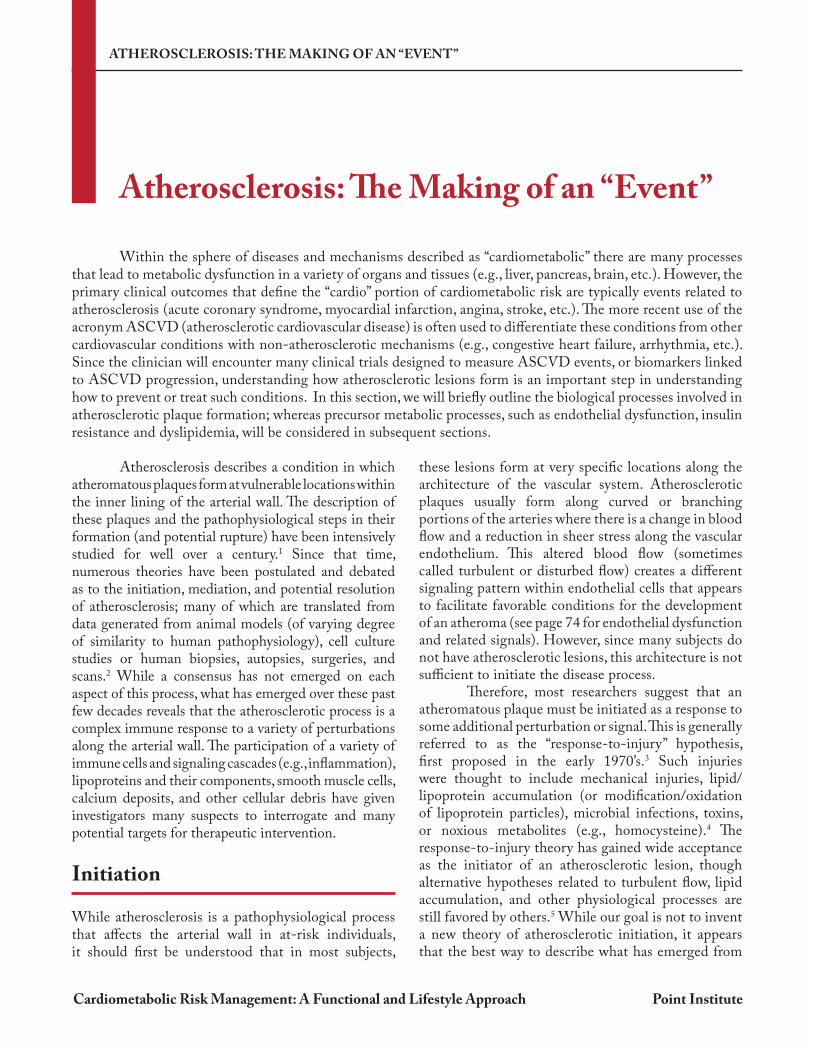
Figure 7: Pathogenesis of Atherosclerotic Event. (a) In the first stage, injury signals and/or low density lipoprotein (LDL) particle that deposit in the endothelium and undergo oxidative modification, resulting in oxidized LDL (oxLDL) initiate the event. These signals stimulate endothelial cells to express adhesion molecules (e.g., vascular cell adhesion molecule-1 (VCAM-1), P-Selectin) and various chemokines (e.g., Monocyte Chemoattractant Protein-1 (MCP-1), Interleukin 8 (IL-8)). This leads to a recruitment of monocytes, which transmigrate into the intima and differentiate to pro-atherogenic macrophages; (b) Macrophages harvest residual oxLDL via their scavenger receptors and add to the endothelial activation and, subsequently, leukocyte recruitment with the secretion of Tumor Necrosis Factor (TNF- ) and IL-6; (c) The increasing plaque volume promotes neovascularization. Proliferating smooth muscle cells (SMCs) stabilize the nascent fibrous plaque. With deposition of fibrin and activated platelets on the dysfunctional endothelium that expresses tissue factor (TF) and von Willebrand factor (vWF), a pro-thrombotic milieu is formed; (d) Foam cells can undergo apoptosis and release cell-debris and lipids, which will result in the formation of a necrotic core. In addition, matrix metalloproteases secreted from foam cells can destabilize the plaque. This can lead to plaque rupture, in which case extracellular matrix molecules (e.g., collagens, elastin, TF, vWF) catalyze thrombotic events. From Steinl DC, Kaufmann BA. Ultrasound imaging for risk assessment in atherosclerosis. Int J Mol Sci. 2015 Apr 29;16(5):9749-69.
40 INSULIN RESISTANCE AND METABOLIC DYSFUNCTION
Cardiometabolic Risk Management: A Functional and Lifestyle Approach Point Institute
P
P
Insulin
InsulinReceptor
PIP2 PIP3 PIP3 PIP3
IRS-1
p85p110
Y
Y
PY
PY
PY
PY
PP
Y
β β
α α
AktPDK1
Glucose
(PDK2)
P P
mTOR
AS160
P Y
Plasma Membrane
PPPPPP
PGLUT4Vesicle
Rab
Phosphoinositide 3-Kinase (PI3K)
A B C D
PTENInhibits signal by dephosphorylating PIP3 (reforming PIP2)
P
PlaPlaP MemMeemmMeemmasma MMasmmaa MM
pp85
asmasmma Meee
5
sphoinositide
10
mbranembbrranneembbbranneeeee
p1 PD A1
P
DK1
P
AktA
Thr 308Ser 474
PTP 1BInhibits signal by dephosphorylating Tyr residues on IR and IRS
JNK Inhibits signal by phosphorylating Ser on IRS-1
P
Translocation and Merging
with Cell Membrane
GLUT4Vesicle
AS160
Rab
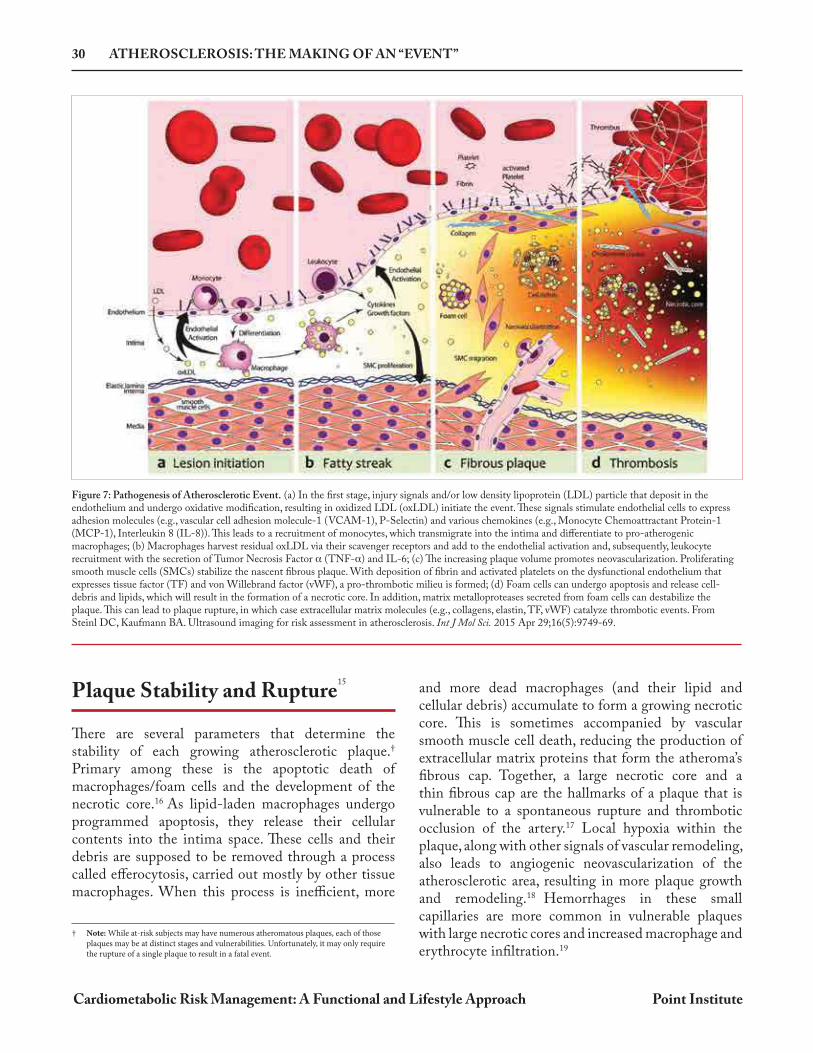
Figure 8: The Insulin-Signaling Cascade. Panel A: Insulin binds to the pocket created by the subunits of the insulin receptor, triggering the autophosphorylation
of tyrosine (Y) residues on the subunits. Insulin Receptor Substrate-1 (IRS-1) is also phosphorylated on several tyrosine residues by the activated insulin receptor’s kinase activity. Protein tyrosine phosphatase 1B (PTP1B) inhibits the signal cascade by removing phosphates from the IR and IRS molecules. Phosphorylation of serine residue of IRS-1 by c-Jun N-terminal kinase 1 ( JNK) or other kinases inhibits the activation of IRS-1.
Panel B: Phosphorylated IRS-1 activates the phosphoinositol-3-kinase (PI(3)K) complex which catalyzes the phosphorylation
of the lipid messenger phosphatidylinositol (3,4)-bisphosphate (PIP2) to its active form phosphatidylinositol (3,4,5)- trisphosphate (PIP3).
Panel C: PIP3 acts to tether Akt and phosphoinositide-dependent kinase 1 (PDK1) to the membrane where PDK1 can
phosphorylate Akt. This phosphorylation, along with a second phosphorylation mediated by the cytoplasmic PDK2, fully activates the phosphorylating activities of Akt. The phosphatase enzyme phosphatase and tensin homolog (PTEN) acts to convert PIP3 back to its inactive PIP2, thereby slowing the insulin signaling pathway.
Panel D: GLUT4-containing vesicles are sequestered from the cell surface by Akt-substrate 160 (AS160) or similar
molecules. Once AS160 is phosphorylated by the actions of an activated Akt molecule, it triggers a process that allows the GLUT4 containing vesicle to merge with the cell membrane allowing for the transport of glucose into the cell.
INSULIN RESISTANCE AND METABOLIC DYSFUNCTION 45
Cardiometabolic Risk Management: A Functional and Lifestyle Approach Point Institute
Physical Characteristics
Insulin resistance, or more accurately hyperinsulinemia and related metabolic alterations, often increases the likelihood that a patient will display certain characteristic signs on a physical exam. The most obvious is an increase waist circumference or waist-to-hip ratio, which is discussed in the section on obesity and adiposity (see page 23). However, several other noticeable physical characteristics of insulin resistance and cardiometabolic risk include skin tags, acanthos nigricans, androgenic alopecia, and hirsutism.62,63,64,65
Skin tags (acrochordons) are benign skin tumors, usually asymptomatic, and found commonly on the neck, axillae (underarm), and groin. While they are more common in older compared to younger subjects, increased numbers of skin tags are linked to hyperinsulinemia and are a strong predictor of MetS and type 2 diabetes.66
Likewise, the velvety hyperpigmented skin of acanthos nigricans is also commonly found on the neck, axillae, groin, elbow and knuckles of adults and children with hyperinsulinemia, obesity, MetS and type 2 diabetes.67,68,69 Both skin tags and acanthos nigricans are thought to be associated with insulin overstimulation of skin cell proliferation, a process likely mediated by insulin-like growth factor (IGF-1) receptor activation.62,70 Since these skin changes are easy to see or ask patients about, they should be considered important potential signs of insulin resistance and risk for cardiometabolic events. Ironically, both increased and decreased hair growth may be a sign of insulin resistance. While the prevalence of hair loss is related to genetics and is generally common in men (30% by age 30, 50% by age 50), androgenetic alopecia is common in both men and women with insulin resistance and MetS.71,72,73 As the name implies, this condition is thought to be mediated through insulin-mediated increases in androgenic activity, though this condition does occur in insulin-resistant subjects without measurably elevated androgen levels.74 Hirsutism is also considered to be a physical sign of androgen-mediated insulin resistance in women, particularly those with polycystic ovarian syndrome (PCOS).75 However, while hirsutism is very common in PCOS, some studies report that hirsutism is not more prevalent in insulin-resistant women without measurably elevated androgen levels or PCOS.76,77,78,79
Clinical and Laboratory Measures of Insulin Resistance
Direct measurement of an individual’s insulin resistance is very difficult, time consuming and expensive; therefore, most clinical and laboratory measures of insulin resistance (or sensitivity) are surrogate markers of the “gold standard” method, the euglycemic clamp.80 This method, more specifically called the hyperinsulinemic-euglycemic clamp, is still commonly used in the research setting, though it is rarely used in routine clinical practice or large cohort studies as a measure of insulin sensitivity.81,82 Essentially, the method involves intravenous infusion of insulin at a steady rate to create an artificial fasting hyperinsulinemia, a condition in which both hepatic glucose production and pancreatic insulin secretion is suppressed. At the same time, exogenous glucose (20%) is infused at a variable rate (measured every 5 to 10 minutes) to maintain a steady serum glucose level (euglycemia, typically between 90-100 mg/dL). Thus, the amount of glucose needed to maintain the euglycemic condition can be measured and calculated as the whole-body glucose disposal rate (M, when divided by the person body weight in kg (or fat-free mass) per minute (e.g., x mg of glucose/kg/min).83
There are several other measures of insulin resistance that similarly require intravenous infusions used in clinical and animal research, such as the insulin suppression test (using somatostatin to suppress both insulin and glucagon) and the frequently sampled intravenous glucose tolerance test (FSIVGTT). Like the euglycemic clamp, they require specially-trained personnel to perform and are both time consuming and expensive; therefore, they are rarely used in the clinical setting.
Dynamic or Functional Tests The oral glucose tolerance test (OGTT) or meal tolerance test, with which many clinicians are familiar, is a functional test of glucose tolerance. It is a simple test that measures the excursions of serum glucose
Measuring Insulin Resistance
THE BASICS OF ENDOTHELIAL DYSFUNCTION 79
Cardiometabolic Risk Management: A Functional and Lifestyle Approach Point Institute
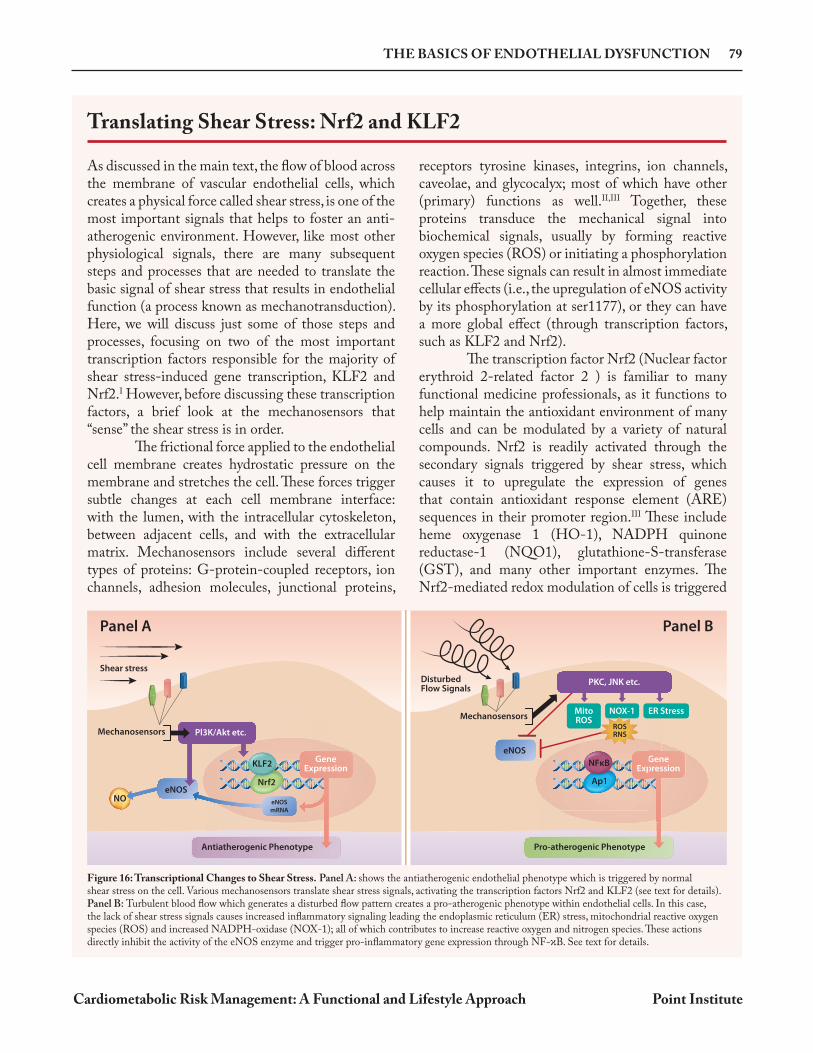
As discussed in the main text, the flow of blood across the membrane of vascular endothelial cells, which creates a physical force called shear stress, is one of the most important signals that helps to foster an anti-atherogenic environment. However, like most other physiological signals, there are many subsequent steps and processes that are needed to translate the basic signal of shear stress that results in endothelial function (a process known as mechanotransduction). Here, we will discuss just some of those steps and processes, focusing on two of the most important transcription factors responsible for the majority of shear stress-induced gene transcription, KLF2 and Nrf2.I However, before discussing these transcription factors, a brief look at the mechanosensors that “sense” the shear stress is in order. The frictional force applied to the endothelial cell membrane creates hydrostatic pressure on the membrane and stretches the cell. These forces trigger subtle changes at each cell membrane interface: with the lumen, with the intracellular cytoskeleton, between adjacent cells, and with the extracellular matrix. Mechanosensors include several different types of proteins: G-protein-coupled receptors, ion channels, adhesion molecules, junctional proteins,
receptors tyrosine kinases, integrins, ion channels, caveolae, and glycocalyx; most of which have other (primary) functions as well.II,III Together, these proteins transduce the mechanical signal into biochemical signals, usually by forming reactive oxygen species (ROS) or initiating a phosphorylation reaction. These signals can result in almost immediate cellular effects (i.e., the upregulation of eNOS activity by its phosphorylation at ser1177), or they can have a more global effect (through transcription factors, such as KLF2 and Nrf2). The transcription factor Nrf2 (Nuclear factor erythroid 2-related factor 2 ) is familiar to many functional medicine professionals, as it functions to help maintain the antioxidant environment of many cells and can be modulated by a variety of natural compounds. Nrf2 is readily activated through the secondary signals triggered by shear stress, which causes it to upregulate the expression of genes that contain antioxidant response element (ARE) sequences in their promoter region.III These include heme oxygenase 1 (HO-1), NADPH quinone reductase-1 (NQO1), glutathione-S-transferase (GST), and many other important enzymes. The Nrf2-mediated redox modulation of cells is triggered
Translating Shear Stress: Nrf2 and KLF2
NO
Panel A Panel B
Shear stress
Mechanosensors
Nrf2Nrf2
KLF2
eNOS
Antiatherogenic Phenotype
Pl3K/Akt etc.
GeneExpression
eNOS
mRNA
Disturbed Flow Signals
Mechanosensors
Ap1
eNOS
Pro-atherogenic Phenotype
GeneExpression
Genpres
Ap1
GExp
NFκB
ER StressNOX-1MitoROS
ROSRNS
PKC, JNK etc.
Figure 16: Transcriptional Changes to Shear Stress. Panel A: shows the antiatherogenic endothelial phenotype which is triggered by normal shear stress on the cell. Various mechanosensors translate shear stress signals, activating the transcription factors Nrf2 and KLF2 (see text for details). Panel B: Turbulent blood flow which generates a disturbed flow pattern creates a pro-atherogenic phenotype within endothelial cells. In this case, the lack of shear stress signals causes increased inflammatory signaling leading the endoplasmic reticulum (ER) stress, mitochondrial reactive oxygen species (ROS) and increased NADPH-oxidase (NOX-1); all of which contributes to increase reactive oxygen and nitrogen species. These actions directly inhibit the activity of the eNOS enzyme and trigger pro-inflammatory gene expression through NF- B. See text for details.
THE GUT MICROBIOTA IN CARDIOMETABOLIC HEALTH 99
Cardiometabolic Risk Management: A Functional and Lifestyle Approach Point Institute
were shown to be more efficient at extracting calories from food during digestion compared to the lean animals, a trait that was transmissible via fecal microbial transfer (FMT).14 These experiments suggest a two-way relationship between the microbiota and obesity; that certain obesogenic traits of the host can modify the composition of its gut microbiota, and that certain components of the gut microbiome (when transferred to a host without such an obesogenic background) can trigger an obese phenotype. Although many early studies suggested a universal reliability to the F:B ratio for predicting an obese or lean phenotype, subsequent research failed to replicate these findings; and, as yet, there appears to be no specific microbial signature for human obesity.15,16,17 Nevertheless, whether or not the
abundance of Firmicutes or Bacteroidetes (or their ratio) is directly causative or universally associated with the obese/lean phenotype, it is now well established that components within the microbiome are significant determinants in the metabolic processes driving the obese/lean phenotype.18 This has been confirmed by the use of FMT studies, in both animals and humans, which predictably generates an obese phenotype in a lean individual merely by inoculating them with the microbiota of an obese donor.13 The clinician should be mindful of this transferability when considering the use of FMT donors who are obese. On the other hand, the ability to treat obesity or other metabolic disorders by transferring a lean phenotype from a lean FMT donor to an obese subject is also being investigated with some promising results.19,20
The technology and techniques used to measure and define the gut microbiota since the 1990s have been advancing significantly and are one of the driving forces behind the surge in publications regarding the microbiota. Not so long ago, analysis of microbiota found in stool samples was done by culturing and/or biochemical means alone. More recently, the development of culture-independent methods to analyze the genetic composition of the microbiota has allowed for the classification and quantification of previously unculturable organisms by traditional plating methods.3 In addition to advances in meta-genomic analysis, other “omics” technologies (e.g., meta-transcriptomics, meta-proteomics, meta-metabolomics, etc.) have emerged to allow for a more nuanced understanding of the microbes present in the GI tract, including some insight into their functionality.4 We should note that the evaluation of a person’s GI microbiota (for research or clinical purposes) is dependent on many variables, some of which greatly affect its ability to predict a clinically-relevant finding. These include recent dietary changes, bowel transit time, stool morphology as measured by Bristol stool scale (BSS), and medications such as antibiotics and laxatives.5,6 One limitation that still exists is that most studies (and virtually all clinic-based analyses)
used to define the status of the gut microbiota rely upon stool samples.7 In fact, mucosa-associated bacteria obtained via biopsy have been shown to differ from the bacteria associated with feces in human subjects.8 However, since fecal sampling is less invasive and easier to collect, most studies use fecal samples as a surrogate marker for the entire gut microbiota. In addition, there is a variable degree of species-specific microbial proliferation that occurs in a sample between collection, transport (i.e., overheating or freezing of sample), and processing that must be “factored in” by computer algorithms after stool analysis to generate the final report. In response to these methodological challenges and the difficulty in reproducing results between studies, the Microbiome Quality Control Project (MQCP) was initiated to “identify sources of variation in microbiome studies, to quantify their magnitudes, and to assess the design and utility of different positive and negative control strategies.”9,10 Therefore, it is important to keep these limitations in mind when evaluating the published literature regarding microbiome-related clinical outcomes, but especially when attempting to interpret the results of a patient’s GI microbiome status based on a single stool sample.
Limitations to Stool-based Microbiome Analysis
DIETARY STRATEGIES FOR OPTIMIZING CARDIOMETABOLIC HEALTH 123
Cardiometabolic Risk Management: A Functional and Lifestyle Approach Point Institute
Ketogenic Diets
Popularized in recent times by the Atkins diet, a variety of ketogenic diets (KetoDiet) continue to gain popularity based on claims that this diet is not only superior for addressing weight loss, but beneficial for other serious medical conditions as well.65,66,67 However, most people don’t realize that the KetoDiet is not a recent invention.68 Since the 1920s, the ketogenic diet has been primarily used to treat epilepsy, though improvements in anti-seizure medications have limited its clinical recommendation for this outcome. Originally, fasting for a minimum of three days was used as a treatment for epilepsy, as documented in 1911.68 Shortly thereafter, Dr. Wilder from the Mayo Clinic proposed that a ketogenic diet could be equally effective at addressing epilepsy, without having to induce starvation.69 The original ketogenic diet was composed of 80-90% fat, with protein (8-15%) and carbohydrates (2-5%) making up the remainder of calories. Essentially, the KetoDiet was designed to mimic fasting without the catabolic consequences of prolonged fasting. Instead, limiting intake of carbohydrates shifts the body into a state of “ketosis,” where it derives most of its energy from fat in the form of ketone bodies (acetoacetate, -hydroxybutyrate, and acetone). Ketosis stimulates gluconeogenesis to offset the lack of dietary carbohydrates, causing a metabolic shift towards the burning of fats (lipolysis), which results in lower serum glucose and insulin levels. While the process of reducing carbohydrates has a direct effect on circulating glucose and need for insulin, the formation of ketones is also considered to be important for mediating the unique outcomes of the KetoDiet70,71,72,73 In fact, several recent studies have shown that the consumption of exogenous ketones can produce effects similar to those obtained from the dietary induction of ketones using the KetoDiet. In 2017, one of the first human trials to examine the metabolic effects of exogenous ketones was conducted using 15 healthy volunteers.74 In this trial (a crossover design), subjects were randomly assigned to ingest -hydroxybutyrate as a ketone ester or a ketone salt at two different doses (12 g or 24 g) to determine changes in blood levels of HB and various glucose and lipid parameters over a four-hour period. Ingestion of both drinks resulted in significant decreases in mean plasma free-fatty acids, triglycerides, and glucose after one hour (all P < 0.05). Also, in 2018, researchers
analyzed the effects of ketone monoesters consumed prior to an oral glucose tolerance test (OGTT) in 20 healthy subjects.75 In this cross-over trial, subjects were randomized to receive either a monoester supplement (482 mg/kg body mass) or placebo 30 minutes prior to an OGTT. Results showed that compared to placebo, monoester supplementation decreased the glucose AUC by 16% (P = 0.001), non-esterified fatty acid AUC levels by 44% (P < 0.001), and C-peptide incremental AUC (P = 0.005).
Clinical Trials using the KetoDietBeyond the low-carbohydrate diets mentioned previously, many clinical trials have been performed to investigate the effects of ketogenic-specific diets on weight loss and cardiometabolic biomarkers (though most still achieve this by reducing carbohydrate intake).76,77 In the past decade, there have been at least three systematic reviews and meta-analysis conducted to analyze the overall finding of these trials, mostly designed to compare the effects of a ketogenic diet against conventional low-fat hypocaloric diets.78,79,80 These trials generally show comparatively better weight loss after six months of following a KetoDiet compared to a low-fat diet, though the weight loss after 12 months is often not statistically different. When evaluating cardiometabolic biomarkers, KetoDiets generally result in statistically lower TG levels and higher HDL-C levels, though they are often also associated with increased LDL-C levels. Variations in ketogenic diet composition (such as a modified Atkins Diet, classic ketogenic diet, MCT diet, etc.) and inter-individual responses may affect lipid profiles. Some studies have shown favorable shifts in LDL particle numbers (a change from pattern B to pattern A)81,82 whereas others have not.83,84
Since the most recent meta-analysis of ketogenic diets (2013), a few notable trials have emerged. In 2014, a moderate carbohydrate diet was compared to a very-low-carbohydrate diet to determine the effects on HbA1c, lipids, insulin resistance, and weight.85 Subjects included in the trial (N = 34) had type 2 diabetes (HbA1c >6.5%) or prediabetes (HbA1c above 6%) and a BMI of 25 or above. Subjects attended 13, two-hour classes that were devoted to diet instructions and lifestyle interventions, including sleep, exercise, and behavioral modification strategies. Participants were randomized to receive either a medium carbohydrate, low-fat, calorie-restricted, carbohydrate counting diet (MCCR) consistent with the American Diabetes Association, or
138 PHYSICAL ACTIVITY AND CARDIOMETABOLIC RISK
Cardiometabolic Risk Management: A Functional and Lifestyle Approach Point Institute
produced (e.g., glutathione reductase, heme oxygenase 1, NAD(P)H dehydrogenase [quinone] 1, superoxide dismutase, catalase, etc.).122
While the redox balancing effects of exercise are generally thought to have direct benefits on tissues affected by cardiometabolic risk, such as the endothelium, there are clinical data to show that these benefits appear to extend to reduced levels of oxidized-LDL particles, which is likely to have an indirect effect on reducing CVD events.123—127 This relationship may be due to the increased activity of the antioxidant paraoxonase 1 (PON1), which has been shown to be upregulated by lifestyle interventions and exercise.128
Finally, we should point out that intense exercise or exercise in subjects who cannot compensate for increase ROS formation can have negative consequences; therefore, exercise should not be considered as having “antioxidant” potential in all subjects. Ironically, while the majority of data suggest that antioxidant supplements are considered to help a person’s overall antioxidant capacity, even during bouts of intensive exercise, high doses of antioxidants may inadvertently hinder the normal ROS-induced redox compensation that accompanies regular exercise. These issues are more likely to come into play with elite athletic situations, where repeated intense exercise is coupled with the need for quick recovery and the use of high-dose supplementation,
conditions that are not typically recommended for cardiometabolic subjects.
Exercise Recommendations
The Diabetes Prevention Program (DPP) is one of the largest trials to compare the role of moderate lifestyle intervention with standard pharmacological therapy (metformin) for the prevention of type 2 diabetes in an at-risk population.129 The original DPP was a 4-year trial that recruited over 3,200 subjects with impaired glucose tolerance (i.e., pre-diabetes) and randomized them to either placebo, metformin (850 mg, twice per day), or moderate lifestyle intervention with the goal to reduce body weight by 7% and incorporate 150 minutes per week of brisk walking. In those randomized to placebo, nearly 35% of subjects had progressed to a diagnosis of diabetes within the 4-year follow-up, while the metformin and lifestyle groups had a significant 31% and 58% reduction, respectively, in the incidence of diabetes over those same 4 years. The success of this lifestyle intervention strategy has led to widespread adoption of the DPP goals and methods for weight-loss prevention and cardiometabolic risk reduction worldwide, especially the universal recommendation for 150 minutes of moderate physical activity per week.130 This target of
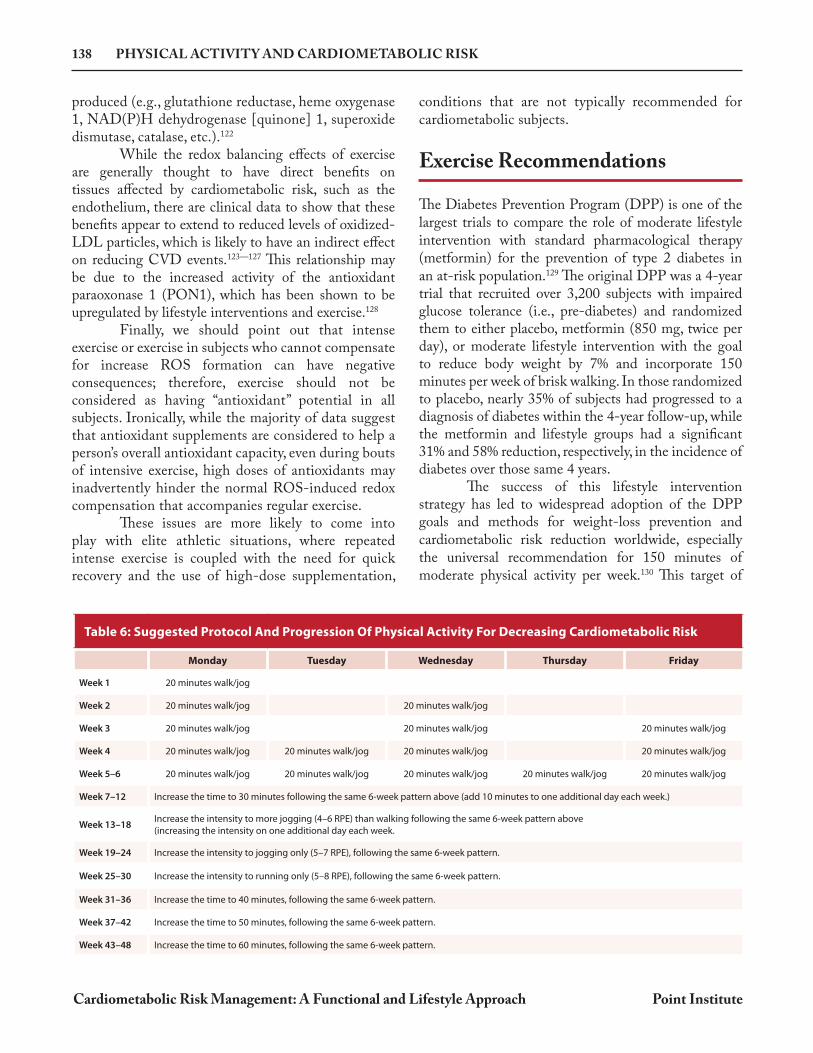
Table 6: Suggested Protocol And Progression Of Physical Activity For Decreasing Cardiometabolic Risk
Monday Tuesday Wednesday Thursday Friday
Week 1 20 minutes walk/jog
Week 2 20 minutes walk/jog 20 minutes walk/jog
Week 3 20 minutes walk/jog 20 minutes walk/jog 20 minutes walk/jog
Week 4 20 minutes walk/jog 20 minutes walk/jog 20 minutes walk/jog 20 minutes walk/jog
Week 5–6 20 minutes walk/jog 20 minutes walk/jog 20 minutes walk/jog 20 minutes walk/jog 20 minutes walk/jog
Week 7–12 Increase the time to 30 minutes following the same 6-week pattern above (add 10 minutes to one additional day each week.)
Week 13–18Increase the intensity to more jogging (4–6 RPE) than walking following the same 6-week pattern above (increasing the intensity on one additional day each week.
Week 19–24 Increase the intensity to jogging only (5–7 RPE), following the same 6-week pattern.
Week 25–30 Increase the intensity to running only (5–8 RPE), following the same 6-week pattern.
Week 31–36 Increase the time to 40 minutes, following the same 6-week pattern.
Week 37–42 Increase the time to 50 minutes, following the same 6-week pattern.
Week 43–48 Increase the time to 60 minutes, following the same 6-week pattern.
BERBERINE (HCL) 175
Cardiometabolic Risk Management: A Functional and Lifestyle Approach Point Institute
Berberine (HCl)
Berberine and related alkaloids have a long history of medicinal use in the various herbal traditions in both the East and West.1 These alkaloids are found in the roots, rhizomes, and stem bark of numerous plants, such as Berberis aquifolium (Oregon grape), Berberis vulgaris (barberry), Berberis aristata (tree turmeric), Hydrastis canadensis (goldenseal), Xanthorhiza simplicissima (yellowroot), and Coptis chinensis (Chinese goldthread). The most common sources for the commercial berberine HCl/sulfate used in dietary supplements are B. aristata and C. chinensis. Berberine is bright yellow and has a bitter alkaloid taste. Historically, its most noted quality is as a compound with antimicrobial, antifungal, and immune enhancing properties.2,3,4 However, berberine has been studied for many other uses, including the treatment of infectious diarrhea, intestinal parasites, congestive heart failure, hypertension, dyslipidemia, platelet activity, arrhythmias, and for hyperglycemia.5,6,7,8 Since berberine’s activities touch upon nearly every pathophysiological aspect of cardiometabolic risk (including beneficial alterations of the gut microbiome), some have called berberine the quintessential cardiometabolic phytonutrient. Here we examine those mechanisms more closely and review the published human clinical trials using berberine to modify risk markers in subjects with cardiometabolic disorders.
Cardiometabolic Mechanisms of Berberine Numerous mechanisms have been proposed for berberine’s role in modulating cardiometabolic disease outcomes.9 These mechanisms have been discovered through in vitro, molecular biology, and animal studies, which suggest that numerous, converging pathways are responsible for berberine’s beneficial effects on a diverse range of cardiometabolic outcomes (e.g., glucose homeostasis, insulin sensitivity, lipid metabolism, endothelial function, inflammation, etc.).10 The pleomorphic activities of berberine are partly attributed to its effects on the microbiome (discussed below) and also to a more recently discovered mechanism: its epigenetic effect on non-coding RNA sequences, a key master regulator of numerous downstream metabolic pathways.11
Modulation of Glucose HomeostasisBerberine is known to modulate glucose homeostasis and insulin sensitivity, as shown in in vitro, animal studies, and human clinical trials. Several mechanisms have been proposed for the role of berberine on these outcomes.
• Berberine supplementation significantly reduced FBG, fasting serum insulin, HOMA-IR, total cholesterol, and triglycerides in KKAy mice compared to control. Gene expression analysis of berberine-treated mice showed significant alteration (up and down regulation) of numerous genes that regulate metabolic functions.10
• Berberine increased insulin receptor mRNA and protein expression, increased phosphorylation of the insulin receptor beta-subunit, and increased Akt in cultured cells.12
• Berberine activated AMPK in 3T3-L1 adipocytes and L6 myotubes and facilitated GLUT4 translocation in L6 myotubes.13 Berberine reduced body weight, significantly improved glucose tolerance, reduced plasma triglycerides, improved insulin action, downregulated the expression of genes involved in lipogenesis, and upregulated those involved in energy expenditure in adipose tissue and muscle in animal models.
• Berberine reduced FBG, HbA1c triglycerides, and insulin levels in patients with T2D in a manner similar, or superior, to oral hypoglycemic drugs.12 In these patients, the percentage of peripheral blood lymphocytes that expressed the insulin receptor
LIPOIC ACID (LA) 245
Cardiometabolic Risk Management: A Functional and Lifestyle Approach Point Institute
Lipoic Acid (LA)
Alpha lipoic acid (LA, a.k.a. thioctic acid) is a natural and versatile antioxidant with numerous potential therapeutic uses. As an antioxidant, it is able to “recharge” vitamin C, vitamin E, and glutathione because of its three-fold water-soluble, fat-soluble, and sulfhydryl properties.1 These activities have been shown to affect a variety of cell-signaling pathways that alter glucose metabolism or the pathways leading to complications of hyperglycemia. Therefore, the primary area of LA research related to cardiometabolic risk has been associated with glycemia and diabetic neuropathy, though more recently other avenues of research have been explored. LA is endogenously synthesized in the mitochondria via lipoic acid synthase and is a potent mitochondrial antioxidant and an essential cofactor for alpha-ketoacid dehydrogenase.2 LA exists in an oxidized (disulfide) and a reduced form (dithiol: dihydrolipoic acid, DHLA), both of which have antioxidant properties.3,4 Exogenous LA in the diet is made available to tissues, where a substantial portion is converted to DHLA via lipoamide dehydrogenase. LA has a relatively short half-life, estimated to be about 30 minutes.5 The vegetables that contain the highest amount of LA are spinach, broccoli, and tomatoes; the highest concentration of LA from animal sources is found in kidney, heart, and liver.6 However, none of these sources deliver therapeutic amounts of LA, which requires supplementation of a synthetically-derived bio-equivalent compound (see discussion of different racemic forms below).†
Lipoic Acid: Mechanisms of Action LA has many documented mechanisms from in vitro and animal models that appear to be beneficial in preventing cardiometabolic risk, especially those related to ongoing hyperglycemia experienced during uncontrolled types 1 or 2 diabetes. Here we outline several of those mechanisms, focusing on the antioxidant, anti-inflammatory, and insulin-signaling activities that, collectively, form the basis of LA’s promising therapeutic activity for subjects with cardiometabolic risk.6
AntioxidantAs an antioxidant, lipoic acid is capable of decreasing oxidative stress, the main stimulus for diabetic complications. LA scavenges superoxide radicals, hydroxyl radicals, hypochlorous acid, peroxyl radicals, and singlet oxygen. LA also has antioxidant functions via its direct ROS quenching and transition metal chelation. A cross-sectional study was performed to assess the oxidative load (by measuring lipid peroxide
levels) in diabetic patients taking 600 mg lipoic acid per day for 3 months.7 The lipoic acid group had 36% lower levels of lipid peroxides and a 38% improvement in the ratio between oxidative stress and oxidative defense (measuring lipid peroxides vs. alpha tocopherol/cholesterol levels). These data confirmed the antioxidant role of lipoic acid in these patients with poor glycemic control, a group prone to oxidative stress and damage. Here are some of the mechanisms through which LA functions as an antioxidant.
• Antioxidant Regeneration: In vitro studies have shown that DHLA is a powerful reducing agent that is able to reduce the oxidized forms of many antioxidants (e.g., vitamin C, glutathione, coenzyme Q10, etc.).8,9 LA may indirectly regenerate vitamin E through its ability to reduce ascorbic acid.10
• Metal Chelation: LA and DHLA inhibit copper- and iron-mediated oxidative damage in in vitro studies and have been shown to inhibit excess iron and copper accumulation in animal models.11,12,13
† Except where specifically mentioned, all animal and human clinical research using “lipoic acid” or “alpha lipoic acid” mentioned in this monograph are performed with a racemic (50:50) mixture of the R and the S enantiomers, the normal result of chemical synthesis. Discussion of the limited use of R-LA products is summarized at the end of this monograph.
256 MAGNESIUM
Cardiometabolic Risk Management: A Functional and Lifestyle Approach Point Institute
Since the Honolulu Heart Study, many studies have published associations between a variety of Mg status measurements and the risk of cardiometabolic outcomes. However, while these associations are strong for certain measurements of Mg status, they may be absent or even inverse when looking at other measures of magnesium status. This is partly because the current methods used to measure total body Mg (or true Mg status) are problematic.15,16 Here we discuss the most common measures of magnesium status used in the clinical literature, how they differ, and whether one is a better measure of status than another.
Dietary Intake (Food frequency questionnaires)Estimating a person’s magnesium status using food frequency questionnaires and dietary recalls has obvious limitations. When directly compared to other measures (e.g., serum) for risk association in the same cohort, dietary magnesium often shows a weaker association and is often not statistically significant at all. This is likely due the fact that overall magnesium status is greatly dependent upon magnesium retention and absorption, assuming the magnesium-containing foods were consumed as reported.
Serum/Plasma Magnesium (circulating magnesium)Most epidemiological studies related to magnesium status and cardiometabolic endpoints have used serum or plasma magnesium level as the measure of magnesium status. However, since only about 0.3% of the total body Mg is found in the serum and these levels are thought be tightly regulated by homeostatic control mechanisms and by the kidney, many believe serum Mg levels to be poor surrogate markers for total Mg status. Nonetheless, serum Mg levels are influenced by both depletion and supplementation and are still the easiest and most cost effective of all Mg tests available for clinicians. Normal serum magnesium levels are generally considered to be between 0.65-1.05 mmol/L,17 though many clinicians consider serum Mg levels below 0.75 mmol/L to be a measure of low Mg
status. (Mg is often reported in other units in the literature; 1.0 mmol/L is equal to 2.0 mEq/L or 2.43 mg/dL).
Intracellular (Red Blood Cell) MagnesiumSome studies have shown that low magnesium status may be better detected by measuring red blood cell magnesium as opposed to serum magnesium levels.18,19 A human magnesium depletion study (magnesium depletion studies may now be deemed unethical due to known cardiac risk) was performed where magnesium status was followed using muscle tissue magnesium (biopsy of vastus lateralis), serum magnesium, and red blood cell (RBC) magnesium concentration.18 An initial control diet (200 mg/day supplemental Mg plus an estimated dietary intake of 112 mg/day) was consumed for 35 days to establish a baseline status. Then, a magnesium depletion period of 93 days ensued that supplied only the 112 mg of magnesium/day from the diet. Finally, subjects were again given 200 mg of supplemental magnesium to the low magnesium diet for a repletion period lasting 49 days. Serum magnesium levels decreased modestly by 4.6% (P = 0.07) between the repletion and depletion diets, whereas red blood cell magnesium levels showed a significant 12% decrease (P < 0.05). However, since RBC Mg also represents less than 1% of total body Mg, is affected by RBC turnover, and is not commonly available, many do not consider RBC magnesium to be clinically superior to serum Mg. Normal ranges for RBC magnesium are considered to be 1.65 to 2.65 mmol/L.17
Urinary Magnesium Excretion Measuring magnesium status through urinary excretion (a 24-hour collection test) is a methodology used in association studies that is reflective of gastrointestinal absorption and renal excretion of dietary magnesium intake. Urinary magnesium excretion may be the most accurate way to measure magnesium status, especially when conducting association studies. Ask your lab for the appropriate sex-specific reference ranges for urinary magnesium.
Assessing Magnesium Status: Which measure is best?
298 RED YEAST RICE (RYR)
Cardiometabolic Risk Management: A Functional and Lifestyle Approach Point Institute
Are There Known Quality Control Issues with RYR Products Sold in the United States?
Here, then, is the crux of the problem for those distributing (or recommending) RYR products to patients in the attempts to use a “natural” statin to help reach target lipid goals and reduce their risk of cardiovascular events. Simply put, the available products have major quality-control issues. A clinician does not know whether the product they are relying upon has any measurable level of monacolin K at all, or whether it might provide 10 mg (or more) per serving. Since manufacturers cannot disclose this information, and even testing for and having knowledge of this information can be a liability, many manufacturers simply extend the “don’t ask, don’t tell” to “don’t ask the vendor, don’t test the product, don’t tell the consumer.” The potential discrepancy in monacolin K levels found in both commercially available RYR raw materials and finished products has been documented several times over the past 10 years.25,26,27 Indeed, it has been confirmed that some commercially available products contain no detectable levels of monacolin K, while others contain over 10 mg of monacolin K per serving. Our own analysis of raw materials available in 2016, as well as RYR products sold by “physician-channel” distributors in 2016, confirms these data. When examined, four different finished products of RYR distributed by four different physician-channel dietary supplement suppliers would deliver 0.0, 0.46, 1.49, or 2.9 mg of monacolin K per serving based on our laboratory analysis. Since none of these products make a label claim related to monacolin K content, we have no idea if these levels meet their intended monacolin K specification (or even if they have such a specification). We did not perform tests on multiple lots of these products to determine if these levels were consistent between lots of the same product. Our data suggest that physician-channel products labeled as RYR are as equally diverse in the amount of likely monacolin K per serving as previous published reports of RYR products available in the retail setting, making it impossible for the clinician or patient to know the potential efficacy (or legal status) of the product they recommend or use.
In reviewing RYR raw materials for purchase by several vendors, we found an interesting dichotomy. Some ingredients were sold with a specification of not more than (NMT) a certain concentration of monacolin K, and others were sold with a specification as having not less than (NLT) a certain concentration of monacolin K. In other words, some ingredients appear to be designed for companies that want a product that is legal (guaranteed to be low in lovastatin), but most certainly ineffective for lipid modulation; while other ingredients appear to be designed for companies that want certain (higher) levels of active ingredient. In our analysis, these raw materials generally tested near their listed specification, and one raw material with no monacolin specification listed had no detectable level of monacolin K.28 With the exception of this last raw material, it would appear that manufacturers purchasing most RYR ingredients should be able to calculate an expected monacolin K level in their product using the specifications listed on the vendor information provided for the purchased raw material, even if they choose not to test their products for monacolin K. However, disclosing this amount on their label or product information is likely to raise suspicion by the consumer (if it is too low) or by FDA (if it is too high).
Does RYR have Some of the Same Precautions (Side Effects) as Other Statins?
We often hear clinicians tell us that patients can tolerate RYR products when they cannot tolerate statins and, therefore, RYR is often viewed as a safe (and effective) alternative to statin therapy. We believe that, in many cases, since very little lovastatin/monacolin K is being delivered in these products, the statin-like side effects are likely to be limited; though the clinical efficacy is also likely limited as well. It is difficult to question or evaluate anecdotal reports, but it is our belief that few clinicians recommending RYR are measuring lipid alterations in the absence of all other recommendations (diet, omega-3 fatty acids, exercise, etc.), to specifically attribute whatever lipid changes they document to the RYR intervention alone. Nonetheless,
VITAMIN K STATUS AND SUPPLEMENTATION 343
Cardiometabolic Risk Management: A Functional and Lifestyle Approach Point Institute
Vitamin K antagonists (VKA, e.g., warfarin/coumadin and derivatives) affect the vitamin K cycle by inhibiting the enzyme VKOR, which functions to recycle the vitamin K epoxide (formed during carboxylation) back to the reduced vitamin K hydroquinone and allow further carboxylation reactions to proceed (see Figure 37). Consequently, VKOR inhibition by VKA reduces the levels of nearly all carboxylated vitamin K-dependent proteins. In fact, in one study, acenocoumarol treatment dosed to attain a target INR of 2.0 in human subjects significantly increased levels of uncarboxylated vitamin K dependent proteins, such as ucFII/PIVKA-II (>100-fold increase, P < 0.001), desphospho-uncarboxylated matrix Gla protein (+208%, P < 0.001), and uncarboxylated osteocalcin (+460%, P < 0.001)).61 Supplementation of these subjects in a dose-escalation manner with MK-7 (10, 20 and 45 μg/day) found that significant reductions in levels of the hepatic ucFII protein only occurred at the 45 μg/day dose taken for one (-24%, P = 0.003) and two weeks (-43%, P < 0.001). Levels of the extra-hepatic ucOC and dp-ucMGP were unaffected by any dose of MK-7. These results are consistent with animal data showing that vitamin K supplementation during VKA treatment only counteracted VKA’s effects on hepatic VKDP carboxylation (blood coagulation) but not in extra-hepatic tissues (e.g., MGP or osteocalcin).62 Furthermore, research has suggested that vitamin K antagonist treatment may be associated with an increased risk of arterial calcification. An animal study using apoE-knockout mice found warfarin treatment significantly increased the frequency and extent of vascular calcification; in addition, warfarin treatment was associated with a downregulation of carboxylated MGP and a concomitant increase in uncarboxylated MGP.63 Another animal study found a dose and time-dependent induction of calcification in the medial layer of the aorta and heart in wild-type DBA/2 mice treated with warfarin, whereas vitamin K2 supplementation of these animals was shown to inhibit calcification.64 Human observational studies have also suggested that VKA treatment may be associated
with increased risk of arterial calcification. In fact, one such study showed that the mean Agatston score increased significantly in subjects as the duration of VKA treatment increased (P = 0.029) compared to risk-matched non-VKA users.63 Another human observational study comparing VKA non-users to chronic VKA users found that subjects taking VKA had a significantly increased median coronary calcium score compared to those not taking VKA (29 compared to 0, P = 0.001).65 Additionally, the mean CAC scores increased with increasing duration of VKA treatment (no VKA: 53; 6-60 months VKA: 90; >60 months VKA: 236, P < 0.001). Therefore, these data suggest that VKA treatment may be associated with arterial calcification. Further supporting the association between the vitamin K cycle and cardiovascular outcomes are observational data that have linked VKOR gene polymorphisms to stroke and coronary heart disease.66 Interestingly, the use of statins has been associated with increased CAC scores in an observational study of subjects (N = 240) with end-stage renal disease, and in vitro data have also shown that statins may impair the synthesis of MK-4 in cell culture models.67,68 The clinical implications of these limited data are unknown and quite controversial. With these considerations in mind, is there a role for vitamin K supplementation in subjects taking VKA with elevated coronary calcium scores (leaving aside the risk/benefit analysis of the VKA-treatment itself )? In general, the answer appears to be “no,” since the vitamin K dose needed to counteract the antithrombotic-effects of VKA are much lower than the dose needed to counteract its arterial calcium-related side-effects. This may be especially true using the more potent MK-7 form of vitamin K. Not only has MK-7 been shown to have a greater serum half-life and more stable serum accumulation compared to phylloquinone, but it has also been shown to be more potent at reducing the INR in patients taking adjusted dosages of acenocoumarol dosed to attain a target INR of 2.0.69 This 2007 study suggested that MK-7 at doses >50 μg/day may affect INR in these patients;
The Role of Vitamin K Antagonists and Related Consequences
344 VITAMIN K STATUS AND SUPPLEMENTATION
Cardiometabolic Risk Management: A Functional and Lifestyle Approach Point Institute
however, a more recent dose escalation study in subjects taking VKA has suggested the dose of MK-7 that affects INR might be much lower – at least for some patients. This MK-7 dose-escalation study (10, 20, and 45 μg/day) in subjects (N = 15) stably anticoagulated with acenocoumarol to a target INR value of 2.0 found that at all doses of MK-7 supplementation, INR values decreased; but the mean decrease did not reach statistical significance until supplementation with 45 μg/day of MK-7 was continued for one week (-20%, P = 0.002), with greater decreases occurring after two weeks (-37%, P = 0.001).61 Individually, however, the 10 μg and 20 μg MK-7 dosages were found to be associated with clinically relevant INR reductions in 40% and 60% of subjects, respectively; suggesting that in some patients taking VKA, dosages of MK-7 as low as 10 μg/day may reduce INR levels. By contrast, a phylloquinone dose-response study in subjects stably anticoagulated for 13
weeks found that the threshold dose of vitamin K1 required to cause a significant lowering of INR was 150 μg/day (interestingly, 100 μg/day vitamin K1 was required to significantly lower the level of ucFII/PIVKA-II, while 300 μg/day of vitamin K1 were required to significantly decrease ucOC levels).70 Therefore, clinicians should be aware of the reported greater relative potency of MK-7 on INR values compared to vitamin K1 in subject taking VKA. Because both forms of vitamin K have been shown to affect INR levels, subjects taking VKA should be monitoring their vitamin K intake, avoiding inconsistencies in vitamin K intake, and clinicians should be monitoring their coagulation status regularly and adjusting VKA dosages as necessary.5 Clinicians should also strongly consider following the coronary calcium levels in such patients and directing them to lifestyle changes and targeted nutrients that may help reduce coronary calcium progression.
There are several different forms of vitamin K available in dietary supplements. While phylloquinone is found in many plants, the vitamin K1 ingredients used in most supplements is not extracted or concentrated from these sources but is instead a “bioidentical” compound produced by organic synthesis (with the same functional activity as that found in plants). Also, while there are many different menaquinones that are found in the diet, there are two forms commonly used in clinical trials and available as ingredients for supplementation: MK-7 and MK-4 (see Figure 36 for structures). The original commercial source of MK-7 was derived from natto (soy) fermentation, though other non-soy substrates can now be used for fermentation. MK-7 can also be produced as bioidentical compound through organic synthesis. Commercial sources of MK-4 are prepared by organic synthesis and almost exclusively used in Japan, though there are some products available in the US. Beyond the outcome differences outlined in this monograph (generally favoring the use of MK-7), it is critical for clinicians to understand the difference between the two available forms of vitamin K2, as their
effective doses are dramatically different. Because of greater bioavailability and bioactivity of MK-7 over MK-4, clinically relevant doses are different by orders of magnitude: ~45 mg/day of MK-4, and only 45–360 g/day for MK-7.71 For comparison, many therapeutic uses of vitamin K1 are typically near one mg/day. Vitamin K3, menadione, a purely synthetic analog, is not available as a dietary supplement, and, due to toxicity, is no longer recommended. Pharmacokinetic data have shown that compared to phylloquinone, MK-7 has a much longer half-life, accumulates to higher and more stable serum levels with prolonged intake, and more completely carboxylates the extra-hepatic VKD protein, osteocalcin.69 These differences were found despite both compounds being well absorbed and peaking in the serum after four hours of oral supplementation. Of note, MK-7 at a dose of 100 μg raised total serum vitamin K levels (K1 + K2) to the upper limit for this measure (i.e., 1.5 nM). Research also shows that MK-7 is more potent than phylloquinone at affecting INR levels in subjects taking vitamin K antagonists (VKA).69
Comparison of Vitamin K Supplement Forms and Pharmacokinetic Data
$54.95 U.S.
Thomas G. Guilliams Ph.D. earned his doctorate from the Medical College of Wisconsin (Milwaukee), where he studied molecular immunology in the Microbiology Department. Since 1996, he has spent his time studying the mechanisms and actions of natural-based therapies, and is an expert in the therapeutic uses of nutritional supplements. As the Vice President of Scientific Affairs at Ortho Molecular Products, he has worked with thousands of integrative and functional medicine clinicians, and has developed a wide array of products and programs that allow clinicians to use nutritional supplements and lifestyle interventions as safe, evidence-based and effective tools for a variety of patients. Tom teaches at the University of Wisconsin- Madison School of Pharmacy, where he holds an appointment as an adjunct assistant professor, and at the University of Minnesota School
of Pharmacy. He is a faculty member of the Metabolic Medicine Institute (formerly Fellowship in Anti-aging Regenerative and Functional Medicine). He lives outside of Stevens Point, Wisconsin with his wife and children.
A Balanced and Evidence-Based ApproachInsulin resistance and related metabolic disorders are driving much of the current burden of cardiovascular disease, itself the leading cause of death in the world, especially where Westernized lifestyle patterns are practiced. The relationship between these overlapping pathologies has resulted in the term “cardiometabolic” risk or disease. And while lifestyle behaviors are at the root of at least 75% of the risk for these diseases, the vast majority of clinical interventions look past these causes for another solution, most often a pharmaceutical option. Those advocating for a change in these priorities are frustrated by this paradox, though little is likely to change if healthcare providers are disproportionately educated in the benefits of pharmaceuticals and invasive rescue interventions, while the evidence for lifestyle and nutrient therapies are rarely touched upon, most often only in an incomplete and/or negative light.
Cardiometabolic Risk Management: A Functional and Lifestyle Approach is designed to help fill the gap between the epidemiological reality (that lifestyle drives most cardiometabolic risk) and the clinical reality (that lifestyle therapies are rarely adequately implemented). If information is the key to implementation, then this Road map is designed to empower the clinician with timely information to inspire confidence in a lifestyle and nutrient approach for preventing and managing cardiometabolic risk.
This guide is intended to be an indispensable resource for anyone making nutrient-based or
dietary supplement recommendations within a healthcare setting:
• Clinicians
• Pharmacists
• Nutritionists
• Dietitians
• Nurses/Nurse Practitioners
• Medical Technicians
• Nutritional Researchers and Educators
• Health Coaches
• Medical/Health Journalists and Writers
• Students of Health Professions
• Manufacturers/ Distributors of Food and Dietary Supplements
About the Author:
Dr. Guilliams’ other writings can be found at The Point Institute at www.pointinstitute.org
ISBN 978-0-9856158-5-7