carbontrack energy management technology
TRANSCRIPT

CONTENTS
OVERVIEW03
CASE STUDIES10
CT200i SPEC SHEET20

OVERVIEW
h"ps://www.youtube.com/watch?v=GyIkSVW7nHA

An intelligent low-cost energy management technology & Internet of Things (IoT) platform
carbonTRACK combines hardware and software to reduce and redistribute electricity use. It makes buildings energy efficient and at the same time prepares homes and businesses for the Internet of Things, battery storage and electric vehicle control.
carbonTRACK monitors energy use from the grid, solar generation, use and exports (if present) and manages electrical loads from electric hot water to individual appliances like TVs. Patented communications protocols allow carbonTRACK to transfer data and commands using a GSM module, voiding the need for Wi-Fi. This assures communication reliability and data security.
Controls and insights are easily accessible via a smart-device enabled user interface.
THE FUTURE OF SMART ENERGY & IoT
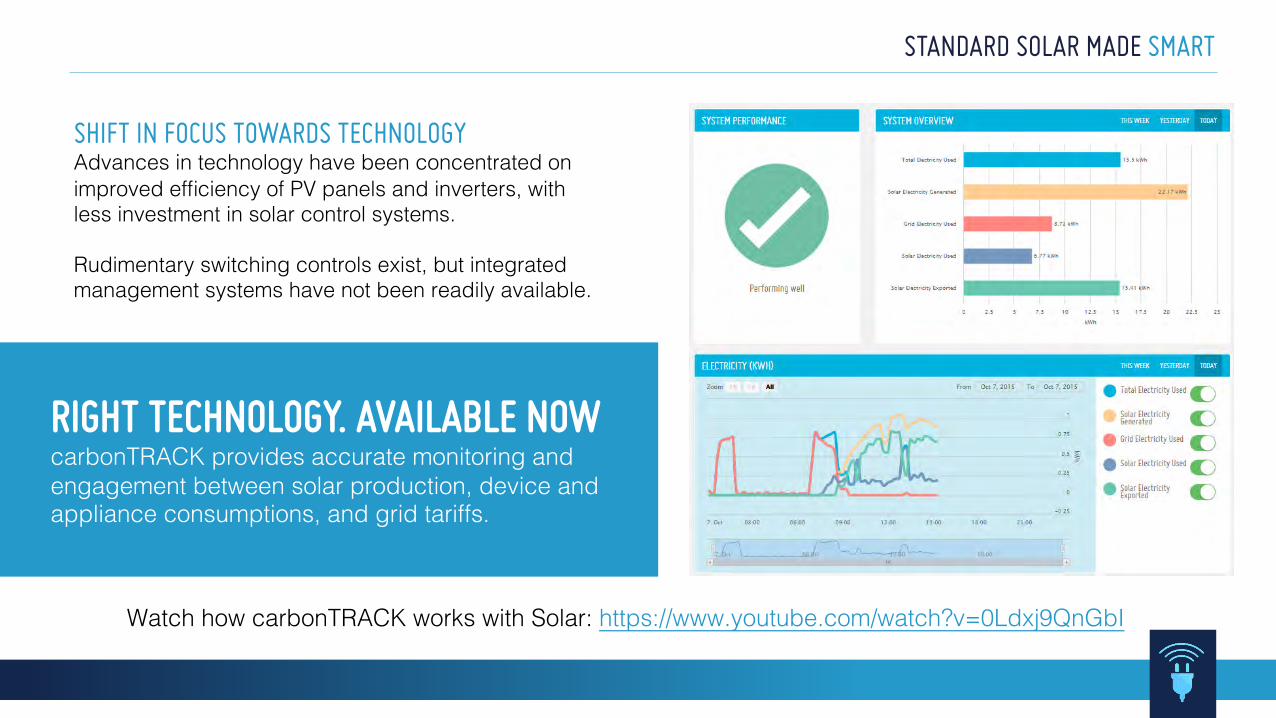
SHIFT IN FOCUS TOWARDS TECHNOLOGY Advances in technology have been concentrated on improved efficiency of PV panels and inverters, with less investment in solar control systems.
Rudimentary switching controls exist, but integrated management systems have not been readily available.
STANDARD SOLAR MADE SMART
RIGHT TECHNOLOGY. AVAILABLE NOW carbonTRACK provides accurate monitoring and engagement between solar production, device and appliance consumptions, and grid tariffs.
Watch how carbonTRACK works with Solar: https://www.youtube.com/watch?v=0Ldxj9QnGbI
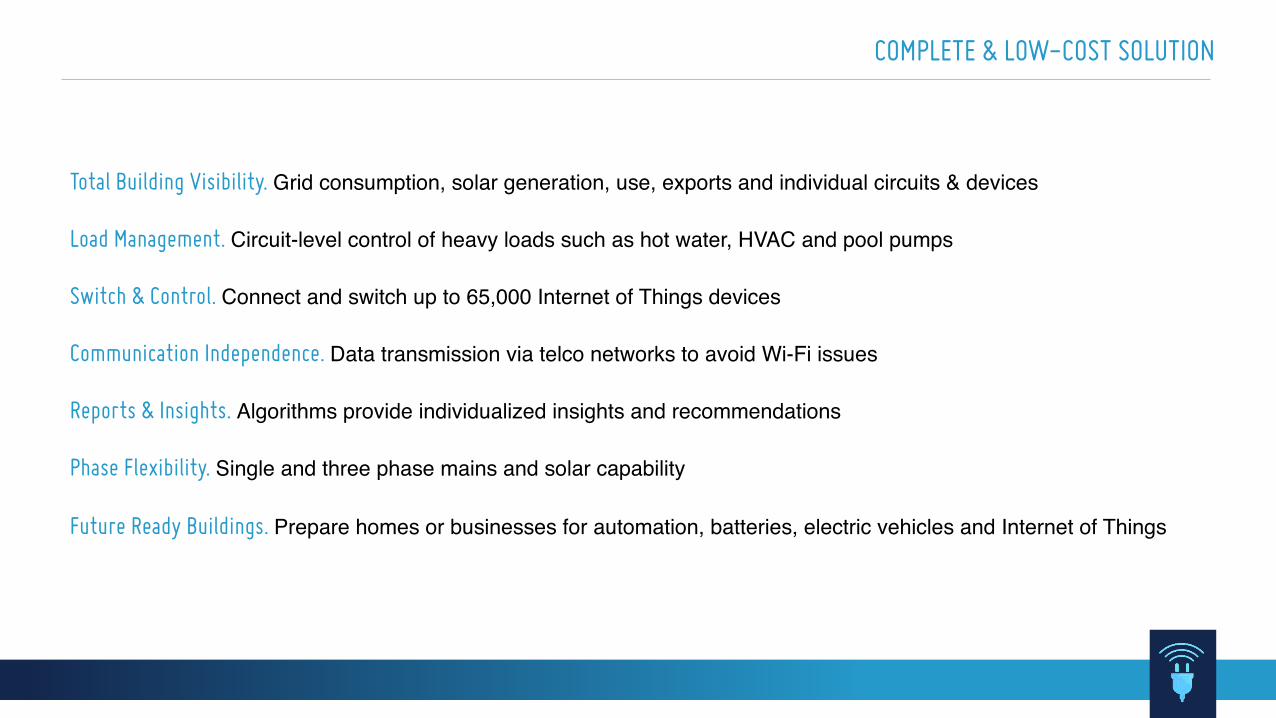
COMPLETE & LOW-COST SOLUTION
Total Building Visibility. Grid consumption, solar generation, use, exports and individual circuits & devices
Load Management. Circuit-level control of heavy loads such as hot water, HVAC and pool pumps
Switch & Control. Connect and switch up to 65,000 Internet of Things devices
Communication Independence. Data transmission via telco networks to avoid Wi-Fi issues
Reports & Insights. Algorithms provide individualized insights and recommendations
Phase Flexibility. Single and three phase mains and solar capability
Future Ready Buildings. Prepare homes or businesses for automation, batteries, electric vehicles and Internet of Things

HARDWARE MATRIX SOFTWARE & COMMS UX & USER INTERFACE
INTEGRATED HARDWARE, SOFTWARE, COMMUNICATIONS IoT PRODUCT PLATFORM

GRANULAR DATA VIA THE USER INTERFACE
Low touch experience and individualised data accessible via smart apps or computers
from anywhere around the world
Dashboard Video: https://www.youtube.com/watch?v=350Cr3HRbc0 Report Video: https://www.youtube.com/watch?v=shaeV6HIpNo Switch Video: https://www.youtube.com/watch?v=HgwPs5PziKg

CASE STUDIES

BRENDON, QLD
SITUATIONBrendon, an electrician on the Gold Coast, understood that his lifestyle affected his energy consumption but didn’t understand how. Despite being a single person household, he used around 20.2 kWh a day. He wanted more clarity about how his behaviour could lead to such high usage.
HOW HE DID ITBrendon used carbonTRACK to:
• Understand how much electricity his major appliances used -he recognised that his electric hot water system used electricityperpetually, even though he only used hot water early in the morning
• Track his use and set timers to switch off the hot water from
11pm to 5am
RESULTSBrendon cut his average daily use to 14.54 kWh. That’s a saving of 27.88%.
Wow, it’s amazing how such a small change can make
such a big difference
Non-solar
DEEPA, NSW
SITUATIONDeepa lives in a large home in the eastern suburbs of Sydney, with daily energy consumption averaging 116kWh. The addition of two family members into the household prompted Deepa to look into her electricity use.
HOW SHE DID IT• Within 24 hours of having carbonTRACK installed, Deepacould see an excessive amount of energy wasted at night by herappliances
• carbonTRACK’s switching capability reduced the heating andcooling cycles in the electric hot water system, and the wine cellar
RESULTS
Within a week, energy had been decreased by a daily average of 55.5 kWh a day, a reduction of 47.66%.
The data and insights accessible on the carbonTRACK interface also suggested that Deepa could potentially offset and additional 25.58% of her energy requirements by installing PV Solar.
I didn’t understand
electricity until carbonTRACK
showed me
Non-solar
Individual results may vary. For privacy reasons, stock photos have been used.Individual results may vary. For privacy reasons, stock photos have been used.
VICKY, VIC
SITUATIONVicky was not seeing a return on her PV solar system. Her electricity bills hardly changed since installing solar. She was frustrated and didn’t know what else she could do.
HOW SHE DID ITUsing carbonTRACK, Vicky:• Monitored her solar system’sdaily performance• Verified her household’s totalelectricity bills• Controlled and minimisedthe hours of operation of herelectric hot water system• Identified when she wasproducing excess solar• Ran energy hungry devices,such as her washing machine,during the peak solar hours
RESULTSWith her carbonTRACK, Vicky was able to increase her household’s solar energy consumption by 12%.
With all these energy efficiency improvements, Vicky reduced her overall daily energy consumption from 31 kWh to 19 kWh; that’s a reduction of 45%.
Before carbonTRACK we didn’t know what we were
producing or using. It was so disappointing
and frustrating!
Solar Solar
BARBARA, VIC
SITUATIONBarbara lives in Melbourne’s outer east. She has five children and had PV Solar installed to help manage her spiralling electricity costs. But solar didn’t decrease her quarterly energy bill, and she was convinced that her PV Solar panels weren’t working.
HOW SHE DID IT• Barbara’s solar provider installed carbonTRACK to reassure herthat her solar was functioning correctly, and to further map her solarproduction against the family’s consumption
• carbonTRACK confirmed that Barbara’s system was performingas it should, and that solar had decreased her grid energy useby over 50%
RESULTScarbonTRACK helped Barbara further reduce her grid electricity use. Originally, Barbara ran her pool pump at night during off-peak tariffs. Using the carbonTRACK app, Barbara shifted this schedule to the middle of the day to take advantage of excess daytime solar production. This intervention alone saved Barbara 10% on her bill.
We are actually looking forward to our next bill
Individual results may vary. For privacy reasons, stock photos have been used.Individual results may vary. For privacy reasons, stock photos have been used.

MICHAEL, VIC
SITUATIONMichael had a battery installed at his home to compliment his PV Solar and manage his night time electricity use. However, even with battery storage installed his bills were still high.
HOW HE DID ITcarbonTRACK determined that when solar generation was lower than the prescribed battery preset, Michael’s battery would charge from the grid connected mains.
RESULTSWith carbonTRACK installed, Michael was able to see when and how his battery was charging. With this new information, Michael set his battery storage parameters so the battery was primarily charged by his PV Solar.
I am now able to see
when and how my battery is charging
Solar & Battery
Individual results may vary. For privacy reasons, stock photos have been used.
“Michael has saved 13% on his last electricity bill since carbonTRACK was installed”
SITUATION Electricity bills have a huge impact on the bottom line of small businesses. The cost of lighting, air-conditioning, coffee machines and appliances used every day was leaving Michael with high quarterly electricity bills in excess of $2500.
These costs seemed unavoidable as the café couldn’t use less electricity when open. Michael installed carbonTRACK to gain the visibility he needed to understand when he was using electricity, and where improvements might be made to reduce his expenses.
HOW THEY DID ITWith carbonTRACK Michael was able to determine two clear opportunities to reduce electricity waste. He could see that there was frequent heating of the two hot water systems outside of hours. Michael could also see that appliances such as the food displays, a toaster, sandwich press and the coffee machine were routinely left on overnight.
Using the carbonTRACK dashboard, Michael set timers to reduce the excessive cycling of electric hot water systems.
He was also able to switch off the coffee machine at close of business and monitor other electricity consuming devices such as fridges to identify further areas for improvement.
RESULTSNow Michael saves 13% on his electricity bills, putting more than $1000 a year back in his business.
CAFE, VIC
Individual results may vary. For privacy reasons, stock photos have been used.Individual results may vary. For privacy reasons, stock photos have been used.
“carbonTRACK reduced the risk of food safety breaches in our cold chain environment.”
SITUATION Fast food chains have high overheads and must comply with the strict HACCP food safety programme. The managers of a chain of five fast food stores were looking to improve their day-to-day practices for greater efficiency and to save money. In particular, they were concerned there may be breaches beyond the acceptable temperature when no one was there to perform checks.
HOW THEY DID ITHot water control carbonTRACK was set to monitor and control a three-phase electric hot water system in five stores. The electric hot water units were put on timers to restrict excessive overnight heating.
Temperature sensors carbonTRACK installed temperature sensors to monitor and automate recordings from the food displays, walk in freezer and refrigeration units. These readings were displayed in real time on the carbonTRACK dashboard so all five stores could be monitored remotely. These sensors saved on labour costs and ensured tighter control over temperature checks.
Email alerts An email alert was set to notify managers when acceptable temperature ranges were breached so they could efficiently manage HACCP risks. The changes saved money by maintaining HACCP standards and decreasing food wastage.
A/C control Finally, the ambient temperature of the restaurants and the air conditioner settings were measured. carbonTRACK demonstrated how with slight adjustments to the temperature controls additional savings of approximately 2% were possible.
FAST FOOD CHAIN, VIC
Individual results may vary. For privacy reasons, stock photos have been used.Individual results may vary. For privacy reasons, stock photos have been used.
RESULTSWith carbonTRACK, the overall energy demand decreased and alerts remotely detected breaches to assit in HACCP compliance.

FAST FOOD CHAIN, QLD
SITUATION The electricity bills for three fast food franchises varied greatly. There was particular concern for managing Peak Demand Charges which accounted for almost half of the monthly electricity bills. Managers wanted a better understanding of energy demands. Without the relevant information, it was difficult to identify which restaurants needed attention and how to improve their performance.
HOW THEY DID ITcarbonTRACK’s functions enabled:
• Visibility of mains electricity consumption
• Load switching for two electric hot water systems per store
• Reduced peak demand events
RESULTSTo prevent excessive peak demand spikes automatic alerts warned management of spikes in power use. With these improvements they reduced their electricity consumption.
“carbonTRACK gave us insights to analyse our stores’ performance and reduce peak demand charges”
Individual results may vary. For privacy reasons, stock photos have been used.
OFFICE BUILDING, NSW HOTEL, QLD
SITUATIONThe Gold Coast hotel wanted to quantify their LED lighting upgrade investment.
HOW THEY DID ITcarbonTRACK was installed to demonstrate energy savings from a swap-out of halogen lights to LEDs.
RESULTSBy comparing the information before and after installation of LED lights, carbonTRACK validated the savings achieved from the upgrade. After installation, results showed a 70% reduction in consumption on the lighting circuits after installation. Furthermore, total energy consumption fell by 24%, drastically reducing their overheads and confirming the return on investment in their new lighting.
SITUATIONManagement was looking to improve their energy efficiency by upgrading to LED lighting. In addition, they wanted to reduce their air-conditioning costs and needed to verify the energy savings.
HOW THEY DID ITcarbonTRACK was installed to measure energy consumption and verify savings.
RESULTSManual forecasting became redundant as staff used carbonTRACK real-time readings. This was a more cost effective approach as costly technicians were not required to attend the site nor were additional reports required from the proprietary Building Management System.
“Before LED upgrades, we needed a baseline of our energy consumption to verify energy savings.”
Individual results may vary. For privacy reasons, stock photos have been used. Individual results may vary. For privacy reasons, stock photos have been used.
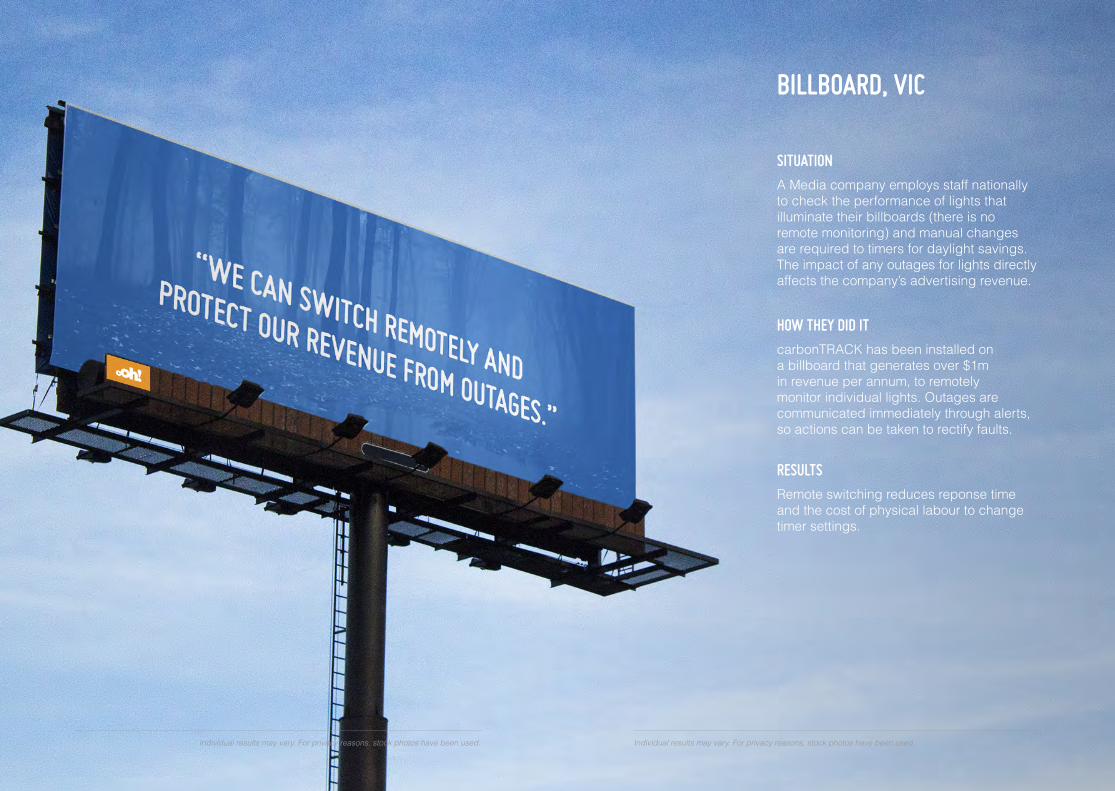
SITUATIONA Media company employs staff nationally to check the performance of lights that illuminate their billboards (there is no remote monitoring) and manual changes are required to timers for daylight savings. The impact of any outages for lights directly affects the company’s advertising revenue.
HOW THEY DID ITcarbonTRACK has been installed on a billboard that generates over $1m in revenue per annum, to remotely monitor individual lights. Outages are communicated immediately through alerts, so actions can be taken to rectify faults.
RESULTSRemote switching reduces reponse time and the cost of physical labour to change timer settings.
BILLBOARD, VIC
Individual results may vary. For privacy reasons, stock photos have been used.Individual results may vary. For privacy reasons, stock photos have been used.

CLOTHING RETAILER, VIC
SITUATIONThis retail chain has set a target to reduce their carbon footprint by 2020 across all their stores.
HOW THEY DID ITcarbonTRACK has been installed in 40 stores to measure and benchmark energy consumption per square metre.
The comparisons allow management to identify behavioural improvements, such as remote control of lights as well as heating and cooling temperature control. Further, carbonTRACK established a baseline to support LED upgrades.
RESULTSManagement can track their energy reduction targets for their improvement strategy. The retail chain will roll out carbonTRACK to additional stores to fast track their carbon reductions and reduce operational costs.
“We can identify both structural and behavioural improvements to help meet our carbon reduction target.”
Individual results may vary. For privacy reasons, stock photos have been used.Individual results may vary. For privacy reasons, stock photos have been used.

CT200i SPEC SHEET

Compatiable with
• Electrical Hot Water units
• HVAC systems
• Solar Hot Water Unit
• Other auxiliary devices
• ZigBee & Z-Wave connected devices
Power
Connected to same phase as solar, powered by the mains. Uses less electricity than a light bulb.
Wiring
Voltage sensor: 85-264V Line to Neutral or Line to Line AC Voltage Sensing
Current Sensor: Maximum 60A for standard sensor (100A option available)
Relay Control Port Voltage: 12VCD
Max Relay Current Draw: 200mA
Unit
• Weatherproof, wall-mountedenclosure
• Weight: 1 kg
• Dimensions: 202.73 x 267.45 x 46 mm
Interface
• Free mobile app and onlinedashboard
• Android or Apple compatible
Communication Protocol
• 3G Network and ZigBeeCommunication capability
• GSM Data Transmission Protocol(Minimal Data Transfer)
Radio:
• Dual-Band:
UMTS/HSDPA 850(800)/2100MHz
UMTS 850/1900: 0.25W
• Quad-Band:
GSM/GPRS/EDGE 850/900/1800/1900MHz
GSM850/GSM900: 2WDCS1800/ PCS1900: 1W
Environment
• Operating Temperature: -20°c to 55°c
• Operating Voltage: 100-240VAC
• Temperature Sense Range: -55°c to125°c
CT200iCOMPATIBILITYKEY FEATURES DETAILED SPECS
Installed in
• Single and three phase mains config-uration
• Single, two and three phase solarpower generation
• Manage energy with user-definedtimers for switching or shifting loads ordevices
• Manual and/or Auto-Schedule
• Reliable communication via mobiletelecommunication network
• Entire historical data access
• Granular updates in 15 minuteintervals
• Generate reports of up to 6 months toreconcile energy bills
• Free mobile App and web dashboard
• Interact on up to 65,000 ZigBee/Z-Wave connected devices
• Battery backup for minimal data loss
• Future-ready for home automationproducts
• Green circuit to maximise solar use
carbontrack.com.au1300 288 648
Contact Us

carbonTRACK PRODUCTS
SMART HUB SMART HUB ENCLOSURE BUNDLE
CURRENT CLAMPS
TEMPERATURE PROBES
BYPASS SWITCH
BYPASS SWITCH ENCLOSURE
MCBS
ANTENNA & EXTENSION CABLES
CT200i-505
CT20E2-010
CT200W-506
CC0601-060
CC1001-061
CC1201-062
CC2001-063
CC2501-064
CC6001-065
CC0011-066
TSA201-201
TSD201-215
TSD401-216
BPSWI1-096
BPSWE1-095
ENC4P1-070
Energy Mgmt Hub
IP55 Outdoor Enclosure
Energy Mgmt Hub w IP55 Outdoor Enclosure
Current Clamp 60Amp
Current Clamp 100Amp
Current Clamp 120Amp
Current Clamp 200Amp
Current Clamp 250Amp
Current Clamp 600Amp
Current Clamp 1000Amp
Analogue Temperature Probe 20m
Digital 20 Temperature Probe 20m
Digital Temperature Probe 40m
Internal By-Pass Switch
External By-Pass Switch
External By-Pass Switch Enclosure - 4 Pole
CB20A1-042
CB25A1-043
AN30C1-012
AN50C1-013
AN01M1-014
AN02M1-015
AN10M1-020
Single Pole MCB 20 Amp
Single Pole MCB 25 Amp
10dB Antenna w 30cm Antenna Extension
10dB Antenna w 50cm Antenna Extension
10dB Antenna w 1m Antenna Extension
10dB Antenna w 2m Antenna Extension
10dB Antenna w 10m Antenna Extension
SPECIFICATIONS
Voltage sensor: 85-264V Line to Neutral or Line to Line AC Voltage SensingCurrent Sensor: Maximum 60A for standard sensor (100A-1000A options available)Relay Control Port Voltage: 12VCDMax Relay Current Draw: 20Amp Free mobile app and online dashboard
Android and Apple compatible
3G Telstra and ZigBee communication capabilityGSM Data Transmission Protocol (Minimal Data Transfer)
WIRING COMMUNICATION PROTOCOL
INTERFACE
Australian Owned,Local Support
Safe & Secure Data Transfer not reliant on
Wi-Fi
Sustainability Awards Innovation of the Year
Finalist 2015
Tech Venture Singapore Finalist
2015
The Innovation Hub Gauteng Accelerator
Programme Winner 2014
CT200i
56mm268mm
204mm
CT200i ENCLOSURE
305mm
260mm
76mm
carbonTRACK connects buildings the future.
The appliances within them will connect and communicate through an Internet of Things platforms to maximize efficiency.
carbonTRACK will provide the management hub to make this happen.
#tomorrowtoday
[email protected] 1300 288 648 carbonTRACK.co