carbonfeel project: calculation, verification ...file.scirp.org/pdf/lce_2014062714561985.pdfj. c....
TRANSCRIPT

Low Carbon Economy, 2014, 5, 65-79 Published Online June 2014 in SciRes. http://www.scirp.org/journal/lce http://dx.doi.org/10.4236/lce.2014.52008
How to cite this paper: Villar, J.C., Meijide, B.G., Penela, A.C. and Hidalgo, S.L. (2014) Carbonfeel Project: Calculation, Veri- fication, Certification and Labeling of the Carbon Footprint. Low Carbon Economy, 5, 65-79. http://dx.doi.org/10.4236/lce.2014.52008
Carbonfeel Project: Calculation, Verification, Certification and Labeling of the Carbon Footprint Juan Cagiao Villar1*, Breixo Gómez Meijide1, Adolfo Carballo Penela2, Sebastián Labella Hidalgo3 1School of Civil Engineering, University of A Coruña, Elviña Campus, A Coruña, Spain 2Departament of Business Organization and Commercialisation, Faculty of Economics and Business Administration, University of Santiago de Compostela, Santiago de Compostela, Spain 3Atos, Barcelona, Spain Email: *[email protected] Received 9 April 2014; revised 8 May 2014; accepted 5 June 2014
Copyright © 2014 by authors and Scientific Research Publishing Inc. This work is licensed under the Creative Commons Attribution International License (CC BY). http://creativecommons.org/licenses/by/4.0/
Abstract Carbonfeel is a collaborative initiative focused on providing methodological and technological so- lutions to the processes of calculation, verification, certification and labeling of the Carbon Foot- print (CF). Any and all organizations from different sectors of activity, business associations, Pub- lic Administrations, certifying agencies, environmental consultancies, non-governmental organi- zations, foundations, universities, etc. that are committed to combating climate change and be- lieve that responsible business is possible, are invited to participate. The project advances the creation of the first network of Carbon Footprint knowledge intended for the consolidation of products and/or services databases, by using primary data. That is what was called Green Coin: “every product has its own environmental price, a price not derived from a database more or less reliable”. The setting-up of a feedback system which organizes stores and shares these raw data is pioneering and innovative. Also, massive eco-labeling is possible due to a mixed organization-and- product approach to the CF calculation (MC3 methodology), with no need for the active participa- tion of all actors in the value chain. Finally, a number of complementary actions within the project, such as its feedback, assemblage, proposal of Recommended Load Allowances and implementation of a new metadata management system, are compiled and explained, showing why Carbon feel is already becoming an outstanding eco-project.
Keywords Carbonfeel Project, Eco-Labeling, Carbon Footprint, MC3 Methodology
*Corresponding author.

J. C. Villar et al.
66
1. Introduction The carbon footprint (CF) is an indicator linked to greenhouse gas emissions resulting from the activity of a specific population. It is a more recent measure than the ecological footprint (EF), and was first used in the early part of this century, although no one knows the exact origin of the term or who first coined the expression.
It is interesting to note that Wackernagel and Rees, the creators of the concept of the EF [1]-[4], estimated a CF, although they did not use the term since the estimation of the CO2 absorption area requires the estimation of the surface area of forest needed to absorb CO2 emissions from the fossil fuels burned by the population of a specific territory. Therefore, it would make sense that the term could have come from the analysis of the EF [5].
Similar to the case of the EF, it also makes sense to calculate the footprint of companies, organizations and their products, known as the corporative footprint [6]. In this field, the indicator is especially attractive for them particularly considering the dissemination and relevance of global climate change and the increasing demand by shareholders, customers and other interested parties for information on the environment [7]. Fuelling this inter- est are the Kyoto Protocol requirements that must be met by the companies as well as any possible post-Kyoto agreements.
In terms of scope, the indicator should be able to estimate the footprint of both the organization and the prod- uct, taking into consideration the total consumption and residuals generated over the life cycle. Therefore, it is necessary to take into account the direct effects, on the facilities of the company itself, as well as the indirect ef- fects, considering the life cycle of the goods and services produced. In the former case, the information obtained will allow managers to make decisions that will help reduce their footprint. In the latter, consumers will be in- formed about the emissions generated or the surface area needed in the production process of the products they purchase. Moreover, companies belonging to the same chain of suppliers will be able to make joint decisions to reduce the footprint of their products, thus differentiating themselves from their competitors in search of new business opportunities.
In recent years there has been a long list of initiatives, the most outstanding of which are the Global Reporting Initiative [8] and [9] and standard AA1000 of the Institute of Ethical and Social Accountability [10] whose goal is to offer recommendations to customers in order to obtain standardized reports that will allow the results from different companies to be compared, including indicators that will provide quantitative results on the sustaina- bility ranking of companies and organizations. At the same time, public and private entities are designing sys- tems geared towards managing the environmental impacts of organizations and their products. Standards like the ISO 14000 series and specifically ISO 14001, or keeping strictly to European Union guidance, the “Eco-man- agement and Audit Scheme” (EMAS) has reached a high degree of acceptance. Both cases deal with voluntary standards of action that allow organizations to design an environmental management scheme, drawing up pro- cedures that will establish policies and programs that will be valid for all kinds of organizations and companies regardless of the sector they belong to, their activity or size.
The adoption of these types of standards has been judged positively by investors. Therefore, a growing num- ber consider sustainability to be a key factor for business success. Another successful approach has been the management of sustainability using specific stock market indexes such as the “Dow Jones Sustainability Indexes” (DJSI) or the “Good Index Series FTSE4”, which measure the efforts of companies that bet on sustainability by facilitating investments in these types of corporations. However, there are problems yet to be solved.
The voluntary nature of the application of the existing standards is the first shortcoming that stands out, since it is the organizations themselves that decide whether or not to use any of the above-mentioned tools. Moreover, the very standards allow for different degrees of application, and in some cases they can be used according to the interests of the users.
Nor has any agreement been reached with regard to the indicators that should be used to measure the perfor- mance of the companies and organizations. The different standards propose a varying number of indicators, twenty nine in the case of the GRI, which may yield contradictory results, making it difficult to carry out the di- agnosis.
Some authors such as [11] have attributed this to the lack of a tool that would use a holistic approach to syn- thesize the environmental situation of organizations and that could be used in both decision-making and in communicating with shareholders, lobbies and the society in general [12] and [13]. The lack of a strategic indi- cator is an obstacle for organizations that would like to incorporate issues related to environmental management into their governance.
In this context, the CF adapts to the needs of companies and organizations for the following reasons: 1) it is a

J. C. Villar et al.
67
single index that synthesizes different environmental impacts related to the goods consumed and the residuals generated by the companies in a single unit; 2) the method of calculation is not complicated; 3) it is expressed in tons of CO2 equivalents, easily understood by everyone, which facilitates decision making as well as internal and external communication.
Moreover, the CF has advantages over other indicators in the field of eco-labeling owing to the use of green- house gas emissions as a unit. The introduction of goods and services through eco-labeling including informa- tion related to emissions generated by their production provides companies with a new alternative for differen- tiation, making the eco-labeling of goods and services a competitive tool that is highly relevant in today’s world and viewed positively by consumers [14], whose purchasing decisions will be able to contribute to global sus- tainability.
At the present time there are several different methods that allow for the estimation of the CF. Within differ- ent contexts on a European and national level, such as Agenda 21, a number of different comparative studies have been proposed in an attempt to determine which of the above methodologies is the best. However, the final report of the European Commission “Product Carbon Foot printing—A study on methodologies and initiatives”, analyzed the eleven methodologies (in use and in development) in addition to the eleven most important imple- mentation policies on a world-wide level, opting for none of the possibilities. Instead, it stated that the different computation philosophies should be homogenized (each with its pros and cons) to reach an optimum result, which has not yet been attained [15].
In a typical local scenario, the City Council of Granada (Spain) carried out a similar study in which a compari- son was made of the six most important methodologies on a nationwide level. Presented in this study, along with the GHG Protocol, PAS 2050 and ISO 14064, is the MC3 methodology based on the financial accounts of the companies. However, this report does not propose a clear-cut, unequivocal solution. Rather, it states that all the methodologies are useful and valid, but varying in suitability depending on the particular circumstances of each municipality [16]-[18].
Carbon feel is a collaborative initiative promoted by the Forum Ambiental Foundation, the Interdisciplinary Group of the Carbon Footprint and the technological enterprise, Atos Origin. The project focuses on providing methodological and technological solutions to the processes of calculation, verification, certification and labe- ling of the CF. Any and all organizations that are committed to combating climate change and believe that re- sponsible business is possible, are invited to participate in the appropriate profile in keeping with their corporate interests. In this way, companies from different sectors of activity, business associations, Public Administrations, certifying agencies, environmental consultancies, non-governmental organizations, foundations, universities, etc. are already taking part. Thanks to this network of actors it will be possible to have, in a very short time, a mar- ketable CF that is accessible, transparent and comparable.
An endless number of seals and certifications have saturated the market. Some of these are based on calcula- tion methods adapted to specific interests of the contracting company, thus only serving to detract credibility from these certifications. This particular circumstance is being used to the advantage of companies interested in putting their products and actions though a “green laundering” process, which gives rise to an unfair scenario in which companies that are truly committed to making their products environment-friendly are faced with the fact that their clients cannot appreciate their good intentions. This is why accessibility, transparency and comparabil- ity are the three basic characteristics that must not be overlooked when confronted with of one of the most im- portant challenges facing humanity.
In short, the door to new solutions is still open, and this is precisely what led to the birth of Carbon feel, a new and innovative initiative developed by scientists of different universities and which clearly contributes to achieve a sustainable way of consumption. The aim of this paper is to explain and remark the importance of this new project in order to make possible global eco-labeling of goods and services based on CF analysis and by using information technologies in order to provide a way of organizing, storing and sharing primary data on CF among all the participants in an economic system.
Over the next few pages as well, a brief approach to MC3 methodology will be presented since it is a key piece of the Carbonfeel project, but no specific explanations will be given as a great deal of publications have already been written about [19] and [20].
2. MC3 Methodology The methodological base on which Carbon feel has been built must ensure the comparability of the footprint of

J. C. Villar et al.
68
products and services based on the resulting calculation, otherwise Carbon feel would just become another seal with no added value.
After an arduous study of the existing approaches and the pros and cons of each, only one method was found to ensure the comparability of the results, i.e. the mixed method put forth by Mathis Wackernagel and William Rees [4], and the well-known EF of the territories with an integrated approach, which ensures the comparability between footprints. At that time, Wackernagel had already welcomed the development of other proposals de- rived from his original definition, which instead of being applied to a closed system like a territory (country, re- gion, city, etc.) would be applied to another type of closed system, such as a corporation, for instance.
2.1. Two Approaches The current interest in the CF has given rise to a variety of calculation methodologies (the input-output method, the component method, life cycle analysis methods, methods for emission factors, multiple “calculators” of all kinds, etc.) which are leading to confusion, hesitation and uncertainty. In fact, most of the above initiatives are encountering unexpected obstacles. Some projects that had predicted the imminent mandatory use of labeling, have been temporarily discontinued, and even the future ISO 14067 standards on the CF—currently being devel- oped—has already been postponed several times.
It is particularly alarming that there are two groups of predominant methodologies which are diametrically opposed: one for the footprint of organizations, and the other for the footprint of products. This is what is caus-ing the major confusion in the business world since companies cannot understand why they have to calculate one footprint for the organization as a whole and another for its products. Moreover, both types of methodolo- gies entail a number of drawbacks that can be summarized as follows:
1) The classic life cycle analysis methods or process-oriented methods (ACV-P such as PAS 2050) are not easy to apply, since they require the participation of several companies on the value chain. Data gathering based on the “most relevant processes” method varies depending on the analyst and the “cut-off criteria” (which are necessary, otherwise the value chain could be infinite) seriously compromise comparability between products. Its limitations are clear: This method calculates potential impacts but not real ones; it is lacking in availability and data quality; and it requires technical assumptions and value judgments, the latter perhaps being the greatest disadvantage of all.
2) The methods that focus on organization (like ISO 14064-1 or the GHG Protocol) are only partial, since they allow “Scope 3” emissions (materials, services, contracts, trips, construction, waste, etc.) to be voluntary, and this may vary from one company to another. This compromises comparability, as well—at least for the time being (unless the new government, to be elected shortly, corrects this situation). Another point that must be added to the above is that the company is free to choose the actual calculation method for the footprint, in addi- tion to the emission factors which should only come from reliable sources (Figure 1).
2.2. The Mixed Approach There is a third approach, whose primary advantage lies in the fact that it is not just another method; rather it comes directly from the genuine, original EF method designed by Rees and Wackernagel. In this case, the re- search group has adapted the original version of the territories to businesses and organizations, and created a compact methodology that incorporates all the categories of consumables or sources of emission. This is how the MC3 methodology came into being.
From the very beginning, the method has combined the footprint of the organization and its products (Advan- tage 1); it allows massive eco-labeling from the start based on energy intensity (GJ/t), with no need for the ac- tive participation of all the actors in the value chain (Advantage 2); starting out with this initial label, it is possi- ble to use, at a later time (with the gradual inclusion of all the suppliers of the chain) a classic, but complete ACV-P by applying the MC3 to each link (Advantage 3); it uses all the emission sources and they are all the same for each case, allowing complete comparability (Advantage 4); all of these emission sources are obtained —without omitting any—on the basis of the consumptions, taken, in turn, from the company’s accounts (a sin- gle scope is used for each one) (Advantage 5); and, as mentioned earlier, it provides the added value of convert- ing the CF into the EF and vice versa (Advantage 6) (Figure 2).
l ready in existence are some thirty publications that attest to the development carried out and the description of the MC3 method, which has been widely disseminated in a number of different books, including two pub-

J. C. Villar et al.
69
Figure 1. The real approaches to the product for the calculation of the carbon footprint (left) or to the organization (right) do not facilitate comparability. Rather, there should be a single methodology that will allow for the simultaneous calculation of the footprint of both the products and organizations, and with this methodology they should be made comparable. (IP: in- coming products or consumables; OP: outgoing products or merchandise)
Figure 2. A mixed approach to the organization and products (as proposed by MC3) makes it possible to unify the footprint of products and organizations and quickly extend the global carbon label.
lished by Ediciones AENOR: “Huella ecológicay desarrollo sostenible” [5], and “Ecoetiquetado de bienesy ser- vicios para el desarrollo sostenible” [12].
Based on the matrix of consumptions and surface areas found on the spreadsheet drawn up to estimate the footprint of the families [21], Doménech has designed a matrix that includes the consumption of the main cate- gories of goods and services required by a company. He also provides sections to include waste generated and land use. Thus, the CF calculated includes GHG emissions from any organization and its products, expressed in tons of CO2 equivalent and caused by: a) the purchase of all kinds of goods and services; b) the occupation of

J. C. Villar et al.
70
space; and c) waste generation. Consumption and waste generation are transformed into the emissions needed to obtain the goods and services
consumed. The method allows the CF to be estimated in two different fields, organizations and products sepa- rately, although the footprint of an item from the goods and services category is obtained from the footprint of all the organizations through which it has passed during its life cycle.
The information needed to calculate the CF of companies using the MC3 methodology is gathered mainly from accounting documents, like the balance sheet and the gains and losses statement, although it might be ne- cessary to collect more data from other company departments that have specific information on the particular sections (waste generation, surface area occupied by the organization’s facilities, consumption of water and energy, etc.).
3. Carbonfeel Project: Something More than Just the Calculation of the CF Carbon feel came about as a proposal that incorporates into the broad network of actors involved in the calcula- tion of the CF, a common language based on consensus. And by betting on the new technologies, it will see that this information will flow in a timely and reliable manner, facilitating mixed focus labeling, which can be re- newed every year by all companies and public organizations.
Carbon feel seeks to introduce the entire business sector to the calculation and certification process, so that it will cease to be a marketing tool only available to large corporations. In this way, even the smallest business will be able to have access, and transparency will be ensured according to the accepted rules and calculation methods, without creating any problems related to possible subjectivity or cut-off criteria in specifying the calculation, thus resulting in comparability as a source of competitiveness.
The reasons behind the birth of a project like Carbon feel, which makes it possible for it to keep growing day by day, can be divided into four different perspectives: the social, the economic, the environmental and the in- stitutional perspective. • Social perspective: introducing concepts like the CF or eco-labeling into a society which today are still un-
familiar (in 2010, only 23% of Spanish consumers, as compared with 94% of their British counterparts and 97% of Japanese consumers, had ever heard the term CF, according to studies carried out by the market in- formation company TNS).
• Economic perspective: laying aside the idea of marketing promoted by some indicators and eco-labels based on methods of questionable reliability, and helping producers and sellers who truly support “green” produc- tion alternatives to be more attractive to the end consumer.
• Environmental perspective: inducing companies to change their production patterns, and in the society at large, promoting a true transformation of consumption habits by providing a measurement tool that is ac- cessible, transparent and comparable.
• Institutional perspective: regulating and standardizing the many different methodologies and initiatives (cur- rently listed in a somewhat disorganized fashion) that are now available to institutions on the state, regional (autonomous communities) and even local level, that would like to take inventory, monitor and promote sus- tainable attitudes and habits in their areas of action.
Its mission is as follows: 1) To organize information and knowledge related to the CF, making it universally useful and accessible to
society as a whole. 2) In organizations, to promote a change in their production patterns, and in the society as a whole, to bring
about a true transformation of their consumption habits, both geared toward a low-carbon culture. Its operational objectives are the following: 1) Standardization of a methodology to calculate the mixed type CF (both organization and product/service),
always adhering strictly to the most commonly used existing international regulations on both the corporate lev- el (ISO 14064, GHG Protocol and future ISO 14069) and product level (PAS 2050 and future ISO 14067).
2) Standardization of the CF verification and certification process. 3) To offer the society a CF labeling system that is accessible, transparent and comparable. 4) Incorporation of all the above-mentioned points in the information society through the use of new technolo-
gies as prescribed in the initiative. However, as earlier mentioned, the project includes a number of actions besides obtaining the footprint itself

J. C. Villar et al.
71
and this makes for a more interesting and comprehensive initiative. These qualities are described below.
3.1. Feedback Here, feedback is the term used to refer to the “recalculation” of the different parameters and conversion factors based on new projects and computation experiments. New values that must replace the ones provided in the dif- ferent versions of the calculation method. The pressing need to obtain new experiments that will bring us closer to measurements that will reflect reality as closely as possible has already been discussed. And this is none too easy. The coordination required by this type of activity is complicated and demands cooperation, discipline and, particularly, a common language—a new form of communication that will allow these new experiments to be shared, validated, certified, classified and put in order.
The mere standardization of a calculation methodology will not serve to create the desired effects. The system needs to be fed information constantly, and not in just one direction but radially, transversally and vertically, un- til it reaches a point of stability so that it will constitute a ‘solid’ system.
On the basis of the feedback concept, Carbon feel supports the gradual updating of secondary data founded on actual experiments and, at the same time, the replacement of the secondary database with a primary database or the real footprints of the products and services. This will bring the calculation closer to reality and provide qual- ity data of incalculable value.
3.2. Assemblage Primary Databases The idea behind MC3 is simple, and in some way, its philosophy may be expressed as follows: “anything I buy has a footprint, therefore, I will demand that my suppliers leave the smallest footprint possible; what I sell goes with the footprint to my customers, therefore I must be efficient so that I can pass on to them a footprint that will allow me to be competitive”.
The calculation tool provided requires an input which, in most cases, is taken from the company’s accounts. A number of conversion factors will translate it into carbon load. The same philosophy of the method—simple and crystal clear—leads to predict that the calculation tool itself that goes along with the method will be short-lived. It is in fact truly desirable, and it is the best thing that could happen, since, if it is analyzed more closely, to rely on a secondary database is nothing more than a provisional “patch”, a “patch” that must be used until what will come after this simple Excel sheet used as a calculation tool. However, what will take its place? What is there behind that Excel sheet or other calculation software, with greater or less appeal, that can be developed?
What is born of this is a joint effort—a feedback process that will be faster or slower in coming depending on the impetus of the Public Administrations. The continuous replacement of conversion factors and energy inten- sities as proposed by the tool, with the true footprints of suppliers or primary data, is the pursued goal. This is the essence and the message of Carbon feel. The calculation based on primary data is sought, but in the mean- time, it will be started out with secondary data that will be fed with information and modified to bring us closer and closer to reality. In effect, the calculation process for the CF of a corporation, product or service, is trans- formed into a simple process of assembling the footprints provided by the suppliers. Each party carries out the calculation of the corresponding part of the map of the life cycle processes; the projects are greatly simplified in terms of time and difficulty and the typical problems related to the cut-offs and subjectivities inherent to classic ACV projects disappear. The reason is obvious: the organization only has to deal with the perimeter that is within its responsibility, the rest is assembly.
It must be emphasized that the fact that all the consumption categories (fuels, electricity, materials, services, etc.) are now meaningless and everything becomes a simple process of consumption identification (monetary or product units) and as regards the supplier who has furnished them, he will provide the necessary data for assem- bly until the final footprint has been composed. The indicators of eco-efficiency will broaden their horizon. No longer will be identified only opportunities for minimization in internal processes. Instead, lower carbon loads in a universe of suppliers will be looked for. The opportunities will multiply exponentially with the application of the method.
3.3. Blood Tests and Nutritional Labeling The final engine to function in the transformation of our society’s consumption habits will ultimately be the citi-

J. C. Villar et al.
72
zen, the end consumer, who will be the one to decide if awareness of the CF has been increased and whether the immersion process has been successful or if we are still adrift in the sea of consumerism that engulfs us.
Marketing techniques, geared towards increasing the consumption habits, use different resources and media —all focusing on stimulating senses and emotions—which sparks an irrepressible urge to consume the product advertised. The information provided is easy to interpret, easy to “buy”. On some level we are soft touches, in this sense, and these techniques are quite successful. A lesson should be learned from them, but in this case to shift the speed down to slower gears.
What do a blood test, a nutritional label and the CF labeling process have in common? At first glance, little or nothing, but there are connections that will lead to apply a new concept in our society: The Recommended Load Quantity.
A clear example of how to provide valid information to a citizen is found in blood tests. Indeed, once the re- sults get back, one can see terms that few people can understand, MCH, MCHC, MCV, PLATELETS, etc. No doubt these quantities, presented in this way, mean little or nothing to the average person. That’s why, on the right-hand side of these figures, there is a range of values that define what is “normal”, including all cases where the value is found within said range.
But what does it mean to be within the normal range? A doctor would answer this question by explaining that the scientific community has a methodology for the calculation of these substances and that this methodology has been applied to an enormous universe of living beings that belong to the human race and that after conduct- ing a statistical study, it was concluded that the vast majority of ‘healthy’ people are within the range of refer- ence shown in the tests. All of this indicates that if a certain value falls within this range, no problems are given in this specific parameter.
Therefore, extrapolating this example to the problem of the lack of understanding of the CF concept in our society, the only thing that would be needed is a calculation method, and not necessarily a particularly detailed or exact method in terms of the results—in fact some of the parameters used in the analyses round off to the nearest hundredth or thousandth. Instead, the only requirement would be the consistent application of the same method, but it must be sure that anenormous universe of data is available to work with reliable information that will then be passed on to the citizen.
If this technique is applied to the commercial field, great emphasis must be placed on the labeling of food- stuffs. Some consumers look for foods that are a high in sodium to compensate for a deficit they may have. Therefore, it is logical that foods should be labeled indicating the amount of sodium and other basic ingredients, such as vitamin content. This decision was made many years ago and the message reached the consumer. Sales rose owing to the fact that a particular food had a label indicating the ingredients and quantities it contained. However, something was missing. The fact that a biscuit contained 3 grams of sodium per 100 grams of product was necessary information, but not sufficient.
This led to the concept of the Recommended Daily (or Dietary) Allowance (RDA), which is the average daily dietary intake level that a “healthy” individual should maintain to continue to be “healthy”. The only thing needed on the label was the percentage of RDA of this particular substance provided by the product. What hap- pened was that the application of this concept revolutionized the market. The manufacturers had to reformulate their products so as not to offer foodstuffs containing 160% of the RDA, which would not be highly recom- mendable, or only 0.5%, which would make the product unmarketable. In the end, food products eventually managed to become stabilized. And this equilibrium came about by using a calculation methodology for these substances as well as a vast number of measurements in a broad universe of living organisms belonging to the “healthy” human species.
Without going into technical details, it would be of interest here to define the concept of the Recommended Load Allowance as the carbon load (or footprint) that a corporation, product or service should have to be able to be considered “healthy”, “sustainable” or “clean”. Indeed, if this figure can be calculated, it will be possible to take a giant step towards helping the average citizen understand the idea of the future application of the CF label, and, logically, change their consumption habits.
It may be that it is not so easy to calculate the Recommended Load Allowance. Obviously a shoe factory is not the same as a power plant. That would be tantamount to comparing the blood tests of a human being and a lizard. The logical thing would be to classify the Recommended Load Allowances for “assimilable” products, services or corporations or similarly the Recommended Load Allowances needed to manufacture a shoe and the Recommended Load Allowance needed to provide, for example, one kWh of electricity.
J. C. Villar et al.
73
Once the calculation method has been established and on the basis of said method a large universe of data has been obtained, a statistical study will provide the Recommended Load Allowances, and, what is more important, they will be able to use the CF label of a product or a service as a support.
The tons of CO2 equivalents released by a product during its life cycle mean nothing to the consumer, but the % of load supported by said product as compared to the reference calculated for a “healthy”, “sustainable” or “clean” product means a great deal, to the point where the consumer might make use of this information to change his or her preferences for one product or another. This type of labeling would contain information that is crystal clear, and with the ability to exert influence.
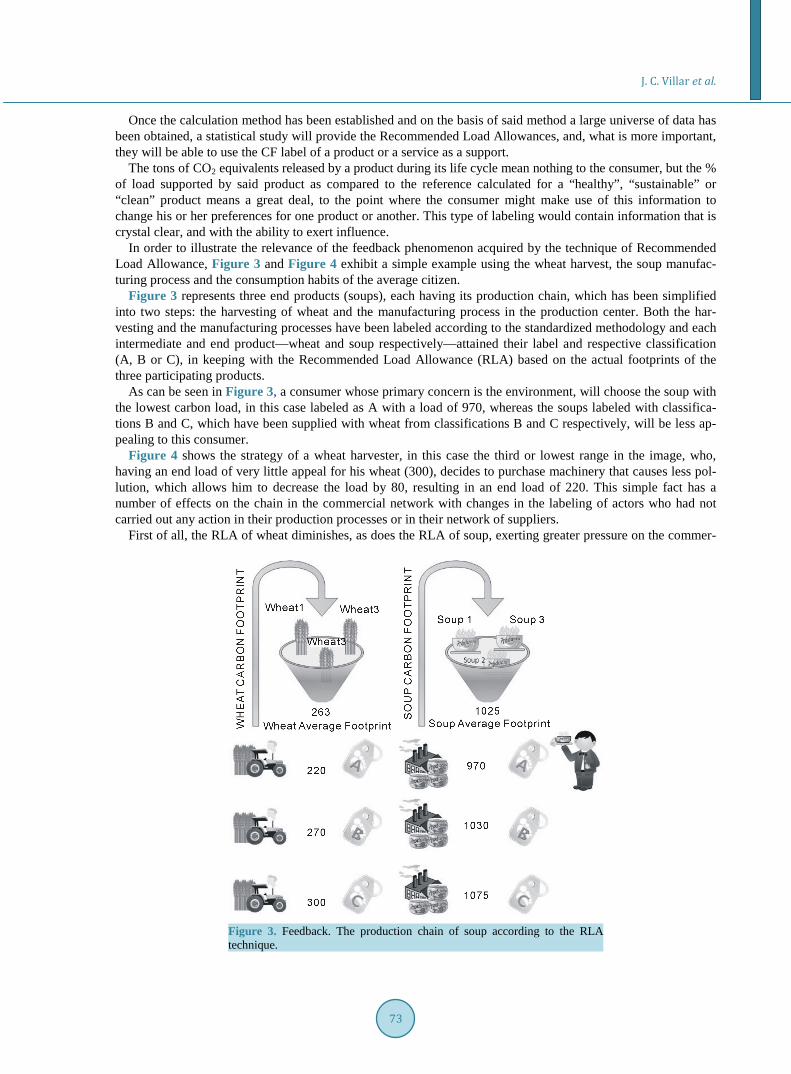
In order to illustrate the relevance of the feedback phenomenon acquired by the technique of Recommended Load Allowance, Figure 3 and Figure 4 exhibit a simple example using the wheat harvest, the soup manufac- turing process and the consumption habits of the average citizen.
Figure 3 represents three end products (soups), each having its production chain, which has been simplified into two steps: the harvesting of wheat and the manufacturing process in the production center. Both the har- vesting and the manufacturing processes have been labeled according to the standardized methodology and each intermediate and end product—wheat and soup respectively—attained their label and respective classification (A, B or C), in keeping with the Recommended Load Allowance (RLA) based on the actual footprints of the three participating products.
As can be seen in Figure 3, a consumer whose primary concern is the environment, will choose the soup with the lowest carbon load, in this case labeled as A with a load of 970, whereas the soups labeled with classifica- tions B and C, which have been supplied with wheat from classifications B and C respectively, will be less ap- pealing to this consumer.
Figure 4 shows the strategy of a wheat harvester, in this case the third or lowest range in the image, who, having an end load of very little appeal for his wheat (300), decides to purchase machinery that causes less pol- lution, which allows him to decrease the load by 80, resulting in an end load of 220. This simple fact has a number of effects on the chain in the commercial network with changes in the labeling of actors who had not carried out any action in their production processes or in their network of suppliers.
First of all, the RLA of wheat diminishes, as does the RLA of soup, exerting greater pressure on the commer-
Figure 3. Feedback. The production chain of soup according to the RLA technique.

J. C. Villar et al.
74
Figure 4. Feedback. A change in the chain by one of the actors triggers positive effects in the entire commercial system from an environmental standpoint.
cial network to obtain A labels. This effect causes the second ranking soup manufacturer, for example, to lose the B classification of their product going down to classification C. At the same time, the third ranking soup manufacturer manages to rise from classification C to A, putting pressure on their competitors and, particularly on the leader up until this time who was the only one to obtain the A classification.
This simple diagram shows the power of the feedback system in which, of the six participating actors, only one makes a change in their processes. The effect is amplified and has immediate repercussions on the commer- cial network, in terms of the environmental improvement of the system.
3.4. Implementation The theoretical system described above cannot be implemented without the incorporation of information tech- nologies, which will provide society with accessible tools for calculation and the electronic exchange of infor- mation among this enormous network of actors consisting of customers and suppliers. Let us proceed to analyze the basic elements for its practical application (Figure 5):
1) Semantics: Language and metadata CF Electronic Exchange Language CfeeL, and communication proto- cols CF Electronic Exchange Services CfeeS.
2) Software: execution of the calculation, assembly and electronic exchange of information. 3) Electronic offices. 4) Carbonfeel Platform. The language of metadata CfeeL (developed using XSD XML Schema technology) and communication pro-
tocols CfeeS (developed using WSDL Web Services Description Language technology) will make it possible to lay down the foundations of the system to be built. They must be non-commercial in nature and developed in keeping with the philosophy of free software. They are essential and form the backbone of the system. They de- scribe the rules for calculation and the database model of the software to be developed by consultancies and

J. C. Villar et al.
75
Figure 5. Carbonfeel components. The consultancies use calculation software able to interoperate with the electronic offices and the Carbonfeel Platform. The certifying agencies have electronic offices and the Car- bonfeel Platform provides information and facilitates the feedback into the system.
software companies, in addition to the rules governing information exchange and protocols for standard errors. This backbone should never be interpreted as being monolithic and rigid, but rather, based on a policy of ver- sions, it guarantees three essential points that must be accepted by all the parties:
1) Flexibility towards the incorporation of international trends. It guarantees that, as an international standard begins to emerge, in any aspect relevant to calculation (emission factors calculation method, limits, etc.), the language will acquire the new trends, which will allow Carbon feel to be given certificates that are accessible, transparent and comparable in addition to complying with the most widely recognized international standards.
2) Sectorial flexibility. This will be structured by sectorial standards in a direction that is in keeping with the sensitivity of each sector. This is necessary given that each sector has its own way of interpreting and relying on the factors that are most suitable to its casuistic.
3) Focused on primary data. Designed to include confidence levels, from the secondary data proposed as a starting point, gearing it towards the final objective: the primary data.
All of these rules designed and agreed upon by the technical committee, should be the foundation on which the three other parts of the Carbonfeel system are built.
The calculation software will be a fundamental part for the consultancies in charge of calculating the corpo- rate footprints and the footprints of the products and services of their clients. It will be developed by any soft- ware company in keeping with the CfeeL and CfeeS premises, and it will be commercial in nature, although the entry of products developed according to the philosophy of free software cannot be ruled out. Basically this type of software should be able to do the following:
1) Calculate the corporate CF. Introduction of the ratios derived from the fieldwork to determine direct emis- sions (Scope 1) and land use and calculation of both headings based on the CfeeL rules. Ability to calculate Scope 2 and Scope 3 completely based on the consumptions supplied by the organization and the calculation rules established by CfeeL. This work will be carried out by “downloading and assembling” the information of the secondary data provided by the Carbonfeel database, or based directly on the primary data supplied by the electronic offices of the certifying agencies in the event that the supplier knows the footprint of its certified product.
2) Calculate the footprint of the organization’s products and services. Once the corporate footprint has been calculated, the computation of the footprint of the products and services will be performed basically using two techniques: either based on the sharing criteria of CfeeL in accordance with the rules of distribution agreed upon by the sector and explicitly specified in the CfeeL language; or using techniques involving Process and Activity
J. C. Villar et al.
76
Maps (PAS 2050) in which detailed maps will be designed, but only within the limits of the organization being studied, since the rest of the Life Cycle located “upstream” has already been calculated, either based on second- ary data or on primary data provided by the first level suppliers.
Electronic Offices. The mission of the residents in the different certifying agencies is to expedite the yearly renewal of the electronic certification process of the corporate footprints and the footprints of products and ser- vices. These foot prints will be filed here and they will also be transmitted to the Carbonfeel database to be used in other calculation processes.
The Carbonfeel Platform. In addition to providing society with the different versions of standards CfeeL and CfeeS, the purpose of this platform is the following:
1) To act as the repository of CF information provided by all the certifying agencies. This information, with the help of powerful calculation engines, will update the secondary database dynamically. These secondary data will come closer and closer to reality, taking advantage of the feedback system created.
2) It will also provide templates of sectorial process maps to facilitate the calculation based on process-based distribution (PAS 2050).
3) It will also calculate and offer society Average Footprints (RLA) that can be used by companies, on the basis of procedures to compare their products with these Average Footprints (Benchmarking), to aim at policies that will improve the environment and the eco-efficiency of their products.
4) Another goal is to propose reference points (recommended footprints) that will allow labeling based on reference points such as the example of the Daily Recommended Allowance for nutritional labeling discussed earlier.
3.5. Road Map of the Carbonfeel Project Carbonfeel was designed using a road map which in six steps provides the elements needed to introduce trans- forming changes into production patterns and consumption habits.
Step 1) Standardization of the methodology for the calculation of the CF. This step corresponds to the process of adaptation of the sector to MC3, which includes the participation of certifying agencies, consultancies, uni- versities, business associations, foundations, technological centers, etc., for the purpose of reaching a consensus and promoting standards that will be accepted by everyone.
Step 2) Standardization of the procedures of certification, verification and labeling. Once the calculation me- thodology has been standardized, the procedures will start to be normalized. These procedures will provide the guidelines for the process of verification and certification. The goal is to liberate the procedure manuals that guide these practices in which information technologies play a crucial role.
Step 3) Technological adaptation of the network of actors. The creation of software based on the new standard, able to calculate the footprint of organizations and their products, will be the natural characteristic of this step. What can be deduced from this is that it will be necessary to carry out a homologation process of this software to guarantee its quality and compliance with the agreed standard. Not only must this software have the ability to do the calculation, it must also be able to exchange data and assemble them appropriately.
Step 4) Organic growth of the network of actors. One of the main advantages of the methodology proposed is the inclusion of the “assembly” concept of the CF. The availability of technology that promotes pro-active projects in the calculation of the CF, as well as the possibility of assembling them, will make it easier for com- panies to demand that their suppliers provide them not only with certified CFs to be able to fit them into their calculation process, but also search data in the network of suppliers whose products and services leave the low- est footprint. Thus, there will be a demand for suppliers with a certified footprint, and this demand is sure to in- crease.
Step 5) Social immersion of the CF. The domino effect of the new culture that has been adopted will reach the end consumer, who will be able to purchase products labeled according to a fair and transparent methodology. People will thus find themselves immersed in a process in which the end consumer will wield yet another crite- rion—that of the environment—in addition to price and quality, which will be taken into account when he or she decides on one product over another and they will dispense with eco-labeling that has purely commercial inter- ests. The feedback process will become stronger with the incorporation of the end consumer, who will start to choose and purchase products more on the basis of the criteria of ‘green’ products using the comparable labeling system.

J. C. Villar et al.
77
Step 6) New patterns of production and consumption. The pressure of new consumption habits in the society will force the emergence of production patterns based on clean technologies. Given the new challenges stem- ming from this novel situation, the organizations should bend over backwards to search—not for cheaper sup- pliers but for cleaner suppliers of technology and processes. The domino effect and the feedback process will combine efforts in this search for a balanced system, in such a way that the large corporations with a high vo- lume of suppliers should try harder than the SMBs, which have a small number of suppliers. The final goal will be to obtain products and services with a lower carbon load in order to accumulate the lowest load in the prod- ucts and services offered.
4. Conclusion This article has given a glimpse of an endless number of advantages and benefits to be reaped from introducing a mixed and integrated methodology accompanied by information technologies that stimulate and facilitate data exchange. Outlined below are these advantages and benefits discussed from different perspectives.
4.1. The Calculation Process 1) A single calculation method. It is no longer possible to continue with the dynamics of methodologies with
simple reports and an infinite number of voluntary and subjective criteria which are a hindrance to comparability. Merely reporting what point was reached in the calculation is not enough.
2) Comparable. Aspiring to comparability is an absolute must in this field to meet the objectives laid down. Carbon feel provides for this.
3) Easy, transparent access to data sources. The MC3 approach, like the one put forth in the original metho- dology by Wackernagel and Rees, with the financial accounts as the data source, is accessible, and these ac- counts are the most transparent tool that people can have access to.
4) The time needed to carry out the calculation projects and the associated costs are drastically reduced. De- fining the object of study within the limits of the organization, thanks to the mixed approach, ensures that the projects will be accessible.
5) Easily automated. The process of calculation, exchange and dissemination is facilitated by the information technologies. It will be possible to recalculate the footprint periodically. In fact, this should be mandatory. It is not enough to make this calculation only once; the improvement process is not possible with only one measure- ment. The calculation process will no longer be an “artisanal” task available only to certain specialists.
6) Shared responsibility. Each company will be responsible for the part of the footprint that pertains to the said company. Those endless calculation projects based on the analysis of the life cycle, in which it is nearly impossible to avoid being discretionary in determining cut-off criteria—a serious problem in LCA-P methodol- ogies—will be a thing of the past.
7) Standardized calculation software which will afford security to the companies and credibility to the pro- cess.
4.2. Information Exchange 1) Free access to the repository through the electronic office(s) set up by the institutions that issue the label. 2) Interoperability ensured for all parties. Guaranteed exchange between customers and suppliers, consultan-
cies, certifying agencies, public administrations, citizens, etc. 3) The exchange process is guaranteed throughout the whole life cycle, starting from the strategy, continuing
on with the calculation, verification, certification and dissemination of the results.
4.3. The Verification and Certification Processes 1) A single verification procedure that is clear and transparent. The verifying agencies receive the information
in a unified format. All they have to do is compare it with the fieldwork. 2) The procedures used in verification and labeling will be electronic and therefore quick and dynamic. 3) Less effort will be needed in the verification process since the assembly philosophy will ensure the tracea-
bility of the data provided, in addition to their credibility. 4) The certification procedure will be equally quick and transparent.

J. C. Villar et al.
78
5) The labeling procedure will guarantee this version preventing the publication of invalid or out-of-date in- formation on the products. The fiscal year end will be made to coincide with the environmental year end.
4.4. Data Transparency 1) The electronic offices will guarantee that the information available to the public can be accessed at each
point along the chain. 2) Business opportunism will be limited. Excellence will be taken into account through corporative catalogues.
The business strategies of the companies will be valid if there is truly an underlying labor dedicated to environ- mental responsibility and awareness.
3) The elimination of a diversity of standards and calculation methodologies will prevent the monopoly of large corporations or lobbies having merely commercial interests, thus benefiting the companies that are com- mitted to combating climate change.
4) Without a doubt, the system will reward truly transparent companies.
4.5. The Transformation of Production Patterns and Consumption Habits 1) The search for a preferential label will trigger the use of “cleaner” technologies and production models in
companies. 2) The search for “cleaner” footprints to assemble will cause a demand for suppliers to offer footprint certifi-
cations that are less and less contaminating, thus leading to a domino effect. 3) Moreover, the existence of rankings and Recommended Load Allowances (RLA) will help the understand-
ing of the consumer who will change his or her consumption habits for truly sustainable products. 4) The actual inertia of the system, based on the high demand for cleaner technologies, owing to market de-
mand, will, in turn, cause their price to go down. It will be possible to produce cleaner products at lower prices. A new industrial revolution based on the society of knowledge will be possible.
5) Stimulation of green purchasing procedures based on the request for certified footprints that are compara- ble and able to be used for the assembly of Scope 3 in the corporation.
6) Creation of green employment. The new philosophy of calculation will cause new companies to enter the market, companies that will be in charge of filling the gaps of specialized consultancy, software creation, new technologies of “green” production, verifying agencies, etc.
7) Stimulation of eco-efficiency projects based on the comparison of a company’s own footprints with the av- erage footprints calculated by the system. Eco-efficiency based on benchmarking.
8) In short, the market will put pressure on everyone, from the consumer to the first supplier on the chain, to move towards production processes and consumption habits whose goal is zero carbon.
4.6. Combating Climate Change 1) Certainly, to fight climate change, the exploitation of natural resources, and ultimately promote a new rela-
tionship with the environment that supports humanity, betting on these types of collaborative initiatives and committing everyone to them will give our society a glimmer of hope.
2) It is always a good idea to try and see the positive side of the different milestones that people pass over the course of their existence. As a result of the above, you could say that climate change has forced the scientific community to devote significant resources to research and analysis, and in this context, the carbon footprint is the clearest and most transparent indicator of the last century. The challenge is to use it in the best way as soon as possible. Society needs to act quickly to start using this road map to be able to slow down in its current life- style.
After all this considerations, the authors of the present paper are conscious that a number of issues regarding the calculation, certification and labeling of the CF are still unsolved. Carbon feel is not, indeed, a final solution, but a tool to keep growing day by day supported by a strong research on this field ,which nowadays is being car- ried out all over the world by many companies and public institutions. As seen, the proposal involves some in- corporations into the broad CF network of actors with the aim of making it, step by step, more effective as well as efficient. This way, the advantages are significant, not only from the point of view of data processing, but also from the point of view of the operability, production and consumption habits, and of course, climate change.

J. C. Villar et al.
79
In short, society can continue to turn a blind eye for a little while longer. But after what has been said in this article, one thing is known: a whole new economic, environmental and social paradigm is at stake. It is worth the effort to do as much as possible so that humanity does not miss the great opportunity given by a concept that is so simple and yet so magical.
References [1] Ewing, B., Reed, A., Galli, A., Kitzes, J. and Wackernagel, M. (2010) Calculation Methodology for the National Foot-
print Accounts. 2010 Edition, Global Footprint Network, Oakland. [2] Global Footprint Network (2009) Ecological Footprint Standards (2009). Global Footprint Network, Oakland. [3] Kitzes, J., Galli, A., Riz, S.M., Reed, A. and Wackernagel, M. (2008) Guidebook to the National Footprint Accounts:
2008 Edition. Global Footprint Network, Oakland. [4] Wackernagel, M. and Rees, W. (1996) Our Ecological Footprint: Reducing Human Impact on the Earth. New Society
Publishers, Philadelphia. [5] Doménech, J.L. (2007) Huella ecológica y desarrollo sostenible. AENOR Ediciones, Madrid. [6] Wiedmann, T., Lenzen, M. and Barret, J. (2009) Companies on the Scale: Comparing and Benchmarking the Foot-
prints of Businesses. Journal of Industrial Ecology, 13, 361-383. http://dx.doi.org/10.1111/j.1530-9290.2009.00125.x [7] Wiedmann, T. and Lenzen, M. (2009) Unravelling the Impacts of Supply Chains. A New Triple-Bottom-Line Ac-
counting Approach. In: Schaltegger, S., Bennett, M., Burrit, R. and Jasch, C., Eds., Environmental Management Ac- counting for Cleaner Production, Springer Netherlands, Amsterdam, 65-90.
[8] Global Reporting Initiative (GRI) (2002) Sustainability Reporting Guidelines 2002. Global Reporting Initiative, Bos- ton.
[9] Global Reporting Initiative (GRI) (2006) Sustainability Reporting Guidelines 2000-2006. Global Reporting Initiative, Amsterdam.
[10] AccountAbility (2006) AA1000 Guidance Note on the Principles of Materiality, Completeness and Responsiveness as they Relate to the AA1000 Assurance Standard. AccountAbility, London.
[11] Holland, D. (2003) Making Project Management Discipline Integral to Corporate Culture. Journal of Petroleum Tech- nology, 55, 33, 34, 36.
[12] Carballo Penela, A. (2010) Ecoetiquetado de bienes y servicios para un desarrollo sostenible. AENOR Ediciones, Madrid.
[13] Carballo Penela, A., Mateo-Mantecón, I., Doménech, J.L. and Coto-Millán, P. (2012) From the Motorways of the Sea to the Green Corridors’ Carbon Footprint: The Case of a Port in Spain. Journal of Environmental Planning and Man- agement, 55, 765-782. http://dx.doi.org/10.1080/09640568.2011.627422
[14] Schaltegger, S. and Wagner, M. (2006) Managing the Business Case for Sustainability—The Integration of Social, En- vironmental and Economic Performance. Greenleaf Publishing, Sheffield.
[15] European Comission (CE) (2011) Product Carbon Footprinting—A Study on Methodologies and Initiatives. Final Re- port. http://wko.at/tirol/industrie/indakt2010/Folge38/PCF-executive%20summary.pdf
[16] BSI (British Standards Institute) (2008) PAS 2050: 2008. Specification for the Assessment of the Life Cycle Green-house Emissions of Goods and Services. British Standards Institute, London.
[17] BSI (British Standards Institute) (2011) PAS 2050: 2011. Specification for the Assessment of the Life Cycle Green-house Gas Emissions of Goods and Services. British Standards Institute, London.
[18] CONAMA (2010) Informe CONAMA 2010, Fundación CONAMA. [19] Cagiao, J., Gómez, B., Doménech, J.L., Mainar, S.G. and Lanza, H.G. (2011) Calculation of the Corporate Carbon
Footprint of the Cement Industry by the Application of MC3 Methodology. Ecological Indicators, 11, 1526-1540. http://dx.doi.org/10.1016/j.ecolind.2011.02.013
[20] Carballo Penela, A. and Doménech, J.L. (2010) Managing the Carbon Footprint of Products: The Contribution of the Method Composed of Financial Statements (MC3). International Journal of Life Cycle Assessment, 15, 962-969. http://dx.doi.org/10.1007/s11367-010-0230-1
[21] Wackernagel, M., Dholakia, R., Deumling, D. and Richardson, D. (2000) Redefining Progress, Assess your House- hold’s Ecological Footprint 2.0. http://greatchange.org/ng-footprint-ef_household_evaluation.xls