carbon mineralization from organic wastes at different composting stages during their incubation...
TRANSCRIPT

Carbon mineralization from organic wastes at different
composting stages during their incubation with soil
M.P. Bernal*, M.A. SaÂnchez-Monedero, C. Paredes, A. Roig
Department of Soil and Water Conservation and Organic Waste Management, Centro de EdafologõÂa y BiologõÂa Aplicada del Segura,
CSIC, PO Box 4195, 30080 Murcia, Spain
Received 24 June 1997; accepted 3 March 1998
Abstract
The decomposition of seven different organic waste mixtures prepared with sewage sludges, animal manures, city refuse and
industrial and plant residues, was studied during their aerobic incubation with soil. The waste mixtures were composted by the
Rutgers static pile system, and four samples of each mixture were collected at various composting stages: the initial mixture,
and samples taken during the thermophilic phase, at the end of the active phase and after maturation. These samples were
added to a calcareous silt loam soil at a rate of 200 mg per 10 g soil, and the CO2±C evolution was determined during 70 days
of aerobic incubation at 288C. Carbon mineralization decreased as the composting time lengthened. The lowest values of C
mineralization were found for the mature samples, and only a compost which had not attained an advanced degree of
maturation gave results higher than 25% of TOC. Carbon mineralization followed a combined ®rst- and zero-order kinetic
model in most of the samples, suggesting that the organic C of the composting wastes was made up of two organic pools of
differing degrees of stability. However, the differences in the slow C mineralization pool at the end of the active phase and
after maturation were very small, indicating that the organic matter at both stages was of a similar microbial stability.
Comparing the C mineralization which takes place in soil and during composting, it can be concluded that composting is the
best way of obtaining maximum C stabilization, which is an important factor in soil conservation and reclamation. # 1998
Elsevier Science B.V. All rights reserved.
Keywords: Carbon mineralization; Compost maturity; Mineralization kinetic; Organic waste; Soil conservation
1. Introduction
The application of organic wastes, such as animal
manures, sewage sludge, city refuse, etc. to soil is a
current environmental and agricultural practice for
maintaining soil organic matter, reclaiming degraded
soils and supplying plant nutrients. These wastes are
rich in nitrogen providing high agricultural value, and
in fresh organic matter which stimulates the soil
microbial metabolism and soil enzymes. Their biolo-
gical decomposition depends on the degradation rate
of a wide range of C compounds present in the sample
(carbohydrates, amino acids, fatty acids, lignin, etc.),
as well as on their nutrient content. Then the amount of
CO2±C released from organic wastes in soil has been
shown to depend on the material used: plant residues,
animal manures, sewage sludges, etc. (Ajwa and
Tabatabai, 1994). The degradation of wastes that con-
tain a high percentage of soluble organic carbon in the
Agriculture, Ecosystems and Environment 69 (1998) 175±189
*Corresponding author. Tel.: +34 68 215717; fax: +34 68
266613; e-mail: [email protected]
0167-8809/98/$19.00 # 1998 Elsevier Science B.V. All rights reserved.
P I I S 0 1 6 7 - 8 8 0 9 ( 9 8 ) 0 0 1 0 6 - 6

form of amino acids, carbohydrates, etc., leads to a
¯ush of CO2 production immediately after their addi-
tion to soil (Marstorp, 1996). This can cause a high
CO2 concentration, low O2 levels, which can lead to
O2 de®ciency in the rhizosphere, and therefore anae-
robic and reducing conditions in the soil. The strong
microbial activity could also promote the degradation
of the indigenous soil organic matter, which is known
as priming effect. Inorganic N can be immobilized
through its incorporation into microbial tissues, being
temporarily unavailable to plants. Intermediate pro-
ducts of organic waste degradation such as volatile
fatty acids, alcohols and phenols, are toxic to plants
and the reducing conditions may solubilize heavy
metals in the soil. Therefore, the usual agricultural
practice is to add organic wastes to soil some weeks
before sowing to allow the soil microorganisms to
degrade the labile organic matter, reduce phytotoxi-
city, release plant nutrients and reach a new equili-
brium in the soil microbial activity (Bernal et al.,
1998a).
The treatment of organic wastes before applying
them to soil can be aerobic (composting) or anaerobic
(fermentation, biogas digestion), which changes their
composition (Kirchmann and Witter, 1992), microbial
stability and, therefore, the proportion of C miner-
alized after their addition to soil (Bernal and Kirch-
mann, 1992). Composting is a biological process of
aerobic decomposition, which degrades labile organic
matter to carbon dioxide, water vapour, ammonia,
inorganic nutrients and a stable organic material (com-
post) containing humic-like substances (Senesi, 1989).
Composting is the most widely used treatment of
organic wastes, which is very well developed for city
refuse and the compost has been generally used in the
last years. Nowadays, the composting technology is
being updated to process organic wastes of different
origin, such as sewage sludge, animal manures, agro-
industrial wastes, etc., (Hoitink and Keener, 1993;
Paredes et al., 1996; Bernal et al., 1998b).
There are four important stages in the composting
process: (1) the initial stage, when the raw material has
not yet undergone any decomposition; (2) the thermo-
philic phase, when the material reaches its maximum
temperature (>408C) and is degraded most rapidly; (3)
the end of the bio-oxidative phase, which is marked by
a fall in temperature to values close to the external
temperature; and (4) the maturation phase, which is a
lengthy period of stabilization intended to produce a
highly stabilized and humi®ed mature compost, free of
phytotoxicity. Thus, this matured organic material or
compost can be de®ned as the stabilized and sanitized
product of composting, which has undergone decom-
position and is in the process of humi®cation. It is
therefore bene®cial to plant growth. However, depend-
ing on the composting facility and compost demand,
the material applied to soil can have different degree
of maturity, i.e., it can be taken after the biooxidative
phase before maturation, slightly transformed during
the biooxidative phase or even at the thermophilic
phase. The use of immature compost can cause phy-
totoxic effects as well as N de®ciency to plants, which
reduces plant yield (Bernal et al., 1998a)
It is necessary to know the degree of stabilization of
the organic matter in composting organic wastes and
its decomposition rate if maximum bene®t is to be
obtained from the compost after its addition to soil.
This knowledge can be achieved by studying the C
mineralization of organic wastes in incubation experi-
ments with soil. The ®tting of kinetic equations to
mineralization curves makes it possible to calculate
the fraction of potentially mineralizable C and its
mineralization rate. Several kinetic models have been
used to describe the decomposition of wastes. The
®rst-order kinetic model has been widely used in C
mineralization studies because of its versatility (Sinha
et al., 1977; Murwira et al., 1990; Ajwa and Tabatabai,
1994). Although alternatives to this model have also
been presented, most of these include several organic
pools of different degrees of stability, a combination of
two ®rst-order equations (Boyle and Paul, 1989; Mar-
storp and Kirchmann, 1991) or a combination of diffe-
rent kinetic order equations (Bernal and Kirchmann,
1992).
The main aim of the present paper was to study
the organic C mineralization rate of several organic
wastes when added to soil after undergoing varying
composting times, and to assess the best degree of
composting for soil conservation.
2. Materials and methods
2.1. Composting samples and soil used
Seven mixtures were prepared with different or-
ganic wastes at the following rates (wet weight):
176 M.P. Bernal et al. / Agriculture, Ecosystems and Environment 69 (1998) 175±189

SC 46.5% sewage sludge�53.5% cotton waste.
PCO 34.6% poultry manure�65.4% cotton waste
�1.93 l/kg olive-mill wastewater.
SCO 32.1% sewage sludge�67.9 cotton waste
�0.94 l/kg olive-mill wastewater.
SM 79.0% sewage sludge�21.0% maize straw.
SMO 52.8% sewage sludge�47.2% maize straw
�1.76 l/kg olive-mill wastewater.
PPB 27.0% pig slurry�20.0% poultry manure
�53.0% sweet sorghum bagasse.
RB 95.0% city refuse�5.0% sweet sorghum
bagasse.
About 1500 kg of each mixture was composted in a
pilot plant using the Rutgers static pile composting
system. This system maintains a temperature ceiling
in the pile, thus encouraging a high decomposition rate
through the on-demand removal of heat by ventilation
because excessively high temperatures slow down
decomposition by reducing microbial activity (Fin-
stein et al., 1985). Air was blown from the base of the
pile through the holes of three PVC tubes, 3 m in
length and 12 cm in diameter. The timer was set for
30 s ventilation every 15 min. The ceiling temperature
for continuous air blowing was 558C. The bio-oxida-
tive phase of composting (active phase) was consid-
ered ®nished when the temperature of the pile
was stable and near air temperature. This stage was
reached after 49 (SC), 49 (PCO), 84 (SCO), 56 (SM),
63 (SMO), 56 (PPB) and 77 (RB) days in the different
mixtures. Air-blowing was then stopped to allow the
compost to mature over a period of two months. Four
samples per mixture were selected at different stages
of the composting process: the initial untransformed
mixture (I), a sample taken during the thermophilic
phase (with the exception of PPB) (T), a sample from
the end of the active phase (E), and a sample from the
mature compost (M). Samples were air-dried and
ground to 0.5 mm. Table 1 presents the principal
characteristics of the mixtures at the different sam-
pling times.
The soil used for the incubation experiments was a
calcareous silt loam, classi®ed as a Typic Calciorthid
(American Soil Taxonomy; Soil Survey Staff, 1987).
Its main characteristics were 17.6% clay, 52.1% silt,
30.3% sand, 46% CaCO3, 21.3% water holding capa-
city, 7.8 pH, 0.036 S mÿ1 electrical conductivity,
0.76% organic matter, 0.46% organic C, 0.04% total
N, a C/N ratio of 11.2, and a cation exchange capacity
of 12.3 cmolc kgÿ1.
2.2. Analytical methods
The soil and composting samples were analyzed for
pH in H2O suspensions (1:10 w/v in composting
samples, saturated paste in soil). Electrical conductiv-
ity (EC) was measured in a 1:5 and 1:10 water extract
for soil and composting samples, respectively. The
organic matter (OM) of the composting samples was
estimated by loss on ignition at 4308C for 24 h
(Navarro et al., 1993) and that of the soil was calcu-
lated from the organic carbon content multiplied by
1.72. Total nitrogen and total organic carbon (TOC)
were determined by automatic microanalysis (Navarro
et al., 1991). The cation exchange capacity of the soil
was determined with BaCl2-triethanolamine following
the method of Carpena et al. (1972). The lignin
concentration of the composting samples was deter-
mined by the American National Standard methods
(ANSI and ASTM, 1977). All analyses were made at
least in duplicate. Losses of organic matter during
composting were calculated from the initial (X1) and
®nal (X2) ash contents, according to the following
equation (Viel et al., 1987),
OMÿÿÿ loss�%�� 100ÿ 100�X1�100ÿ X2��=�X2�100ÿ X1��
2.3. Incubation procedure
Carbon mineralization was studied in an aerobic
incubation experiment with soil. Ten gram samples of
soil (<2 mm) were thoroughly mixed with 200 mg
portions of the composting samples (equivalent to
48 t haÿ1) and placed in 100 ml incubation vessels.
Soil controls were run without any amendment. Dis-
tilled water was added to the soil-compost mixtures
and the soil samples (2 and 1.8 ml, respectively) in
order to bring their moisture content to 60% of their
water-holding capacity. The CO2 evolved was trapped
in 10 ml of 0.1 M NaOH in small tubes, which were
placed on top of the soil in the incubation vessels. The
incubation vessels were closed, but to maintain ade-
quate O2 levels they were opened for several minutes
every day during the ®rst week, on alternate days
during the second week and every 3 days during the
M.P. Bernal et al. / Agriculture, Ecosystems and Environment 69 (1998) 175±189 177

following weeks. Empty vessels were used as blanks.
After 1, 2, 3, 6, 10, 14 days and then weekly to 70 days,
the CO2 evolved was measured by titration of the
NaOH solution with 0.1 M HCl in an excess of BaCl2.
The incubation was carried out in a dark, temperature-
controlled incubator at 288C for 70 days.
2.4. Statistical analysis
The amount of C evolved as carbon dioxide
from the composting samples was calculated by sub-
tracting the amount produced by the control soil from
that produced by the waste-treated soil and expressed
as a percentage of the TOC concentration of the
composting samples, assuming no priming effect in
the soil (Sinha et al., 1977). Data concerning CO2±C
evolution of the composting samples were ®tted to
kinetic functions by a non-linear least-square pro-
cedure (Marquardt±Levenberg algorithm), using the
SigmaPlot computer programme. The kinetic func-
tions used were: Combined two ®rst-order kinetic
model,
Table 1
Chemical analysis of the organic wastes at different composting times
Composting
samples
pH EC (S mÿ1) OM (%) TOC
(g kgÿ1)
Total N
(g kgÿ1)
C/N Lignin(%) OM-loss
(% initial OM)
Mixture SC: sewage sludge�cotton waste
SC-I 7.6 0.39 81.5 438.6 20.8 21.1 29.4 0.0
SC-T 7.1 0.41 71.3 398.2 28.2 14.2 36.3 43.6
SC-E 8.0 0.50 64.9 359.8 36.5 9.9 37.9 58.0
SC-M 7.3 0.67 64.8 355.5 37.9 9.4 38.5 58.2
Mixture PCO: poultry manure�cotton waste�olive-mill wastewater
PCO-I 7.5 0.52 78.4 407.2 27.1 15.0 26.0 0.0
PCO-T 8.0 0.65 69.6 359.5 31.2 11.5 30.7 36.9
PCO-E 7.8 0.78 63.1 334.3 34.6 9.7 31.7 52.9
PCO-M 7.4 0.83 62.9 337.3 34.7 9.7 31.9 53.3
Mixture SCO: sewage sludge�cotton waste�olive-mill wastewater
SCO-I 7.1 0.44 80.7 405.4 19.2 21.1 23.3 0.0
SCO-T 7.8 0.60 61.5 333.1 30.4 11.0 32.0 61.9
SCO-E 7.6 0.73 56.3 300.8 29.9 10.1 31.3 69.2
SCO-M 7.8 0.77 56.4 293.7 31.1 9.4 31.8 69.1
Mixture SM: sewage sludge�maize straw
SM-I 5.6 0.77 81.0 412.7 37.5 11.0 19.1 0.0
SM-T 6.4 0.81 71.1 368.6 40.3 9.1 18.1 42.3
SM-E 6.9 0.83 55.8 305.3 31.8 9.6 15.4 70.4
SM-M 7.1 0.75 53.3 272.8 31.6 8.6 15.2 73.2
Mixture SMO: sewage sludge�maize straw�olive-mill wastewater
SMO-I 6.1 0.42 89.6 472.0 15.2 31.1 27.3 0.0
SMO-T 7.7 0.57 83.0 408.8 22.2 18.4 27.6 43.2
SMO-E 7.4 0.76 79.7 415.4 30.0 13.8 29.1 54.7
SMO-M 7.5 0.84 74.8 394.3 33.3 11.8 30.9 65.5
Mixture PPB: pig slurry�poultry manure�sweet sorghum bagasse
PPB-I 7.7 0.31 79.8 403.7 16.8 24.1 n.d 0.0
PPB-E 6.9 0.54 64.3 335.0 29.7 11.3 n.d 54.4
PPB-M 8.6 0.43 59.8 303.3 27.6 11.0 n.d 62.3
Mixture RB: city refuse�sweet sorghum bagasse
RB-I 6.7 0.46 62.5 321.4 18.2 19.5 13.2 0.0
RB-T 7.5 0.41 45.9 232.8 18.6 13.6 12.6 49.1
RB-E 7.9 0.50 28.1 161.7 17.4 9.3 12.1 76.6
RB-M 8.0 0.53 30.1 156.7 20.0 7.8 13.2 74.2
EC, electrical conductivity.
OM, organic matter.
TOC, total organic carbon.
n.d., not determined.
178 M.P. Bernal et al. / Agriculture, Ecosystems and Environment 69 (1998) 175±189

Cm � CR�1ÿ exp�ÿKRt�� � CS�1ÿ exp�ÿKSt��Combined ®rst- and zero-order kinetic model,
Cm � CR�1ÿ exp�ÿKRt�� � CSKSt
where Cm is the carbon mineralized (% of TOC) at
time t (days), CR and CS are the rapid and slow poten-
tially mineralizable carbon (% of TOC), and KR and
KS are the rapid and slow rate constants (dayÿ1). The
standard deviation of the parameters, the residual
mean square (RMS) and the F-values of the curve ®ts
were calculated. The model which gave a randomized
distribution of the residuals together with the lowest
value of RMS and high F-value was chosen as the best
®t (Little and Hills, 1975). Analysis of variance and
least signi®cant difference (LSD) at P<0.05 were used
to compare the different treatments as regards C
mineralization and C lost during C stabilization.
3. Results and discussion
3.1. Carbon mineralization
During the incubation period, the maximum C
mineralization rate in the composted samples occurred
during the ®rst day of incubation (with the exception
of sample SM-T). In the untransformed initial samples
(I) the maximum occurred between days 1 and 3 of
incubation (Fig. 1). This was because of the presence
of a high concentration of easily degradable organic
carbon in the wastes, which led to a large growth in
the microbial population in the soil. Some samples
showed a second maximum in the C mineralization
rate which occurred because of the great variety of
compounds they contained with different degrees of
degradability. After the initially high mineralization
rate there was a gradual decrease in all cases before it
became fairly constant (Fig. 1). The C mineralization
rate became constant earlier when samples in a more
transformed state (end of active phase and mature
samples) were used. The rate at the end of the incuba-
tion period was highest with the initial samples (37±
23 mg C kgÿ1 dayÿ1) and least with the mature
samples (24±12 mg C kgÿ1 dayÿ1, the greatest ®gure
being recorded in SMO-M). All rates were higher than
in the control soil (7 mg C kgÿ1 dayÿ1).
The total amount of CO2±C released after 70 days
of incubation from soil amended with the initial
organic waste mixtures ranged from 8314 to
3858 mg kgÿ1 (Table 2), decreasing in the order:
SM>SMO>SCO>PCO�SC�RB>PPB, according to
the LSD. For the samples taken at the thermophilic
stage, the C mineralized after 70 days ranged from
6324 to 1534 mg kgÿ1, statistically decreasing in the
order: SM>SMO>PCO�SC>SCO>RB. The amount
of C mineralized decreased in the samples taken after
the biooxidative phase (from 4073 to 1268 mg kgÿ1)
in the order: SMO>SM>PCO�SC>PPB�SCO>RB
(Table 2). In the mature samples the range was nar-
rower (from 3280 to 1368 mg kgÿ1), with less sig-
ni®cant differences between the mixtures, according
to LSD: SMO>PCO�SC�SM�PPB�SCO>RB. Of
all the samples taken after the maturation period, the
SMO-M showed the greatest degree of C mineraliza-
tion. This sample also showed an abnormally high rate
of CO2 production for a mature compost (34 mg C
kgÿ1 day ÿ1), because of its low degree of maturation
after composting (Bernal et al., 1998b).
The percentage of TOC mineralized from the initial
samples (I) after 30 days of incubation in soil (Fig. 2)
fell within the range expressed by Ajwa and Tabatabai
(1994) for plant materials, animal manure and sewage
sludge (21±62% of TOC). The highest proportion of C
mineralized after 70 days of incubation (Cm) was
always recorded in the untransformed samples (I).
Note the extremely high value obtained with the
SM-I sample (93.2% of TOC) and RB-I sample
(80.1% of TOC) (Table 2). These mixtures were pre-
pared, respectively, with sewage sludge and city refuse
as the principal constituents, and so both had a high
proportion of organic compounds easily degradable in
the soil. These labile compounds were also rapidly
degraded during composting, as is shown by the high
loss of organic matter in both piles (Table 1). A high
degree of organic matter degradation was also found
during the composting of city refuse and sewage
sludge by Iglesias-JimeÂnez and PeÂrez-GarcõÂa (1992).
The initial sample of the PPB mixture, which was
prepared with a high proportion of sweet sorghum
bagasse, showed the lowest degree of C mineralization
after 70 days (Table 2), because bagasse is very
resistant to decomposition (Bernal et al., 1996). The
Cm values of the other four initial mixtures ranged
from 62.3% to 70.3% of TOC. The values for PCO-I,
SCO-I and SMO-I did not differ statistically, accord-
ing to LSD. C mineralization was lower in SC-I than in
M.P. Bernal et al. / Agriculture, Ecosystems and Environment 69 (1998) 175±189 179

SCO-I, perhaps because of the presence in the latter of
soluble organic compounds, particularly sugars and
organic acids, in the olive-mill wastewater (Balis,
1994), which are easily mineralizable (Saviozzi et
al., 1993).
The C mineralized after 70 days (Cm) decreased
with the time of composting in all mixtures (Table 2).
However, no signi®cant differences were found, acc-
ording to LSD, between samples taken at the end of
the active phase and those taken after maturation of the
RB mixture. The lowest Cm values were observed in
the mature composts, where they ranged from 9.0%
to 37.9% of TOC, the highest value being found in
SMO-M. This means that this particular compost
had reached a lower degree of maturity and stability
than the others after the period allowed for matura-
tion, even though it showed the highest degree of
degradation during the maturation phase (more than
10% of OM, Table 1). This was because the maize
straw degraded slowly and incompletely during the
Fig. 1. Rate of CO2±C evolution during the incubation of soil (control) and soil amended with samples from SC (a) and PCO (b) mixtures at
different composting times. Similar CO2±C evolution dynamics occurred for the rest of the composting samples studied. Very small error are
not depicted since error bars remained within the symbol.
180 M.P. Bernal et al. / Agriculture, Ecosystems and Environment 69 (1998) 175±189

Table 2
Carbon mineralized from soil amended with several waste mixtures after 70 days of incubation (mg C kgÿ1 soil), and the proportion
mineralized from the different waste mixtures (% of waste TOC) (see Section 2)
Mixtures Cm (mg C kgÿ1 soil) Cm (% of waste TOC)
I T E M I T E M
SC 6012 d 3714 g 2322 ij 2121 jk 62.3 d 37.7 gh 22.4 jk 19.8 k
(342) (319) (349) (300) (0.34) (0.32) (0.35) (0.25)
PCO 6050 d 3848 g 2480 ij 2215 ij 68.2 c 43.8 f 28.6 i 24.3 ij
(224) (224) (34) (9) (3.30) (0.89) (0.52) (0.10)
SCO 6430 c 2467 i 1860 kl 1692 lm 68.9c 20.7 k 13.2 l 11.1 lm
(85) (222) (105) (14) (1.07) (2.74) (1.29) (0.18)
SM 8314 a 6324 cd 3067 h 1997 kl 93.2 a 77.4 b 40.1 g 23.7 ijk
(86) (140) (235) (69) (1.28) (2.33) (4.71) (1.45)
SMO 7116 b 4914 e 4073 f 3533 h 70.3 c 53.0 e 42.6 g 37.9 h
(117) (95) (36) (40) (1.55) (0.72) (0.62) (0.74)
PPB 3858 g n.d. 1977 kl 1847 kl 38.0 h n.d. 14.7 l 13.1 l
(131) (62) (82) (1.62) (0.77) (1.02)
RB 5939 d 5935 mn 1268 n 1368 n 80.1 b 11.6 lm 7.4 lm 9.0 m
(217) (58) (76) (78) (3.38) (0.91) (1.18) (1.21)
Factors Analysis of variance Analysis of variance
Mixture P<0.001 LSD�157.2 P<0.001 LSD�2.18
Stage of compost-
ing
P<0.001 LSD�128.4 P<0.001 LSD�1.78
Interaction P<0.001 LSD�314.4 P<0.001 LSD�4.36
Standard deviation in brackets (n�3).
n.d., not determined.
Values followed by the same letter are not statistically different at P<0.05, according to the least significant difference (LSD).
Fig. 2. Cumulative CO2±C mineralization of samples at different stages of the composting process of the waste mixtures: SC (a), PCO (b),
SCO (c), SM (d), SMO (e), PPB (f) and RB (g). Symbols are experimental data (n�3) and lines represent the curve-fitting result of the
combined kinetic model (Table 3). Very small error are not depicted since error bars remained within the symbol.
M.P. Bernal et al. / Agriculture, Ecosystems and Environment 69 (1998) 175±189 181

composting (Paredes et al., 1996) as a result of its large
particle size. Part of the straw would, therefore, be
physically inaccessible to the microorganisms and
only break down later in the soil after the samples
had been ground for the incubation experiment. Ajwa
and Tabatabai (1994) and Recous et al. (1995) found
that the carbon from maize straw mineralizes more
slowly in soils, than that from other plant wastes,
suggesting that the readily decomposable organic-C
fraction in maize is smaller than in other plant materi-
als. With the exception of SMO-M, the mineralized C
values did not reach 25% of TOC after 70 days of
incubation in any of the mature samples. These experi-
mental values were similar to those obtained by Serra-
Wittling et al. (1995) using a city refuse compost, but
higher than those described by Cheneby and Nicolar-
dot (1992) for a poplar bark-poultry dropping com-
post.
3.2. Mineralization kinetic
The use of kinetic models to describe the carbon
mineralization process makes it possible to ascer-
tain the potentially mineralizable C fraction and the
Fig. 2. (Continued)
182 M.P. Bernal et al. / Agriculture, Ecosystems and Environment 69 (1998) 175±189

mineralization rate. Although the ®rst-order kinetic
model is the most widely used in C mineralization
studies, the ®tting of the present results to this model
resulted in high residual mean square (RMS) values
and the distribution of the deviations was not rando-
mized in any composting sample (data not shown).
The systematic grouping of deviations led the authors
to believe that another equation would describe the
mineralization process better (Little and Hills, 1975).
Indeed, the C mineralization process observed was
best described by combined two step kinetic equa-
tions, which suggests that the organic carbon content
of the wastes was made up of two fractions of different
degree of biodegradability: labile organic compounds
which were rapidly mineralizable in soil, and com-
pounds which were resistant to microbial attack
and which broke down slowly during a second step.
The rapid step always followed a ®rst-order kinetic
model (Table 3), because the presence of available
organic C led to a substantial increase in the soil's
microbial activity. The slow step followed a zero-order
kinetic model in most of the samples studied, except
Fig. 2. (Continued)
M.P. Bernal et al. / Agriculture, Ecosystems and Environment 69 (1998) 175±189 183

SM-I and SMO-I, when both steps ®tted a ®rst-order
kinetic.
The values of rapidly mineralizable C (CR) pointed
to the existence of a large easily degradable C fraction
in the untransformed I samples. The CR values of
all the mixtures fell as the composting progressed
(Table 3), the greatest differences being between those
of the initial samples (I) and those taken during the
thermophilic phase (T). The smallest differences in
both CR and CS values were found between the
samples taken at the end of the active phase (E)
and those which had undergone a period of maturation
(M). The rate constant values (KR) were high in all E
and M samples, which indicated that the ®rst step of C
mineralization was very fast. During a second miner-
alization step rates were practically parallel in both
E and M samples of each mixture, and scant differ-
ences were observed between the values of KS. This
may indicate that both samples had organic com-
pounds of similar decomposability. Therefore, the
Fig. 2. (Continued)
184 M.P. Bernal et al. / Agriculture, Ecosystems and Environment 69 (1998) 175±189

main difference in the mineralization kinetic para-
meters of E and M were found in the CR values
referring to the ®rst days of incubation (Fig. 2).
The rate constants corresponding to the ®rst step
(KR) were generally very high, which re¯ected the
short time required to break down the most labile C
fraction (half life of CR, t(1/2)�0.62±11.63 days).
These KR values were higher than those obtained
by Gale and Gilmour (1986) and Ajwa and Tabatabai
(1994) for the C mineralization of different wastes,
and similar to those calculated by Bernal and Kirch-
mann (1992) for untreated and aerobically and anae-
robically treated pig manure (0.131±0.386 dayÿ1).
Most of the TOC of the mixtures was slowly miner-
alizable (CS), this slow step predominating in the
mineralization of E and M samples in all mixtures
with CS>88% (Table 3). According to the calculated
rate constant (KS), this step was very slow in all
samples. Except in the cases of SM-I and SMO-I,
which ®tted a combined two ®rst-order kinetic equa-
tion, the values for KS were always less than 0.0082
dayÿ1 (Table 3). These results of KS were close to
Table 3
Parameter values of the combined first-zero-order equation model, residual mean square (RMS) and F-values for carbon mineralization of the
mixtures at different times of the composting process
Composting samples CR (% of TOC) KR (dayÿ1) CS (% of TOC) KS (dayÿ1) RMS F
Mixture SC: sewage sludge�cotton waste
SC-I 38.2 (1.0) 0.115 (0.005) 61.8 (1.7) 0.0055 (0.00022) 0.433 19 628
SC-T 22.5 (1.1) 0.085 (0.006) 77.5 (6.6) 0.0029 (0.00025) 0.213 13 996
SC-E 8.4 (0.6) 0.166 (0.024) 91.6 (6.5) 0.0023 (0.00012) 0.275 3508
SC-M 6.5 (0.7) 0.128 (0.027) 93.6 (10.8) 0.0020 (0.00014) 0.266 2538
Mixture PCO: poultry manure�cotton waste�olive-mill wastewater
PCO-I 30.5 (1.4) 0.130 (0.011) 69.6 (3.2) 0.0081 (0.00023) 1.017 9146
PCO-T 15.3 (1.1) 0.151 (0.022) 84.7 (6.0) 0.0050 (0.00019) 0.799 4436
PCO-E 5.5 (0.1) 0.695 (0.060) 94.5 (2.2) 0.0031 (0.00003) 0.050 26 563
PCO-M 5.7 (0.3) 0.462 (0.069) 94.3 (4.5) 0.0029 (0.00006) 0.175 5871
Mixture SCO: sewage sludge�cotton waste�olive-mill wastewater
SCO-I a 48.9 (2.2) 0.120 (0.009) 51.1 (2.3) 0.0057 (0.00058) 1.966 5193
SCO-T 9.8 (0.2) 0.202 (0.010) 90.2 (1.9) 0.0018 (0.00004) 0.043 21 194
SCO-E 4.4 (0.1) 0.351 (0.025) 95.6 (2.4) 0.0013 (0.00002) 0.020 16 002
SCO-M 2.9 (0.1) 0.418 (0.035) 97.1 (2.7) 0.0012 (0.00002) 0.013 16 143
Mixture SM: sewage sludge�maize straw
SM-I b 32.9 (1.2) 0.317 (0.019) 67.1 (2.5) 0.0319 (0.00066) 0.460 45 740
SM-T 46.3 (1.9) 0.147 (0.012) 53.7 (2.2) 0.0088 (0.00040) 2.251 6228
SM-E 10.6 (0.8) 0.250 (0.047) 89.5 (6.7) 0.0050 (0.00015) 0.876 3309
SM-M 3.6 (0.2) 0.795 (0.144) 96.5 (4.5) 0.0030 (0.00004) 0.084 10 489
Mixture SMO: sewage sludge�maize straw�olive-mill wastewater
SMO-I b 20.6 (1.5) 0.260 (0.036) 79.4 (5.6) 0.0148 (0.00049) 0.751 13 831
SMO-T 20.7 (3.7) 0.060 (0.012) 79.3 (14.0) 0.0060 (0.00054) 0.592 8148
SMO-E 11.6 (1.0) 0.132 (0.022) 88.4 (7.8) 0.0051 (0.00017) 0.324 9444
SMO-M 8.6 (1.2) 0.097 (0.021) 91.4 (12.6) 0.0046 (0.00017) 0.205 10 945
Mixture PPB: pig slurry�poultry manure�sweet sorghum bagasse
PPB-I 22.2 (1.6) 0.068 (0.003) 77.8 (3.1) 0.0029 (0.00015) 0.060 46 152
PPB-E 5.3 (0.3) 0.314 (0.042) 94.7 (4.7) 0.0015 (0.00006) 0.107 3962
PPB-M 3.3 (0.1) 0.395 (0.042) 96.7 (3.5) 0.0015 (0.00003) 0.027 11 104
Mixture RB: city refuse�sweet sorghum bagasse
RB-I 55.5 (0.9) 0.153 (0.005) 44.5 (0.7) 0.0082 (0.00026) 0.547 29 471
RB-T 5.4 (0.4) 0.170 (0.024) 94.6 (6.4) 0.0010 (0.00007) 0.099 2848
RB-E 2.9 (0.1) 0.414 (0.060) 97.2 (4.7) 0.0007 (0.00003) 0.037 3095
RB-M 2.8 (0.1) 0.371 (0.044) 97.3 (4.0) 0.0010 (0.00003) 0.023 6526
Standard deviation in brackets (n�14).a n�15b Combined two first-order kinetic equation.
M.P. Bernal et al. / Agriculture, Ecosystems and Environment 69 (1998) 175±189 185

those calculated for the C mineralization of poultry
litter with pine shavings or wheat straw mixtures (Gale
and Gilmour, 1986), but higher than those described
for fresh wastes (Saviozzi et al., 1993; Ajwa and
Tabatabai, 1994), although Saviozzi et al. (1993) used
a different kinetic model. The mean value of KS from
the mature samples (except SMO-M) was 0.0019
dayÿ1, pointing to a t(1/2)�263 days to mineralized
one-half of CS.
3.3. Carbon conservation
To evaluate the effect of different composting stages
on organic carbon conservation, both the mineraliza-
tion which occurs during the composting process and
that occurring after addition to the soil should be
compared, and expressed as a percentage of the initial
TOC concentration of the mixtures. The higher sta-
bility of mature composts in soil suggests that these
materials will increase soil organic matter levels to a
greater extent than untransformed waste mixtures.
However, the amount of material remaining after
composting has also to be taken into account. Because
of mass losses during composting, changes in con-
centration in decomposed materials (Table 1) do not
re¯ect changes in residual amounts. Table 4 gives the
total losses of C during waste composting, in which
the length of each composting phase in the different
mixtures is also expressed. Maximum C degradation
occurred during the thermophilic phase in all mix-
tures, when almost 60% of initial C was mineralized in
the SCO mixture, but only 37.3% of initial C in PCO.
At the end of the active phase C mineralization ranged
between 48.4% of initial C in PPB and 73.8% of initial
C in RB. The lowest C losses occurred during the
maturation phase of composting, the highest value
recorded being 10.7% of initial C in SMO, whereas no
mineralization took place in PCO. Thus, the organic C
lost during the whole composting process ranged from
51.9% of initial C in PCO to 74.2% of initial C in RB.
Because the four samples taken from each mixture
represented different composting time before addition
to the soil, differences in the total decomposition time
had to be equalised in order to compare total C losses
occurring during composting and those occurring
during incubation with soil. Carbon mineralization
in soil was calculated by means of the combined C
mineralization kinetic equations (Table 3) the total
decomposition time (in composting�in soil) being
the same in all samples from each mixture (Table 4).
These C losses taking place in soil were multiplied by
the percentage of C remaining after composting in
order to express them as a percentage of the initial C of
each mixture (Table 4). The C losses in soil when the
untransformed samples were used, were generally
higher than that which had occurred during compost-
ing (except in the case of PPB). The degradation which
took place during composting was therefore less than
that occurring during incubation with soil, because
during the former process the organic matter had also
been stabilizated and humi®ed (Senesi, 1989).
The greatest losses in initial C as measured over the
total decomposition time occurred in the untrans-
formed wastes (I) (except in the case of PPB), and
were statistically different from the losses occurring in
the rest of the samples. The smallest differences in C
loss were found between the E and M samples in each
mixture, and were statistically signi®cant in all the
samples except SCO. The lowest C loss always
occurred in the M samples, according to LSD. There-
fore, composting is the most ef®cient way of stabiliz-
ing the organic C of wastes compared with the
incubation with soil.
When the decomposition time of the wastes was
extended for another 70 days in soil, most of the
untransformed samples (I) showed results close to
100% initial C or larger, which indicated priming
effect in soil. The initial assumption was that total
carbon dioxide released from amended soil should
consist of that CO2 produced from unamended soil as
a result of native soil organic matter oxidation, plus
that resulting from catabolism of the organic waste.
This apparently was not valid when the untransformed
samples were used, because the degradation of the
native soil organic matter was enhanced by the exo-
genously supplied substrate. Signi®cantly higher
values of C loss were found in T samples than in I
samples of the SM and SMO mixtures. The T samples
still contained a great proportion of the original labile
organic matter because they had not been stabilized
during the thermophilic phase of composting. Their
addition to soil leads to a growth of the soil's microbial
population, which would strongly mineralize the
organic C. When mature composts were added to
the soil, a slow C mineralization process started up
again because of the growth of the soil's microbial
186 M.P. Bernal et al. / Agriculture, Ecosystems and Environment 69 (1998) 175±189
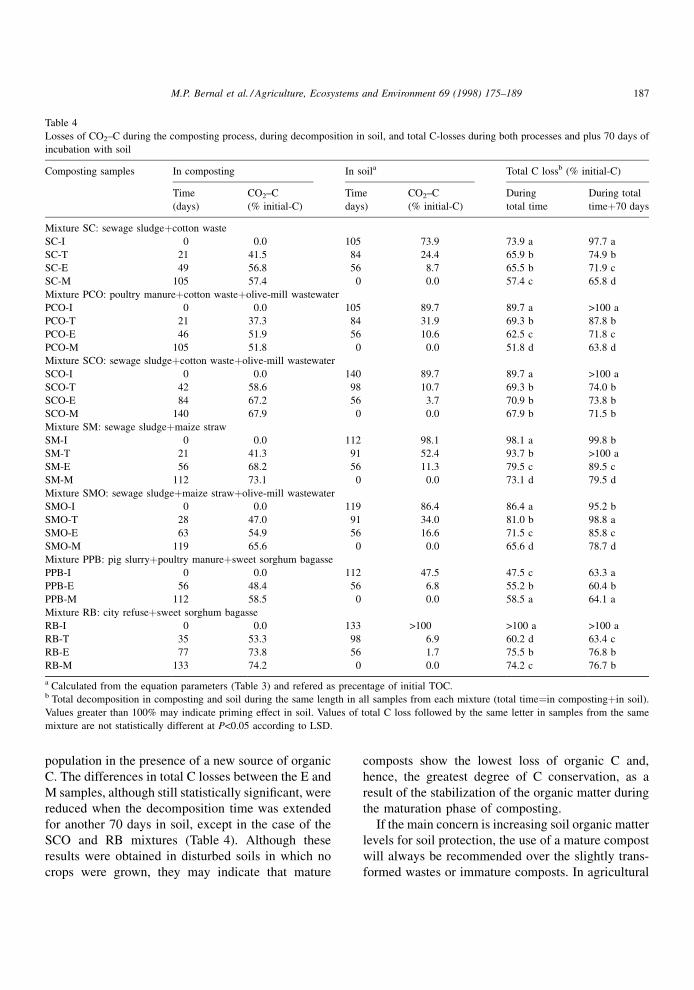
population in the presence of a new source of organic
C. The differences in total C losses between the E and
M samples, although still statistically signi®cant, were
reduced when the decomposition time was extended
for another 70 days in soil, except in the case of the
SCO and RB mixtures (Table 4). Although these
results were obtained in disturbed soils in which no
crops were grown, they may indicate that mature
composts show the lowest loss of organic C and,
hence, the greatest degree of C conservation, as a
result of the stabilization of the organic matter during
the maturation phase of composting.
If the main concern is increasing soil organic matter
levels for soil protection, the use of a mature compost
will always be recommended over the slightly trans-
formed wastes or immature composts. In agricultural
Table 4
Losses of CO2±C during the composting process, during decomposition in soil, and total C-losses during both processes and plus 70 days of
incubation with soil
Composting samples In composting In soila Total C lossb (% initial-C)
Time
(days)
CO2±C
(% initial-C)
Time
days)
CO2±C
(% initial-C)
During
total time
During total
time�70 days
Mixture SC: sewage sludge�cotton waste
SC-I 0 0.0 105 73.9 73.9 a 97.7 a
SC-T 21 41.5 84 24.4 65.9 b 74.9 b
SC-E 49 56.8 56 8.7 65.5 b 71.9 c
SC-M 105 57.4 0 0.0 57.4 c 65.8 d
Mixture PCO: poultry manure�cotton waste�olive-mill wastewater
PCO-I 0 0.0 105 89.7 89.7 a >100 a
PCO-T 21 37.3 84 31.9 69.3 b 87.8 b
PCO-E 46 51.9 56 10.6 62.5 c 71.8 c
PCO-M 105 51.8 0 0.0 51.8 d 63.8 d
Mixture SCO: sewage sludge�cotton waste�olive-mill wastewater
SCO-I 0 0.0 140 89.7 89.7 a >100 a
SCO-T 42 58.6 98 10.7 69.3 b 74.0 b
SCO-E 84 67.2 56 3.7 70.9 b 73.8 b
SCO-M 140 67.9 0 0.0 67.9 b 71.5 b
Mixture SM: sewage sludge�maize straw
SM-I 0 0.0 112 98.1 98.1 a 99.8 b
SM-T 21 41.3 91 52.4 93.7 b >100 a
SM-E 56 68.2 56 11.3 79.5 c 89.5 c
SM-M 112 73.1 0 0.0 73.1 d 79.5 d
Mixture SMO: sewage sludge�maize straw�olive-mill wastewater
SMO-I 0 0.0 119 86.4 86.4 a 95.2 b
SMO-T 28 47.0 91 34.0 81.0 b 98.8 a
SMO-E 63 54.9 56 16.6 71.5 c 85.8 c
SMO-M 119 65.6 0 0.0 65.6 d 78.7 d
Mixture PPB: pig slurry�poultry manure�sweet sorghum bagasse
PPB-I 0 0.0 112 47.5 47.5 c 63.3 a
PPB-E 56 48.4 56 6.8 55.2 b 60.4 b
PPB-M 112 58.5 0 0.0 58.5 a 64.1 a
Mixture RB: city refuse�sweet sorghum bagasse
RB-I 0 0.0 133 >100 >100 a >100 a
RB-T 35 53.3 98 6.9 60.2 d 63.4 c
RB-E 77 73.8 56 1.7 75.5 b 76.8 b
RB-M 133 74.2 0 0.0 74.2 c 76.7 b
a Calculated from the equation parameters (Table 3) and refered as precentage of initial TOC.b Total decomposition in composting and soil during the same length in all samples from each mixture (total time�in composting�in soil).
Values greater than 100% may indicate priming effect in soil. Values of total C loss followed by the same letter in samples from the same
mixture are not statistically different at P<0.05 according to LSD.
M.P. Bernal et al. / Agriculture, Ecosystems and Environment 69 (1998) 175±189 187

soils the input of organic matter through roots and crop
residues may be an important effect on soil organic
matter. Then the nitrogen supplied should have a
relevant in¯uence on organic C conservation in agri-
culture. The animal manures have been traditionally
used in soils as the fresh material, because of their high
concentration in nitrogen. If composted without a
bulking agent, their carbon stability will be improved,
but their available nitrogen may decreased (Tyson and
Cabrera, 1993) and high amount of N lost through
NH3-volatilization. From the agricultural point of
view, manures can be directly applied to soil and a
maximum bene®t can be obtained from nitrogen, but
sowing should be delayed to allow the soil micro-
organisms to degrade the labile organic matter and to
avoid any negative effect to plants.
In contrast, immature composts have been demon-
strated to cause N-immobilization in soil (Sims, 1990;
Beloso et al., 1993; Bernal et al., 1998a), and matura-
tion improves the fertilizer value of composts (Bernal
et al., 1998a). The initial material for composting, as
those described here, is a mixture of two or more
wastes in order to obtain an adequate C/N ratio for
composting (about 25, De Bertoldi et al., 1983), which
is greater than the values found in animal manures.
Then for the agricultural use of composts it is neces-
sary to ensure a good degree of compost maturity if the
maximum bene®t for C and N recycling have to be
ensured through composting.
4. Conclusions
The lowest degree of C mineralization in soil
occurred in composts which had undergone a matura-
tion phase. Values of C mineralized higher than 25%
of TOC after 70 days of incubation may indicate a low
degree of compost maturity. The composts made from
slowly degradable wastes, such as maize straw, may
show a high degree of C mineralization in soil because
longer composting times may required for a good
degree of maturation and microbial stability to be
achieved.
The organic C of the wastes is constituted by two
fractions of different degrees of biodegradability. The
labile organic compounds mineralize quickly in soil,
following a ®rst-order kinetic function, and are
reduced during composting. However, the resistant
C fraction mineralizes slowly in soil and usually
follows a zero-order kinetic function, regardless of
the length of composting time. More than 88% of TOC
in the mature composts was slowly mineralizable with
a rate constant ranging from 0.0030 to 0.0010 dayÿ1.
There were only small differences in the slowly
mineralizable C and the rate constant (KS) between
samples taken at the end of the active phase and those
taken after maturation, indicating that the stabilized
organic C compounds resulting from both stages of
composting are of similar microbiological degradabil-
ity.
As regards organic C conservation, the composting
of organic wastes before addition to soil is a more
effective way of reducing CO2±C losses than the direct
application of wastes which are either untreated, or
slightly transformed during the thermophilic phase of
composting. To protect the soil and conserve the
organic carbon content, mature composts with a sta-
bilized organic C are preferable to non-transformed
wastes, which may promote degradation of native soil
organic matter.
Acknowledgements
The authors wish to thank Dr. J.L. Gonzalez-Andu-
jar for his statistical advice, and Mr. P. Thomas for the
English revision. Research was carried out in the
framework of EC contract N8 EVWA-CT 92-0006.
References
Ajwa, H.A., Tabatabai, M.A., 1994. Decomposition of different
organic materials in soils. Biol. Fertil. Soils 18, 175±182.
American National Standards Institute and American Society for
Testing and Materials, 1977. Standard test method for lignin in
wood D 1106-56. American National Standard.
Balis, C., 1994. Enrichment of olive oil mill wastewaters through
microbiological processing. In: Landi, E., Dumontet, S. (Eds.),
Proc. VII Inter. Congress L'Approccio Integrato della Moderna
Biologia: Uomo, Territorio, Ambiente. Vieste, vol. 1, pp. 99±
115.
Beloso, M.C., Villar, M.C., Cabaneiro, A., Carballas, M.,
GonzaÂlez-Prieto, S.J., Carballas, T., 1993. Carbon and nitrogen
mineralization in an acid soil fertilized with composted urban
refuse. Biores. Technol. 45, 123±129.
Bernal, M.P., Kirchmann, H., 1992. Carbon and nitrogen miner-
alization and ammonia volatilization from fresh, aerobically
and anaerobically treated pig manure during incubation with
soil. Biol. Fertil. Soils 13, 135±141.
188 M.P. Bernal et al. / Agriculture, Ecosystems and Environment 69 (1998) 175±189

Bernal, M.P., Navarro, A.F., Roig, A., Cegarra, J., GarcõÂa, D., 1996.
Carbon and nitrogen transformation during composting of
sweet sorghum bagasse. Biol. Fertil. Soils 22, 141±148.
Bernal, M.P., Navarro, A.F., SaÂnchez-Monedero, M.A., Roig, A.,
Cegarra, J., 1998a. Influence of sewage sludge compost
stability and maturity on carbon and nitrogen mineralization
in soil. Soil Biol. Biochem. 30, 305±313.
Bernal, M.P., Paredes, C., SaÂnchez-Monedero, M.A., Cegarra, J.,
1998b. Maturity and stability parameters of compost prepared
with a wide range of organic wastes. Biores. Technol. 63, 91±
99.
Boyle, M., Paul, E.A., 1989. Carbon and nitrogen mineralization
kinetics in soil previously amended with sewage sludge. Soil
Sci. Soc. Am. J. 53, 99±103.
Carpena, O., Lax, A., Vahtras, K., 1972. Determination of
exchangeable cations in calcareous soils. Soil Sci. 113, 194±
199.
Cheneby, D., Nicolardot, B., 1992. Use of mineralization kinetics
to estimate the agricultural value of organic fertilizers. In:
Jackson, D.V., Merillot, J.M., L'Hermite, P. (Eds.) Composting
and Compost Quality Assurance Criteria. Commission of the
European Community, Luxembourg, pp. 188±195.
De Bertoldi, M., Vallini, G., Pera, A., 1983. The biology of
composting: a review. Waste Manag. Res. 1, 157±176.
Finstein, M.S., Miller, F.C., MacGregor, S.T., Psarianos, K.M.,
1985. The Rutgers strategy for composting: Process, design and
control. EPA project summary (EPA/600/S2-85/059), US
Environmental Protection Agency, Washington, DC.
Gale, P.M., Gilmour, J.T., 1986. Carbon and nitrogen mineraliza-
tion kinetics for poultry litter. J. Environ. Qual. 15, 423±426.
Hoitink, H.A.J., Keener, H.M., 1993. Science and Engineering of
Composting: Design, Environmental, Microbiological and
Utilization Aspects. The Ohio State University, Renaissance
Publications, Ohio, p. 728.
Iglesias-JimeÂnez, E., PeÂrez-GarcõÂa, V., 1992. Composting of
domestic refuse and sewage sludge. II. Evolution of carbon
and some humification indexes. Resour. Conserv. Recy. 6, 243±
257.
Kirchmann, H., Witter, E., 1992. Composition of fresh, aerobic and
anaerobic farm animal dungs. Biores. Technol. 40, 137±142.
Little, T.M., Hills, F.J., 1975. Statistics Methods in Agricultural
Research. 2nd ed., University of California, Davis, p. 242.
Marstorp, H., 1996. Influence of soluble carbohydrates, free amino
acids, and protein content on the decomposition of Lolium
multiflorum shoots. Biol. Fertil. Soils 21, 257±263.
Marstorp, H., Kirchmann, H., 1991. Carbon and nitrogen miner-
alization and crop uptake of nitrogen from six green manure
legumes decomposing in soil. Acta Agric. Scand. 41, 243±252.
Murwira, H.K., Kirchmann, H., Swift, M.J., 1990. The effect of
moisture on the decomposition rate of cattle manure. Plant and
Soil 122, 197±199.
Navarro, A.F., Cegarra, J., Roig, A., Bernal, M.P., 1991. An
automatic microanalysis method for the determination of
organic carbon in wastes. Commun. Soil Sci. Plant Anal. 22,
2137±2144.
Navarro, A.F., Cegarra, J., Roig, A., GarcõÂa, D., 1993. Relation-
ships between organic matter and carbon contents of organic
wastes. Biores. Technol. 44, 203±207.
Paredes, C., Bernal, M.P., Cegarra, J., Roig, A., Navarro, A.F.,
1996. Nitrogen transformation during the composting of
different organic wastes. In: Van Cleemput, O., Hofman, G.,
Vermoesen, A. (Eds.), Progress in Nitrogen Cycling Studies.
Kluwer Academic Publishers, Dordrecht, pp. 121±125.
Recous, S., Robin, D., Darwis, D., Mary, B., 1995. Soil inorganic N
availability: Effect on maize residue decomposition. Soil Biol.
Biochem. 27, 1529±1538.
Saviozzi, A., Riffaldi, R., Levi-Minzi, R., Scagnozzi, A., Vanni, G.,
1993. Decomposition of vegetation-water sludge in soil. Biores.
Technol. 44, 223±228.
Senesi, N., 1989. Composted materials as organic fertilizers. Sci.
Total Environ. 81/82, 521±542.
Serra-Wittling, C., Houot, S., Barriuso, E., 1995. Soil enzymatic
response to addition of municipal solid-waste compost. Biol.
Fertil. Soils 20, 226±236.
Sims, J.T., 1990. Nitrogen mineralization and elemental availability
in soils amended with cocomposted sewage sludge. J. Environ.
Qual. 19, 669±675.
Sinha, M.K., Sinha, D.P., Sinha, H., 1977. Organic matter
transformations in soils. V. Kinetics of carbon and nitrogen
mineralization in soil amended with different organic materials.
Plant and Soil 46, 579±590.
Soil Survey Staff, 1987. Keys to Soil Taxonomy. SMSS Technical
Monograph No. 6, 3rd ed., New York, Ithaca.
Tyson, S.C., Cabrera, M.L., 1993. Nitrogen mineralization in soils
amended with composted and uncomposted poultry litter.
Commun. Soil Sci. Plant Anal. 24, 2361±2374.
Viel, M., Sayack, D., Peyre, A., AndreÂ, L., 1987. Optimization of
in-vessel co-composting through heat recovery. Biol. Wastes
20, 167±185.
M.P. Bernal et al. / Agriculture, Ecosystems and Environment 69 (1998) 175±189 189