carbon footprint of dormitories at mahidol university ... · carbon footprint of dormitories at...
TRANSCRIPT

The Third International Congress on Interdisciplinary Research and Development, 30 - 31 May 2013, Thailand
9.1
Carbon Footprint of Dormitories at Mahidol University,
Salaya Campus, Thailand Sayam Aroonsrimorakot1, Chumporn Yuwaree2, Chumlong Arunlertaree3,
Rungjarus Hutajareorn4 and Tarinee Buadit5 Faculty of Environment and Resource Studies,
Mahidol University, Salaya Campus, Nakhonpathom 73170 Thailand [email protected], [email protected], [email protected],
[email protected], [email protected] Abstract - Greenhouse gas (GHGs) emission, a significant amount of which comes from corporate organizations, is also the cause of global warming, and is a threat to humanity at this time. As a result, the concept of measuring GHGs by the management of organizations was established to help reduce these amounts. This study focuses on measuring the amount of GHGs or Carbon Footprint by calculating GHGs emissions in equivalent units of carbon dioxide (CO2e) from the activities within the dormitories of Mahidol University in the year 2010, with data collection of GHGs from such sources as electricity and water supply consumption, quantity of wastewater and garbage. Then, multiply these data by the international emission factors. The results showed that the GHGs emission from dormitories is equal to 1,270.49 tonCO2e, which means that the average GHG emission per student was 0.3317 tonCO2e. Sources that emit the most GHGs are the use of electric energy, followed by produced solid waste. Thus, power consumption and the amount of waste created should be reduced with the use of current energy-saving technologies or energy saving campaigns to reduce the power consumption of students, including waste classification to facilitate recycling and so on. Keywords - Carbon Footprint, Dormitory, Greenhouse Gases
1. INTRODUCTION
Carbon footprint for companies is measured by assessing the greenhouse gas emissions resulting from their activities, both directly and indirectly, such as the burning of fuel, electricity consumption, and waste management and transport, by showing the amount of greenhouse gas emissions in units of carbon dioxide equivalent (CO2e). Six species of greenhouse gas are used to assess the carbon footprint under the Kyoto Protocol; carbon dioxide (CO2), methane (CH4), nitrous oxide (N2O), hydrofluoride perfluoro carbons (HFCs), perfluoro carbons (PFCs) and sulfur hexafluoride (SF6).
Carbon footprint can be calculated by using the life cycle assessment (LCA), which is the international standard ISO 14040, 14044, used for the assessment of environmental impact throughout the life cycle. It can be calculated from the formula: CO2 equivalent of each process = Amount of activity x CO2 emission intensity. The total amount of every type of greenhouse gas from all activities, which were converted into units of carbon dioxide equivalents by multiplying total emissions of each type of greenhouse gas with its global warming potential (GWP) , is the Carbon Footprint of the organization.
Sayam Aroonsrimorakot1, Chumporn Yuwaree2, Chumlong Arunlertaree3, Rungjarus Hutajareorn4 and Tarinee Buadit5
The Third International Congress on Interdisciplinary Research and Development, 30 - 31 May 2013, Thailand
9.2
2. METHODOLOGY
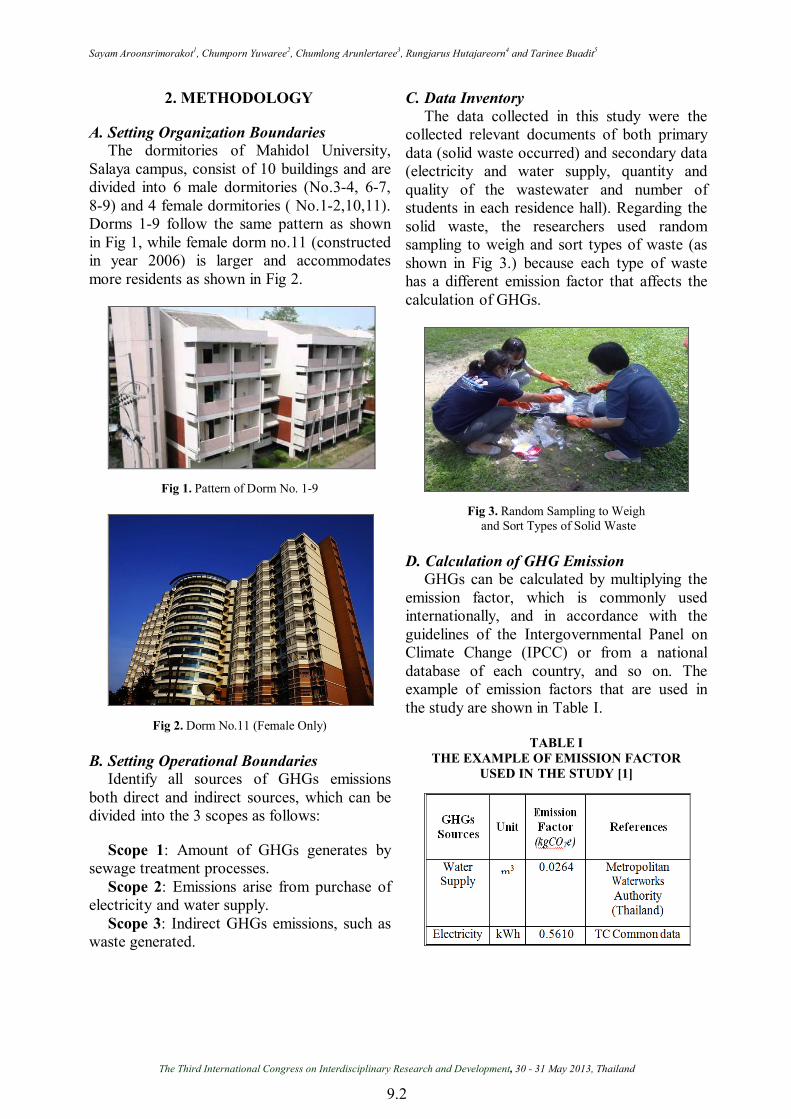
A. Setting Organization Boundaries The dormitories of Mahidol University,
Salaya campus, consist of 10 buildings and are divided into 6 male dormitories (No.3-4, 6-7, 8-9) and 4 female dormitories ( No.1-2,10,11). Dorms 1-9 follow the same pattern as shown in Fig 1, while female dorm no.11 (constructed in year 2006) is larger and accommodates more residents as shown in Fig 2.
Fig 1. Pattern of Dorm No. 1-9
Fig 2. Dorm No.11 (Female Only) B. Setting Operational Boundaries
Identify all sources of GHGs emissions both direct and indirect sources, which can be divided into the 3 scopes as follows:
Scope 1: Amount of GHGs generates by sewage treatment processes.
Scope 2: Emissions arise from purchase of electricity and water supply.
Scope 3: Indirect GHGs emissions, such as waste generated.
C. Data Inventory The data collected in this study were the
collected relevant documents of both primary data (solid waste occurred) and secondary data (electricity and water supply, quantity and quality of the wastewater and number of students in each residence hall). Regarding the solid waste, the researchers used random sampling to weigh and sort types of waste (as shown in Fig 3.) because each type of waste has a different emission factor that affects the calculation of GHGs.
Fig 3. Random Sampling to Weigh and Sort Types of Solid Waste
D. Calculation of GHG Emission
GHGs can be calculated by multiplying the emission factor, which is commonly used internationally, and in accordance with the guidelines of the Intergovernmental Panel on Climate Change (IPCC) or from a national database of each country, and so on. The example of emission factors that are used in the study are shown in Table I.
TABLE I
THE EXAMPLE OF EMISSION FACTOR USED IN THE STUDY [1]

Carbon Footprint of Dormitories at Mahidol University, Salaya Campus, Thailand
The Third International Congress on Interdisciplinary Research and Development, 30 - 31 May 2013, Thailand
9.3
II. RESULTS
Resource consumption and waste generated by the activities within dormitories of Mahidol University, Salaya campus in the year 2010 are presented in Table II.
TABLE II
CONSUMPTION OF RESOURCES AND THE AMOUNT OF WASTE GENERATED
GHGs Sources Resource
consumption/ Waste generated
Scope 1 Quantity of wastewater 157996.8 L Scope 2 Tap water used 197,496 m3 Electricity consumption 1,800,551.5 kWh Scope 3 Solid waste generated 24,795.16 kg The total GHGs emissions that resulted
from the activities of the dormitories of Mahidol University, Salaya campus is equal to 1,270.49 tonCO2e as shown in Fig 4.
Fig 4. The Amount of GHGs Resulting from the Activities of Dormitories of Mahidol University, Salaya Campus in the year 2010
The ratio of the amount of greenhouse
gases generated of each activity is seen in Fig 5.
Fig 5. Percentage of Greenhouse Gases Emissions of Each Activity
In summary, in 2010, the dormitories of
Mahidol University, Salaya campus released greenhouse gas emissions from activities in the amount of 1,270.49 tonCO2e. The emission of greenhouse gases by the dormitories of Mahidol University, Salaya campus in each scope is demonstrated in Table III.
TABLE III
THE AMOUNT OF GREENHOUSE GASES THAT RESULT FROM THE ACTIVITIES
OF DORMITORIE OF MAHIDOL UNIVERSITY
Dormitories are the places where energy
and water are consumed in high quantities because there are a lot of students living and doing daily life activities, including use of computers, fans and lamps for work and study, the use of refrigerators and microwaves for cooking, watching TVs for relaxation, and the high water consumption of dishwashers, washing, bathing and others. Apart from the consumption of electricity and water resources in high volume, dormitories also generate waste in high volume, both solid waste and

Sayam Aroonsrimorakot1, Chumporn Yuwaree2, Chumlong Arunlertaree3, Rungjarus Hutajareorn4 and Tarinee Buadit5
The Third International Congress on Interdisciplinary Research and Development, 30 - 31 May 2013, Thailand
9.4
wastewater (as shown in Fig 6.), which are the sources of greenhouse gases emissions. As a result, compared to other campus buildings, the dormitory is a one of largest sources of greenhouse gas in universities.
Fig 6. Amount of Solid Waste Generate from Each
Dormitory of Mahidol University Per Day
Alternatives to compensate for the GHGs emissions of the organization
• Planting trees to absorb CO2 Teak plantations can produce carbon
sequestration in the approximate amount of 4.61 tons/rai/year (1 rai = 1,600 SqMts). For Northern Black Wattle, the amount of carbon sequestration is about 9.08 tons/ha/year. As such, if the dormitories of Mahidol University, Salaya are to reduce the amount of carbon dioxide, they should plant 275.59 rai of teak or plant 139.92 rai of Northern black wattle.
• Carbon Credit (CERs) It can be observed that through the three
cooperative mechanisms of the Kyoto Protocol, carbon credits become more like commodities, and they are tradable or exchangeable in a market known as the “carbon market.” If the dormitories of Mahidol University, Salaya, want to reduce the amount of GHGs 1,270.49 tonCO2e per year by purchasing CERs at the price of the ECX Dec '11 market, the dormitories will have to pay the total cost of 703,023.12 Baht or will pay a total cost of 704,677.30 Baht for the BlueNext Spot market. (Carbon credit trading market at 21-25 March 2011 from Thailand Greenhouse Gas Management Organization; TGO [3])
3. CONCLUSIONS
• The total of the greenhouse gas emissions by the dormitories of Mahidol University is 1,270.49 tonCO2e. The source of greenhouse gases that has the highest emissions is electricity consumption, followed by the solid waste generated. The source with the minimal release is the consumption of water supply.
• In addition, the study also shows that the release of greenhouse gases in semester period is higher than the vacation period, and GHGs emission from female dormitories are more than emissions from male dormitories as shown in Table IV.
TABLE IV COMPARISON OF THE AMOUNT
OF GREENHOUSE GASES GENERATED DURING THE SEMESTER / VACATION
Period Dormitory (tonCO2e)
Female Male Semester 132.37 58.22 Vacation 11.09 8.19
• The total number of students living in
dormitories in year 2010 was 3,830; it means that the average GHG emission per student was 0.3317 tonCO2e.
• The amount of greenhouse gas emissions is not only determined by the amount of resources used or the amount of waste that occurs, but also depends on the Emission Factor as well. Although the source amount may be less, if the source has a higher Emission Factor used to calculate the amount of greenhouse gas emissions, the results may obtained much higher than a greater source with a lower Emission Factor. The time of the academic calendar is another factor that affects the amount of greenhouse gases. This is due to the fact that the in-class semester period and the vacation period have different levels and types of student and staff activity.

Carbon Footprint of Dormitories at Mahidol University, Salaya Campus, Thailand
The Third International Congress on Interdisciplinary Research and Development, 30 - 31 May 2013, Thailand
9.5
4. CONSTRAINTS
• Wastewater quality data used to calculate the amount of greenhouse gas emissions is the data of year 2009 due to data limitations of monitoring wastewater quality of university.
• Amount of wastewater generated may not be correct because no measurement system was available. Therefore, this study calculates the amount wastewater from 80 percent of the amount of water used. Obtained values may have the error.
REFERENCES
[1] Thailand Greenhouse Gas Management Organization. 2011. Emission Factor [Online]. Available at:http://thaicarbonlabel.tgo.or .th/ download/Emission_Factor.pdf. April 20, 2011.
[2] Intergovernmental Panel on ClimateChange. 2007. 2006 IPCC Guidelines for National Greenhouse Gas Inventories: Volume 5 Waste, Chapter 6: Wastewater Treatment and Discharge. Available source: http:// www. ipcc- nggip.iges.or.jp/public/2006 gl/vol5. html. June 13, 2011.
[3] Thailand Greenhouse Gas Management Organization. 2011. Carbon Market [Online]. Available at: http://www.tgo.or.th/index.php?option=com_content&task=section&id=9 &Itemi d=50. May 10, 2011.
[4] Thailand Greenhouse Gas Management Organization. 2011. GHG & Climate Change [Online]. Available at: http:// www.tgo.or.th/index.php?option=com_content&task=section&i d=5&Itemid =28. Jauary 20, 2011.
[5] United Nations Framework Convention on Climate Change. 2 01 1 . United Nations Framework Convention on Climate Change [Online]. Available at: http://unfccc.int/2860. php. January 20, 2011.