carbon accounting in the waste sector prof jim baird caledonian environment centre glasgow...
TRANSCRIPT
Carbon Accounting in the Waste Sector
Prof Jim Baird
Caledonian Environment Centre
Glasgow Caledonian University
1
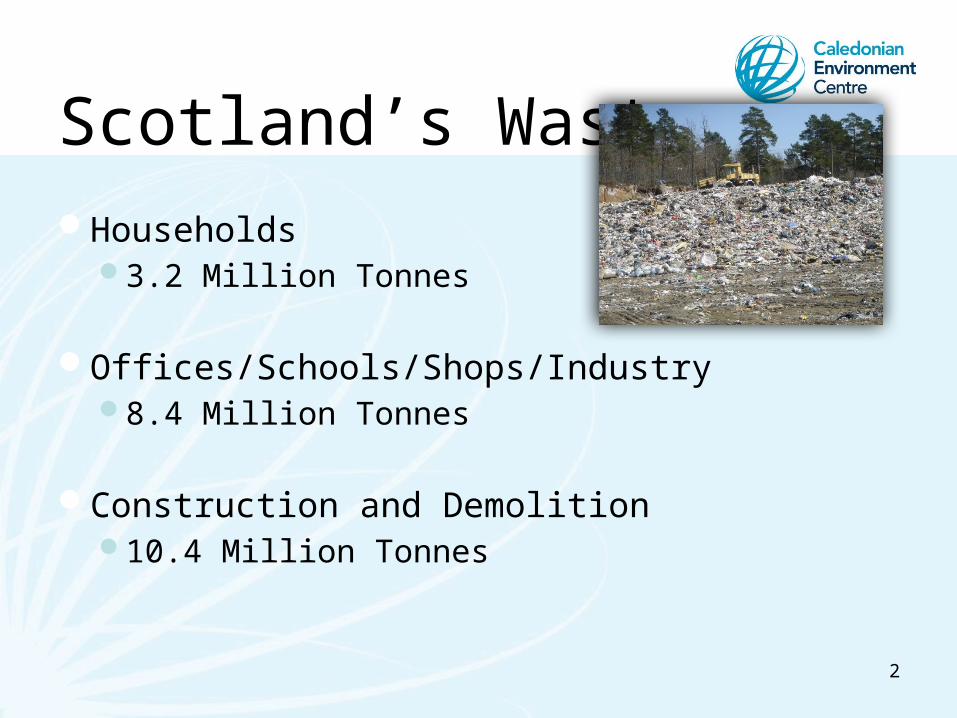
Scotland’s WasteHouseholds
3.2 Million Tonnes
Offices/Schools/Shops/Industry8.4 Million Tonnes
Construction and Demolition 10.4 Million Tonnes
2
Landfill Directive (1999/31/EC)
• Tightened up standards for operation• Required pre-treatment of waste prior to landfill
And Perhaps most significantly:
• Set targets for the diversion of Biodegradable Municipal Waste– Municipal Waste– Biodegradable
3

Definitions
• Municipal Waste– EU - waste from households, as well as other waste, which, because of
its nature or composition, is similar to waste from household– UK – Waste Collected by or on behalf of the Local Authority
• Biodegradable– Any waste that is capable of undergoing anaerobic or aerobic
decomposition, such as; food and garden waste; and paper and cardboard
• Leads to Biodegradable Municipal Waste (BMW)
4
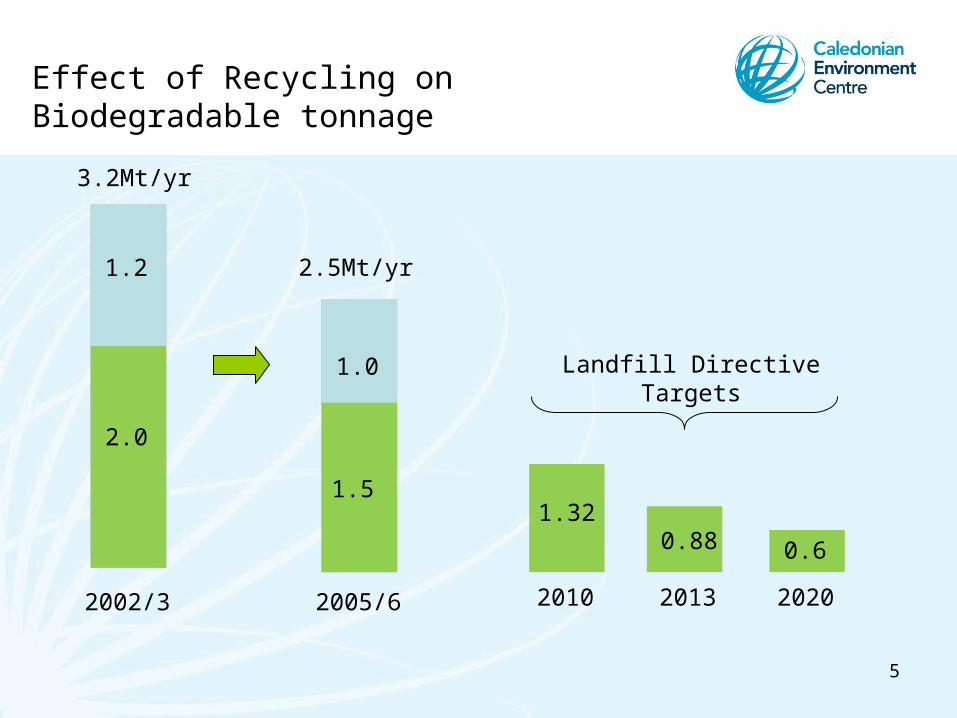
Effect of Recycling on Biodegradable tonnage
3.2Mt/yr
2.5Mt/yr
2.0
1.2
1.0
2002/3 2005/6 202020132010
1.5
Landfill Directive Targets
1.32
0.60.88
5
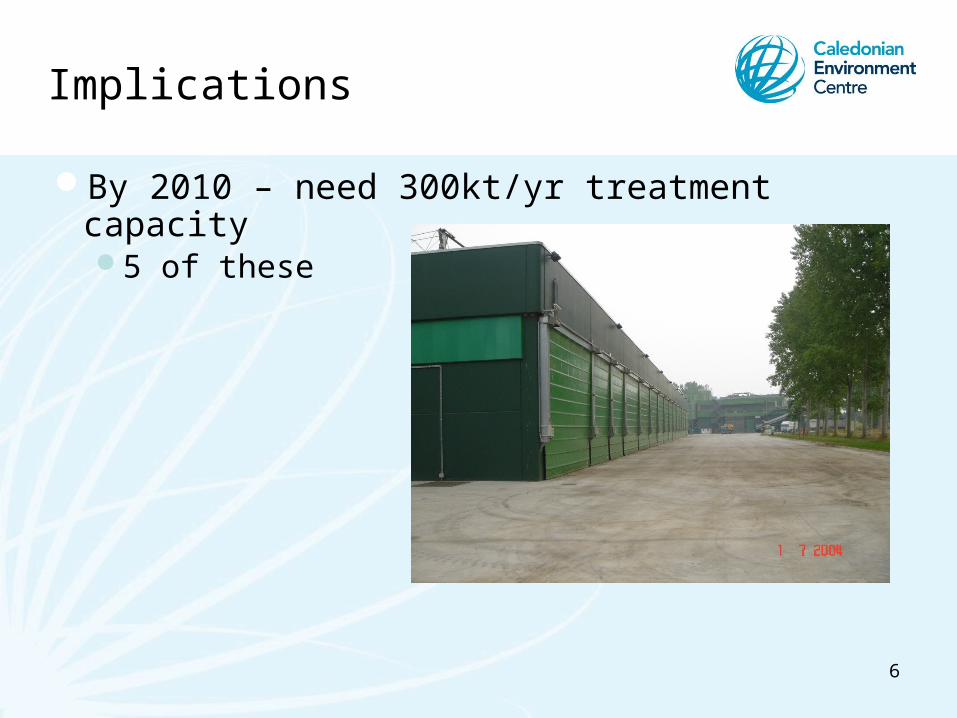
Implications
By 2010 – need 300kt/yr treatment capacity5 of these
6
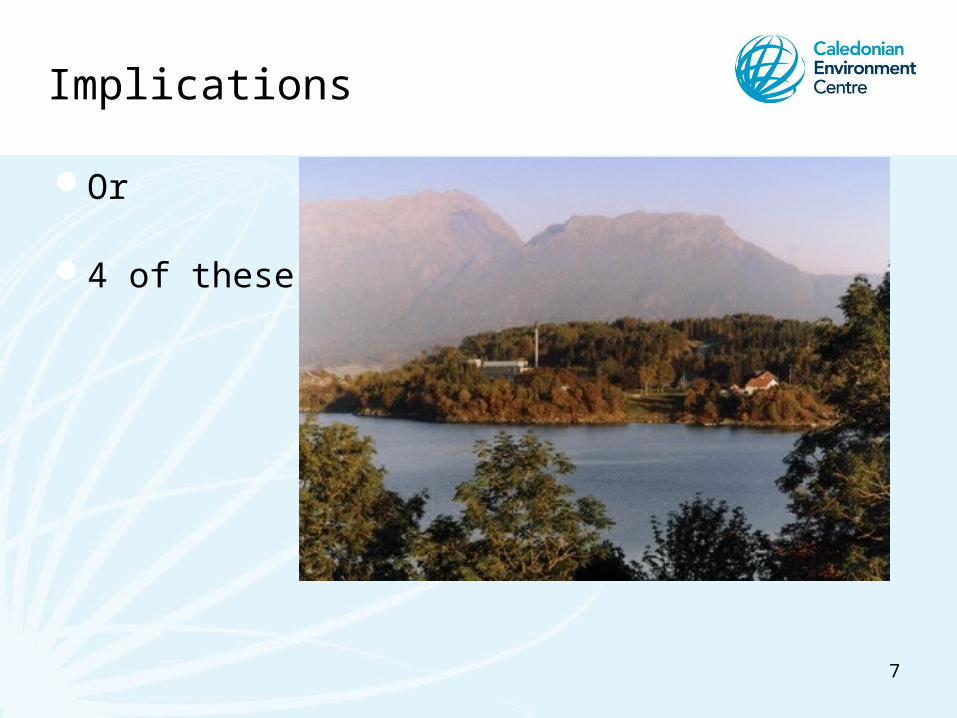
Or
4 of these
Implications
7
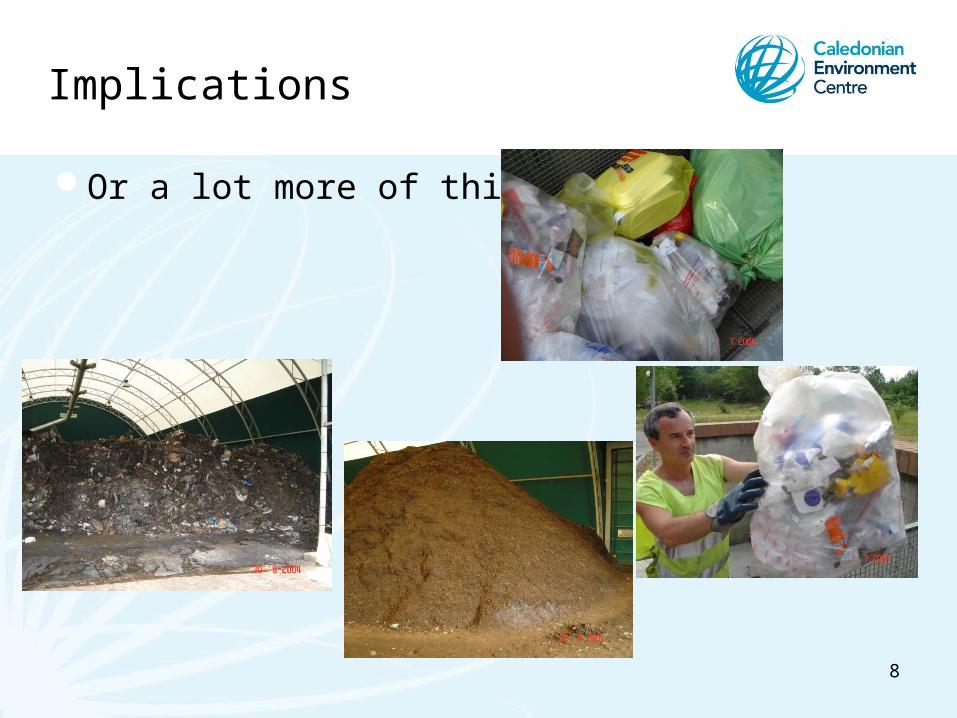
Or a lot more of this:
Implications
8
Or Even better -
9
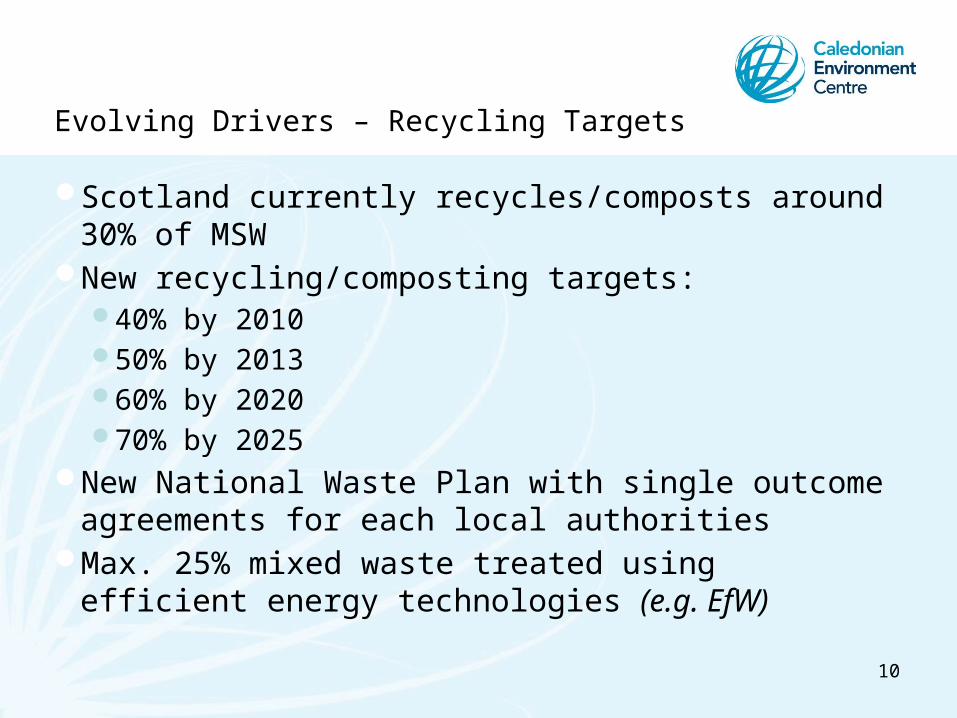
Evolving Drivers – Recycling Targets
Scotland currently recycles/composts around 30% of MSW
New recycling/composting targets:40% by 201050% by 201360% by 202070% by 2025
New National Waste Plan with single outcome agreements for each local authorities
Max. 25% mixed waste treated using efficient energy technologies (e.g. EfW)
10
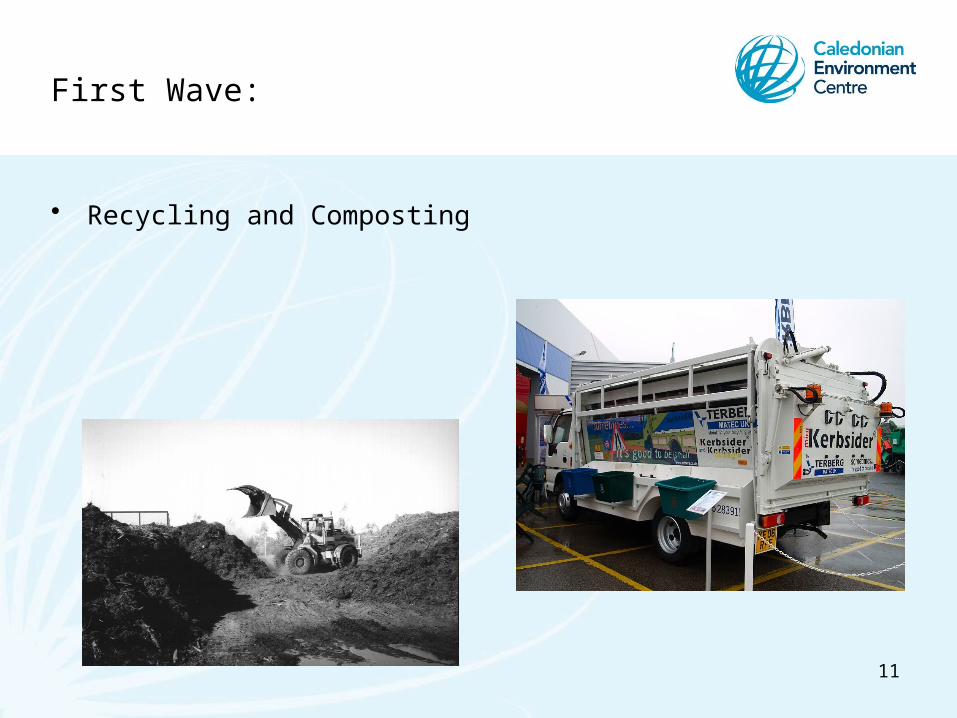
First Wave:
• Recycling and Composting
11
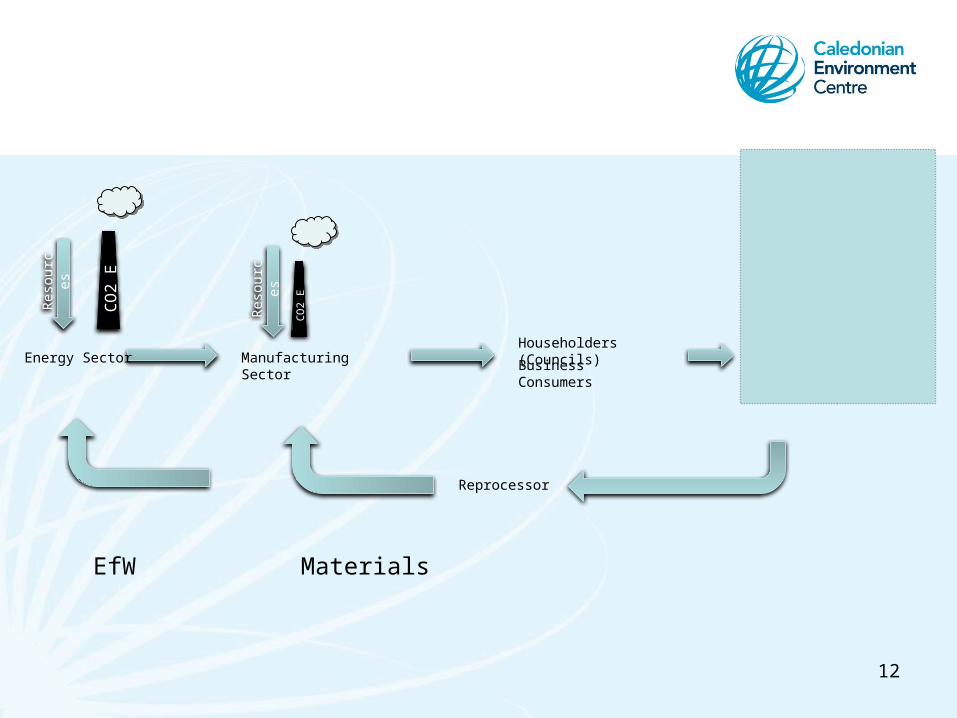
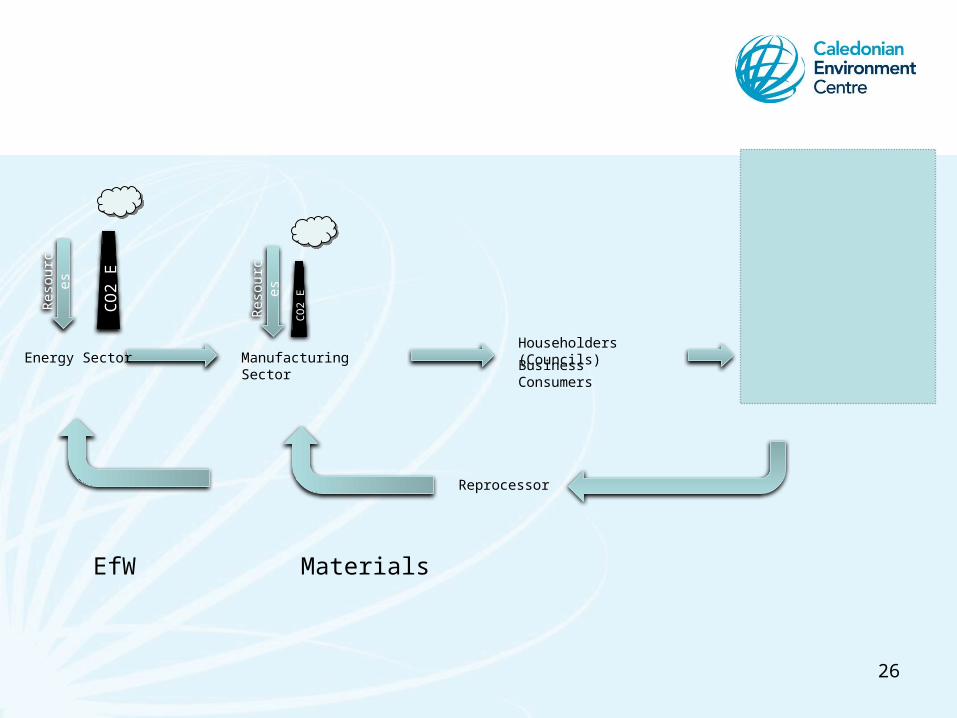
Energy Sector
CO
2 E
Manufacturing Sector Business Consumers
Householders (Councils)
Res
ourc
es
Res
ourc
es
CO
2 E Landfill
CO
2 E
WasteSector
Reprocessor
MaterialsEfW
12
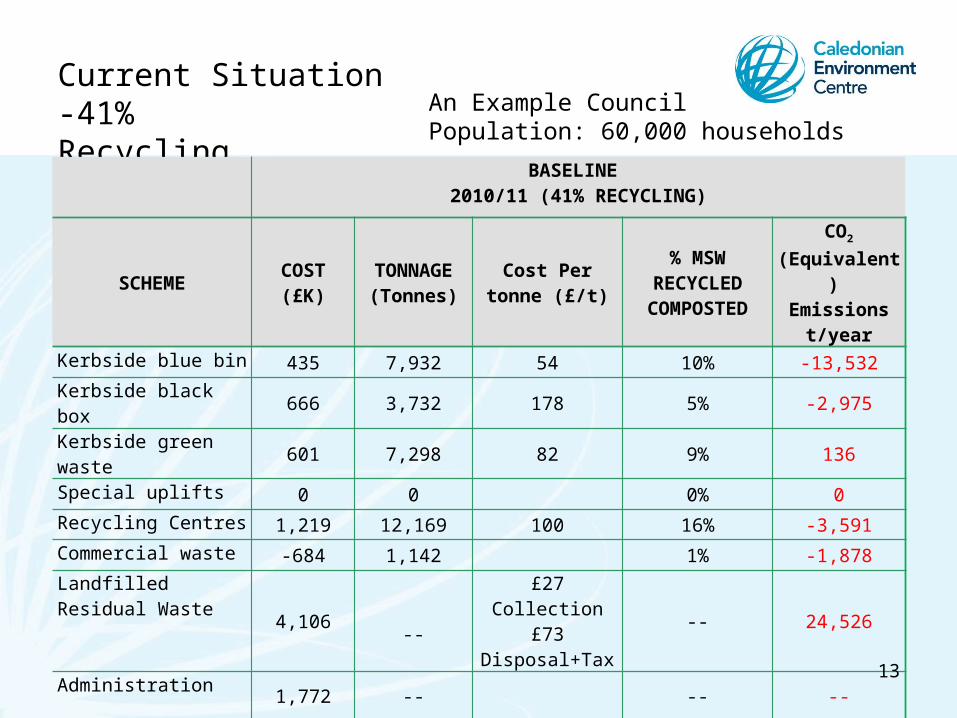
Current Situation -41%Recycling
BASELINE 2010/11 (41% RECYCLING)
SCHEME COST (£K) TONNAGE (Tonnes)
Cost Per tonne (£/t)
% MSW RECYCLED COMPOSTED
CO2 (Equivalent)
Emissions t/year
Kerbside blue bin 435 7,932 54 10% -13,532Kerbside black box 666 3,732 178 5% -2,975Kerbside green waste 601 7,298 82 9% 136Special uplifts 0 0 0% 0Recycling Centres 1,219 12,169 100 16% -3,591Commercial waste -684 1,142 1% -1,878Landfilled Residual Waste 4,106 --
£27 Collection-- 24,526
£73 Disposal+TaxAdministration
1,772 -- -- --
TOTALS 8,116 32,338 41% 2,686
An Example CouncilPopulation: 60,000 households
13
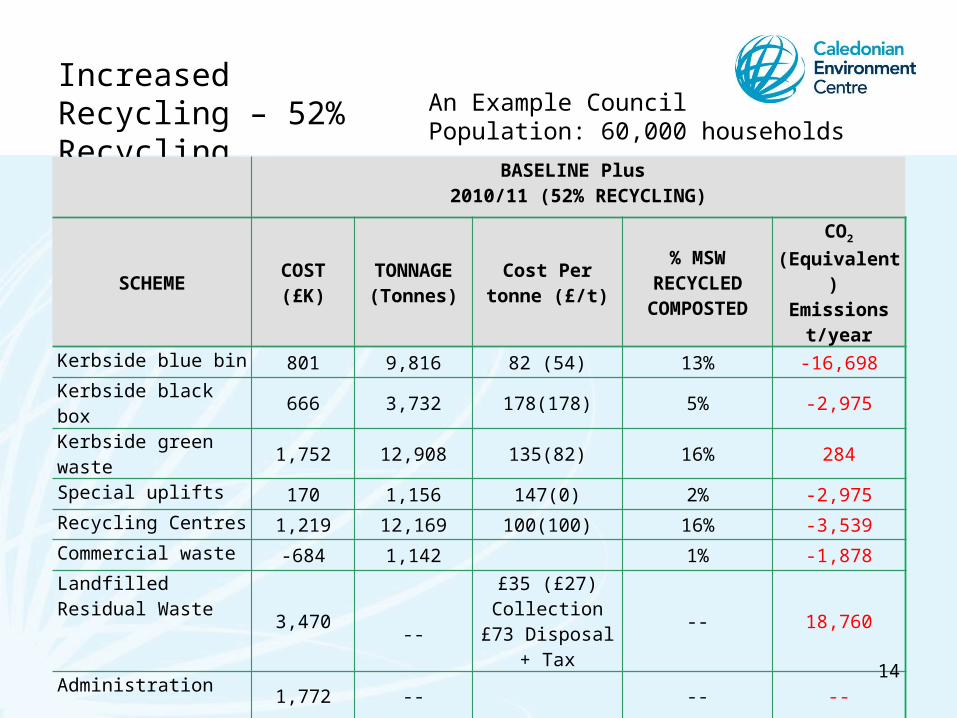
Increased Recycling – 52% Recycling
BASELINE Plus 2010/11 (52% RECYCLING)
SCHEME COST (£K) TONNAGE (Tonnes)
Cost Per tonne (£/t)
% MSW RECYCLED COMPOSTED
CO2 (Equivalent)
Emissions t/year
Kerbside blue bin 801 9,816 82 (54) 13% -16,698Kerbside black box 666 3,732 178(178) 5% -2,975Kerbside green waste 1,752 12,908 135(82) 16% 284Special uplifts 170 1,156 147(0) 2% -2,975Recycling Centres 1,219 12,169 100(100) 16% -3,539Commercial waste -684 1,142 1% -1,878Landfilled Residual Waste 3,470 --
£35 (£27) Collection -- 18,760
£73 Disposal + TaxAdministration
1,772 -- -- --
TOTALS 9,166 40,924 52% -6,522
14
An Example CouncilPopulation: 60,000 households
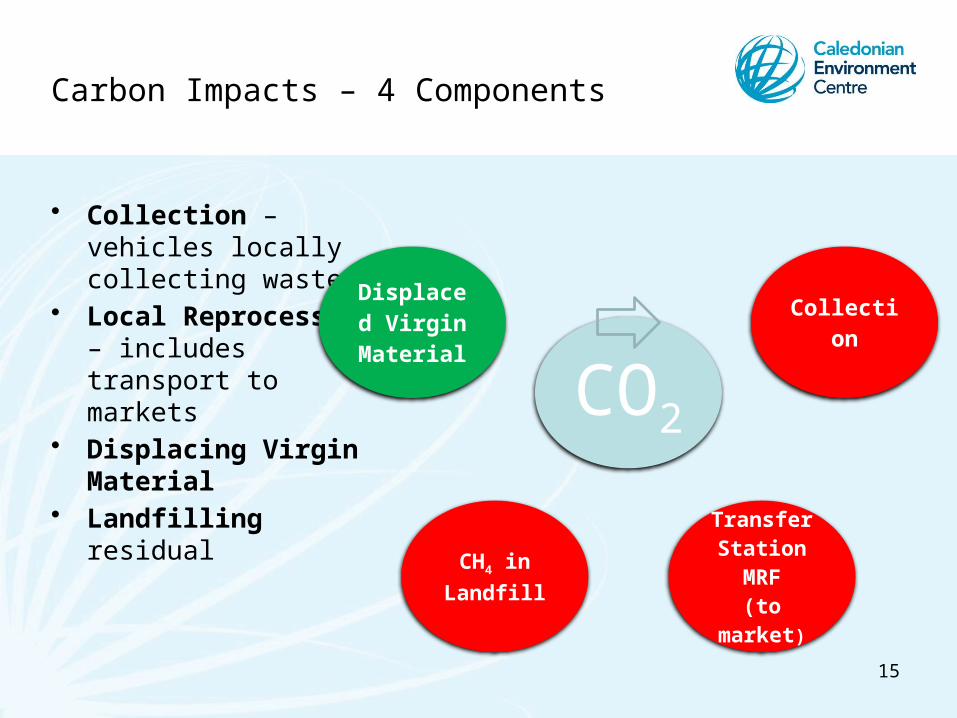
Carbon Impacts – 4 Components
• Collection – vehicles locally collecting waste
• Local Reprocessing – includes transport to markets
• Displacing Virgin Material
• Landfilling residual
15
CO2
Collection
Transfer Station
MRF(to market)
CH4 in Landfill
Displaced Virgin Material
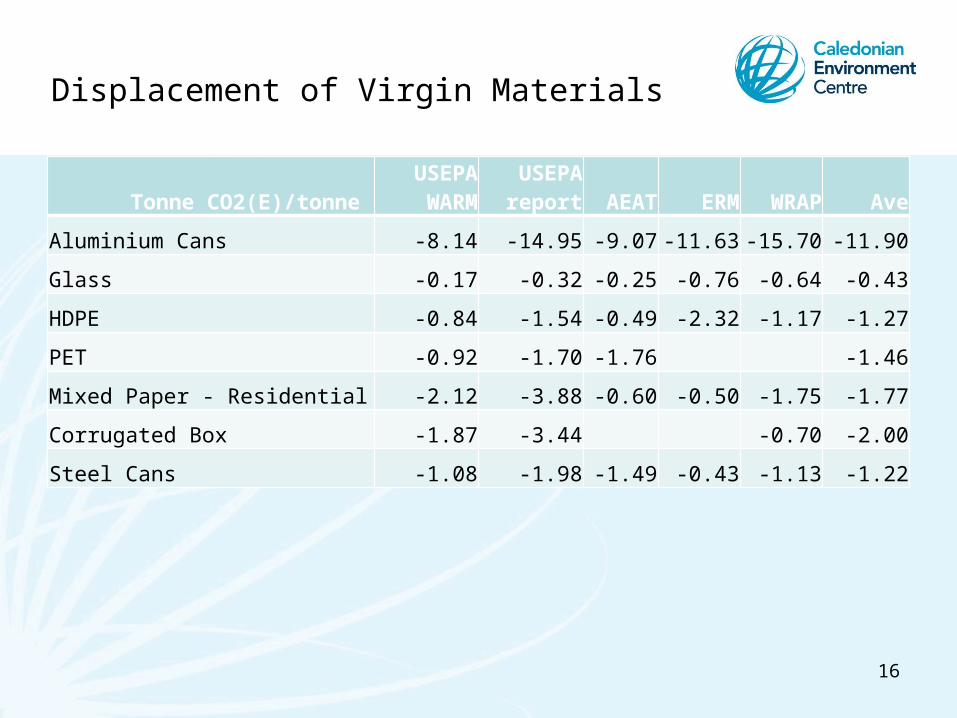
Displacement of Virgin Materials
Tonne CO2(E)/tonne USEPA WARM
USEPA report AEAT ERM WRAP Ave
Aluminium Cans -8.14 -14.95 -9.07 -11.63 -15.70 -11.90
Glass -0.17 -0.32 -0.25 -0.76 -0.64 -0.43
HDPE -0.84 -1.54 -0.49 -2.32 -1.17 -1.27
PET -0.92 -1.70 -1.76 -1.46
Mixed Paper - Residential -2.12 -3.88 -0.60 -0.50 -1.75 -1.77
Corrugated Box -1.87 -3.44 -0.70 -2.00
Steel Cans -1.08 -1.98 -1.49 -0.43 -1.13 -1.22
16

CO2
Collection
Transfer Station/MRF(to market)
CH4 in Landfill
Displaced Virgin
Material
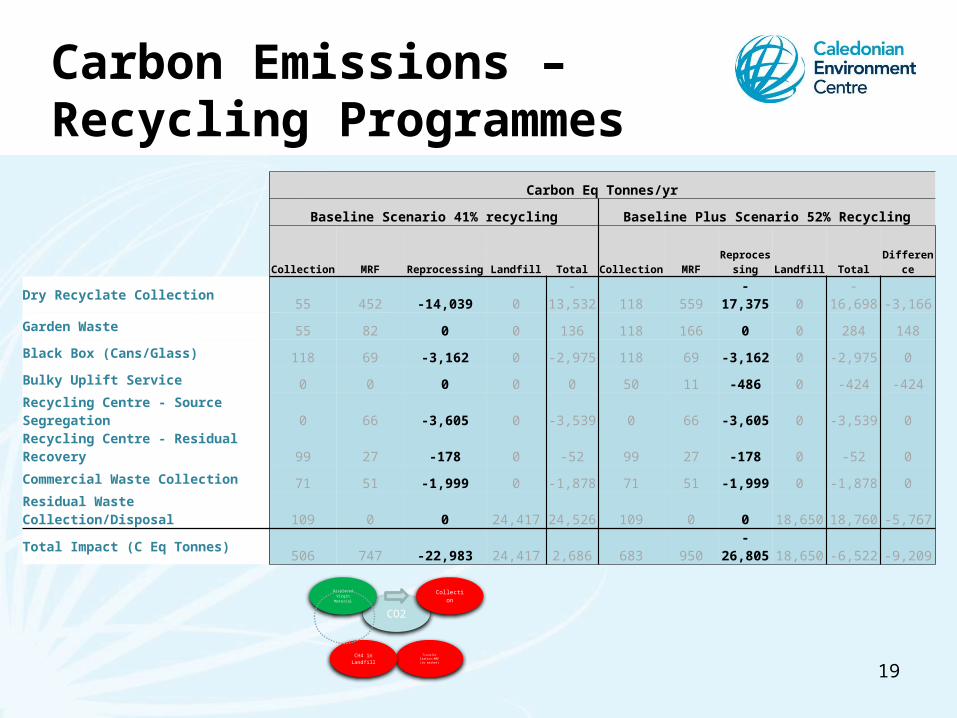
Carbon Emissions – Recycling Programmes
Carbon Eq Tonnes/yr
Baseline Scenario 41% recycling Baseline Plus Scenario 52% Recycling
Collection MRF Reprocessing Landfill Total Collection MRFReproces
sing Landfill Total Difference
Dry Recyclate Collection 55 452 -14,039 0 -13,532 118 559 -17,375 0 -16,698 -3,166
Garden Waste 55 82 0 0 136 118 166 0 0 284 148
Black Box (Cans/Glass) 118 69 -3,162 0 -2,975 118 69 -3,162 0 -2,975 0
Bulky Uplift Service 0 0 0 0 0 50 11 -486 0 -424 -424
Recycling Centre - Source Segregation 0 66 -3,605 0 -3,539 0 66 -3,605 0 -3,539 0
Recycling Centre - Residual Recovery 99 27 -178 0 -52 99 27 -178 0 -52 0
Commercial Waste Collection 71 51 -1,999 0 -1,878 71 51 -1,999 0 -1,878 0
Residual Waste Collection/Disposal 109 0 0 24,417 24,526 109 0 0 18,650 18,760 -5,767
Total Impact (C Eq Tonnes)506 747 -22,983 24,417 2,686 683 950 -26,805 18,650 -6,522 -9,209
17

Carbon Emissions – Recycling Programmes
Carbon Eq Tonnes/yr
Baseline Scenario 41% recycling Baseline Plus Scenario 52% Recycling
Collection MRF Reprocessing Landfill Total Collection MRFReproces
sing Landfill Total Difference
Dry Recyclate Collection 55 452 -14,039 0 -13,532 118 559 -17,375 0 -16,698 -3,166
Garden Waste 55 82 0 0 136 118 166 0 0 284 148
Black Box (Cans/Glass) 118 69 -3,162 0 -2,975 118 69 -3,162 0 -2,975 0
Bulky Uplift Service 0 0 0 0 0 50 11 -486 0 -424 -424
Recycling Centre - Source Segregation 0 66 -3,605 0 -3,539 0 66 -3,605 0 -3,539 0
Recycling Centre - Residual Recovery 99 27 -178 0 -52 99 27 -178 0 -52 0
Commercial Waste Collection 71 51 -1,999 0 -1,878 71 51 -1,999 0 -1,878 0
Residual Waste Collection/Disposal 109 0 0 24,417 24,526 109 0 0 18,650 18,760 -5,767
Total Impact (C Eq Tonnes)506 747 -22,983 24,417 2,686 683 950 -26,805 18,650 -6,522 -9,209
CO2
Collection
Transfer Station/MRF(to market)
CH4 in Landfill
Displaced Virgin
Material
18
Carbon Emissions – Recycling Programmes
Carbon Eq Tonnes/yr
Baseline Scenario 41% recycling Baseline Plus Scenario 52% Recycling
Collection MRF Reprocessing Landfill Total Collection MRFReproces
sing Landfill Total Difference
Dry Recyclate Collection 55 452 -14,039 0 -13,532 118 559 -17,375 0 -16,698 -3,166
Garden Waste 55 82 0 0 136 118 166 0 0 284 148
Black Box (Cans/Glass) 118 69 -3,162 0 -2,975 118 69 -3,162 0 -2,975 0
Bulky Uplift Service 0 0 0 0 0 50 11 -486 0 -424 -424
Recycling Centre - Source Segregation 0 66 -3,605 0 -3,539 0 66 -3,605 0 -3,539 0
Recycling Centre - Residual Recovery 99 27 -178 0 -52 99 27 -178 0 -52 0
Commercial Waste Collection 71 51 -1,999 0 -1,878 71 51 -1,999 0 -1,878 0
Residual Waste Collection/Disposal 109 0 0 24,417 24,526 109 0 0 18,650 18,760 -5,767
Total Impact (C Eq Tonnes)506 747 -22,983 24,417 2,686 683 950 -26,805 18,650 -6,522 -9,209
CO2
Collection
Transfer Station/MRF(to market)
CH4 in Landfill
Displaced Virgin
Material
19

Carbon Emissions – Recycling Programmes
Carbon Eq Tonnes/yr
Baseline Scenario 41% recycling Baseline Plus Scenario 52% Recycling
Collection MRF Reprocessing Landfill Total Collection MRFReproces
sing Landfill Total Difference
Dry Recyclate Collection 55 452 -14,039 0 -13,532 118 559 -17,375 0 -16,698 -3,166
Garden Waste 55 82 0 0 136 118 166 0 0 284 148
Black Box (Cans/Glass) 118 69 -3,162 0 -2,975 118 69 -3,162 0 -2,975 0
Bulky Uplift Service 0 0 0 0 0 50 11 -486 0 -424 -424
Recycling Centre - Source Segregation 0 66 -3,605 0 -3,539 0 66 -3,605 0 -3,539 0
Recycling Centre - Residual Recovery 99 27 -178 0 -52 99 27 -178 0 -52 0
Commercial Waste Collection 71 51 -1,999 0 -1,878 71 51 -1,999 0 -1,878 0
Residual Waste Collection/Disposal 109 0 0 24,417 24,526 109 0 0 18,650 18,760 -5,767
Total Impact (C Eq Tonnes)506 747 -22,983 24,417 2,686 683 950 -26,805 18,650 -6,522 -9,209
CO2
Collection
Transfer Station/MRF(to market)
CH4 in Landfill
Displaced Virgin
Material
20

Carbon Emissions – Recycling Programmes
Carbon Eq Tonnes/yr
Baseline Scenario 41% recycling Baseline Plus Scenario 52% Recycling
Collection MRF Reprocessing Landfill Total Collection MRFReproces
sing Landfill Total Difference
Dry Recyclate Collection 55 452 -14,039 0 -13,532 118 559 -17,375 0 -16,698 -3,166
Garden Waste 55 82 0 0 136 118 166 0 0 284 148
Black Box (Cans/Glass) 118 69 -3,162 0 -2,975 118 69 -3,162 0 -2,975 0
Bulky Uplift Service 0 0 0 0 0 50 11 -486 0 -424 -424
Recycling Centre - Source Segregation 0 66 -3,605 0 -3,539 0 66 -3,605 0 -3,539 0
Recycling Centre - Residual Recovery 99 27 -178 0 -52 99 27 -178 0 -52 0
Commercial Waste Collection 71 51 -1,999 0 -1,878 71 51 -1,999 0 -1,878 0
Residual Waste Collection/Disposal 109 0 0 24,417 24,526 109 0 0 18,650 18,760 -5,767
Total Impact (C Eq Tonnes)506 747 -22,983 24,417 2,686 683 950 -26,805 18,650 -6,522 -9,209
CO2
Collection
Transfer Station/MRF(to market)
CH4 in Landfill
Displaced Virgin
Material
21
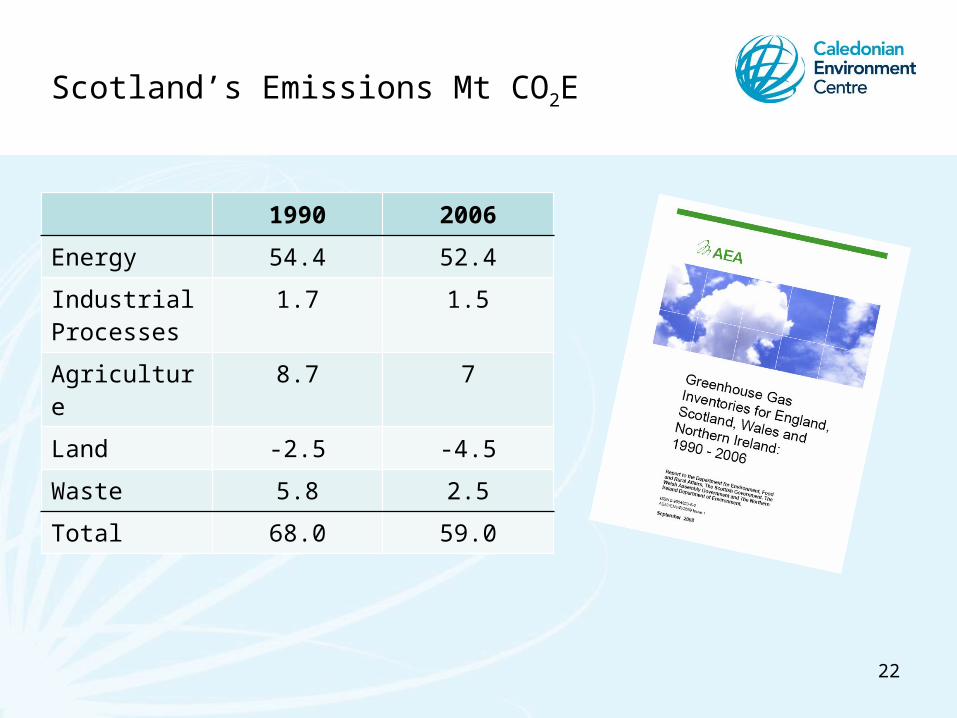
Scotland’s Emissions Mt CO2E
1990 2006
Energy 54.4 52.4
Industrial Processes
1.7 1.5
Agriculture 8.7 7
Land -2.5 -4.5
Waste 5.8 2.5
Total 68.0 59.0
22
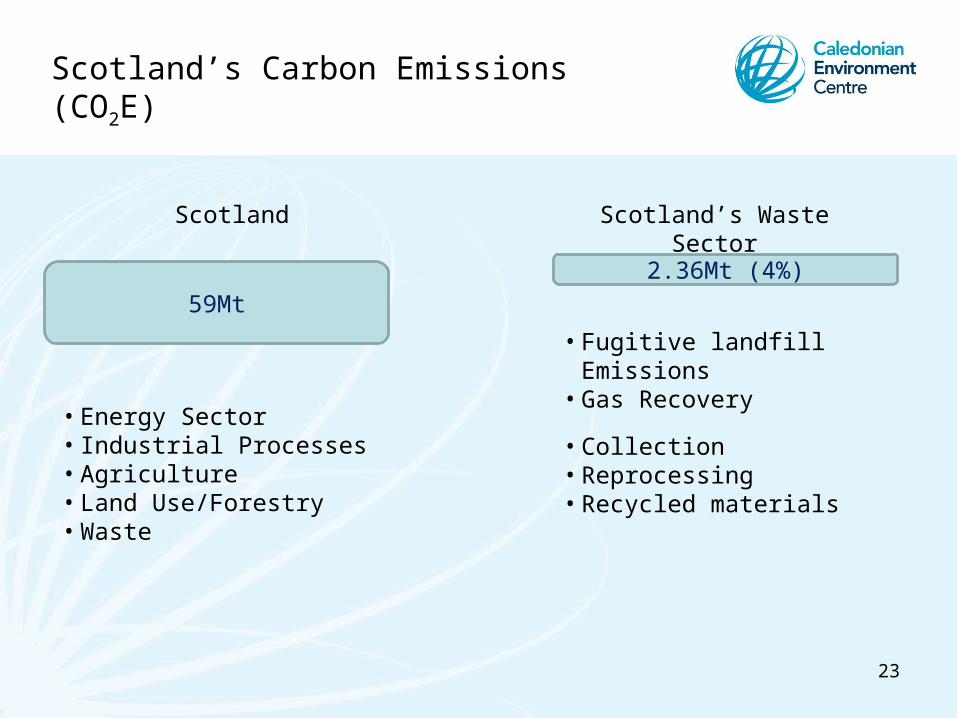
Scotland’s Carbon Emissions (CO2E)
59Mt
• Energy Sector• Industrial Processes• Agriculture• Land Use/Forestry• Waste
2.36Mt (4%)
• Fugitive landfill Emissions• Gas Recovery
• Collection• Reprocessing• Recycled materials
Scotland Scotland’s Waste Sector
23
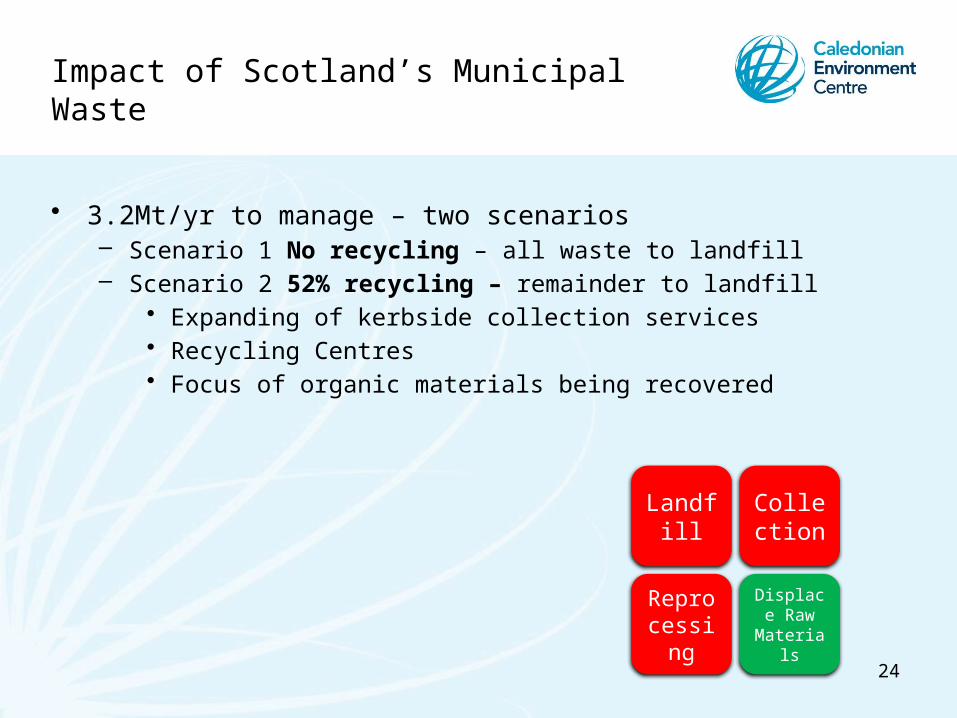
Impact of Scotland’s Municipal Waste
• 3.2Mt/yr to manage – two scenarios– Scenario 1 No recycling – all waste to landfill– Scenario 2 52% recycling – remainder to landfill
• Expanding of kerbside collection services• Recycling Centres• Focus of organic materials being recovered
Landfill
Collection
Reprocessin
g
Displace Raw
Materials
24
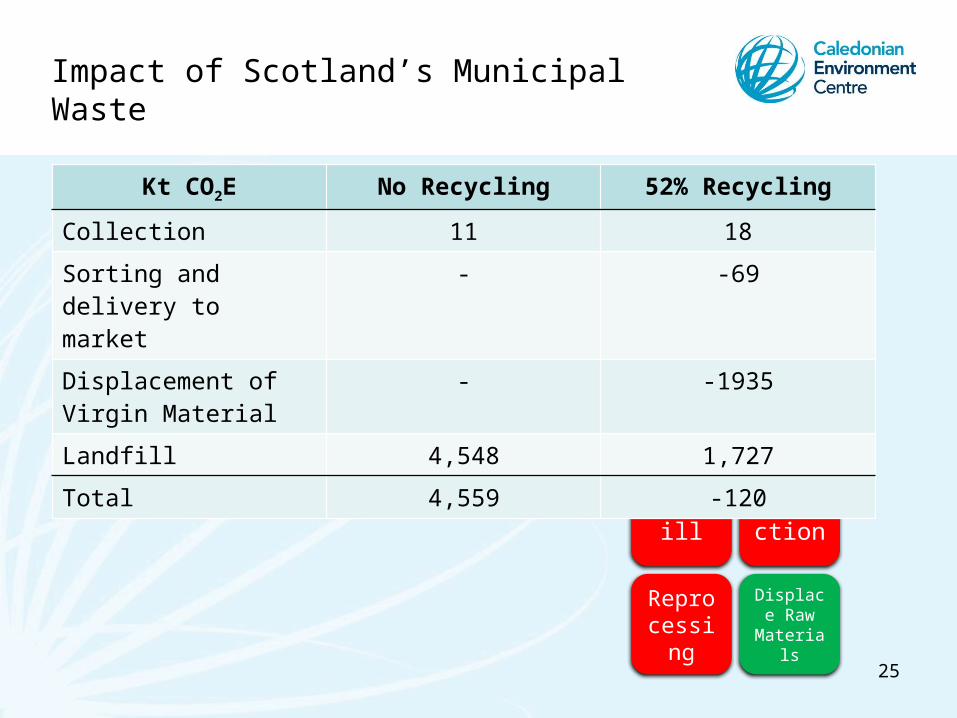
Impact of Scotland’s Municipal Waste
Landfill
Collection
Reprocessin
g
Displace Raw
Materials
25
Kt CO2E No Recycling 52% Recycling
Collection 11 18
Sorting and delivery to market
- -69
Displacement of Virgin Material
- -1935
Landfill 4,548 1,727
Total 4,559 -120
Energy Sector
CO
2 E
Manufacturing Sector Business Consumers
Householders (Councils)
Res
ourc
es
Res
ourc
es
CO
2 E Landfill
CO
2 E
WasteSector
Reprocessor
MaterialsEfW
26
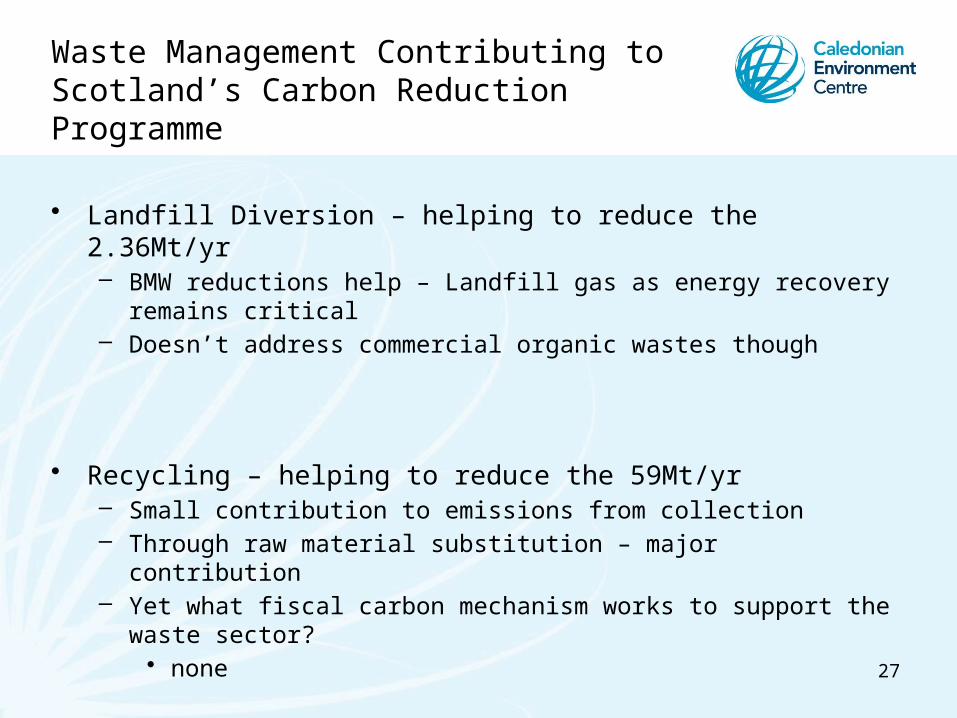
Waste Management Contributing to Scotland’s Carbon Reduction Programme
• Landfill Diversion – helping to reduce the 2.36Mt/yr– BMW reductions help – Landfill gas as energy recovery remains critical– Doesn’t address commercial organic wastes though
• Recycling – helping to reduce the 59Mt/yr– Small contribution to emissions from collection– Through raw material substitution – major contribution– Yet what fiscal carbon mechanism works to support the waste sector?
• none
27
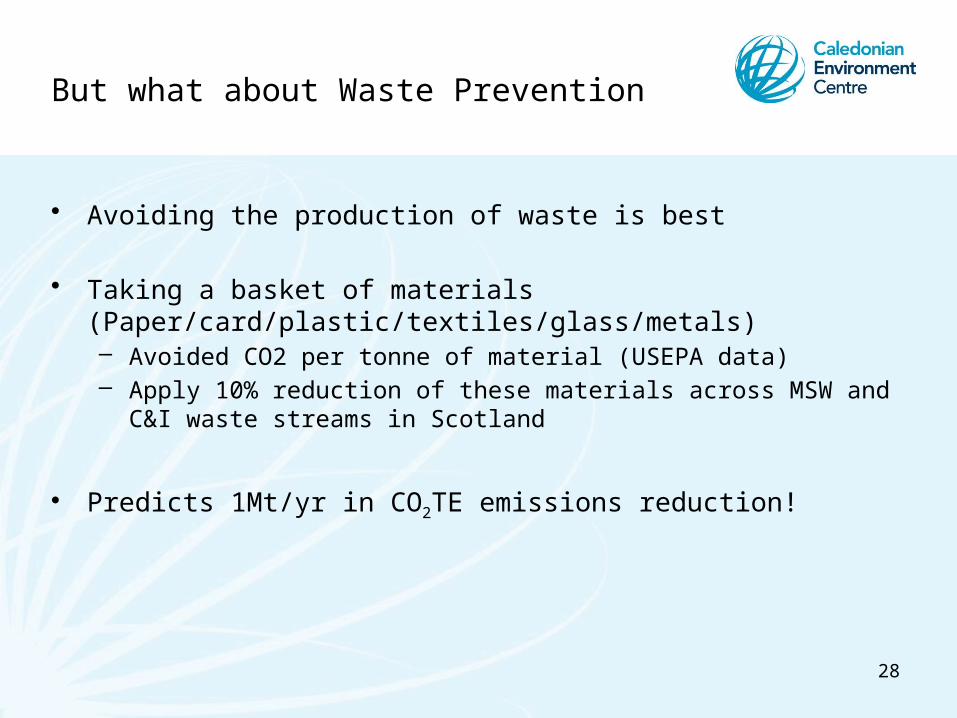
But what about Waste Prevention
• Avoiding the production of waste is best
• Taking a basket of materials (Paper/card/plastic/textiles/glass/metals)– Avoided CO2 per tonne of material (USEPA data)– Apply 10% reduction of these materials across MSW and C&I waste
streams in Scotland
• Predicts 1Mt/yr in CO2TE emissions reduction!
28
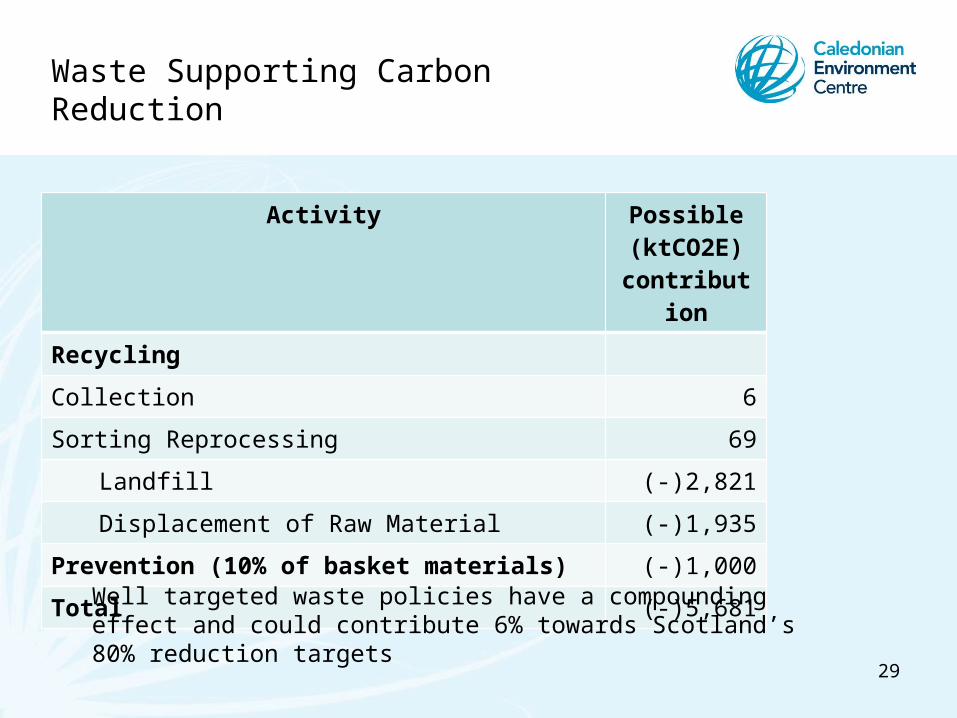
Waste Supporting Carbon Reduction
Activity Possible(ktCO2E)
contribution
Recycling
Collection 6
Sorting Reprocessing 69
Landfill (-)2,821
Displacement of Raw Material (-)1,935
Prevention (10% of basket materials) (-)1,000
Total (-)5,681
Well targeted waste policies have a compounding effect and could contribute 6% towards Scotland’s 80% reduction targets
29
To Conclude:
• Waste Management can play an important role in reducing Scotland’s GHG Emissions
• The IPCC Reporting Mechanisms limit the extent to which the waste sector is credited for its contribution.
30