carbohydrates: energy, metabolism, and...
TRANSCRIPT
HERE’S WHERE YOU HAVE BEEN:
1. Digestion is a complex synergy of the physical actions of chewing, mixing, and moving and the chemical actions of saliva, enzymes, and emulsifi ers.
2. Absorption refers to the movement of nutri-ents from the digestive tract into the blood or lymphatic circulations, whereas the concept of bioavailability also includes the uptake and utili-zation of a nutrient by cells or tissues.
3. Perceptions of hunger and satiety involve mul-tiple hormonal and neurologic signals, includ-ing cholecystokinin, neuropeptide Y, ghrelin, obestatin, insulin, and leptin.
4. Different types of bacteria are found along the length of the digestive tract, depending on the environmental conditions of the segment and the properties of the bacterial species, with the highest concentration found in the colon.
CARBOHYDRATES: ENERGY, METABOLISM, AND MORE
HERE’S WHERE YOU ARE GOING:
1. Carbohydrates are a class of nutrients that includes sugars, starches, fi bers, and related molecules such as glycosaminoglycans, amino sugars, and more.
2. Key differences in covalent bonding make some carbohydrates more digestible than others.
3. Carbohydrates are absorbed as monosaccharides that circulate to tissue and are taken up by spe-cial glucose transporters.
4. Circulating glucose and stored glycogen are principal energy sources for most cells and tis-sue and are mandatory for others, such as red blood cells, as well as the brain under normal conditions.
5. Carbohydrate metabolism is regulated by hor-mones such as insulin, epinephrine, glucagon, and cortisol.
55
C H A P T E R
3
9781449689582_CH03.indd Page 55 10/22/13 10:40 AM f451 9781449689582_CH03.indd Page 55 10/22/13 10:40 AM f451 /201/JB00096/work/indd/201/JB00096/work/indd

of only carbon, hydrogen, and oxygen, but also the ratio of carbon to water was typically one to one (C:H2O). Thus, carbohydrate literally means “carbon with water.” To create energy-providing carbohydrates from the non-energy-providing molecules H2O and carbon diox-ide (CO2) is a talent bestowed only on plants and a select few microorganisms. In photosynthesis, plants couple H2O and CO2 by harnessing solar energy. Along with carbohydrates, molecular oxygen (O2) is also a product of this reaction:
H2O + CO2 Photosynthesis
C6H12O6 + O2
Chemically, carbohydrates are defi ned as polyhy-droxy aldehydes and ketones and their derivatives. Carbohydrates can vary from simpler three- to seven-carbon single-unit molecules to very complex branching polymers. Although hundreds of diff erent carbohydrates exist in nature, this text takes the simplest approach and groups them into just a few broad categories, namely, sugars (monosaccharides and disaccharides), oligosaccha-rides, and polysaccharides (Figure 3.1).
MonosaccharidesThe monosaccharides that are relevant to human nutri-tion may be classifi ed based on carbon number and include the trioses, tetroses, pentoses, and hexoses. Both aldoses (aldehydes) and ketoses (ketones) are present (Figure 3.2). The six-carbon hexoses are the most com-mon form of monosaccharides in the human diet. These include glucose, galactose, and fructose. Glucose is the principal carbohydrate found in human circulation and is often referred to as blood sugar.
IntroductionHow much carbohydrate and what type to eat is a consider-ation for many people as they plan their diet. For instance, some weight loss diet programs may restrict carbohydrates, whereas others may provide carbohydrates as more than 50% of total energy. Meanwhile, endurance athletes may derive a large portion of their total energy consumption from carbohydrates to optimize performance and recovery.
Although both myths and truths abound in relation to how much carbohydrate we need, it remains the greatest contributor to human energy intake, both in developed and underdeveloped countries worldwide. Moreover, the importance of carbohydrate is not limited simply to supply-ing energy. For instance, most dietary fi bers are classifi ed as carbohydrates. Although dietary fi ber does indeed provide a limited amount of energy to the body, its role in digestive operations and disease prevention is much more signifi cant. Meanwhile, carbohydrates such as glycosaminoglycans play structural roles, especially in connective tissue.
Because carbohydrate can be used for energy by all cells or be assimilated into energy stores or converted to other molecules, humans have several overlapping carbo-hydrate metabolic pathways, which also integrate with those for other nutrients, such as fatty acids and amino acids. This chapter describes and details the diff erent types of carbohydrates and their properties, food sources, digestion, and metabolism.
Carbohydrate Types and CharacteristicsThe term carbohydrate was coined long ago as scientists observed a consistent pattern in the chemical formula of most carbohydrates. Not only were they composed
FIGURE 3.1 Classifi cation System of Carbohydrates. Carbohydrates can be subclassifi ed as sugars, oligosaccharides, and polysaccharides.
Carbohydrate types
Monosaccharides
Glucose, fructose,galactose, ribose
Disaccharides
Simple sugars(1 or 2 monosaccharide units)
Oligosaccaharides(3–10 monosaccharide units)
Polysaccharides(>10 monosaccharide units)
Stachyose, raffinose,verbacose, etc.
Fiber andresistance starch
Starch andglycogen
Glycosaminoglycans
Sucrose, lactose,maltose
Amylose andamylopectin
Cellulose, pectin,hemicellulose, etc.
Chondroitin sulfate,hyaluronic acid, etc.
56 CHAPTER 3 | Carbohydrates: Energy, Metabolism, and More
9781449689582_CH03.indd Page 56 10/22/13 10:40 AM f451 9781449689582_CH03.indd Page 56 10/22/13 10:40 AM f451 /201/JB00096/work/indd/201/JB00096/work/indd

xylose, are common in some fi ber types, such as hemicel-lulose. Figure 3.3 presents several of the more common monosaccharides.
❚ Monosaccharide Structures
Although it is common to represent monosaccharides as straight-chain structures, in an aqueous environment there is a reaction between the aldehyde group (COOH) of carbon 1 and the hydroxyl group (OH) of carbon 5 (see Figure 3.3). This produces a hemiacetal group that allows for a cyclic structure, which naturally occurs almost all of the time. Many carbohydrates have the same chemi-cal formula but vary in structure, making them isomers. For instance, glucose, fructose, galactose, and mannose have diff erent structures but the same formula: C6H12O6.
FIGURE 3.2 Examples of D-Aldoses and D-Ketones Having Three to Six Carbons
D-Aldoses (Aldehydes) D-Ketoses (Ketones)
3 carbon
4 carbon
5 carbon
6 carbon
D-erythrose
HC
HCOH
HCOH
O
H2COH H2COH
D-threose
HC
HOCH
HCOH
O
D-glucose D-mannose D-galactose
HC
HCOH
HOCH
O
HCOH
HCOH
H2COH
HC
HOCH
HOCH
O
HCOH
HCOH
H2COH
HC
HCOH
HOCH
O
HOCH
HCOH
H2COH
D-ribose
HC
HCOH
HCOH
HCOH
O
H2COH
D-arabinose
HC
HOCH
HCOH
HCOH
O
H2COH
D-xylose
HC
HCOH
HOCH
HCOH
O
H2COH
D-glyceraldehyde
HC
HCOH
O
C O
H2COH
D-ribulose D-xylulose
H2COH
HCOH
C O
HCOH
H2COH
H2COH
HOCH
C O
HCOH
H2COH
D-erythrulose
H2COH
C O
HCOH
H2COH
dihydroxyacetone
H2COH
H2COH
D-fructose D-sorbose D-tagatose
H2COH
HOCH
C O
HCOH
HCOH
H2COH
H2COH
HCOH
C O
HOCH
HCOH
H2COH
H2COH
HOCH
C O
HOCH
HCOH
H2COH
Three-carbon trioses such as glyceraldehyde and dihy-droxyacetone are generally found as intermediary prod-ucts of metabolic pathways (e.g., glycolysis). Four-carbon tetroses include erythrose, threose, and erythrulose. Five-carbon pentoses include the aldoses (xylose, ribose, and arabinose) and the ketoses (xylulose and ribulose). Of specifi c interest is ribose, which is a component of the nucleic acids (DNA and RNA); its alcohol derivative, ribitol, is found as a component of the water-soluble vitamin ribofl avin. Also, high-energy phosphate com-pounds such as adenosine triphosphate (ATP), adeno-sine diphosphate (ADP), and adenosine monophosphate (AMP), as well as dinucleotides such as nicotinamide adenine dinucleotide (NAD) and nicotinamide adenine dinucleotide phosphate (NADP), all contain ribose as part of their chemical makeup. The other pentoses, especially
Carbohydrate Types and Characteristics 57
9781449689582_CH03.indd Page 57 10/22/13 10:40 AM f451 9781449689582_CH03.indd Page 57 10/22/13 10:40 AM f451 /201/JB00096/work/indd/201/JB00096/work/indd

FIGURE 3.3 Basic Structures of Nutritionally Signifi cant Monosaccharides
α-D-glucose
1CH
3CH
H2CH1C
O
OH
HH2C
3C
OH
HO
HO
HH4C OH
H5C OH
6CH2OH6CH2OH
C6H12O6
Hexose ChemicalFormula
Fisher Projection Cyclized Fisher Projection Haworth
C6H12O6
C6H12O6
6CH2OH
H4C
H5C
OH
O
OH
O
OH
OH
5
4 1
3 2
OH
HO
6CH2OH
O OH
OH
5
4
3
1
2
OHβ-D-galactose
1CH
3C
H2C
1CHO
OH
HO H
H2C
3C
OH
HO H4C HHO
H5C OH
6CH2OH 6CH2OH
HO 4C
H5C
H
O
HO
6CH2OH
1CH2OH
OH
OH
4
5 2
3
β-D-fructose
1CH2OH
3CH
2C
1CH2OH
O
HO
2C
3CH
HO
HOHO
H4C OH
H5C OH
6CH2OH 6CH2OH
H4C OH
H5C
O
O
Monosaccharide epimers have diff erences in their confi guration around only one carbon. A good example of this is the diff erence between glucose and galactose: their composition and molecular weights are the same, but the OH (hydroxyl) group on carbon 4 of the two compounds is diff erent (Figure 3.4). In contrast, galac-tose and mannose are not epimers because they have diff erences in their OH positioning at two carbons. Another example of monosaccharide epimers is com-pounds with a diff erence in confi guration around the carbonyl carbon; these are referred to as anomers. If the OH group around the carbonyl carbon is in the “down” position in a monosaccharide in the cyclic confi gura-tion, the epimer is given an a (alpha) designation. If the carbonyl carbon is in the “up” position, it is designated the b (beta) version. The diff erence between the a and b epimers becomes especially important in the bonding between monosaccharides and has a profound eff ect on
FIGURE 3.4 Carbohydrate D and L Isomers
H OH
O H
HO H
H OH
H OH
CH2OH
D-Glucose
HO H
O H
H OH
HO H
HO H
CH2OH
L-Glucose
O
HO H
H OH
H OH
CH2OH
CH2OH
D-Fructose
O
H OH
HO H
HO H
CH2OH
CH2OH
L-Fructose
the ability of human-produced enzymes to digest these carbohydrates.
❚ Monosaccharide D and L Series
When looking at a monosaccharide as a straight chain, the position of the hydroxyl group on the asymmetric
58 CHAPTER 3 | Carbohydrates: Energy, Metabolism, and More
9781449689582_CH03.indd Page 58 10/22/13 10:40 AM f451 9781449689582_CH03.indd Page 58 10/22/13 10:40 AM f451 /201/JB00096/work/indd/201/JB00096/work/indd
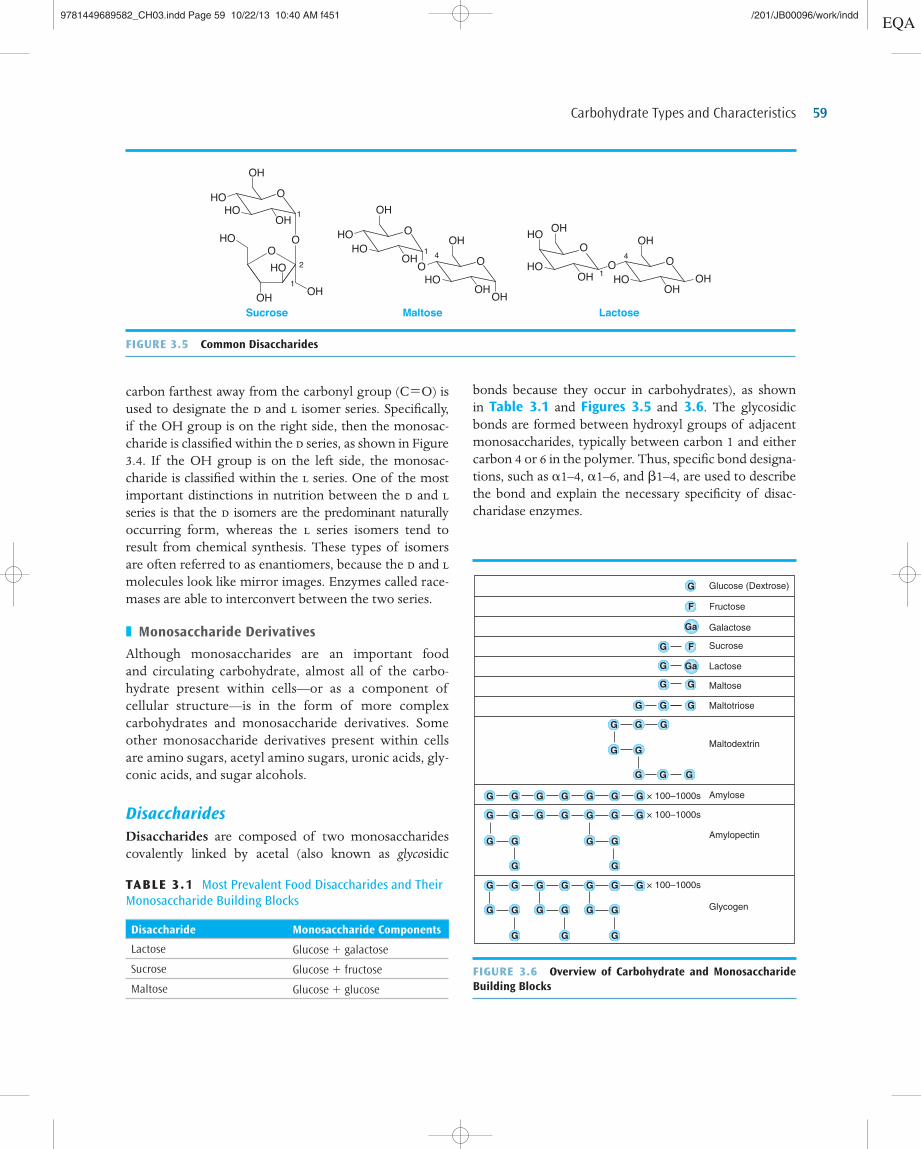
FIGURE 3.5 Common Disaccharides
MaltoseOH
HOO4
OH
OH
OH
O
HO O
OH 1HO
Lactose
OHHOO
OH
OHOH
O
HOO
OHHO 1
4
Sucrose
2
1
1
OH
O
HO O
OHHO
OH
HO
OH
OHO
TABLE 3.1 Most Prevalent Food Disaccharides and Their Monosaccharide Building Blocks
Disaccharide Monosaccharide Components
Lactose Glucose 1 galactose
Sucrose Glucose 1 fructose
Maltose Glucose 1 glucose
carbon farthest away from the carbonyl group (C5O) is used to designate the d and l isomer series. Specifi cally, if the OH group is on the right side, then the monosac-charide is classifi ed within the d series, as shown in Figure 3.4. If the OH group is on the left side, the monosac-charide is classifi ed within the l series. One of the most important distinctions in nutrition between the d and l series is that the d isomers are the predominant naturally occurring form, whereas the l series isomers tend to result from chemical synthesis. These types of isomers are often referred to as enantiomers, because the d and l molecules look like mirror images. Enzymes called race-mases are able to interconvert between the two series.
❚ Monosaccharide Derivatives
Although monosaccharides are an important food and circulating carbohydrate, almost all of the carbo-hydrate present within cells—or as a component of cellular structure—is in the form of more complex carbohydrates and monosaccharide derivatives. Some other monosaccharide derivatives present within cells are amino sugars, acetyl amino sugars, uronic acids, gly-conic acids, and sugar alcohols.
DisaccharidesDisaccharides are composed of two monosaccharides covalently linked by acetal (also known as glycosidic
bonds because they occur in carbohydrates), as shown in Table 3.1 and Figures 3.5 and 3.6. The glycosidic bonds are formed between hydroxyl groups of adjacent monosaccharides, typically between carbon 1 and either carbon 4 or 6 in the polymer. Thus, specifi c bond designa-tions, such as a1–4, a1–6, and b1–4, are used to describe the bond and explain the necessary specifi city of disac-charidase enzymes.
FIGURE 3.6 Overview of Carbohydrate and Monosaccharide Building Blocks
G Glucose (Dextrose)
Fructose
Galactose
Sucrose
Lactose
Maltose
Maltotriose
Amylose
Amylopectin
Glycogen
Maltodextrin
× 100–1000s
× 100–1000s
× 100–1000s
F
FG
Ga
Ga
GG
GGG
GGG
G
G G G G G G G
G G G G G G
G G G G
G G
G
G G G
G
G
G G G G G G G
G G G G G G
G G G
Carbohydrate Types and Characteristics 59
9781449689582_CH03.indd Page 59 10/22/13 10:40 AM f451 9781449689582_CH03.indd Page 59 10/22/13 10:40 AM f451 /201/JB00096/work/indd/201/JB00096/work/indd

TABLE 3.2 Sweetness of Sugars and Alternative Sweeteners
Type of SweetenerRelative Sweetness Compared
with Sucrose (Table Sugar) Typical Dietary Sources
Sugars
Lactose 0.2 Dairy
Maltose 0.4 Sprouted seeds
Glucose 0.7–0.8 Corn syrup, fruits
Sucrose 1.0 Table sugar, fruits
Fructose 1.4 Fruits, honey
HFCS 1.2–1.6 Soft drinks, beverages
Sugar alcohols
Sorbitol 60 Dietetic candies, sugarless gum
Mannitol 70 Dietetic candies
Erythritol 70 Sugarless candies, supplements, sweetener
Xylitol 90 Sugarless gum
Natural sweeteners
Stevia 300 Sweetener used in tabletop packs and in foods and supplements
Artifi cial sweeteners
Aspartame (NutraSweet) 180 Diet soft drinks and fruit drinks, powdered sweetener
Acesulfame-K 200 Sugarless gum, diet drink mixes, powdered sweetener, gelatin and puddings
Saccharin 300 Diet soft drinks, powdered sweetener
Sucralose 600 Beverages, baked goods, candies, breakfast and protein bars
HFCS, high-fructose corn syrup.
The three most common disaccharides are sucrose, lactose, and maltose. Sucrose, which is composed of fruc-tose and glucose, is commonly referred to as “cane sugar,” “beet sugar,” or “table sugar.” Lactose, or “milk sugar,” is composed of glucose and galactose; this sugar contrib-utes energy to mammalian milk, aids in the absorption of calcium, and supports the growth of benefi cial bacteria in the large intestine. Maltose is composed of two glucose units. Maltose is found only for a brief time in the life of a plant, usually in the seed; however, it is also an intermedi-ate product of the digestion of more complex carbohy-drates (starch) in the gut as well as the partial hydrolysis of starch in ingredient processing and production of some foods, such as beer and malt liquors.
Of the disaccharides mentioned previously, only lac-tose is derived from animals. The remaining two disac-charides are derived from plants. The term sugar is often applied to monosaccharides and disaccharides. These
carbohydrates have a sweet taste, with fructose being the sweetest. Table 3.2 presents the relative sweetness of the sugars, along with common natural and artifi cial sweet-eners, such as stevia and sucralose, respectively.
PolysaccharidesPolysaccharides are composed of repeating monosac-charide units, most commonly glucose (Figure 3.6). Although their length may vary, they are rather long, and the covalent bonds in the primary structure are found between carbons 1 and 4. For branched polysaccharides, a bond is typically found between carbons 1 and 6 if hex-oses are the monosaccharides involved. These bond types are depicted in Figure 3.7. The position of the bonds, known as either the a or b confi guration, determines the properties and digestive fate of these compounds because of the ability of digestive enzymes to recognize
60 CHAPTER 3 | Carbohydrates: Energy, Metabolism, and More
9781449689582_CH03.indd Page 60 10/22/13 10:40 AM f451 9781449689582_CH03.indd Page 60 10/22/13 10:40 AM f451 /201/JB00096/work/indd/201/JB00096/work/indd

FIGURE 3.7 a1–4 and a1–6 Links Between Glucose of Starch Components Such as Amylopectin
α1–6
α1–4
O
CH2OH
C O
OH
C
HC
HH
C
H
C
OH
H
CH2OH
C O
OH
C
HC
O
(etc.)
HH
C
OH
H
O
C
H
CH2OH
C O
OH
C
HC
HH
C
OH
H
O O
C
H
CH2OH
C O
OH
C
HC
HH
C (etc.)
H
C
OH
H
α1–4
O
CH2OH
C O
OH
C
HC
HH
C
H
C
OH
H
CH2OH
C O
OH
C
HC
O
(etc.)
HH
C
OH
H
O
C
H
CH2OH
C O
OH
C
HC
HH
C
OH
H
O
C
H
CH2OH
C O
OH
C
HC
HH
C
H
C
OH
H
O
CH2OH
C O
OH
C
HC
HH
C
H
C
OH
H
CH2OH
C O
OH
C
HC
O
(etc.) (etc.)
HH
C
OH
H
O
C
H
CH2OH
C O
OH
C
HC
HH
C
OH
H
O
C
H
CH2OH
C O
OH
C
HC
HH
C
OH
H
O O
C
H
CH2OH
C O
O
OH
C
HC
HH
C
H
C
OH
H
O
CH2OH
C O
OH
C
HC
HH
C
H
C
OH
H
CH2OH
C O
OH
C
HC
O
(etc.)
HH
C
OH
H
C
H
O
Amylose
Amylopectin
only a particular confi guration. There are several types of polysaccharides, which are simplifi ed here into several categories: oligosaccharides, starch, glycogen, glycosami-noglycans, and fi ber (see Figure 3.1).
❚ Oligosaccharides
Oligosaccharides are composed of 3 to 10 monosaccha-rides linked by glycosidic bonds between the OH groups of adjacent monomeric units (see Figure 3.7). Stachyose, verbascose, and raffi nose are oligosaccharides whose metabolic fate is somewhat diff erent from other oligosac-charides in that they are primarily fermented by bacteria
in the colon. This property has resulted in their claim to fame as fl atulence producers. Legumes (beans) have appreciable levels of these oligosaccharides.
❚ Plant Starch
One of the most common polysaccharides on the planet is starch, which serves primarily as a storage form of car-bohydrate in plants. Starch can be one long chain or can be branched. Starch is referred to as a homopolysaccharide because it contains only glucose monomers linked via a1–4 and a1–6 glycosidic linkages. Starch is also referred to as a glucan because it only yields glucose when it is broken down.
Carbohydrate Types and Characteristics 61
9781449689582_CH03.indd Page 61 10/22/13 10:40 AM f451 9781449689582_CH03.indd Page 61 10/22/13 10:40 AM f451 /201/JB00096/work/indd/201/JB00096/work/indd
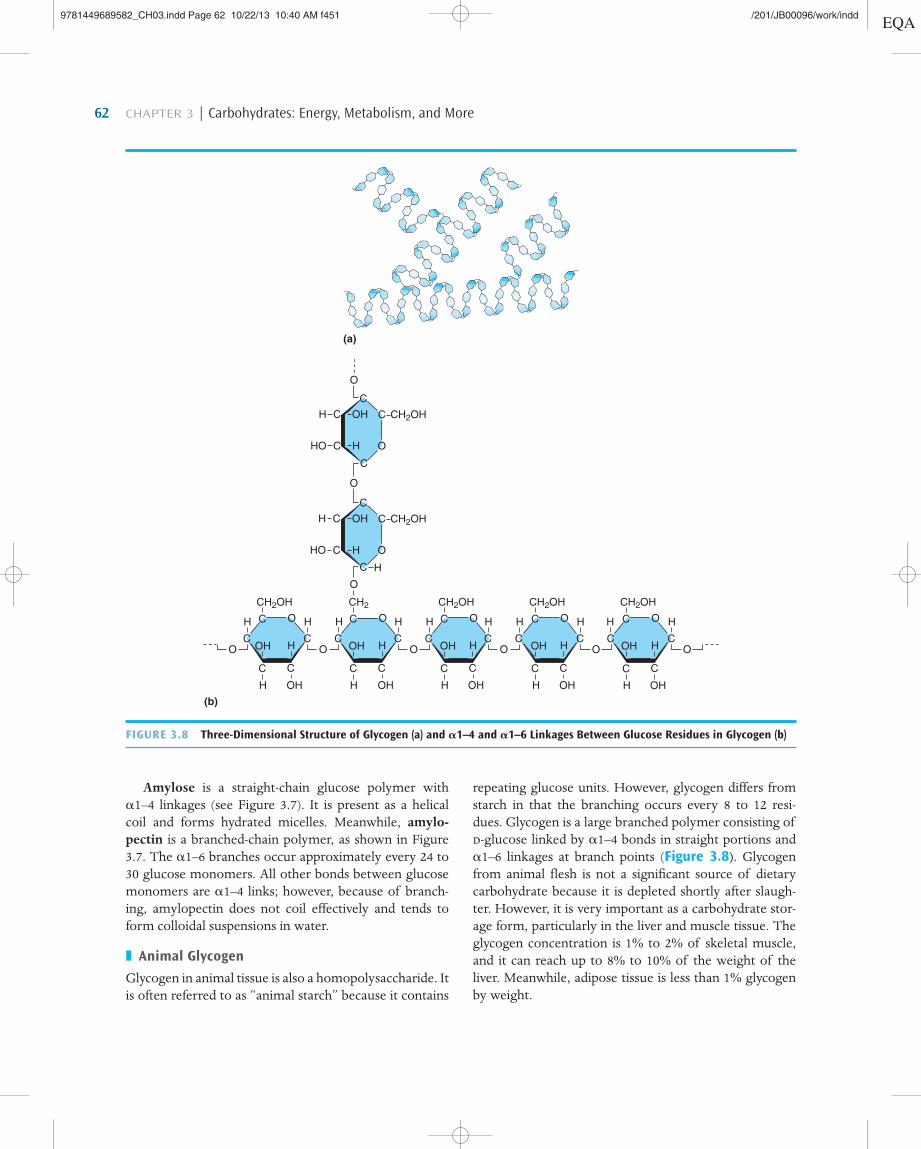
FIGURE 3.8 Three-Dimensional Structure of Glycogen (a) and a1–4 and a1–6 Linkages Between Glucose Residues in Glycogen (b)
(a)
(b)
O
C
H
O
OO
O
OHCH
HCHO O
C
C
CH2OH
OHCH
HCHO O
C
C
CH2OH
CH2OH
H
C
H
C
H
H
OH
OH
H
O H
O O O
C
C
C
H
OH
OH
H
O
C
C
C
H
OH
OH
H OHH OHH
O
C C
CH2OH
C
CH2
HOH
O
C C
HOH
O
C C
C
H
C C
H
CCO
H
C
H
C
H
C
H
C
CH2OH
C
CH2OH
C
Amylose is a straight-chain glucose polymer with a1–4 linkages (see Figure 3.7). It is present as a helical coil and forms hydrated micelles. Meanwhile, amylo-pectin is a branched-chain polymer, as shown in Figure 3.7. The a1–6 branches occur approximately every 24 to 30 glucose monomers. All other bonds between glucose monomers are a1–4 links; however, because of branch-ing, amylopectin does not coil eff ectively and tends to form colloidal suspensions in water.
❚ Animal Glycogen
Glycogen in animal tissue is also a homopolysaccharide. It is often referred to as “animal starch” because it contains
repeating glucose units. However, glycogen diff ers from starch in that the branching occurs every 8 to 12 resi-dues. Glycogen is a large branched polymer consisting of d-glucose linked by a1–4 bonds in straight portions and a1–6 linkages at branch points (Figure 3.8). Glycogen from animal fl esh is not a signifi cant source of dietary carbohydrate because it is depleted shortly after slaugh-ter. However, it is very important as a carbohydrate stor-age form, particularly in the liver and muscle tissue. The glycogen concentration is 1% to 2% of skeletal muscle, and it can reach up to 8% to 10% of the weight of the liver. Meanwhile, adipose tissue is less than 1% glycogen by weight.
62 CHAPTER 3 | Carbohydrates: Energy, Metabolism, and More
9781449689582_CH03.indd Page 62 10/22/13 10:40 AM f451 9781449689582_CH03.indd Page 62 10/22/13 10:40 AM f451 /201/JB00096/work/indd/201/JB00096/work/indd

❚ Glycosaminoglycans
Another class of polysaccharides is the glycosaminogly-cans, which are sometimes called mucopolysaccharides. Glycosaminoglycans are characterized by their content of amino sugars and uronic acids, which occur in com-bination with proteins in body secretions and structures. These polysaccharides are responsible for the viscosity of body mucous secretions. They are components of extra-cellular amorphous ground substances surrounding col-lagen and elastin fi bers and cells of connective tissues and bone. These molecules hold onto large amounts of water and occupy space, which allows for some cushioning and lubrication. Some examples of glycosaminoglycans are hyaluronic acid and chondroitin sulfate.
Dietary Fiber Dietary fi ber is plant material, both polysaccharide and lignin, that is resistant to human digestive enzymes. Another descriptor used for these molecules is nonstarch polysaccharides (NSPs); however, this categorization would not include lignin. Dietary fi ber has long been classifi ed as either soluble or insoluble, based on its pro-pensity to dissolve in water. Soluble fi bers include pectin (pectic substances), gums, and mucilages. Insoluble fi bers are composed of cellulose, hemicellulose, lignin, and modifi ed cellulose. In addition, some fi bers have been grouped together as functional fi bers based on whether they have been isolated, extracted, or manufactured and potentially promote health when consumed in regularly and at effi cacious levels. More recently, the classifi cation of fi bers has shifted to either dietary fi ber or functional fi ber as described in Chapter 4.
Carbohydrate Intake, Food Sources, and RecommendationsCarbohydrate consumption has become one of the prin-cipal dietary issues for many people, ranging from ath-letes to people trying to lose weight or to control blood sugar levels. Carbohydrate in the form of glucose serves as the most basic energy source for all cells in the body. Foods high in carbohydrates include breads, pastas, pota-toes, rice, and fruits. Legumes are also a good source of carbohydrate. Legumes are plants that have a single row of seeds in their pods. The foods commonly called legumes, such as peas, green beans, lima beans, pinto beans, black-eyed peas, garbanzo beans, lentils, and soy-beans, are often the seeds of legume plants. Dairy foods and vegetables are also good sources of carbohydrates, whereas meats, eggs, and plant oils are not.
Carbohydrate ConsumptionDuring preagricultural times, carbohydrate intake largely came by way of fruits, vegetables, leaves, and tubers. Today, industrial processing has increased the consump-tion of cereal grains, especially milled grains, as well as refi ned sugar cane through the mass production of sucrose (table sugar). Within many developed countries, the 20th century heralded changes in the types of carbo-hydrates consumed as well as carbohydrate’s contribution to total energy intake. In the United States, carbohydrate consumption was approximately 500 grams daily at the beginning of the 20th century; it declined to 374 grams in the 1960s largely because of a decrease in consumption of cereal grains. From there, carbohydrate consumption increased steadily during the last four decades of the 20th century to about the same level as seen nearly 100 years earlier. However, much of the carbohydrate that returned to the diet was in the form of refi ned carbohydrates, such as sugary products, and thus was lacking fi ber and many other benefi cial nutrients. Today the caloric contribution of carbohydrate to the adult diet is roughly 50% and is derived from a variety of foods. Table 3.3 lists the gen-eral carbohydrate content (by weight) of select foods.
BEFORE YOU GO ON . . .
1. What are the key differences between monosaccharides, disaccharides, and polysaccharides?
2. Which monosaccharides are found in the differ-ent disaccharides, oligosaccharides, and starch?
3. How does plant starch differ from animal gly-cogen, and why is this important?
4. What is the nature of the links (chemical bonds) between monosaccharides in disac-charides and polysaccharides, and why is this signifi cant?
5. What are glycosaminoglycans, and where are they found in the human body and in other life forms?
Carbohydrate Intake, Food Sources, and Recommendations 63
9781449689582_CH03.indd Page 63 10/22/13 10:40 AM f451 9781449689582_CH03.indd Page 63 10/22/13 10:40 AM f451 /201/JB00096/work/indd/201/JB00096/work/indd

FIGURE 3.9 Structure of a Grain of Wheat and Some of the Major Nutrients Found in Different Regions
Endosperm (starch)
Bran (fiber)
Germ (vitamins and minerals)
Husk
TABLE 3.3 Carbohydrate Content of Select Foodsa
Food Carbohydrate (%)
Table sugar* .98b
Ice cream, cake, pie 20–40
Fruits/vegetables 5–20
Nuts 10–15
Peanut butter ~20
Milk 5
Cheese 2–5
Shellfi sh (e.g., crab, lobster) ,1
Fish ,1
Butter 0
Oil 0
aPercentage based on weight.bRemaining mass is moisture.
❚ Monosaccharides and Disaccharides
Glucose is found in some foods in a free form, especially in ripening fruits and vegetables, although the majority of the glucose in the human diet is derived from the digestion of disaccharides and starch. Galactose is also found free in some foods, but to a relatively small degree. Most of the galactose in the human diet is derived from the digestion of the disaccharide lactose, which is found in milk and dairy foods. Fructose is found naturally in fruits and honey and is also derived from the disaccharide sucrose.
Fruits may be somewhat deceiving; according to Table 3.3, their carbohydrate content is roughly 5% to 20%. However, because water makes up most of the remaining weight, carbohydrate is the major nonwater content of fruits. Cereal grains and products such as rice, oats, pastas, and breads also have a relatively high carbohydrate content, whereas animal foods such as meats, fi sh, and poultry (and eggs) contain very little. Animal fl esh (skeletal muscle) does contain a little carbohydrate, primarily as glycogen; however, this is lost during the processing of the meat. Milk and some dairy products (e.g., yogurt, ice cream) are the only signifi -cant animal-derived sources of carbohydrate.
Ripened fruits contain mostly monosaccharides and disaccharides, namely, fructose and glucose, as well as some sucrose. For example, a medium apple contains about 8 grams of fructose and 3 grams of both glucose and sucrose. Meanwhile, a medium banana contains between 5 and 6 grams of both fructose and glucose and 2 grams of sucrose. One tablespoon of honey contains 8 grams of fructose and 7 grams of glucose and less than 1 gram of sucrose, galactose, and maltose combined.
❚ Sugars and Caloric Sweeteners
Caloric sweeteners (added sugars) include glucose, sucrose, corn starch, and high-fructose corn syrup (HFCS). The U.S. Department of Agriculture (USDA) estimated the consumption of caloric sweeteners at 153 pounds per adult at the turn of the 21st century. Sugar can be considered the number one food additive; it is found in many foods, such as pizza, bread, hot dogs, boxed mixed rice, soup, crackers, spaghetti sauce, lunch meat, canned vegetables, fruit drinks, fl avored yogurt, ketchup, salad dressing, mayonnaise, and some peanut butters. Carbonated sodas provided more than one-fi fth (22%) of the added sugars in the American food supply in 2000, compared with 16% in 1970. Fructose is also pro-vided in the human diet in the form of the popular food sweetening agent HFCS, which tends to be more than 60% fructose. As dietary consumption of fructose has increased over the past several decades there is growing concern that higher consumption of fructose might be partly responsible for the increasing incidence of obesity worldwide.
❚ Cereal Grains
Grains are among the richest sources of starch, as are legumes. In cereal grains, most of the starch is found within the endosperm compartment, as depicted in Figure 3.9. About 15% to 20% of the starch in the American diet is attributed to amylose. Amylopectin con-stitutes about 80% to 85% of the starch in the American diet. As mentioned previously, the level of consumption of cereal grains decreased in the 20th century.
64 CHAPTER 3 | Carbohydrates: Energy, Metabolism, and More
9781449689582_CH03.indd Page 64 10/22/13 10:40 AM f451 9781449689582_CH03.indd Page 64 10/22/13 10:40 AM f451 /201/JB00096/work/indd/201/JB00096/work/indd
younger is 38 grams per day for men and 25 grams per day for women. For adults older than 50 years, the recom-mendation is 30 grams per day for men and 21 grams per day for women, or 14 grams per 1,000 calories consumed. Meanwhile, the World Health Organization recommends 25 to 40 grams of fi ber daily for adults.
❚ Fiber
The amount of fi ber present within the human diet can vary geographically as well as by gender. In some devel-oped countries, such as the United States, fi ber consump-tion is relatively lower than in other societies. The average intake of fi ber in the United States is only about 12 and 18 grams daily for women and men, respectively, which is well below recommendations. Americans consume a diet in which less than one-half of their carbohydrate intake comes from fruits, vegetables, and whole grains. Meanwhile, some African societies consume as much as 50 grams of fi ber daily.
Carbohydrate RecommendationsAs part of the Dietary Reference Intakes (DRIs), the Acceptable Macronutrient Distribution Range (AMDR) for carbohydrate intake in the United States and Canada is 45% to 65% of total energy. The range allows for diff erent people to plan their dietary carbohydrate level based on diff erent lifestyles and ability to metabolize food carbohy-drates. Individuals are also advised to derive more of the carbohydrate they consume from more nutrient-dense sources such as whole grain products, legumes, lower-fat dairy foods, and fruits and vegetables. These foods pro-vide vitamins, minerals, fi ber, and phytochemicals that promote health and wellness.
The DRI for carbohydrate energy has been set at 130 grams per day for all people older than 1 year. This would provide 520 calories of energy, which is important to the central nervous system, red blood cells, and other tissue dependent on glucose as its primary energy source. The DRI for carbohydrate energy would be adequate to prevent ketosis in most people. It is important to note that the DRI recommendation does not take into consideration exercise and the additional calorie needs of working muscle.
As part of the DRIs it is recommended that the intake of added sugar not exceed 25% of calories. However, some healthcare professionals would like to see the level lowered because of the link between diets higher in added sugars and excessive calorie consumption and obesity. The USDA recommends that for an average adult woman consum-ing 2,000 calories, the amount that would support weight maintenance, the level of added sugar not exceed 40 grams. That level of added sugar (roughly 10 teaspoons) is the amount of sugar in 12 to 16 ounces of some soft drinks.
Dietary FiberThe current Adequate Intake (AI) recommendation for total fi ber intake for adults who are 50 years old and
BEFORE YOU GO ON . . .
1. How has the intake of carbohydrate changed over the last 100 years, and what are the current trends?
2. What foods provide different types of carbohydrates, and how much carbohydrate do they contain?
3. What is the current recommended limit for added sugar, and what types of foods contain it?
4. What is the AMDR for carbohydrate intake in the United States and Canada, and how could it be applied to different people?
5. How does the average intake of fi ber by American adults compare with recommenda-tions, and what impact might that have on health?
Carbohydrate Digestion and AbsorptionThe objective of carbohydrate digestion is to liberate monosaccharides from disaccharides and more complex polymers. This activity begins in the mouth, because salivary secretions contain an amylase enzyme. The digestive impact of salivary amylase is short-lived, yet signifi cant. After oral contents are swallowed, they tra-verse the esophagus and depot in the stomach. The opti-mal pH range for amylase activity is approximately 6.6 to 6.8. Therefore, once the swallowed contents are thor-oughly mixed with the highly acidic gastric juice, amy-lase activity ceases. Virtually no carbohydrate digestion occurs in the gastric juice. Although some acid hydro-lysis of sucrose may occur, it is not considered physi-ologically signifi cant. Carbohydrate digestion picks up in the small and large intestines, with most of the monosaccharides being absorbed in the small intestine. Figure 3.10 provides an overview of the carbohydrate digestion events taking place in the diff erent parts of the digestive tract.
Carbohydrate Digestion and Absorption 65
9781449689582_CH03.indd Page 65 10/22/13 10:40 AM f451 9781449689582_CH03.indd Page 65 10/22/13 10:40 AM f451 /201/JB00096/work/indd/201/JB00096/work/indd

are hydrolyzed to monosaccharides, the products are therefore in close proximity to the transport proteins. Enterocytes lining the villi of the small intestine contain disaccharidases, namely maltase, lactase, and sucrase, as well as a-dextrinase. These enzymes are associated with microvilli plasma membranes, as shown in Figure 3.11.
Disaccharidases may not always be present in suffi -cient amounts to handle the digestion of disaccharides in the gut. This leads to an accumulation of the undigested disaccharide and the potential for disaccharide intoler-ance, with symptoms including diarrhea resulting from the increased osmotic pressure in the lumen of the gut. Furthermore, bacterial fermentation of the disaccharides can result in common symptoms such as fl atulence, nau-sea, and bloating. This is the case in lactose intolerance (see Special Feature 3.1).
Starch and DisaccharidesThe major carbohydrate digestive enzyme in the small intestine is a-amylase, which is secreted by acinar cells of the pancreas. Both salivary and pancreatic amylase hydro-lyze the a1–4 glycosidic linkages such that the starch consumed in a diet is converted sequentially to maltose, maltotrioses, a-dextrins, and some trace glucose. With respect to branched starch, a mixture of dextrins is gen-erated, averaging six glucose residues per molecule and containing a1–6 linkages. These linkages are hydrolyzed by a brush border enzyme referred to as a-dextrinase or isomaltase.
The reaction that breaks down starch into a-dextrins, maltose, and maltotrioses occurs in the intestinal lumen. The remainder of carbohydrate digestion is believed to occur along the intestinal surface. When the sugars
FIGURE 3.10 Key Events Involved in Carbohydrate Digestion in Different Parts of the Digestive Tract
Where Source of digestivechemicals or enzymes
Digestive chemical or enzyme Digestive products
Key
Salivaryglands
Bacteria
Pancreas
Salivaryamylase
Pancreaticamylase
Acid
MaltaseSucraseLactaseα-dextrinase
Starch
Fiber
Maltose
Fructose
Galactose
Fatty Acids
Gas
Microvilli
Mouth
Largeintestine
Smallintestine
StomachStomach acid
stopscarbohydrate
digestion
66 CHAPTER 3 | Carbohydrates: Energy, Metabolism, and More
9781449689582_CH03.indd Page 66 10/22/13 10:40 AM f451 9781449689582_CH03.indd Page 66 10/22/13 10:40 AM f451 /201/JB00096/work/indd/201/JB00096/work/indd

SPECIAL FEATURE 3.1
Lactose IntoleranceAny medical situation that damages the intestinal mucosa by preventing cell proliferation of the enterocytes, such as protein energy malnutrition or celiac disease, can produce a brush border enzyme defi ciency. The most well-known and widespread disaccharidase defi ciency condition is lactase defi -ciency, which produces lactose intolerance. Lactase defi ciency has been reported in approximately 55% of Mexican American males, 74% of adult Mexicans from rural Mexico, 45% of Greeks, 56% of Cretans and 66% of Greek Cypriots, 68.8% of Jewish individuals living in North America, 50% of Indian adults and 20% of Indian children, 45% of African American children, and 80% of Alaskan Eskimos. Caucasians and those of Scandinavian descent normally have a lower prevalence of lactose intoler-ance than Asian adults. In fact, there are more individuals who are lactose intolerant than lactose tolerant.
Lactase begins to be synthesized in fetal life and is at its maximal activity at birth. At the time of weaning, lactase activity may have dropped to about 90% of the level of activ-ity at birth. The decline in lactase activity is not a function of lactose in the diet, as was once popularly believed. It is more
likely a genetically controlled event. Individuals who are tol-erant are thought to have inherited the gene as a dominant gene from a genetic mutation. Those individuals who have the enzyme are descendants of some African and Middle Eastern tribes and Northern Europeans. Also the genetic adaptation is thought to be related to the development of dairy farming in these regions.
Despite the problem of lactose intolerance, milk con-sumption need not be discouraged in susceptible popula-tions. In most studies, 250 milliliters (approximately 1 cup) of milk, which normally contains 12 grams of lactose, does not cause adverse effects. The drinking of milk by children should not be discouraged unless it causes severe diarrhea. Dairy products in which the lactose is prehydrolyzed, or in which Lactobacillus acidophilus was added during process-ing to hydrolyze the lactose, are available. Lactase enzyme tablets can also be added to milk to help digest the lactose. Fermented foods such as yogurt have bacteria that can digest lactose. Foods such as cottage cheese and aged ched-dar cheese contain low levels of lactose and are not likely to produce problems.
Small Intestine
Maltase
Enterocyte
α-DextrinaseSucrase
α-Dextrins
MaltoseSucrose
GLUT5
Na+
Na+
Na+
Na+
K+
K+K+
GLUT2
HepaticPortal Vein
SGLT1Lactase
Key
GLUT2
GlucoseGalactoseFructose
LactoseGalactose & Glucose
Na+K+
ATPase
FIGURE 3.11 Absorption of Glucose and Galactose Across the Small Intestinal Mucosa. Both glucose and galactose bind to a transmembrane protein (SGLT1) that also binds sodium. The energy from sodium moving down its concentration gradient is suffi cient to transport glucose into the cell against its concentration gradient. Sodium is then pumped out of the cell by adenosine triphosphatase (ATPase).
Carbohydrate Digestion and Absorption 67
9781449689582_CH03.indd Page 67 10/22/13 10:41 AM f451 9781449689582_CH03.indd Page 67 10/22/13 10:41 AM f451 /201/JB00096/work/indd/201/JB00096/work/indd
Carbohydrate Circulation and Cellular Uptake All cells can use glucose for energy purposes. This means that glucose must have a means of crossing the plasma membrane. Also, because carbohydrate can be used as an immediate source of energy, stored as glycogen or fat, or used to make certain amino acids or other molecules, sev-eral factors must direct its use inside of cells. This section provides an overview of the major metabolic pathways involved in carbohydrate metabolism.
Blood Glucose Regulation Glucose must continuously circulate in the blood in order to serve as a fuel resource for cells. A blood glucose con-centration of 70 to 110 milligrams per 100 milliliters is typical in a fasting state. This would equate to roughly 5 grams of glucose in circulation given a total blood vol-ume of 5.5 liters. However, the level of circulating glu-cose can increase after eating a meal or decrease during fasting based on changes in supply and demand. Several hormones are employed to control blood glucose levels, with the most signifi cant being insulin, glucagon, epi-nephrine, and cortisol.
Insulin promotes cellular events that work to lower blood glucose level when it is elevated (hyperglycemia). Meanwhile, glucagon, epinephrine, and cortisol coor-dinate tissue operations in an attempt to raise blood glucose level when it declines (hypoglycemia), such as during fasting and times of increased glucose demand (e.g., exercise, stress). By and large, these hormones and other factors control blood glucose levels by regulating metabolic pathways involved in glycogen production and
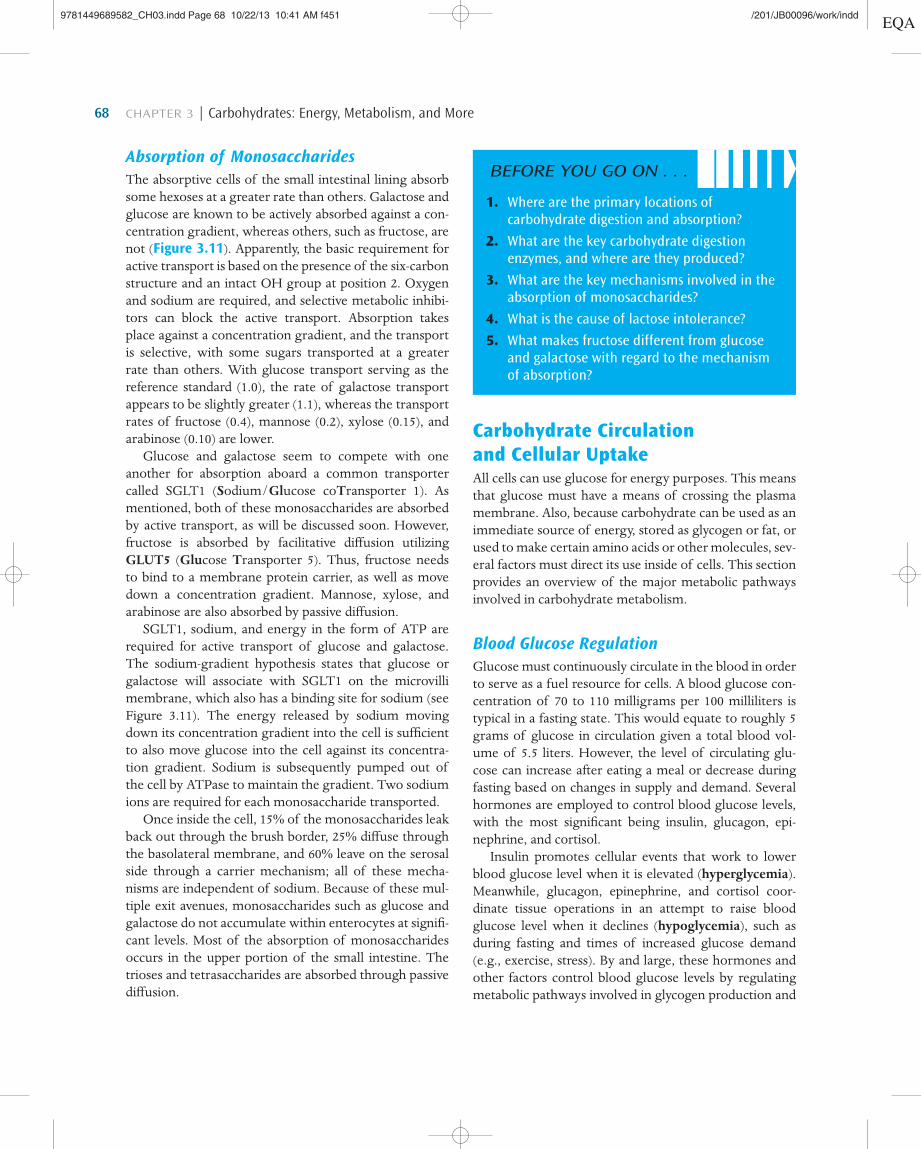
Absorption of MonosaccharidesThe absorptive cells of the small intestinal lining absorb some hexoses at a greater rate than others. Galactose and glucose are known to be actively absorbed against a con-centration gradient, whereas others, such as fructose, are not (Figure 3.11). Apparently, the basic requirement for active transport is based on the presence of the six-carbon structure and an intact OH group at position 2. Oxygen and sodium are required, and selective metabolic inhibi-tors can block the active transport. Absorption takes place against a concentration gradient, and the transport is selective, with some sugars transported at a greater rate than others. With glucose transport serving as the reference standard (1.0), the rate of galactose transport appears to be slightly greater (1.1), whereas the transport rates of fructose (0.4), mannose (0.2), xylose (0.15), and arabinose (0.10) are lower.
Glucose and galactose seem to compete with one another for absorption aboard a common transporter called SGLT1 (Sodium/Glucose coTransporter 1). As mentioned, both of these monosaccharides are absorbed by active transport, as will be discussed soon. However, fructose is absorbed by facilitative diff usion utilizing GLUT5 (Glucose Transporter 5). Thus, fructose needs to bind to a membrane protein carrier, as well as move down a concentration gradient. Mannose, xylose, and arabinose are also absorbed by passive diff usion.
SGLT1, sodium, and energy in the form of ATP are required for active transport of glucose and galactose. The sodium-gradient hypothesis states that glucose or galactose will associate with SGLT1 on the microvilli membrane, which also has a binding site for sodium (see Figure 3.11). The energy released by sodium moving down its concentration gradient into the cell is suffi cient to also move glucose into the cell against its concentra-tion gradient. Sodium is subsequently pumped out of the cell by ATPase to maintain the gradient. Two sodium ions are required for each monosaccharide transported.
Once inside the cell, 15% of the monosaccharides leak back out through the brush border, 25% diff use through the basolateral membrane, and 60% leave on the serosal side through a carrier mechanism; all of these mecha-nisms are independent of sodium. Because of these mul-tiple exit avenues, monosaccharides such as glucose and galactose do not accumulate within enterocytes at signifi -cant levels. Most of the absorption of monosaccharides occurs in the upper portion of the small intestine. The trioses and tetrasaccharides are absorbed through passive diff usion.
BEFORE YOU GO ON . . .
1. Where are the primary locations of carbohydrate digestion and absorption?
2. What are the key carbohydrate digestion enzymes, and where are they produced?
3. What are the key mechanisms involved in the absorption of monosaccharides?
4. What is the cause of lactose intolerance?
5. What makes fructose different from glucose and galactose with regard to the mechanism of absorption?
68 CHAPTER 3 | Carbohydrates: Energy, Metabolism, and More
9781449689582_CH03.indd Page 68 10/22/13 10:41 AM f451 9781449689582_CH03.indd Page 68 10/22/13 10:41 AM f451 /201/JB00096/work/indd/201/JB00096/work/indd

breakdown, glucose utilization for energy, and glucose production from other energy molecules. The term eu-glycemia is used to denote the achievement and main-tenance of an optimal fasting blood glucose level despite changing nutrition and metabolic states.
Glycemic IndexGlycemic index has become an important concept in gen-eral nutrition. Simply put, glycemic response refers to the degree and duration to which blood glucose level is elevated after consuming a portion of food that would provide 50 grams of digestible (available) carbohydrates and measured (the area under the curve [AUC]) for the next 2 hours following the meal (Figure 3.12). The glycemic index of a food is simply the comparison of its glycemic response to a food standard based on studies of healthy people. Glucose and white bread are used as the standards. For instance, if a food raises blood glucose level to 50% of the rise caused by glucose, then the glyce-mic index of that food is 50. Table 3.4 lists the glycemic index of several foods.
Because there are obvious diff erences between white bread and pure glucose, glycemic indexes determined for foods using these diff erent standards can vary. The gly-cemic index scale is 0 to 100 when using glucose as the standard; this scale is more common because it is easier to understand and apply. Meanwhile, when white bread is used as the standard, the scale can be a little less user-friendly, because some foods, such as baked potatoes, rice cakes, and many breakfast cereals, will have a glycemic index exceeding 100.
The glycemic index of a food is infl uenced by several factors, including carbohydrate type and other nutrients that can infl uence rate of digestion or absorption. Because only half of the monosaccharide units in lactose and sucrose are glucose, whereas all of the monosaccharides in starch are glucose, this suggests that “starchy” foods such as a baked potato might have a higher glycemic index than milk and dairy foods and many “sugary” foods such as candies. Fruits and honey with high fructose content only have a moderate impact on blood glucose. Meanwhile, the level of protein, fat, and fi ber in a food can lower the gly-cemic index of a food by slowing the rate of digestion and absorption of monosaccharides. If monosaccharides are absorbed more slowly, there is more opportunity for the liver to remove them before they reach the general circula-tion. This helps explain why whole wheat bread can have a lower glycemic index than white bread.
9
7
Pla
sma
gluc
ose
(mm
ol/L
)
5
3
0 60 120 100
Time (min)
240 300 360
FIGURE 3.12 Typical Glucose Tolerance Curve to Measure Glycemic Response. The area under the curve (AUC) represents the rise and subsequent lowering of blood glucose levels by insulin and tissue processing after consuming a 50-gram glucose source.
Glycemic LoadThe concept of glycemic index is simple to grasp; how-ever, it is not always easy to apply to how people tend to eat. One issue with glycemic index is that the amount of food used to determine it is not the amount typically con-sumed by people. For instance, boiled carrots have a gly-cemic index of about 90; however, it would take over 10 cups of carrots to achieve the 50 grams of carbohydrate needed for the glycemic index test. For this and other rea-sons, a second glycemic measure more appropriate for the real world, called glycemic load, is used.
Glycemic load is basically glycemic index normalized to serving standards. A food’s glycemic load is derived by multiplying a food’s glycemic index by the amount of digestible carbohydrate in a serving and then dividing by 100. For instance, carrots have a glycemic index of 90, which, multiplied by 4 (the grams of digestible carbohy-drate in 1 cup) and divided by 100, gives one a glycemic load of roughly 4. See Table 3.4 for a listing of the gly-cemic loads of common foods relative to their glycemic index.
Foods with a higher glycemic index (and, more appli-cably, glycemic load) may be undesirable food choices for people with chronic hyperglycemia (e.g., diabetes mel-litus). First, the higher glycemic index food can worsen a hyperglycemic state. Second, further elevation of cir-culating glucose could lead to an increase in the level of
Carbohydrate Circulation and Cellular Uptake 69
9781449689582_CH03.indd Page 69 10/22/13 10:41 AM f451 9781449689582_CH03.indd Page 69 10/22/13 10:41 AM f451 /201/JB00096/work/indd/201/JB00096/work/indd

FoodGlycemic
IndexGlycemic
Load FoodGlycemic
IndexGlycemic
Load
All-bran cereal 42 8 Peanuts 14 1
Apple juice 40 11 Pears 38 4
Apples 38 6 Pineapple 59 7
Bananas 52 12 Pinto beans 39 10
Beets 64 5 Popcorn 72 8
Buckwheat 54 16 Potatoes (new) 57 12
Cantaloupe 65 4 Potatoes (Russet, baked) 85 26
Carrots 47 3 Rice, white 64 23
Cheerios cereal 74 15 Rice, wild 57 18
Corn Flakes cereal 81 21 Sourdough wheat bread 54 15
Couscous 65 23 Spaghetti 42 20
Fettuccini 40 18 Strawberries 40 1
Grapes 46 8 Sucrose (table sugar) 68 7
Green peas 48 3 Shredded Wheat cereal 67 13
Kidney beans 28 7 Sweet corn 54 9
Life cereal 66 16 Sweet potatoes 61 17
Linguine 52 23 Watermelon 72 4
Macaroni 47 23 Whole wheat fl our bread 71 9
Navy beans 38 12 White wheat fl our bread 70 10
TABLE 3.4 Glycemic Index and Glycemic Load Levels
Level Glycemic Index Glycemic Load Glycemic Load/Day
Low #55 #10 ,80
Medium 56–69 11–19 80–120
High $70 $20 .120
circulating insulin (hyperinsulinemia). For many hyper-glycemic people, insulin may already be circulating at normal or elevated levels relative to the blood glucose concentration. Chronic hyperinsulinemia is associated with elevated blood lipids (hypercholesterolemia and hypertriglyceridemia), blood pressure, and body fat.
Glucose Transport into CellsGlucose moves across human cell plasma membranes by facilitative diff usion via glucose transport proteins (GLUT). At least six glucose transport proteins have been described in detail at this time, each varying in its operational properties as well as the types of cells in which it is expressed (Table 3.5). GLUT1 is the most widely expressed isoform and provides most cells with their basal glucose requirements. GLUT1 is expressed in
higher amounts in epithelial cells and the endothelium of barrier tissue such as the blood–brain barrier. GLUT2 is produced in higher amounts in hepatocytes, pancreatic b-cells, and the basolateral membranes of intestinal and renal epithelial cells. This glucose transport protein is a high-Km isoform, meaning that it is most active when more glucose is available, such as during hyperglycemia. Meanwhile, GLUT3 is responsible for glucose transport in neurons and has a relatively low Km to ensure glucose supply, even during hypoglycemia.
GLUT4 is expressed in insulin-sensitive cells such as adipocytes and cardiac and skeletal muscle cells and is primarily responsible for reducing elevated blood glu-cose levels (Figure 3.13). Here, insulin binds to its recep-tor and sets in play a series of phosphorylation steps that lead to the translocation of GLUT4 to the plasma membrane. GLUT5 is a fructose transporter expressed
70 CHAPTER 3 | Carbohydrates: Energy, Metabolism, and More
9781449689582_CH03.indd Page 70 10/22/13 10:41 AM f451 9781449689582_CH03.indd Page 70 10/22/13 10:41 AM f451 /201/JB00096/work/indd/201/JB00096/work/indd

TABLE 3.5 Major Glucose Transport (GLUT) Proteins in Tissue
Protein Tissue Properties/Characteristics
GLUT1 Most cells Low Km (1–2 mM)
Ensures glucose uptake during hypoglycemia
GLUT2 Pancreatic b-cells, renal tubular cells, small intestinal basolateral epithelial cells that transport glucose, liver cells, hypothalamus
High Km (15–20 mM)
GLUT3 Expressed mostly in neurons, placenta, testes Low Km (1 mM)
Very high affi nityProbable main glucose transporter in neurons
GLUT4 Skeletal muscle fi bers, adipose tissue, cardiac muscle cells
High Km (5 mM)
Insulin regulated to help regulate hyperglycemia
GLUT5 Mucosal surface of small intestine cells, hepatocytes, sperm, skeletal muscle fi bers
Low Km (1–2 mM)
Fructose transporter
GLUT7 Hepatocytes Transports glucose out of the endoplasmic reticulum after fi nal step in gluconeogenesis
Insulin
from circulation
Glucose
from ci
rculatio
n
GLUT4
Trans
locat
ion
Signaltransduction
cascade
GLUT4
FIGURE 3.13 Insulin Interaction with Insulin Receptors and Translocation of GLUT4 to Cell Plasma Membranes to Bring Glucose into Cells. The binding of insulin to its receptor results in a series of phosphorylation of signaling factors that ultimately leads to the translocation of GLUT4 to the plasma membrane.
in greater amounts in spermatozoa and the apical mem-brane of intestinal enterocytes and, to a lesser degree, skeletal muscle. GLUT7 is a glucose transporter found on the endoplasmic reticulum membrane; it transports free glucose into the cytosol after the action of glucose-6-phosphatase upon glucose-6-phosphate. This is of particu-lar importance to hepatocytes during glycogen breakdown because it allows for glucose liberation (from phosphate) for subsequent release into circulation.
Glucose is the principal energy source of the brain. Delivery of glucose to brain tissue requires transport across the endothelial cells of the blood–brain barrier and then into neurons and glial cells (collectively referred to as glia). GLUT1 has been determined to be in higher con-centration in the brain, with variations in the degree of glycosylation in neurons and in the blood–brain barrier. GLUT3 is also concentrated in neurons, and GLUT5 in microglia. GLUT2, GLUT4, and GLUT7 have also been detected in the brain, but at lower concentrations.
Glucose transport across the plasma membrane of muscle (skeletal and cardiac) has additional considerations beyond the presence of insulin and the mobilization of GLUT4 transporters. Glucose transport is increased by alterations in the metabolic condition of muscle cells. In the heart, glucose transport can be increased by more powerful contractions, increased levels of circulating epi-nephrine and growth hormone, and intracellular AMP and ADP. Meanwhile, skeletal muscle contraction leads to an augmentation in glucose transport that is inde-pendent of insulin. This is important because insulin release is dampened during moderate to intense exercise. Muscle cell contractile activities result in an increase in intracellular Ca21 content, which has been suggested to be associated with the translocation of GLUT4 from the intracellular pool to the plasma membrane.
Monosaccharide ActivationFree monosaccharides are found in low concentration in cells because they are quickly utilized or assimilated into
Carbohydrate Circulation and Cellular Uptake 71
9781449689582_CH03.indd Page 71 10/22/13 10:41 AM f451 9781449689582_CH03.indd Page 71 10/22/13 10:41 AM f451 /201/JB00096/work/indd/201/JB00096/work/indd

uptake and building stores; and glucagon, epinephrine, and cortisol, which tend to have an opposite eff ect.
InsulinInsulin is a polypeptide produced in b-cells of pancre-atic islets and consists of two chains (A and B) linked by disulfi de bonds (Figure 3.14). The A chain consists of 21 amino acids, the B chain consists of 30 amino acids, and the disulfi de bonds arising from cysteine residues are located at A7–B7 and A20–B19. A disulfi de bond also exists between cysteine residues between A6 and A11. Although there is some variation in the insulin amino acid sequence between mammalian species, the position-ing of the three disulfi de bonds seems invariant.
❚ Insulin Production
Insulin is synthesized (via protein translation) as prepro-insulin, which has a molecular weight of 11,500. Post-translational modifi cation begins with the cleavage of the 23–amino acid pre- or leader sequence, resulting in proinsu-lin, which has a molecular weight of approximately 9,000. The cleaved leader sequence is necessary for guiding pre-proinsulin into the endoplasmic reticulum during synthesis. Cleavage of the leader group also allows for the appropriate conformation for the formation of disulfi de linkages.
Proinsulin then moves to the Golgi apparatus. In the Golgi apparatus, proinsulin begins conversion to mature insulin, or simply insulin, which involves the removal of a stretch of amino acids in the central portion of the pro-insulin polypeptide. The removed amino acid sequence is called C peptide, and the remaining, once fl anking, amino acid sequences are the A chain and B chain, which are secured by disulfi de bonds. This process continues after
stores. For a monosaccharide to be metabolized within a cell, it must be phosphorylated (i.e., have a phosphate attached). For example, glucose-6-phosphate is created in the fi rst step of glycolysis from free glucose entering a cell. Not only does this serve to activate the monosac-charide, but also it “locks” the monosaccharides within certain cells, such as hepatocytes. Glucose-6-phosphate is readily active and tends not to accumulate within a cell.
BEFORE YOU GO ON . . .
1. What is glycemic index, and how is it measured?
2. How does glycemic load differ from glycemic index? How can both be applied to people and populations?
3. What are glucose transport proteins, and what cell types produce different isoforms?
4. What are the steps involved in GLUT4 movement to cell membranes?
5. What is the purpose of activating monosaccharides upon entering cells?
Gly
Arg
LysGln Leu
Ser Gly Glu Leu Ala Leu Pro Gln Leu Ser
C-peptide
Gly Ala Gly Pro Gly Gly Gly Leu Glu ValGln Gly
ValGln
LeuAsp
GluAla
Phe Val Asn Gln His Leu Cys Gly Ser Leu Val Glu Ala Leu Tyr Leu Val Cys Gly Thr
Arg
Arg
Glu
LysProThrTyrPhePheGlyArgGluHis
Ile
B chain
A chain
Val Glu Gln Cys Cys Thr Ser Ile Cys Ser Leu Tyr Gln Gln Asn Tyr Cys AsnLeu
S S
S
S
20
S
S
Major Hormones in Carbohydrate MetabolismThe metabolism of carbohydrate is regulated by individual hormone levels and their relative ratios. Among the most signifi cant hormones are insulin, which tends to elicit an anabolic eff ect on carbohydrates, thus increasing cellular
FIGURE 3.14 Amino Acid Sequence of Insulin A and B Chains and Location of Disulfi de Bonds
72 CHAPTER 3 | Carbohydrates: Energy, Metabolism, and More
9781449689582_CH03.indd Page 72 10/22/13 10:41 AM f451 9781449689582_CH03.indd Page 72 10/22/13 10:41 AM f451 /201/JB00096/work/indd/201/JB00096/work/indd

vesicles bud from the Golgi apparatus and traverse the cytoplasm toward the plasma membrane and conversion of proinsulin to insulin is typically about 95% complete. Upon stimulus, the secretory vesicles will fuse with the plasma membrane to release insulin into the intercellular space (Figure 3.15).
❚ Insulin Secretion
Insulin and proinsulin combine with zinc within secretory granules and form hexamer structures. The secretory vesicles then fuse with the plasma membranes of b-cells, releasing insulin, proinsulin, and C peptide into the extra-cellular space. These molecules are then free to diff use
into the blood. Proinsulin has less than 5% of the bioac-tivity of insulin, and C peptide has none. The half-life of insulin is 3 to 5 minutes, whereas the half-life of proin-sulin is much longer. Insulin is metabolized primarily in the liver, kidneys, and placenta. About 50% of circulating insulin is removed in a single pass through the liver.
On a daily basis, the adult pancreas secretes about 40 to 50 units of insulin, which represents about 15% to 20% of that which is available in secretory vesicles. A unit is equal to 45.5 micrograms of crystalline insulin. The release of insulin is an energy-dependent process, and the strongest stimulus is an elevation in plasma glucose con-centration. The threshold concentration for secretion is
β-cell
Secretoryvesicles of
insulin
Insulin Circulation
Ca2+
Ca2+Ca2+
Ca2+Ca2+
Ca2+
Ca2+Ca2+
Ca2+Ca2+
Ca2+
K+
ATP
Glucose
Glucose
Glucose
K+
K+K+Ca2+
5
3
2
1
7
6
4
–
1 Blood glucose levels increase (e.g., meal)
2 Glucose uptake via GluT2
3 ATP formation through glucose utilization inactivates potassium channels
4 β-cell membrane becomes depolarized due to accumulation of potassium ions
5 Calcium channel opens and calcium diffuses into cell
6 Calcium promotes fusing of insulin secretory vesicles with plasma membrane
7 Insulin diffuses into circulation
FIGURE 3.15 Release of Insulin from Pancreatic b-Cells via Fusion of Secretory Vesicles with Plasma Membrane
Major Hormones in Carbohydrate Metabolism 73
9781449689582_CH03.indd Page 73 10/22/13 10:41 AM f451 9781449689582_CH03.indd Page 73 10/22/13 10:41 AM f451 /201/JB00096/work/indd/201/JB00096/work/indd

skeletal muscle hexokinase II, which also catalyzes the phosphorylation of glucose, is increased due to insulin.
The actions of insulin on increased glucose entry are somewhat special to certain cell types, such as adipocytes, skeletal and cardiac myocytes, and hepatocytes. Most other cells in the body demonstrate a more consistent uptake of glucose from circulation based on their metabolic needs and glucose availability. This is explained by the variety of glu-cose transporter proteins. Insulin also promotes the uptake of certain amino acids into cells, especially muscle cells.
❚ Metabolic Roles of Insulin
Insulin not only increases the uptake of glucose and amino acids into certain types of cells, but also strongly infl uences energy nutrient metabolic pathways within cells as well (Table 3.6). Insulin promotes increased activities of glycolysis, the pentose phosphate pathway, glycogen formation (glycogenesis), and fatty acid syn-thesis (lipogenesis). Insulin inhibits glucose formation via glycogen breakdown (glycogenolysis) and the conver-sion from noncarbohydrate molecules (gluconeogenesis). Furthermore, insulin inhibits fat breakdown (lipolysis) and fatty acid oxidation in adipocytes and hepatocytes, while at the same time supporting protein synthesis in skeletal muscle and other tissue. Generally, insulin infl u-ences the associated pathways by either activating or deactivating key enzymes or infl uencing events of tran-scription or translation or both. In these ways, insulin is believed to infl uence either the quantity or activity of at least 50 diff erent enzymes.
about 80 to 100 milligrams per 100 milliliters, and a maxi-mal response occurs when blood glucose concentration is approximately 300 to 500 milligrams per 100 milliliters of blood.
Secretion of insulin via rising glucose levels can be infl uenced by several factors. For instance, a-adrenergic agonists such as norepinephrine via autonomic inner-vation and circulating epinephrine can dampen glucose stimulation of insulin release, which can be important for controlling blood glucose levels during more strenuous exercise and stressful events. In addition, insulin secretion is increased by chronic exposure to growth hormone, estrogens, and progestins. Thus, it is not surprising to fi nd insulin secretion elevated during the last trimester of pregnancy.
❚ Insulin-Mediated Glucose Uptake
Insulin promotes the lowering of blood glucose concen-tration by several means. In adipose tissue and skeletal muscle, which collectively constitute approximately 50% to 60% of the tissue in the adult body, insulin increases the number of glucose transporters at the plasma mem-brane face. These transporters, particularly GLUT4, are assumed to be mobilized from an inactive intracellular pool (see Figure 3.13). Increased glucose entry into hepa-tocytes appears to occur by increasing the activity of glu-cokinase. Once glucose enters hepatocytes (via GLUT1) it is quickly phosphorylated by glucokinase, thus main-taining a concentration gradient that favors further infl ux of free glucose from circulation. Similarly, the activity of
TABLE 3.6 Actions of Insulin, Glucagon, Cortisol, and Epinephrine in Carbohydrate Metabolism
Hormone Actions
Insulin Increases the uptake of glucose by skeletal muscle and adipocytes Increases the synthesis of glycogen in skeletal muscle and liver hepatocytesIncreases fatty acid synthesis from excessive dietary carbohydrateDecreases fat breakdown and mobilization from adipose tissue
Glucagon Increases glycogen breakdown in liver Increases liver glycogen-derived glucose release into bloodIncreases glucose manufacturing in liverIncreases fat breakdown and mobilization from adipocytes
Epinephrine (adrenalin) Increases glycogen breakdown in liver hepatocytes and skeletal muscle Increases liver glycogen-derived glucose release into bloodIncreases fat breakdown and mobilization from adipocytes
Cortisol (stress hormone) Increases skeletal muscle protein breakdown to amino acids (alanine and glutamine can circulate to the liver and be used for gluconeogenesis) Increases gluconeogenesis and liver glucose release into bloodIncreases fat breakdown and mobilization from fat tissueIncreases glycogen content in liver
74 CHAPTER 3 | Carbohydrates: Energy, Metabolism, and More
9781449689582_CH03.indd Page 74 10/22/13 10:41 AM f451 9781449689582_CH03.indd Page 74 10/22/13 10:41 AM f451 /201/JB00096/work/indd/201/JB00096/work/indd

GlucagonGlucagon is produced by a-cells of pancreatic islets. It is a single-chain polypeptide consisting of 29 amino acids. Like insulin, glucagon is also synthesized in a larger prohor-mone form. Glucagon circulates in the plasma unbound and has a half-life of about 5 minutes. The liver is the pri-mary site of glucagon inactivation. Because pancreatic endocrine secretions drain into the hepatic portal vein, much of the secreted glucagon is actually metabolized without ever reaching the systemic circulation. Glucagon secretion is associated with hypoglycemia, and inhibition of secretion is associated with hyperglycemia. The exact inhibitory mechanisms are unclear. It could be a more direct inhibition via increased glucose reception, or a more indirect inhibition via insulin or insulin-related events, or a combination of these or associated events. Other stimu-lators may include some amino acids, particularly gluco-genic amino acids such as alanine, serine, glycine, cysteine, and threonine. These amino acids are important sources of glucose via gluconeogenesis. This also means that a protein-containing meal can, in theory, stimulate glucagon release, concomitant to stimulating insulin release.
Whereas the infl uence of insulin is diverse, glucagon focuses its actions mainly on the liver and adipose tissue (see Table 3.6). The binding of glucagon to glucagon receptors on the plasma membrane of hepatocytes results in an increase in intracellular cAMP. The activation of phosphorylase by cAMP promotes glycogen degradation while also inhibiting glycogen synthesis. Furthermore, glucagon promotes the conversion of noncarbohydrate molecules to glucose in hepatocytes. In adipose tissue, glucagon promotes lipolysis principally by activating the enzyme hormone-sensitive lipase. As with hepatocytes, the binding of glucagon to receptors on the plasma mem-brane of adipocytes initiates a second messenger cas-cade that begins with the activation of adenylyl cyclase through a G-protein-linked mechanism and produces increased cAMP levels, as discussed later in this chapter.
Skeletal muscle cells do not make glucagon receptors. Thus, glycogenolysis in skeletal muscle is not infl uenced by glucagon; it is primarily infl uenced by epinephrine and to a lesser degree norepinephrine. In general, glucagon is gluconeogenic, glycogenolytic, and ketogenic in hepato-cytes and lipolytic in adipocytes.
Insulin-to-Glucagon Molar RatiosBecause many aspects of energy nutrient metabolism promoted by either insulin or glucagon are antagonistic
The net eff ect of insulin is to decrease the circulatory concentration of glucose. In this sense, insulin stands alone, and its general actions are opposed by several hormones, such as glucagon, epinephrine, and cortisol. The net eff ect of insulin is also to promote storage of diet-derived (exog-enous) energy. Because the liver receives portal blood that has drained from the pancreas, it is exposed to insulin con-centrations that can be 3 to 10 times greater than in the systemic circulation. The liver binds and removes a signifi -cant amount of insulin on this pass. The liver is also more sensitive to insulin, presumably because it also has greater receptor concentrations than other tissue.
Insulin Receptors Insulin acts by fi rst binding with an insulin receptor on the plasma membrane (see Figure 3.13), and its indi-rect actions can arise within seconds to minutes (nutri-ent transport, activation or inhibition of enzymes, RNA transcription) or hours (protein and DNA synthesis and cell growth). The insulin receptor is a heterodimer transmembrane glycoprotein. Its cytoplasmic region has tyrosine kinase activity and an autophosphorylation site. The insulin receptor gene is located on chromosome 19. Insulin receptors undergo constant turnover because their half-life is only 7 to 12 hours. Most human cells synthesize insulin receptors, with the average concentration being about 20,000 receptors per cell. This is because insulin not only governs metabolic activity but also is involved in cell growth and reproduction.
Once insulin binds to a receptor, there is a confor-mational change, the receptor is internalized, and one or more signals are produced. The internalization of receptors is important to regulate receptor concentra-tion, which, in turn, helps regulate cell turnover and metabolic activities. In hyperinsulinemic situations, such as in obesity, there is reduced production of insu-lin receptors. Fewer receptors are produced, resulting in fewer receptors on the plasma membrane, and thus those cells become less sensitive to insulin. This results in hyperglycemia and is often the case in obesity-related type 2 diabetes mellitus.
Insulin elicits a second messenger action that culminates in a variety of intracellular events. These events begin with the activity of tyrosine kinase, which results in an increase in tyrosine phosphorylation in both the receptor itself as well as in key intracellular proteins. This generally activates key enzymes such as guanosine triphosphatases (GTPases), lipid kinases, and protein kinases, which mediate much of insulin’s metabolic impact.
Major Hormones in Carbohydrate Metabolism 75
9781449689582_CH03.indd Page 75 10/22/13 10:41 AM f451 9781449689582_CH03.indd Page 75 10/22/13 10:41 AM f451 /201/JB00096/work/indd/201/JB00096/work/indd

in nature, the molar ratio of these two hormones is the dominating factor in determining net metabolic activity. For instance, in hepatocytes and skeletal muscle the syn-thesis of glycogen can and will occur concurrent with the breakdown of glycogen. However, the algebraic net eff ect is dictated largely by the relative infl uences of insulin and glucagon and, to a lesser degree, other hormones, such as epinephrine and cortisol. An insulin-to-glucagon ratio of 2.3:1 may be expected from the consumption of a bal-anced meal. Meanwhile, the infusion of arginine increases the secretion of both hormones, but more so for insulin, which results in a ratio approximating 3:1. Conversely, if a glucose solution is infused into circulation, a ratio of 25:1 can be expected.
EpinephrineEpinephrine (adrenalin) is produced in the adrenal glands (adrenal medulla) from the amino acid tyrosine, which itself can be synthesized from the essential amino acid phenylalanine. Intermediates of the synthesis of epineph-rine include dopa, dopamine, and norepinephrine (nor-adrenaline). Epinephrine, norepinephrine, and dopamine are important molecules in the response to stress. They are synthesized in chromaffi n cells and stored in secre-tory granules. Epinephrine is the principal catecholamine synthesized in chromaffi n cells of the adrenal medulla, constituting 80% of the total catecholamine production.
The conversion of dopamine to norepinephrine is catalyzed by the copper-containing enzyme dopamine b-hydroxylase (DBH). DBH requires ascorbate (an elec-tron donor) and copper at the active site. Meanwhile, phenylethanolamine-N-methyltransferase (PNMT) cata-lyzes the production of epinephrine from norepinephrine (Figure 3.16). Synthesis of PNMT is induced by gluco-corticoid hormones that reach the medulla, via a portal vein, from the adrenal cortex.
The incorporation of catecholamines into secretory granules is an ATP-dependent transport mechanism. The granules also contain ATP-Mg21, Ca21, and DBH. Once inside the granule, epinephrine complexes with ATP in a 4:1 ratio. Secretory granules fuse with the plasma mem-brane upon appropriate neural stimulation. b-Adren-ergic and cholinergic agents stimulate fusion, whereas a-adrenergic agents inhibit it. Catecholamines circulate loosely bound to albumin and have a half-life of about 10 to 30 seconds. Catecholamines are metabolized by catechol-O-methyltransferase (COMT) and monoamine oxidase (MAO), which are found in many tissues.
FIGURE 3.16 Steps Involved in the Production of Epinephrine and Norepinephrine
HO
O
NH2
OH
HO
HO
O
NH2
OH
HO
HONH2
Tyrosine hydroxylasetetrahydrobiopterin
Synthesis Pathway for Dopamineand Catecholamines
Aromatic L-amino aciddecarboxylase
Vitamin B6 (PLP)
Dopamine β-hydroxylaseVitamin C, Copper
HO
OH
HONH2
HO
OH
HONHCH3
Phenylethanolamine-N-methyltransferaseS-adenosylmethionine
Tyrosine(amino acid)
L-Dopa
Dopamine
Norepinephrine
Epinephrine
The eff ects of epinephrine are mediated via its recep-tion by two classes of receptors. Alpha and b receptors are subdivided into a1 and a2 and b1 and b2. This classifi -cation system is based on binding affi nity of the diff erent receptors for catecholamines. When epinephrine binds
76 CHAPTER 3 | Carbohydrates: Energy, Metabolism, and More
9781449689582_CH03.indd Page 76 10/22/13 10:41 AM f451 9781449689582_CH03.indd Page 76 10/22/13 10:41 AM f451 /201/JB00096/work/indd/201/JB00096/work/indd

to b1 on cardiac tissue, the force and rate of contraction are increased. Furthermore, the binding of epinephrine to b2 receptors elicits smooth muscle relaxation and thus vasodilation in skeletal muscle and the liver. Meanwhile, the interaction with a1 receptors results in contraction in some smooth muscle.
The eff ects of epinephrine include the breakdown of glycogen in skeletal muscle and the liver and fat break-down in adipose tissue (see Table 3.6). This serves to make fuel available for skeletal muscle and the heart dur-ing times of increased activity.
CortisolCortisol is produced in the adrenal cortex and is the prin-cipal glucocorticoid in humans. It is derived from choles-terol and circulates in the blood bound predominantly to corticosteroid-binding globulin (CBG), which is produced in the liver and to a minor degree loosely associated with albumin. The binding of cortisol to a plasma protein allows for a longer half-life (60 to 90 minutes) than the polypeptide hormones discussed previously. Cortisol is principally removed and metabolized by the liver.
Cortisol has widespread eff ects in the human body, and greater secretion is associated with stress and fast-ing, whereby it mediates adaptive processes. Cortisol then plays a signifi cant role in carbohydrate, protein, fat, and nucleic acid metabolism. Cortisol and its structural analogues (e.g., hydrocortisone) are also used clinically as anti-infl ammatory agents because they inhibit the migra-tion of polymorphonuclear leukocytes, monocytes, and lymphocytes at the site of infl ammation.
In the liver, the eff ects of cortisol are largely ana-bolic (see Table 3.6). Cortisol promotes gluconeogen-esis in hepatocytes by binding to intracellular receptors and inducing the production of a number of enzymes involved in gluconeogenesis as well as amino acid trans-amination. Additionally, glucose-6-phosphatase activity is increased, allowing for more glucose to leave the liver to serve as fuel for other tissue. Cortisol also promotes gly-cogen synthesis in the liver. This eff ect most likely occurs to maintain at least basal levels of glycogen stores dur-ing times when it could easily become exhausted (i.e., extended fasting, stress). However, it should be noted that during hypoglycemia the impact of glucagon will super-sede cortisol, and the net eff ect will be a breakdown of liver glycogen.
In peripheral tissue, cortisol-induced activity appears to antagonize insulin activity. Thus, cortisol works to reduce glucose and amino acid uptake in peripheral
tissue, such as skeletal muscle, to preserve circulating glucose for other tissue with obligate demands, such as red blood cells and the brain. Meanwhile, protein and nucleic acid synthesis are inhibited and protein break-down is promoted by cortisol in more sensitive tissue (i.e., skeletal muscle and connective tissue in the skin). Free amino acids in skeletal muscle, especially alanine, become resources for gluconeogenesis in the liver via the alanine–glucose cycle.
Cortisol also promotes lipolysis in adipose tissue, thereby allowing free fatty acids to be mobilized to serve as fuel for tissue throughout the body. Meanwhile, corti-sol promotes an increase in total white blood cell count in circulation. However, this is a net eff ect, because although monocytes and polymorphonuclear leukocytes are increased, eosinophils, basophils, and lymphocytes are decreased.
BEFORE YOU GO ON . . .
1. What cells in what tissue produce insulin, and how and when is it released from those cells?
2. What role does insulin play in the metabolism of energy nutrients? Is it generally anabolic or catabolic?
3. Where is glucagon produced, and what roles does it play in carbohydrate and fat metabolism?
4. What cells produce cortisol, when is it released into circulation, and how does it affect carbohydrate, fat, and protein metabolism?
5. How is epinephrine produced, and what is its role in carbohydrate and fat metabolism?
Major Metabolic Pathways for Carbohydrate The fl ux of glucose and other carbohydrates through metabolic pathways is regulated in several ways. First, hormonal infl uences such as insulin and glucagon can alter the activity of key enzymes by phosphorylation and dephosphorylation. Second, hormonal infl uences can either induce or repress transcription or translation or both of key enzymes. Third, intermediates and products of the metabolic reactions as well as other substances can elicit allosteric infl uences on the fl ux of metabolic pathways.
Major Metabolic Pathways for Carbohydrate 77
9781449689582_CH03.indd Page 77 10/22/13 10:41 AM f451 9781449689582_CH03.indd Page 77 10/22/13 10:41 AM f451 /201/JB00096/work/indd/201/JB00096/work/indd

OC
CH
H
H
H OH
OH
OH
OHHO C
C
C
C
H
H
H
OC
CH
H
H
H O P
OH
OH
OHHO C
C
C
C
H
H
H
H
C
C
H
H
H
H O P
OH
OH
OHO C
C
C
C
H
H
OH
HC
CH
H
H
H O P
OH
OH
OHO C
C
C
C
H
H
O P
O
H
H O P
OHCC
C
H
H
O
H
H O P
POH
CC
C
H
O
O
H
H O P
OHCC
CH
H2O
O–
O
H
H OH
POCC
C
H
O–
O
H
POCC
C
H
O–
OCOO–
C
CH3
H
OH
PO
CHC
C
H
O
H
Pyruvate (two)
ADP
ATP
ADP
ATP
ADP
ATP
Glucose
Glucose-6-phosphate
Fructose-6-phosphate
Fructose-1,6-bisphosphate
Hexokinaseor
Glucokinase
Phosphoglucoseisomerase
Phosphofructo-kinase
Aldolase
Triosephosphateisomerase
Glyceraldehyde3-phosphate
dehydrogenase
Phosphoglyceratekinase
Phosphoglyceratemutase
Enolase
Pyruvatekinase
Dihydroxyacetonephosphate
Glyceraldehyde-3-phosphate (two)
1, 3-Bisphosphoglycerate(two)
3-Phosphoglycerate(two)
2-Phosphoglycerate (two)
Phosphoenolpyruvate (two)
NADH + H+
NAD+
Pi
ADP
ATP
FIGURE 3.17 Steps and Key Regulation of Glycolysis
78 CHAPTER 3 | Carbohydrates: Energy, Metabolism, and More
9781449689582_CH03.indd Page 78 10/22/13 10:41 AM f451 9781449689582_CH03.indd Page 78 10/22/13 10:41 AM f451 /201/JB00096/work/indd/201/JB00096/work/indd

Most cells use more than one fuel source; red blood cells are the only true obligate glucose users. The brain is limited in its energy substrates, and under normal meta-bolic conditions derives nearly all of its energy from glu-cose as well. However, the brain can adapt to use more ketone bodies during starvation to spare blood glucose for other tissue. Conversely, tissues such as muscle, liver, and kidney are more omnivorous in their energy sub-strates. Here, substrate availability and hormonal infl u-ences are the greatest infl uential factors.
GlycolysisGlycolysis is a series of 10 reactions that convert one six-carbon glucose molecule to two three-carbon pyruvate molecules (Figure 3.17). The net ATP yield of glycolysis is two ATP molecules, with the potential for two more via the glycerol phosphate shuttle, which allows for the reducing equivalents of the NADH generated in the cyto-sol to be transferred to mitochondrial FADH2. Glycolysis also allows entry points for the catabolism of other mono-saccharides, such as fructose and galactose. Glucose fl ux through glycolysis is regulated by several key enzymes, as described next.
❚ Hexokinase and Glucokinase
The fi rst infl uential enzymes in glucose metabolism in cells are hexokinase in all tissue and glucokinase in hepa-tocytes. Both enzymes phosphorylate glucose to produce glucose-6-phosphate. Hexokinase has a relatively low Km,
which allows it to operate despite a relatively low avail-ability of glucose. However, hexokinase is inhibited by its product, glucose-6-phosphate. These regulations ensure glucose entry into all cells for glycolysis but allow it to proceed based on cell need.
In contrast, glucokinase, which is produced in hepa-tocytes as induced by insulin, has a relatively high Km and is not inhibited by its product. Glucokinase allows for large quantities of glucose to enter hepatocytes dur-ing hyperglycemic states, such as a fed state. This makes sense, because the liver is a major metabolizing site for glucose during a fed state and about 50% of glucose is converted to energy in the liver, with the remaining car-bohydrate converted to glycogen and fatty acids. Because both absorbed glucose from the digestive tract and insulin secreted from the pancreas perfuse the liver before enter-ing the general, or systemic, circulation, a large portion of the absorbed glucose is transported into hepatocytes and never reaches the general circulation. This is a major point of control for blood glucose levels.
❚ Phosphofructokinase
The activity of phosphofructokinase 1 (PFK1), which cata-lyzes the conversion of fructose-6-phosphate to fructose-1, 6-bisphosphate, is regulated by several factors (Figure 3.18). In the liver, one of the predominant factors is the activity of phosphofructokinase 2 (PFK2), an enzyme that catalyzes two opposite reactions depending on whether it is phosphorylated. PFK2 is phosphorylated when glu-cagon levels are elevated. Increased intracellular cAMP
OH
O
OHOH
CH2OHPOCH2
Fructose-6-phosphateOH
O
OHOH
CH2OPPOCH2
Fructose-1,6-bisphosphate
Fructose-2,6-bisphosphate
ATP
GlucagonATP
+
PFK1
PFK-2
PFK-2
Insulin
ADP
ADP
PFK1 = Phosphofructokinase 1PFK2 = Phosphofructokinase 2
++
P
FIGURE 3.18 Activity of Phosphofructokinase 1 (PFK1). PFK1, which catalyzes the conversion of fructose-6-phosphate to fructose-1,6-bisphosphate, is regulated by several factors.
Major Metabolic Pathways for Carbohydrate 79
9781449689582_CH03.indd Page 79 10/22/13 10:41 AM f451 9781449689582_CH03.indd Page 79 10/22/13 10:41 AM f451 /201/JB00096/work/indd/201/JB00096/work/indd
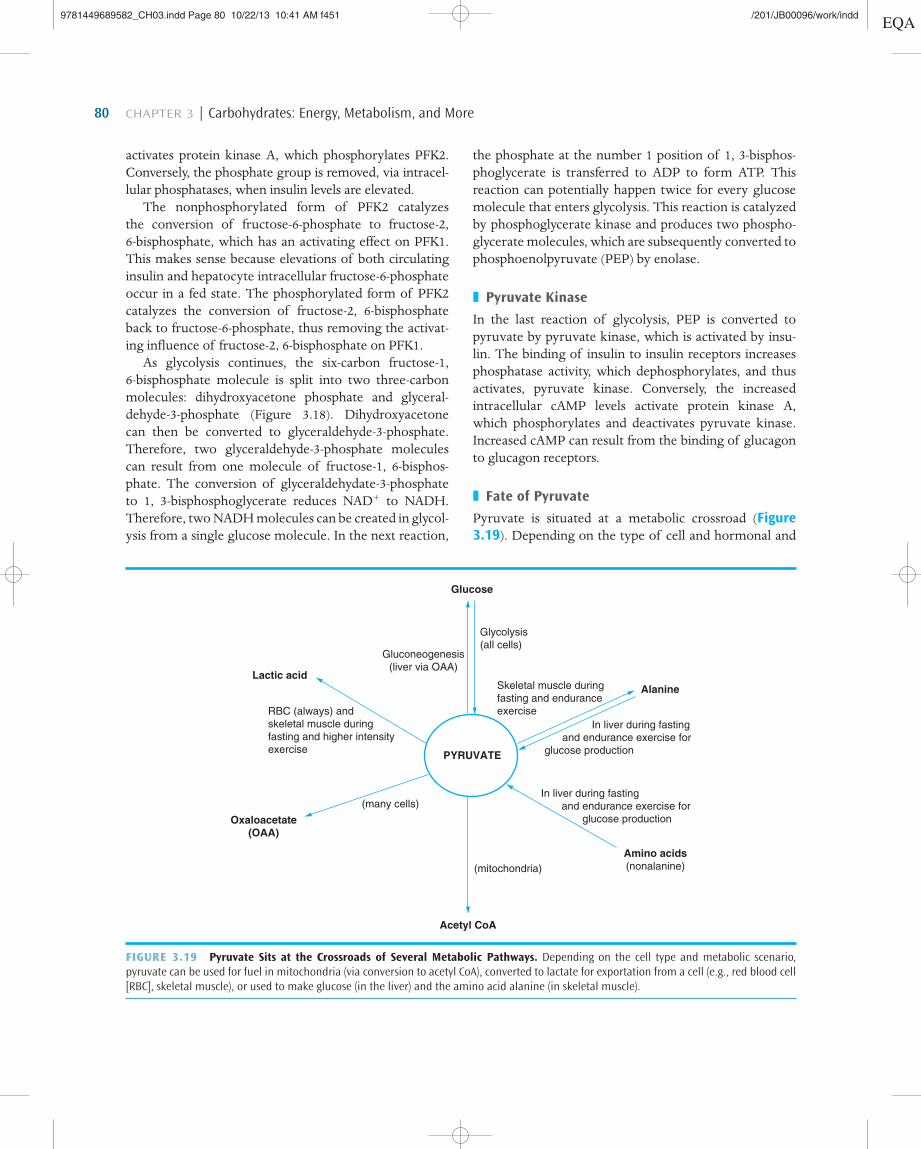
activates protein kinase A, which phosphorylates PFK2. Conversely, the phosphate group is removed, via intracel-lular phosphatases, when insulin levels are elevated.
The nonphosphorylated form of PFK2 catalyzes the conversion of fructose-6-phosphate to fructose-2, 6-bisphosphate, which has an activating eff ect on PFK1. This makes sense because elevations of both circulating insulin and hepatocyte intracellular fructose-6-phosphate occur in a fed state. The phosphorylated form of PFK2 catalyzes the conversion of fructose-2, 6-bisphosphate back to fructose-6-phosphate, thus removing the activat-ing infl uence of fructose-2, 6-bisphosphate on PFK1.
As glycolysis continues, the six-carbon fructose-1, 6-bisphosphate molecule is split into two three-carbon molecules: dihydroxyacetone phosphate and glyceral-dehyde-3-phosphate (Figure 3.18). Dihydroxyacetone can then be converted to glyceraldehyde-3-phosphate. Therefore, two glyceraldehyde-3-phosphate molecules can result from one molecule of fructose-1, 6-bisphos-phate. The conversion of glyceraldehydate-3-phosphate to 1, 3-bisphosphoglycerate reduces NAD1 to NADH. Therefore, two NADH molecules can be created in glycol-ysis from a single glucose molecule. In the next reaction,
the phosphate at the number 1 position of 1, 3-bisphos-phoglycerate is transferred to ADP to form ATP. This reaction can potentially happen twice for every glucose molecule that enters glycolysis. This reaction is catalyzed by phosphoglycerate kinase and produces two phospho-glycerate molecules, which are subsequently converted to phosphoenolpyruvate (PEP) by enolase.
❚ Pyruvate Kinase
In the last reaction of glycolysis, PEP is converted to pyruvate by pyruvate kinase, which is activated by insu-lin. The binding of insulin to insulin receptors increases phosphatase activity, which dephosphorylates, and thus activates, pyruvate kinase. Conversely, the increased intracellular cAMP levels activate protein kinase A, which phosphorylates and deactivates pyruvate kinase. Increased cAMP can result from the binding of glucagon to glucagon receptors.
❚ Fate of Pyruvate
Pyruvate is situated at a metabolic crossroad (Figure 3.19). Depending on the type of cell and hormonal and
Lactic acid
Oxaloacetate
(OAA)
RBC (always) andskeletal muscle duringfasting and higher intensityexercise
Skeletal muscle duringfasting and enduranceexercise
In liver during fasting and endurance exercise forglucose production
In liver during fasting and endurance exercise for glucose production
(many cells)
(mitochondria)
Gluconeogenesis(liver via OAA)
Glycolysis(all cells)
Glucose
PYRUVATE
Acetyl CoA
Alanine
Amino acids
(nonalanine)
FIGURE 3.19 Pyruvate Sits at the Crossroads of Several Metabolic Pathways. Depending on the cell type and metabolic scenario, pyruvate can be used for fuel in mitochondria (via conversion to acetyl CoA), converted to lactate for exportation from a cell (e.g., red blood cell [RBC], skeletal muscle), or used to make glucose (in the liver) and the amino acid alanine (in skeletal muscle).
80 CHAPTER 3 | Carbohydrates: Energy, Metabolism, and More
9781449689582_CH03.indd Page 80 10/22/13 10:41 AM f451 9781449689582_CH03.indd Page 80 10/22/13 10:41 AM f451 /201/JB00096/work/indd/201/JB00096/work/indd

NADH NAD+
CH3 C COOH
OPyruvate Lactic Acid
CH3
Lactate dehydrogenase
CH COOH
OH
FIGURE 3.20 The Conversion of Pyruvate to Lactate. The conversion of pyruvate to lactate is a reduction reaction. In the process, NADH is oxidized to NAD1.
metabolic infl uences, pyruvate can either be converted to the amino acid alanine or to lactate in the cytosol or enter mitochondria and be converted to acetyl CoA or oxaloacetate. The conversion of pyruvate to lactate is a reduction reaction, and in the process NADH is oxidized to NAD1 (Figure 3.20). This negates the NADH created in glycolysis. This reaction is catalyzed in both directions by lactate dehydrogenase (LDH), which itself has fi ve iso-forms. LDH is composed of four subunits of either the heart (H) or muscle (M) type (i.e., MMMM, MMMH, MMHH, MHHH, HHHH), and diff erent tissues express diff erent forms. Lactate is produced in larger amounts in muscle and erythrocytes and can diff use into the blood and serve as a gluconeogenic precursor in the liver or as an energy source for other cells.
Pyruvate in the mitochondria can be converted to ace-tyl CoA. Pyruvate dehydrogenase catalyzes this reaction, and NAD1 is reduced to NADH in the process. NADH can then transfer electrons to the electron transport chain. Pyruvate dehydrogenase exists in either a phos-phorylated (inactive) or dephosphorylated (active) form. The products of pyruvate dehydrogenase—acetyl CoA and NADH—activate the kinase that phosphorylates and inactivates pyruvate dehydrogenase. Conversely, CoASH (uncombined coenzyme A), NAD1, and ADP inactivate the kinase, which keeps pyruvate dehydrogenase in an active state. Therefore, pyruvate dehydrogenase activity is controlled hormonally as well as by the metabolic state within the cell.
Glycogen TurnoverLike other bidirectional metabolic events, glycogen metabolism can be viewed as the algebraic net product of opposing operations: glycogen synthesis and glyco-genolysis. It is possible, and often a reality, for these two mechanisms to operate at the same time. Thus, the governing factor becomes the relative infl uences of
all the factors related to these operations. Some of the infl uences, such as metabolic products and intracellular factors (e.g., AMP, Ca21) may primarily exert their infl u-ence on only one of the two pathways, whereas others, such as hormones, can exert their infl uence on both pathways. For example, AMP increases glycogen deg-radative operations only, whereas epinephrine and glu-cagon both activate mechanisms involved in glycogen breakdown as well as inactivate mechanisms involved in glycogen synthesis.
Glycogen contains more branching than plant starch, with points of branching occurring every 8 to 10 resi-dues (see Figure 3.8). One glucose unit with an exposed anomeric carbon is located at the reducing end of each glycogen molecule, and this monomer is attached to the protein glycogenin. This glucose unit functions as per-haps the anchoring and initiating point for the glycogen molecule, and it is believed that this glucose molecule is not readily available. The straight-chain oligosaccharide that extends from the reducing glucose monomer is the glycogen primer. The glucose monomers at the ends of the initial straight chain as well as branch chains are called nonreducing units; these serve as points of attachment for new monomers during synthesis and as points of removal during glycogen breakdown.
❚ Glycogen Synthesis
Glycogen is found in several types of tissue, with the high-est concentration being in hepatocytes of the liver and muscle cells (especially type II muscle fi bers). The building block for glycogen is uridine diphosphate glucose (UDP-glucose), which is formed from glucose-1-phosphate, which itself is synthesized from glucose-6-phosphate (Figure 3.21). Insulin activates glycogen synthase, which is the key regulatory enzyme in this process. When a grow-ing straight chain contains 11 or more glucose monomers, another enzyme, called branching enzyme or glucosyl 4:6 transferase, relocates an oligomer of about 6 to 8 mono-mers and reattaches it via an a1–6 linkage at what becomes a branch point.
❚ Glycogen Degradation
Glycogen degradation (glycogenolysis) is catalyzed by the active phosphorylase (phosphorylase a) enzyme (Figure 3.22). This enzyme is activated by epinephrine and increased intracellular AMP levels in muscle cells. The increased presence of AMP is mostly associated with muscle cell contraction and the hydrolysis of ATP
Major Metabolic Pathways for Carbohydrate 81
9781449689582_CH03.indd Page 81 10/22/13 10:41 AM f451 9781449689582_CH03.indd Page 81 10/22/13 10:41 AM f451 /201/JB00096/work/indd/201/JB00096/work/indd

H
HHOH
HO
HO
H O
O
P
O O
P
O
–O O–O
H
CH2OH
H
UDP
HHOH
OH
HO
H O H
O O
CH2OH
H
HHOH
OH
H O H
CH2OH
OH
H H
OH
H
CH2 O
H
Uracil
H
HHOH
OH
HO
H O H
O O
CH2OH
H
HHOH
OH
H O H
CH2OH
H
HHOH
OH
H O
CH2OH
O
H
Nonreducing end of
a glycogen chain
with n residues
(n > 4)
Elongated glycogen
(n + 1 residues)
UDP-glucose
Glycogen
synthase
Nonreducing end
with newly added
residue
FIGURE 3.21 Glycogen Synthesis. The building block for glycogen is uridine diphosphate glucose (UDP-glucose), which is attached to the nonreducing end of a glycogen chain by glycogen synthase.
to ADP. As a means of regenerating ATP, a phosphate from one ADP can be transferred to another ADP via adenylate kinase, producing ATP and AMP. Meanwhile, glucagon and epinephrine both participate in the acti-vation of phosphorylase in hepatocytes. As mentioned earlier, both epinephrine and glucagon elicit a second messenger cascade that culminates in an increased intra-cellular concentration of cAMP. In a chain of events, cAMP activates cAMP-dependent protein kinase, which, in turn, activates phosphylase kinase by converting it from inactive phosphorylase kinase b to the phosphory-lated active phosphorylase kinase a form. Phosphorylase kinase a then can (1) activate phosphorylase (phosphor-ylase a), which can break down glycogen, and (2) inac-tivate glycogen synthase to inhibit counterproductive glycogen synthesis.
Phosphorylase a, with the assistance of vitamin B6, detaches glucose monomers from glycogen, forming glucose-1-phosphate, which is subsequently converted
to glucose-6-phosphate by phosphoglucomutase. Phos-phorylase a can liberate about 90% of glucose resi-dues from glycogen as it splits the a1–4 links (straight chain). Glucose-6-phosphate in hepatocytes can be dephosphorylated by glucose-6-phosphatase in the endoplasmic reticulum. Glucose is transported out of the endoplasmic reticulum by GLUT7 and can diffuse from the hepatocyte via GLUT2 and enter circulation. A debranching enzyme is responsible for the liberation of glucose units at branch points (approximately 10% of total glucose). The product of this activity is free glucose that can be transported out of the cell in the liver, again by GLUT2.
Pentose Phosphate PathwayThe primary importance of the pentose phosphate pathway (Figure 3.23) is the reduction of NADP1 to NADPH, which can be used for reducing equivalents for
82 CHAPTER 3 | Carbohydrates: Energy, Metabolism, and More
9781449689582_CH03.indd Page 82 10/22/13 10:41 AM f451 9781449689582_CH03.indd Page 82 10/22/13 10:41 AM f451 /201/JB00096/work/indd/201/JB00096/work/indd

FIGURE 3.22 Glycogenolysis. Glycogen degradation, or glycogenolysis, begins with activation of phosphorylase. Phosphorylase activity is increased by the binding of epinephrine to receptors in skeletal muscle and liver cells (hepatocytes) and glucagon in the liver. The activation involves a cascade of steps. Phosphate (P
i), Ca21, adenosine monophosphate (AMP), and inosine monophosphate (IMP) all can increase the
activity of phosphorylase, either directly or by increasing the activity of phosphorylase kinase. Active phosphorylase kinase also inactivates glycogen synthase (not shown) to minimize counterproductive glycogen synthesis.
Adenylate cyclase(inactive)
Adenylate cyclase(active)
Epinephrine (muscle and liver)Glucagon (liver)
Hormonal Regulation
• Epinephrine and glucagon (liver) increase the conversion of phosphorylase b to a• Insulin increases the conversion of phosphorylase a to b via protein phosphatase
Metabolic Regulators
• Pi is needed as a substrate for phosphorylase• Ca2+ increases the activity of phosphorylase kinase• AMP and IMP can increase the activity of phosphorylase b independent of conversion to phosphorylase a
cAMP-dependentprotein kinase (inactive)
ATP
ATP ADP
cAMP
cAMP-dependentprotein kinase (active)
Phosphorylasekinase b (inactive)
Phosphorylasekinase a (active)Ca2+
Proteinphosphatase*
Phosphorylase b
Glucose-6-phosphate Glucose-1-phosphate
Pi
Phosphorylase a
GLYCOGEN
the synthesis of certain molecules (i.e., fatty acids), glu-tathione reduction, or other reactions. Also, this reaction pathway allows for the creation of ribulose-5-phosphate, which may be isomerized to ribose-5-phosphate and used in nucleotide biosynthesis. The reactions of the pentose phosphate pathway can be described as either oxidative or nonoxidative. The oxidative reactions include the con-version of glucose-6-phosphate to phosphogluconolac-tone via glucose-6-dehydrogenase and the conversion of 6-phosphogluconate to ribulose-5-phosphate. Both reac-tions reduce NADP1 to NADPH, and the latter reaction also produces CO2. The nonoxidative reactions allow for
the regeneration of the glycolytic intermediates glyceral-dehyde-3-phosphate and fructose-6-phosphate.
Krebs Cycle (Citric Acid Cycle)The Krebs cycle or citric acid cycle (Figure 3.24), which occurs in the mitochondrial matrix, consists of eight key sequential reactions whereby the fi nal reaction produces the reactant for the fi rst reaction that forms citric acid, the fi rst product and reactant in the second reaction in the path-way. Therefore, this pathway is considered cyclic. In the reaction, acetyl CoA, which can be derived from a variety
Major Metabolic Pathways for Carbohydrate 83
9781449689582_CH03.indd Page 83 10/22/13 10:41 AM f451 9781449689582_CH03.indd Page 83 10/22/13 10:41 AM f451 /201/JB00096/work/indd/201/JB00096/work/indd

Pentose Phosphate Pathway
Glucose-6-P
Glucose-6-phosphatedehydrogenase
Gluconolactonase
6-Phosphogluconate
NADP+
NADPH
H2O
H+
6-Phosphogluconolactone
6-phosphogluconatedehydrogenase
Ribulose-5-phosphate
NADP+
NADPH
CO2
Ribulose-5-phosphateIsomerase
Transketolase
Transaldolase
Glycolysis
Transketolase
Ribulose-5-phosphate3-Epimerase
Ribose-5-phosphate Xylulose-5-phosphate
Glyceraldehyde-3-phosphate + Sedoheptulose-7-phosphate
Fructose-6-phosphate + Erythrose-4-phosphate
Glyceraldehyde-3-phosphate + Fructose-6-phosphate
Xylulose-5-phosphate
Glycolysis Glycolysis
Oxid
ati
ve P
hase
No
no
xid
ati
ve P
hase
FIGURE 3.23 The Pentose Phosphate Pathway. This pathway is a principal means of reducing NADP+ to NADPH, which can be used for reducing equivalents for the synthesis of certain molecules (i.e., fatty acids), glutathione reduction, or other reactions and for creating ribose-5-phosphate, as well as being used in nucleotide biosynthesis.
84 CHAPTER 3 | Carbohydrates: Energy, Metabolism, and More
9781449689582_CH03.indd Page 84 10/22/13 10:41 AM f451 9781449689582_CH03.indd Page 84 10/22/13 10:41 AM f451 /201/JB00096/work/indd/201/JB00096/work/indd

FIGURE 3.24 The Krebs Cycle. The Krebs (citric acid) cycle occurs in the mitochondrial matrix and consists of eight sequential reactions whereby the fi nal reaction produces a potential reactant for the fi rst reaction. NADH and FADH
2 can transfer electrons to the electron transfer
chain to yield three and two ATP, respectively.
H2
H2
C
OO–
OO–
C
C
C
Succinate
NADH + H+
C
O
H3C H2O +
Acetyl CoA
FAD
H2
H2
HO
OO–C
OO–C
OO–C
C
C
C
Citrate
H2
H
H
OO–C
OO–C
OO–C
C
C
CHO
IsocitrateIsocitrate dehydrogenase
H2
H
OO–C
OO–C
OO–C
C
C
C
cis-Aconitate
Aconitase
Aconitase
Krebs Cycle
NAD+
NADH + H+
FADH2
NAD+
CO2CO2
NAD+
CO2
NADH + H+
H2O
Succinyl CoA
Succinyl CoAsynthetase
Succinatedehydrogenase
Malatedehydrogenase
Fumarase
H2
H2
O
C
OO–
C
C
C
S CoAH2
H2
O
OO–C
OO–C
C
C
C
α-Ketoglutarate
α-Ketoglutaratedehydrogenasecomplex
Oxaloacetate
Citratesynthase
H2
O
C
OO–
OO–
C
C
C
Malate
H2
HHO
C
OO–
OO–
C
C
C
H
H
C
OO–
OO–
C
C
C
Fumarate
ATP
ADP + Pi
GTP
GDP + Pi
Major Metabolic Pathways for Carbohydrate 85
9781449689582_CH03.indd Page 85 10/22/13 10:41 AM f451 9781449689582_CH03.indd Page 85 10/22/13 10:41 AM f451 /201/JB00096/work/indd/201/JB00096/work/indd

of isocitrate, which is converted back to citrate by aconi-tase. Citrate inhibits citrate synthase, and thus citrate accumulates in the mitochondria. This will be important later when fatty acid synthesis is discussed.
Increased ADP:ATP ratio will speed up the Krebs cycle in general in two ways. Increased ADP indicates a need for cellular energy, and thus the electron transport chain will operate at a greater rate, thereby creating a higher NAD1:NADH ratio. Second, ADP allosterically increases isocitrate dehydrogenase activity.
GluconeogenesisGluconeogenesis (Figure 3.25), the production of glu-cose from noncarbohydrate substrates, occurs mainly in the liver. The major precursors are lactate, glycerol, and certain amino acids. Gluconeogenesis uses several revers-ible reactions of glycolysis but must create chemical reac-tion bypasses around several unidirectional reactions, in which the enzyme only catalyzes the reaction in the direction of glycolysis. Thus, gluconeogenesis cannot be viewed simply as the reversal of glycolysis.
Pyruvate cannot be made into phosphoenolpyruvate by a simple reversal of the reaction. The amino acid ala-nine and lactate are major gluconeogenic precursors, and both are converted to pyruvate in the liver. For pyruvate to be converted to phosphoenolpyruvate, pyruvate must fi rst diff use into the mitochondria and undergo conver-sion to oxaloacetate (OAA) and then malate. Pyruvate carboxylase catalyzes the conversion of pyruvate to OAA. Oxaloacetate is converted to malate by malate dehydrogenase. Malate can exit the mitochondria, but oxaloacetate cannot. Once the malate is in the cytoplasm, it is converted again to OAA by malate dehydrogenase. Finally, OAA is converted to phosphoenolpyruvate by the enzyme phosphoenolpyruvate carboxykinase (PEPCK).
LipogenesisIncreased dietary carbohydrate intake may result in increased liver lipogenesis. Although insulin is released in response to carbohydrate intake and is well known for its lipogenic eff ects, some evidence suggests that glucose alone can enhance liver lipogenesis. Increased intake of carbohydrate can lead to gene expression of a variety of glycolytic and lipogenic pathways that play a role in con-verting glucose to fatty acids. Key enzymes that are up-regulated in response to a high-carbohydrate diet include liver pyruvate kinase in glycolysis; acetyl-CoA carboxy-lase, the fi rst enzyme in the biosynthesis of fatty acids;
of sources, condenses with oxaloacetate, forming citrate. Citrate synthase is the catalyzing enzyme, and its activity is inhibited by its product. Aconitase catalyzes the conver-sion of citrate to isocitrate and has bidirectional activity, but favors citrate formation. Isocitrate dehydrogenase then converts isocitrate to a-ketoglutarate in the fi rst oxidative reaction of the Krebs cycle. NAD1 is reduced to NADH, and CO2 is produced. The next reaction is also oxidative, because a-ketoglutarate is converted to succinyl CoA by a-ketoglutarate dehydrogenase. Here again, NAD1 is reduced to NADH and CO2 is produced.
In the next reaction, the energy liberated by the cleav-age of the high-energy thioester bond of succinyl CoA to form succinate and coenzyme A is suffi cient to phos-phorylate GDP (guanosine diphosphate), forming GTP (guanosine triphosphate). Next, succinate is converted to fumarate by succinate dehydrogenase in the third oxi-dizing reaction of the Krebs cycle. However, here FAD is reduced to FADH2. Then fumarate catalyzes the con-version of fumarate to malate. Malate is subsequently converted to oxaloacetate in the fourth oxidizing reac-tion, one that reduces NAD1 to NADH. This is an equi-librium reaction that favors malate. The products of the Krebs cycle are three NADH, one FADH2, and three CO2 molecules. Thus, 12 ATP molecules can be generated from each citrate molecule formed in the initial reac-tion. So, in total, the complete oxidation of glucose can yield 36 to 38 ATP. Four total ATP are generated in substrate-level phosphorylation (2 each in glycolysis and the Krebs Cycle), while 10 NADH and 2 FADH2 are generated via glycolysis in the cyptoplasm and the con-version of pyruvate to acetyl CoA and the Krebs Cycle in mitochondria. NADH and FADH2 generated in the mitochondria yield 3 and 2 ATP via the electron trans-port chain, respectively, while NADH generated in the cytoplasm will yield either 2 or 3 ATP, depending on how it enters the mitochondria.
The events of the Krebs cycle are infl uenced primar-ily by the redox state of NAD1:NADH, the cellular level of intermediates, and the energy level (ADP:ATP) of a cell. For instance, if the ratio of NADH to NAD1 is high, then the activities of isocitrate dehydrogenase, a-ketoglu-tarate dehydrogenase, and malate dehydrogenase slow due to relative lack of a reactant. A high NADH:NAD1
ratio dictates that the reversible malate dehydrogenase catalyzes in the direction of malate, thus reducing the concentration of oxaloacetate, a reactant in the fi rst reaction. Also, inhibition of isocitrate dehydrogenase by increased NADH:NAD1 ratio results in the accumulation
86 CHAPTER 3 | Carbohydrates: Energy, Metabolism, and More
9781449689582_CH03.indd Page 86 10/22/13 10:41 AM f451 9781449689582_CH03.indd Page 86 10/22/13 10:41 AM f451 /201/JB00096/work/indd/201/JB00096/work/indd

FIGURE 3.25 Gluconeogenesis. Gluconeogenesis, the production of glucose from noncarbohydrate substrates, occurs mainly in the liver. Lactate, glycerol, and alanine, as well as other amino acids, are major substrates in the liver. Glycerol is derived from fat breakdown in adipose tissue. Lactate is derived from RBCs and muscle during exercise. Most amino acids are derived from liver and muscle protein.
PEP, phosphoenolpyruvate; CoA, coenzyme A
ADP
NAD+
ADP
Asparagine
Aspartate
IsoleucineLeucineTrypophan
CysteineAlanineSerineGlycineThreomineTryprophan
Cytosol
IsoleucineMethonineThreonine
Naline
Fumerate
PhenylalanineTyrosine
Mitochondria
ArginineGlutamateGlutamineHistidine, Proline
Lactate
PEP
Pyruvate
Acetyl CoA
Oxaloacetate
ATP
ATP
NADH + H+
Krebs
Cycle
CoA
GDPCO2GTP
Aspartate
NADH2
NAD+
Glycerol
Glucose
GLUT2
Glucose
Circulation
Oxaloacetate
Succinyl CoA
Fumarate
Cell membrane
Malate
α-ketoglutarate
Major Metabolic Pathways for Carbohydrate 87
9781449689582_CH03.indd Page 87 10/22/13 10:41 AM f451 9781449689582_CH03.indd Page 87 10/22/13 10:41 AM f451 /201/JB00096/work/indd/201/JB00096/work/indd

and fatty acid synthase, to name only a few. How does glucose up-regulate these genes independent of insulin? The mechanism by which these events occur is due to the transcription protein carbohydrate response element binding protein (ChREBP), which is activated by a high-carbohydrate diet. ChREBP was originally studied in the liver, because most glucose and lipid metabolism occurs in that organ, but other tissues also contain this protein, including adipose, intestine, kidney, and muscle tissue.
The promoters of enzymes involved in lipogenesis noted above have binding sites for ChREBP or response elements, which are nucleotide base pairs that bind ChREBP to DNA (Figure 3.26). This transcription pro-tein is normally abundant in the cytosol in fasting condi-tions and is apparently unable to enter the cell nucleus due to the degree of phosphorylation. However, when glucose in the cytosol increases, a series of reactions occurs to partially dephosphorylate ChREBP, which allows it to translocate to the nucleus and bind to the promoters of the genes encoding these enzymes. Interestingly, it is not glucose itself, but rather a metab-olite, xylulose-5-phosphate, that initiates the steps in dephosphorylating ChREBP. After up-regulation of the target genes has occurred, ChREBP is phosphory-lated by either cAMP or AMP-dependent kinases, which causes the ChREBP to disassociate from the gene pro-moters and exit the nucleus.
Nucleus
CytosolGlucose
Xylulose-5-phosphate
Proteinphosphatase 2A
ChREBP
PProtein phosphatase 2A
heterotetramerforms with
2 ChREBP and2 Mlx proteins
Response element orpromoter binding site
gene
transcription
Kinases
Mlx proteins
P P
P i P i
P i
P P P
P P
FIGURE 3.26 Carbohydrate Response Element Binding Protein (ChREBP). ChREBP regulates lipogenesis by binding to the promoters of genes to enhance transcription of genes involved with fat synthesis in response to glucose.
Summary1. Carbohydrates are a class of nutrients that include
sugars, starches, fi bers, and related molecules such as glycosaminoglycans, amino sugars, and more. Carbohydrates provide energy for all cells and play structural and functional roles in cells and tissue.
BEFORE YOU GO ON . . .
1. What are the impacts of insulin and glucagon on phosphofructosekinase 2 (PFK2) activity, and how is this activity mediated?
2. What is the role of uridine diphosphate glucose (UDP-glucose) in the synthesis of glycogen?
3. How do increased cAMP levels resulting from increased glucagon play a role in glycogen breakdown?
4. What are the two ways in which an increased ratio of ADP to ATP enhances activity in the Krebs cycle?
5. How is phosphoenolpyruvate in glycolysis made from pyruvate to generate more glucose in gluconeogenesis?
88 CHAPTER 3 | Carbohydrates: Energy, Metabolism, and More
9781449689582_CH03.indd Page 88 10/22/13 10:41 AM f451 9781449689582_CH03.indd Page 88 10/22/13 10:41 AM f451 /201/JB00096/work/indd/201/JB00096/work/indd

2. Fibers are special carbohydrates and related mole-cules that are not broken down by digestive enzymes. However, based on their metabolism by gut micro-fl ora and conversion to absorbable energy molecules, they can provide a small amount of energy.
3. Carbohydrate contributes roughly 50% of the calories in the typical adult diet. Although some monosaccharides are available in the diet via fruits, most are derived from disaccharides and polysac-charides. Cereal grains such as rice and wheat, as well as potatoes, make a signifi cant contribution to carbohydrate intake, as do fruits and dairy foods.
4. The Acceptable Macronutrient Distribution Range (AMDR) for carbohydrate intake in the United States and Canada is 45% to 65% of total energy. The broad range of AMDR is meant to provide individual guidance based on glucose tolerance and activity level. Meanwhile, it is recommended that the intake of added sugar not exceed 25% of calo-ries, providing guidance for people to derive more than 75% of their carbohydrates from foods such as dairy products, grains, legumes, and fruits and vegetables.
5. Circulating glucose and stored glycogen are princi-pal energy sources for most cells and tissues and are mandatory for others, such as red blood cells and the brain. Red blood cells can only use glucose for fuel, and in the process generate lactate.
6. Monosaccharides gain access to cells via glucose transport proteins, which vary based on their pres-ence in diff erent tissue and their Km. GLUT4 is the glucose transporter in muscle and adipose tissue responsible for reducing much of circulating blood glucose after a meal.
7. Carbohydrate metabolism is regulated by hor-mones such as insulin, epinephrine, glucagon, and cortisol. In general, insulin is anabolic with regard to carbohydrate, whereas epinephrine is catabolic, leading to glycogen breakdown in the liver and muscle. Cortisol supports glycogen storage and gluconeogenesis simultaneously in the liver.
8. Insulin is primarily anabolic, directing the uptake of glucose into muscle and adipose tissue cells dur-ing hyperglycemic states. This happens via stimula-tion of the translocation of GLUT4 from storage sites within those cells.
9. Glucagon, cortisol, and epinephrine work to raise blood glucose levels by supporting gluconeogen-esis in hepatocytes. Glucagon strongly promotes
glycogen breakdown in the liver, whereas epineph-rine promotes glycogen breakdown in both the liver and skeletal muscle.
10. Glycogen is found in a variety of tissues but is most concentrated in the liver and muscle. Liver glyco-gen serves as a resource to preserve blood glucose levels during early fasting, whereas muscle glyco-gen serves as an immediate energy resource during intense physical activity, including strenuous exer-cise. Lactate derived from muscle glycogen metab-olism can circulate to the liver and be converted to glucose, which, in turn, can enter the blood and serve as energy for muscle and other tissue.
Suggested ReadingBrand-Miller JC. Glycemic load and chronic disease. Nutr Rev.
2003;61:49S–55S.Campos FG, Logulla Waitzberg AG, Kiss DR, Waitzberg DL, Habr-
Gama A, Gama-Rodrigues J. Diet and colorectal cancer: current evidence for etiology and prevention. Nutr Hosp. 2005;20:18–25.
Dekker MJ, Su Q, Baker C, Rutledge AC, Adeli K. Fructose: a highly lipogenic nutrient implicated in insulin resistance, hepatic steato-sis, and the metabolic syndrome. Am J Physiol Endocrinol Metab. 2010;299(5):E685–E694.
Eastwood M, Kritchevsky D. Dietary fi ber: how did we get where we are? Annu Rev Nutr. 2005;25:1–8.
Erkkila AT, Lichtenstein AH. Fiber and cardiovascular disease risk: how strong is the evidence? J Cardiovasc Nurs. 2006;21:3–8.
Institute of Medicine, Food and Nutrition Board. Dietary Reference Intakes for Energy, Carbohydrate, Fiber, Fat, Fatty Acids, Cholesterol, Protein, and Amino Acids (Macronutrients). Washington, DC: National Academies Press; 2002/2005.
Ishil S, Ilzuka K, Miller BC, Uyeda K. Carbohydrate response element binding protein directly promotes lipogenic enzyme gene tran-scription. PNAS. 2004;101:15597–15602.
Klein S. Clinical trial experience with fat-restricted vs carbohydrate-restricted weight-loss diets. Obes Res. 2004;12(suppl 2):141S–144S.
Merchant AT, Vatanparast H, Barlas S, et al. Carbohydrate intake and overweight and obesity among healthy adults. J Am Diet Assoc. 2009;109(7):1165–1172.
Schaefer EJ, Gleason JA, Dansinger ML. Dietary fructose and glucose diff erentially aff ect lipid and glucose homeostasis. J Nutr. 2009; 139(6):1257S–1262S.
Seal CJ. Whole grains and CVD risk. Proc Nutr Soc. 2006;65:24–34.U.S. Department of Health and Human Services and U.S. Department
of Agriculture. Dietary Guidelines for Americans, 2005. HHS Publication No. HHS-ODPHP-2005-01-DGA-A. http://www.health.gov/dietaryguidelines/dga2005/document/pdf/DGA2005.pdf.
Uyeda K., Repa JJ. Carbohydrate response element binding protein, ChREBP, a transcription factor coupling hepatic glucose utiliza-tion and lipid synthesis. Cell Metabolism. 2006;4:107–110.
Watson RT, Pessin JE. Intracellular organization of insulin signaling and GLUT4 translocation. Recent Prog Horm Res. 2001;56:175–193.
Suggested Reading 89
9781449689582_CH03.indd Page 89 10/22/13 10:41 AM f451 9781449689582_CH03.indd Page 89 10/22/13 10:41 AM f451 /201/JB00096/work/indd/201/JB00096/work/indd

9781449689582_CH03.indd Page 90 10/22/13 10:41 AM f451 9781449689582_CH03.indd Page 90 10/22/13 10:41 AM f451 /201/JB00096/work/indd/201/JB00096/work/indd