capital markets day 2021 opening remarks
TRANSCRIPT

K+S Aktiengesellschaft
Capital Markets Day 2021 Opening Remarks
Dr. Burkhard Lohr
CEO
November 11, 2021

Welcome

3
REKS antitrust clearance procedure ongoing
▪ We continue to expect an approval can be granted.
▪ Transaction in 2021 still possible.
▪ But the review might also take longer.
▪ Therefore, 2021 outlook now only based on
operating business:
EBITDA 2021
▪ We increase our expectation to €630 million (previous
guidance: €500 to 600 million excluding REKS transaction).
FCF 2021
▪ We increase our expectation to a neutral free cash flow
(previous guidance: €-180 million excluding REKS
transaction).

Full reversal of impairment loss - FREP proceedings ongoing
4
▪ Full reversal of last year’s impairment loss
▪ Write-up mainly results from significantly more optimistic expectations for
the potash business and the price development related to this
▪ Valuation of the Potash and Magnesium Products CGU subject of the
examination of the 2019 and H1/2020 financial statements by the
Financial Reporting Enforcement Panel (FREP – DPR)
▪ Preliminary examination findings received from FREP
▪ Following its own comprehensive review and the involvement of
external advisors, K+S considers these to be unfounded.
▪ K+S therefore commented in detail on the preliminary examination
findings in writing and provided the DPR with an expert opinion by
renowned IFRS experts.
▪ On November 2, 2021, the Company explained its differing opinions to
the DPR in a so-called company meeting.
▪ As proceedings are still ongoing, no further information can be provided
on the facts of the case.
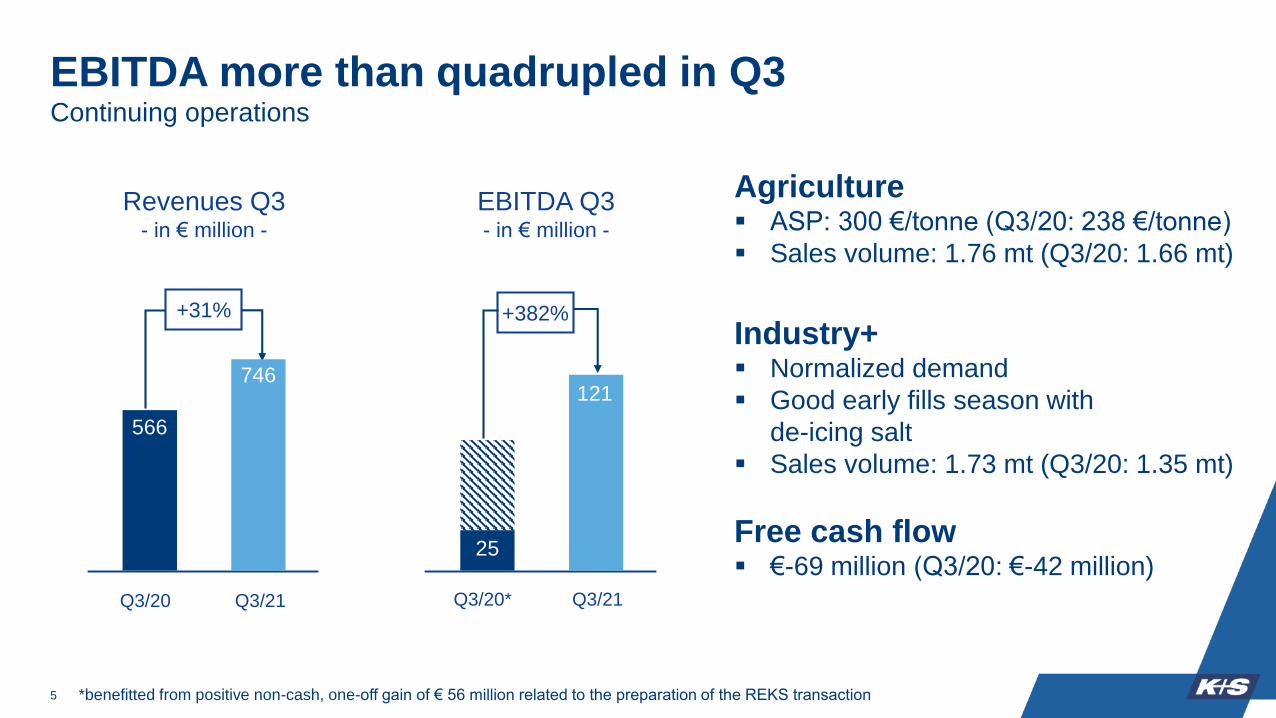
EBITDA more than quadrupled in Q3Continuing operations
Revenues Q3- in € million -
Q3/20 Q3/21
+31%
Q3/20* Q3/21
+382%
EBITDA Q3- in € million -
Agriculture▪ ASP: 300 €/tonne (Q3/20: 238 €/tonne)
▪ Sales volume: 1.76 mt (Q3/20: 1.66 mt)
Industry+▪ Normalized demand
▪ Good early fills season with
de-icing salt
▪ Sales volume: 1.73 mt (Q3/20: 1.35 mt)
Free cash flow▪ €-69 million (Q3/20: €-42 million)
5
566
746
25
121
*benefitted from positive non-cash, one-off gain of € 56 million related to the preparation of the REKS transaction

6
▪ EBITDA of €1 billion* in reach
▪ Significantly positive FCF
Cost inflation included:− freight rates, especially containers
− gas prices/energy costs
− price of raw materials, e.g. for pallets,
packaging or maintenance material, also
influencing capex
− personnel costs
Sneak preview 2022
* excluding REKS transaction

Disclaimer
No reliance may be placed for any purpose whatsoever on the information or opinions contained in the Presentation or on its completeness, accuracy of
fairness. No representation or warranty, express or implied, is made or given by or on behalf of the Company or any of its respective directors, officers,
employees, agents or advisers as to the accuracy, completeness or fairness of the information or opinions contained in the Presentation and no
responsibility or liability is accepted by any of them for any such information or opinions. In particular, no representation or warranty, express or implied, is
given as to the achievement or reasonableness of, and no reliance should be placed on any projections, targets, ambitions, estimates or forecasts
contained in this Presentation and nothing in this Presentation is or should be relied on as a promise or representation as to the future.
This Presentation contains facts and forecasts that relate to the future development of the K+S Group and its companies. The forecasts are estimates
that we have made on the basis of all the information available to us at this moment in time. Should the assumptions underlying these forecasts prove not
to be correct or should certain risks – such as those referred to in the Annual Report – materialize, actual developments and events may deviate from
current expectations. Given these risks, uncertainties and other factors, recipients of this document are cautioned not to place undue reliance on these
forecasts.
This Presentation is subject to change. In particular, certain financial results presented herein are unaudited, and may still be undergoing review by the
Company’s accountants. The Company may not notify you of changes and disclaims any obligation to update or revise any statements, in particular
forward-looking statements, to reflect future events or developments, save for the making of such disclosures as are required by the provisions of statue.
Thus statements contained in this Presentation should not be unduly relied upon and past events or performance should not be taken as a guarantee or
indication of future events or performance.
This Presentation has been prepared for information purposes only. It does not constitute an offer, an invitation or a recommendation to purchase or sell
securities issued by K+S Aktiengesellschaft or any company of the K+S Group in any jurisdiction.
7

K+S Aktiengesellschaft
Capital Markets Day 2021 Workshop Market Outlook & Strategic Roadmap
Dr. Burkhard Lohr
CEO
November 11, 2021
1
50%
75%
100%
125%
150%
175%
200%
225%
250%
275%
300%
Wheat Soybean Corn Palmoil
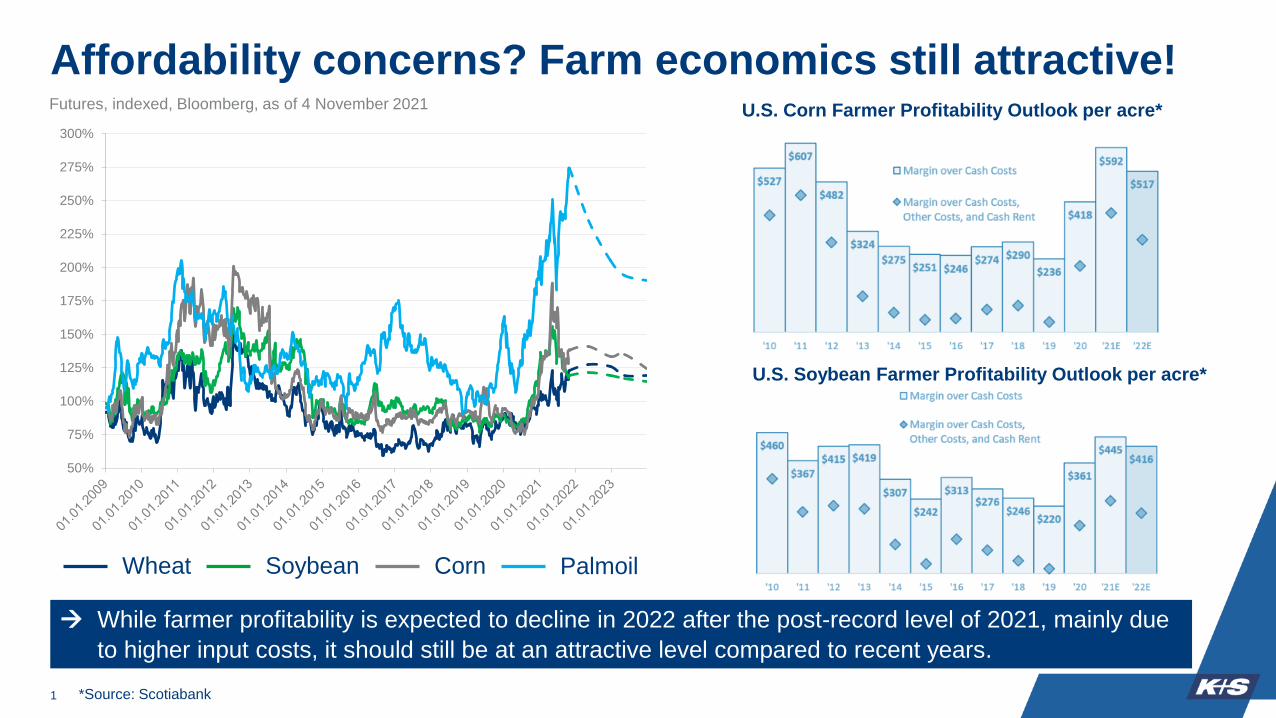
U.S. Corn Farmer Profitability Outlook per acre*
U.S. Soybean Farmer Profitability Outlook per acre*
Affordability concerns? Farm economics still attractive!Futures, indexed, Bloomberg, as of 4 November 2021
→ While farmer profitability is expected to decline in 2022 after the post-record level of 2021, mainly due
to higher input costs, it should still be at an attractive level compared to recent years.
*Source: Scotiabank
2
,0
20,000
40,000
60,000
80,000
100,000
120,000
'00 '05 '10 '15 '20 '25e '30e
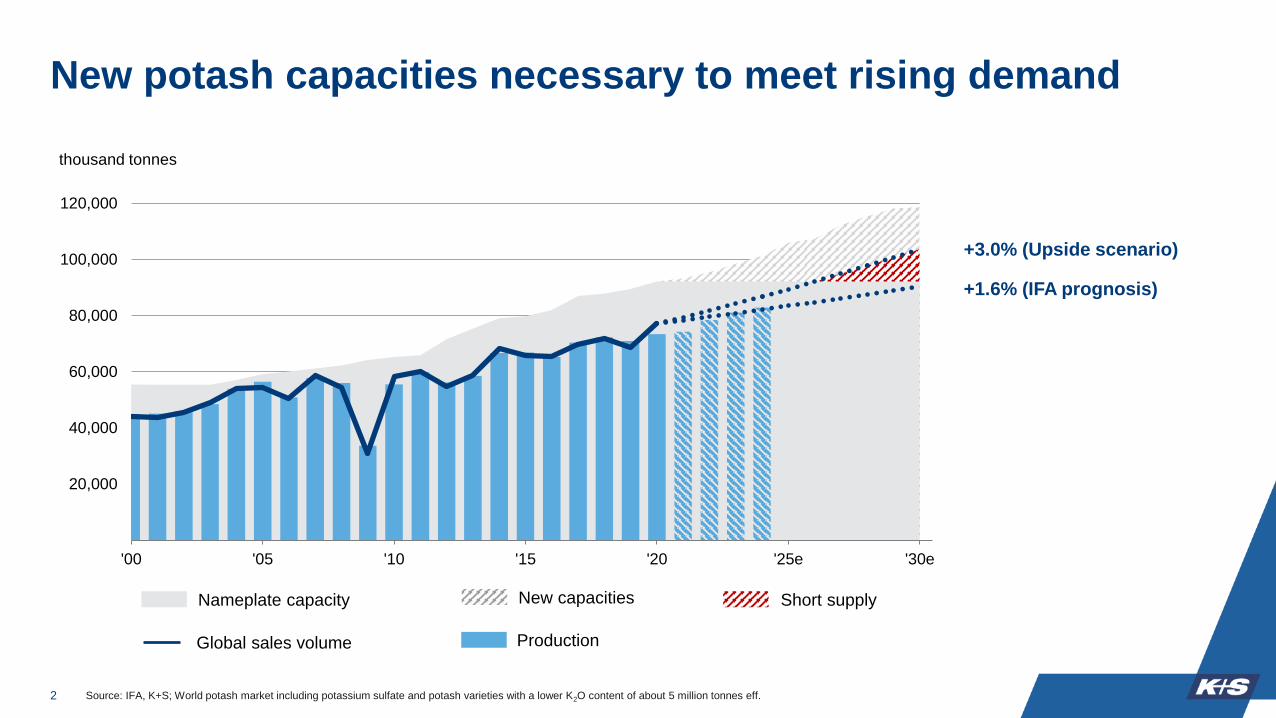
Nameplate capacity
Global sales volume Production
+3.0% (Upside scenario)
+1.6% (IFA prognosis)
New capacities
thousand tonnes
Short supply
New potash capacities necessary to meet rising demand
Source: IFA, K+S; World potash market including potassium sulfate and potash varieties with a lower K2O content of about 5 million tonnes eff.
3
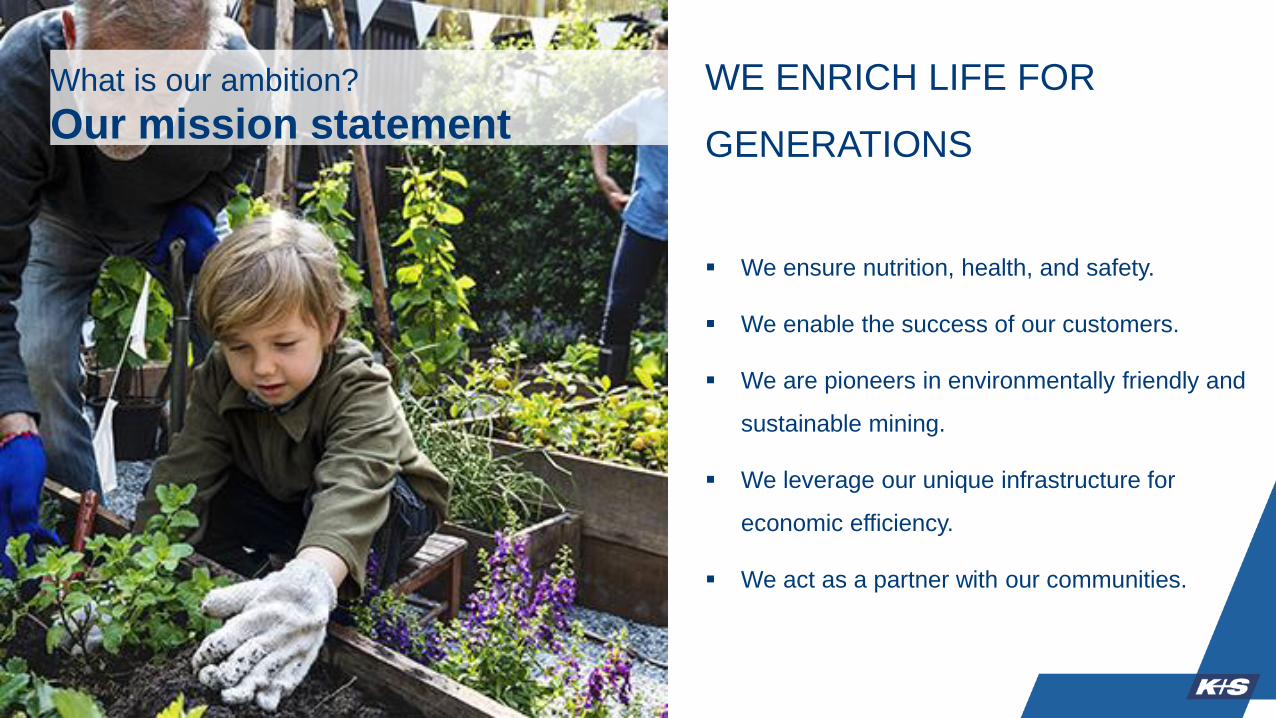
What is our ambition?
Our mission statementWE ENRICH LIFE FOR
GENERATIONS
▪ We ensure nutrition, health, and safety.
▪ We enable the success of our customers.
▪ We are pioneers in environmentally friendly and
sustainable mining.
▪ We leverage our unique infrastructure for
economic efficiency.
▪ We act as a partner with our communities.

4
▪ Potash and magnesium is our core business
→ K+S as a global supplier of plant nutrients and services in the agricultural sector
▪ In developing new business areas, we focus on the subsequent leverage of our existing infrastructure
▪ The climate strategy sets the framework for the development of the existing business and the strategic initiatives
The K+S core business

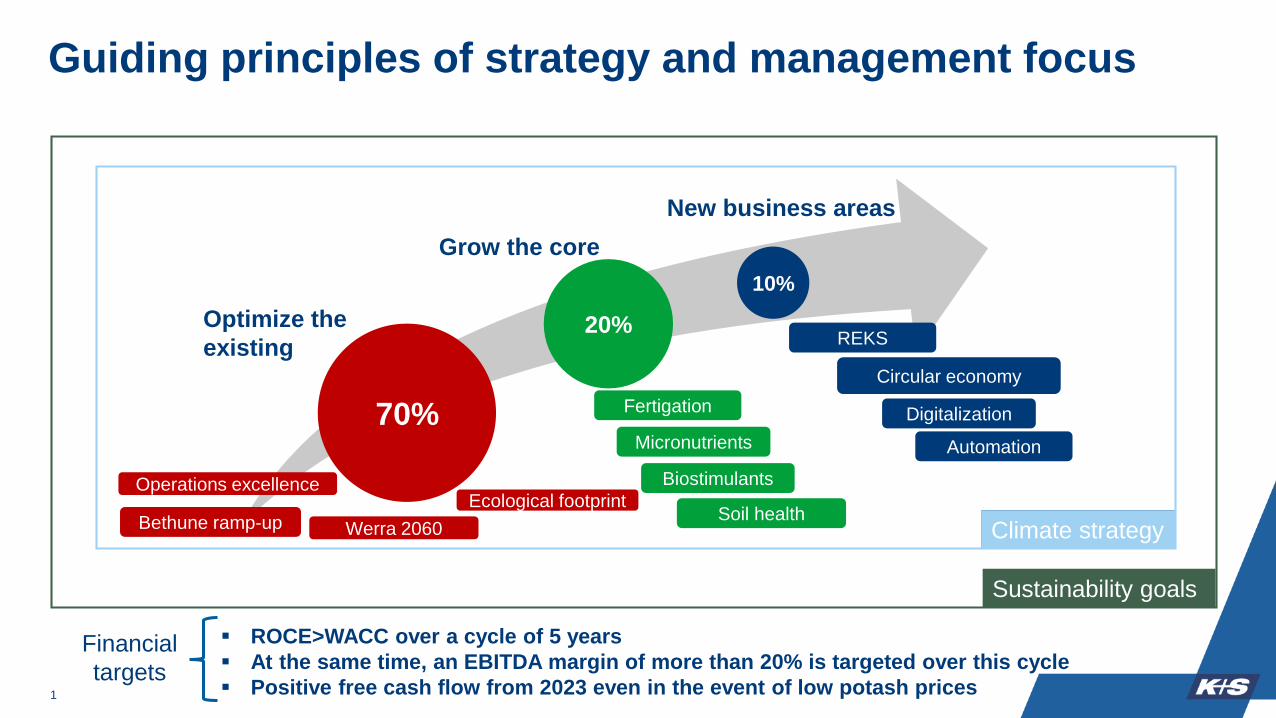
70%
20%Optimize the
existing
Grow the core
New business areas
Guiding principles of strategy and management focus
10%
▪ ROCE > WACC over a cycle of 5 years
▪ At the same time, an EBITDA margin of more than 20% is targeted over this cycle
▪ Positive free cash flow from 2023 even in the event of low potash prices
Sustainability goals
5
Financial
targets
Climate strategy
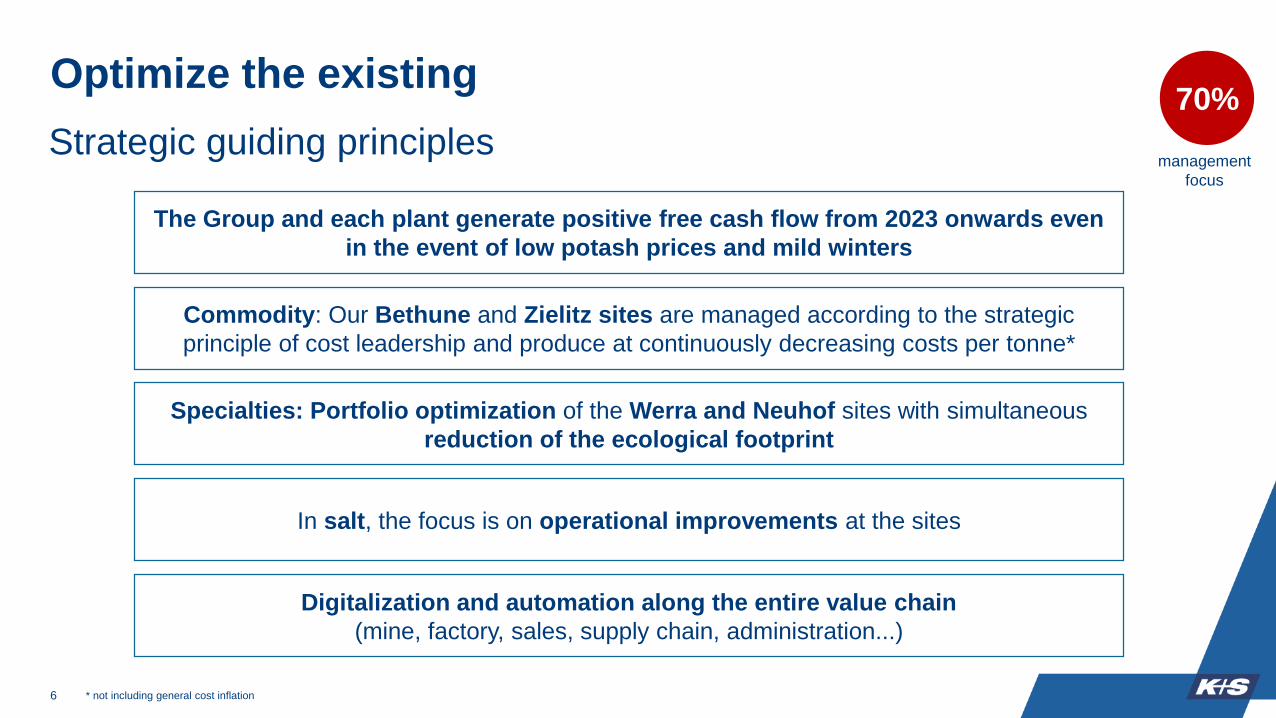
Optimize the existing
6
Commodity: Our Bethune and Zielitz sites are managed according to the strategic
principle of cost leadership and produce at continuously decreasing costs per tonne*
In salt, the focus is on operational improvements at the sites
The Group and each plant generate positive free cash flow from 2023 onwards even
in the event of low potash prices and mild winters
Digitalization and automation along the entire value chain
(mine, factory, sales, supply chain, administration...)
70%
Specialties: Portfolio optimization of the Werra and Neuhof sites with simultaneous
reduction of the ecological footprint
management
focus
Strategic guiding principles
* not including general cost inflation

Grow the core
7
Establishment and expansion of value-added services and digital services
(e.g. agronomic advisory, distribution)
Increase direct presence with end customers / farmers in selected markets
Complementing our product portfolio with additional nutrients, biostimulants, and water-
soluble products (fertigation)
→ K+S as a global supplier of plant nutrients and services
in the agricultural sector
Mainly organic growth
20%
management
focus
Strategic guiding principles

New business areas
8
Active search for alternative utilization potentials for our infrastructure
Focus on decarbonization: carbon capturing storage/utilization, storage of renewable energies
Establishment and further development of REKS
▪ Expansion and optimization of existing business underground waste disposal (UTD) /
underground waste recovery (UTV)
▪ Commencement of business operations of tailings pile coverage
10%
Growth primarily through partnerships
Strategic guiding principlesmanagement
focus

REKS: Transforming
environmental
obligations into an
intelligent and solution-
oriented business model
Ʃ >300mt of material like soil debris, construction
waste or slag from waste incineration
necessary to cover the tailings piles
Wathlingen Werra Zielitz
coverage period in years 20 50 > 50
• For reasons of water, environmental and nature
conservation law, K+S is obliged to keep the
impact of its mining activities on nature as low as
possible
• Waste managment is a growth market, but the
disposal options are becoming increasingly scarce
• REMEX has market access to the quantities
required for covering tailings piles in Germany
Hugo Neuhof-Ellers Siegfried- Giesen
coverage period in years 25 50 20
9

Strategic classification of salt business
10
▪ After sale of OU Americas, reduced global relevance and reach
▪ Risk of new competitors entering the market (e.g., Ciech, Varnitsa)
▪ Continued high dependence on de-icing salt business with simultaneous global warming
▪ Financial and management capacities still scarce:
Focus on business areas with a better opportunity/risk ratio and greater
importance for the overall portfolio
Global market position of the continuing K+S salt business

• Focus on operational and tactical
improvements, e.g., portfolio, costs, efficiency
• Major strategic considerations (market
consolidation, opening up new markets, e.g.,
Asia) are no longer in focus
Salt is no longer a core
business: What does that
mean?
11

K+S Climate Strategy:
80% reduction of GHG emissions (1990 – 2020) already achieved
12
Values in
million t CO2
0
20
40
60
80
100
739
1990
1.0
2020
%1,248 4.7
DE -40%
K+S -79%Germany
K+S
Germany compared to K+S (German potash production, scope 1)
By a change of fuels,
increase of energy efficiency
and closing of sites the GHG
emissions at K+S were
reduced by nearly 80%
between 1990 and 2020.

K+S Climate Strategy
13
Mid-term goal: Long-term goal:
K+S supports the goals of the "Paris
Agreement": Climate neutrality in
2050 can be achieved with a supportive
regulatory framework.
K+S therefore calls for a worldwide level
playing field (until then carbon leakage
protection is required), strong energy
infrastructure, transitional funding and
affordable renewable energies.
(Note: The Paris Agreement sets out a global framework to avoid
dangerous climate change by limiting global warming to well below 2°C
and pursuing efforts to limit it to 1.5°C.)
Reduction of our CO2
emissions by 10% by
2030 compared to 2020.
Short-term goal:
Introduction of a “K+S
climate protection fund”
from 2022 to reduce our
CO2 emissions.

14
K+S Sustainability (ESG) Goals 2030
Our sustainability
goals are
compensation-relevant
for the Board of
Executive Directors
and top-level
management
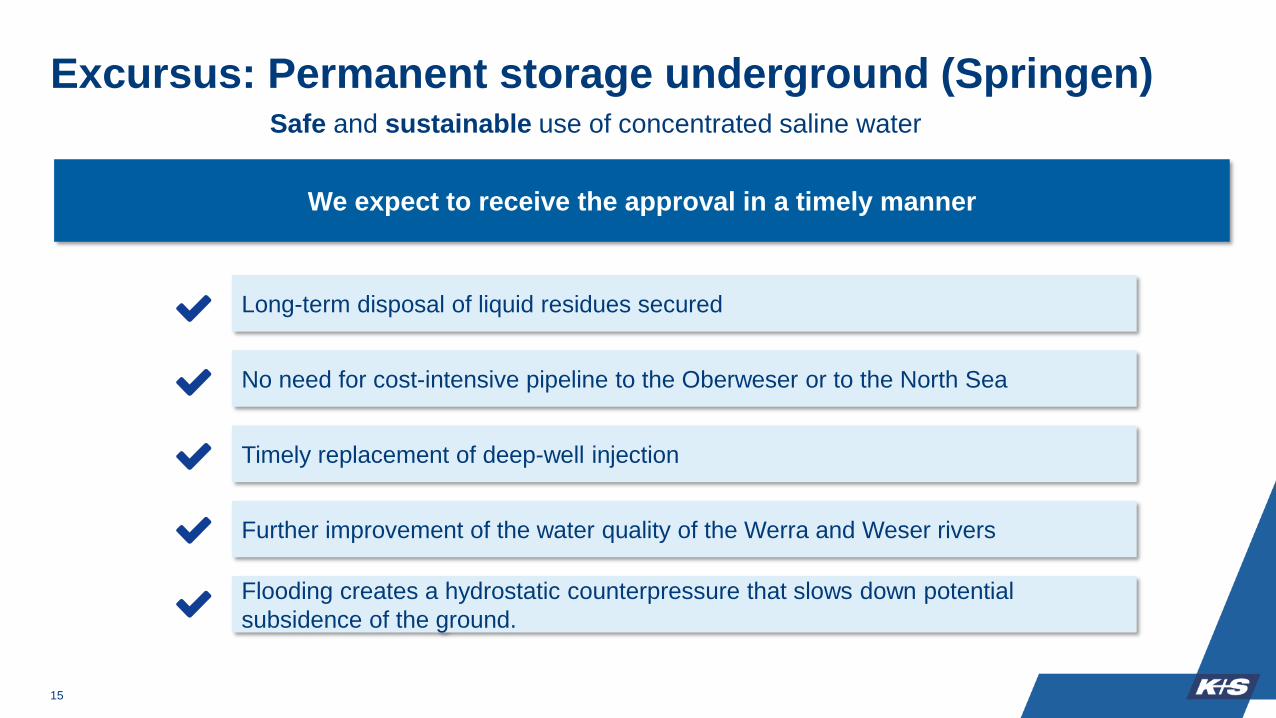
Excursus: Permanent storage underground (Springen)
15
Safe and sustainable use of concentrated saline water
We expect to receive the approval in a timely manner
No need for cost-intensive pipeline to the Oberweser or to the North Sea
Long-term disposal of liquid residues secured
Timely replacement of deep-well injection
Further improvement of the water quality of the Werra and Weser rivers
Flooding creates a hydrostatic counterpressure that slows down potential
subsidence of the ground.

K+S Aktiengesellschaft
Capital Markets Day 2021 Workshop Deep Dive: Optimize the existing and grow the core
Holger Riemensperger
COO
November 11, 2021
70%
20%
Climate strategy
10%
Sustainability goals
Operations excellence
Werra 2060Bethune ramp-up
REKS
Fertigation
Micronutrients
Biostimulants
Circular economy
Digitalization
Automation
Ecological footprintSoil health
▪ ROCE>WACC over a cycle of 5 years
▪ At the same time, an EBITDA margin of more than 20% is targeted over this cycle
▪ Positive free cash flow from 2023 even in the event of low potash prices1
Guiding principles of strategy and management focus
Financial
targets
Optimize the
existing
Grow the core
New business areas

Priority matrix determines management focus
2
Pro
ba
bilit
yo
fre
aliza
tio
n
Urgencylow low/high high
low
low
/hig
h h
igh
optimize
the existing Optimize the
existing
Grow the core
New business areas
70%
20%
10%
Management
focus
Qualitative size / EBITDA-contribution 2030
2
grow
the
core

Werra
3
Profitability *
Future prospects
(deposit / inventories, permit situation)
Unter-
breizbach Bethune
Hattorf
low high
low
high
Zielitz
Winters-
hall
Strategic direction of the potash primary sites
* based on 2020 results
Neuhof
Commodity alignment Cost
leadership, ramp up
Commodity alignment
Highly efficient potash siteSpecialties alignment
Expansion of product portfolio
Turn-around
70%
4
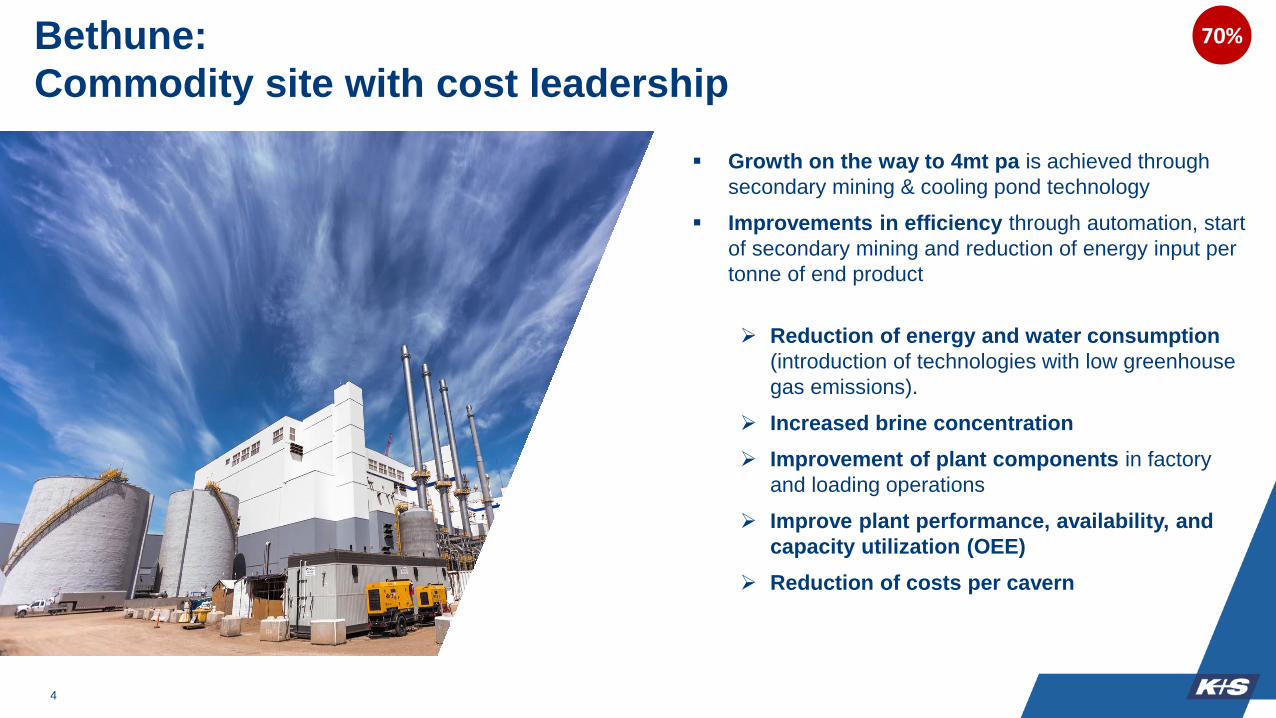
▪ Growth on the way to 4mt pa is achieved through
secondary mining & cooling pond technology
▪ Improvements in efficiency through automation, start
of secondary mining and reduction of energy input per
tonne of end product
➢ Reduction of energy and water consumption
(introduction of technologies with low greenhouse
gas emissions).
➢ Increased brine concentration
➢ Improvement of plant components in factory
and loading operations
➢ Improve plant performance, availability, and
capacity utilization (OEE)
➢ Reduction of costs per cavern
Bethune:
Commodity site with cost leadership
70%

4mtpa
3mtpa
2mtpa
Next Target: Stage >=4
FEL 0
FEL 1
FEL 2
FEL 3
FEL 4
Engineering completed by % of value
Next Target: Stage >=2
FEL 0
FEL 1
FEL 2
FEL 3
FEL 4
Engineering completed by % of value
Next Target: Stage >=1
FEL 0
FEL 1
FEL 2
FEL 3
FEL 4
Engineering completed by % of value
Completed
Site Bethune
Operating at 2mtpa
Continuing to ramp
up towards 4mtpa
target capacity
BethuneRamp-up to 4mtpa
2021
Capacity 2024
2.3mtpa
4mtpa
Defined Underlying Base Capex: Base Capex represents the minimum average annual spend
Timing: This project
represents a conti-
nuous capacity ramp-
up. Since K+S is still
cash constraint, we are
managing the project
from a cash constraint
budget with flexibilityion
completion time. Only 3
years forward (MTP
cycle) are budget grade
5

Site costs (FOB) in comparison
6
* column width = production capability in million tonnesSource: CRU Report 2019, K+S
-30%USD/t
K+S Bethune(mid-term)
K+S Zielitz(purely MOP)
K+S Bethune(today)
*
Continuous ramp-up of Bethune increasingly improves our cash costs and thus our competitive position
Further ramp-up
of Bethune to 4mt
will bring Bethune
into the first
quintile
1st Quintile of lowest costproduction volume
Best-in-class
7
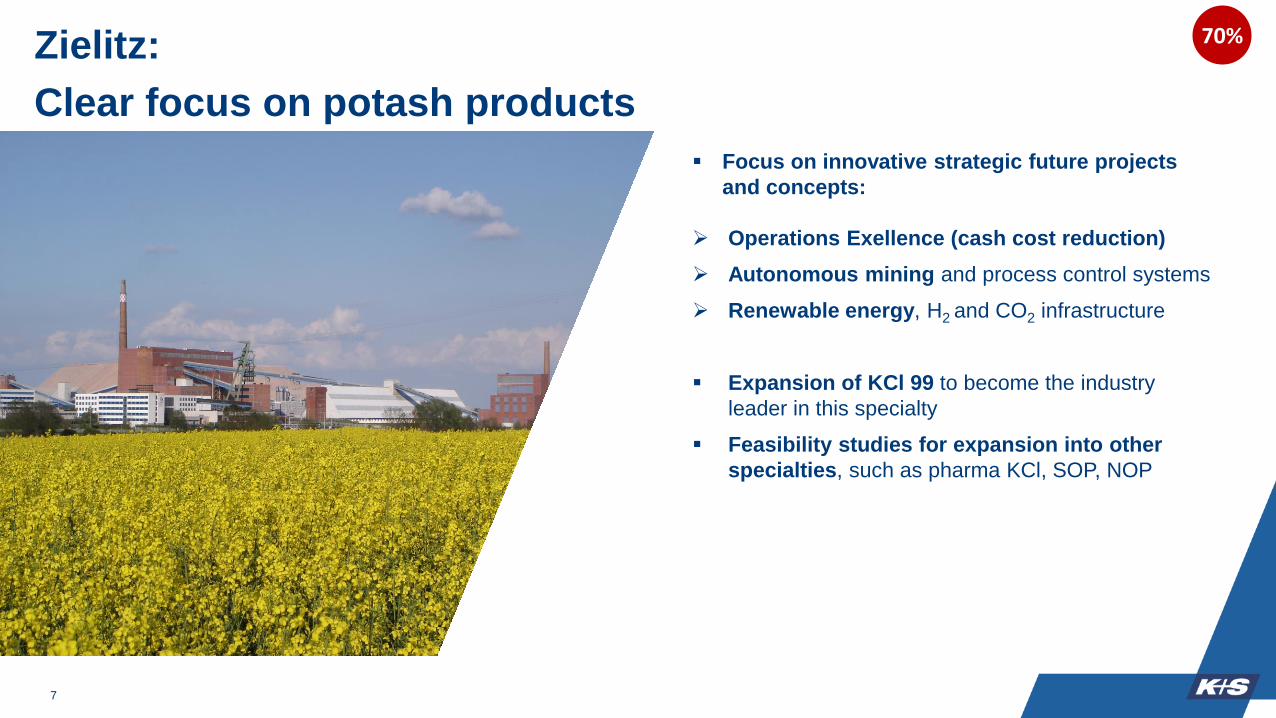
▪ Focus on innovative strategic future projects
and concepts:
➢ Operations Exellence (cash cost reduction)
➢ Autonomous mining and process control systems
➢ Renewable energy, H2 and CO2 infrastructure
▪ Expansion of KCl 99 to become the industry
leader in this specialty
▪ Feasibility studies for expansion into other
specialties, such as pharma KCl, SOP, NOP
Zielitz:
Clear focus on potash products
70%

8
1. Optimize portfolio
➢ Maximize CMS (Epsom Salt)
➢ Increase granulated products
➢ Increase of SOP production
➢ New specialties, incl. green fertilizers
2. Future proof
➢ Increase extraction rate
➢ Reduce process water
➢ Reduce solid by-products
➢ Reduce energy consumption
➢ Reduce CO2 emissions
3. Licence to operate
➢ Improvement of the permit situation
➢ Tailings pile coverage
Werra:
World's largest potash, magnesium and sulphur specialties plant
70%

9
Increase plant lifetime
Neuhof:
Specialties plant for the European market
70%
1. Efficiency
➢ Increase extraction rate
➢ Reduction in chemical consumption
➢ Increase own power generation
➢ Reduce energy usage
2. Optimize portfolio
➢ Increase kieserite production
➢ Increase granulated products
3. Future proof
➢ Improvement CO2 footprint
➢ Tailings pile coverage

10
Centers of excellence for focus topics
Bethune Zielitz Neuhof Werra
Increase extraction rates X
Autonomous miningX
Process automationX
Energy efficiency and CO2 footprint
reduction X
New business models
e.g., CO2, H2, energyX
70%
Optimization of K+S salt sites
11
Generally• Focus on cost optimization; manage capex at base level; maintenance and operational
improvement measures with ROI ≤ 3 years
Shaping concepts for commodity vs. specialty sites• Concentration of de-icing salt volumes at low-cost sites
• Optimization logistic concept including reduction of warehouses/network
• Focus on industrial salt at Frisia Zout
Ashburton: • K+S Salt Australia is currently working on the final feasibility study for the project. The report should be available shortly.
• We also expect the environmental and mining permits for the project by the end of this year.
• Consensus estimates that the potential annual salt production of the Ashburton project would be around 4.5mt p.a. with
USD 400mn project costs to complete.
• After having the permits and results of the feasibility study, management will decide according to the strategic
classification of the salt business: invest or sell the project at a premium.
70%
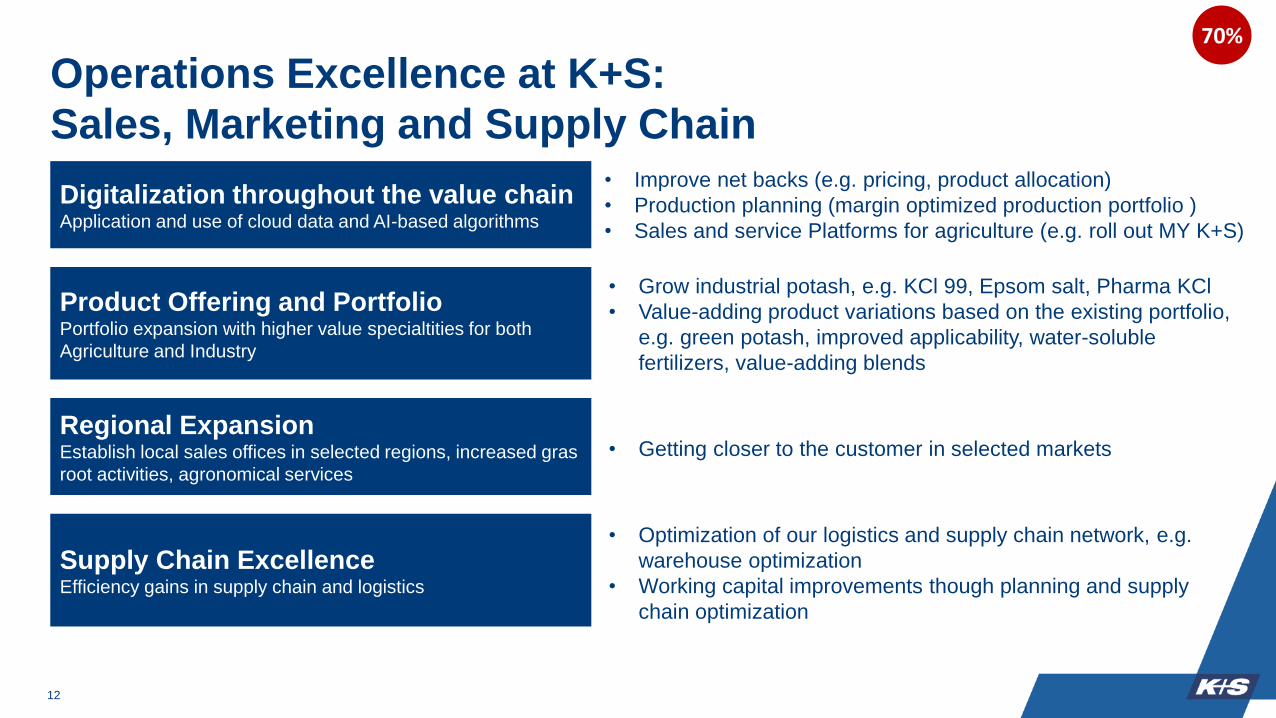
Operations Excellence at K+S:
Sales, Marketing and Supply Chain
1212
70%
Digitalization throughout the value chainApplication and use of cloud data and AI-based algorithms
Product Offering and Portfolio Portfolio expansion with higher value specialtities for both
Agriculture and Industry
Regional ExpansionEstablish local sales offices in selected regions, increased gras
root activities, agronomical services
Supply Chain ExcellenceEfficiency gains in supply chain and logistics
• Improve net backs (e.g. pricing, product allocation)
• Production planning (margin optimized production portfolio )
• Sales and service Platforms for agriculture (e.g. roll out MY K+S)
• Grow industrial potash, e.g. KCl 99, Epsom salt, Pharma KCl
• Value-adding product variations based on the existing portfolio,
e.g. green potash, improved applicability, water-soluble
fertilizers, value-adding blends
• Getting closer to the customer in selected markets
• Optimization of our logistics and supply chain network, e.g.
warehouse optimization
• Working capital improvements though planning and supply
chain optimization

13
70%
Share of additional EBITDA contribution by 2023
Plants Market Supply Chain Other
14
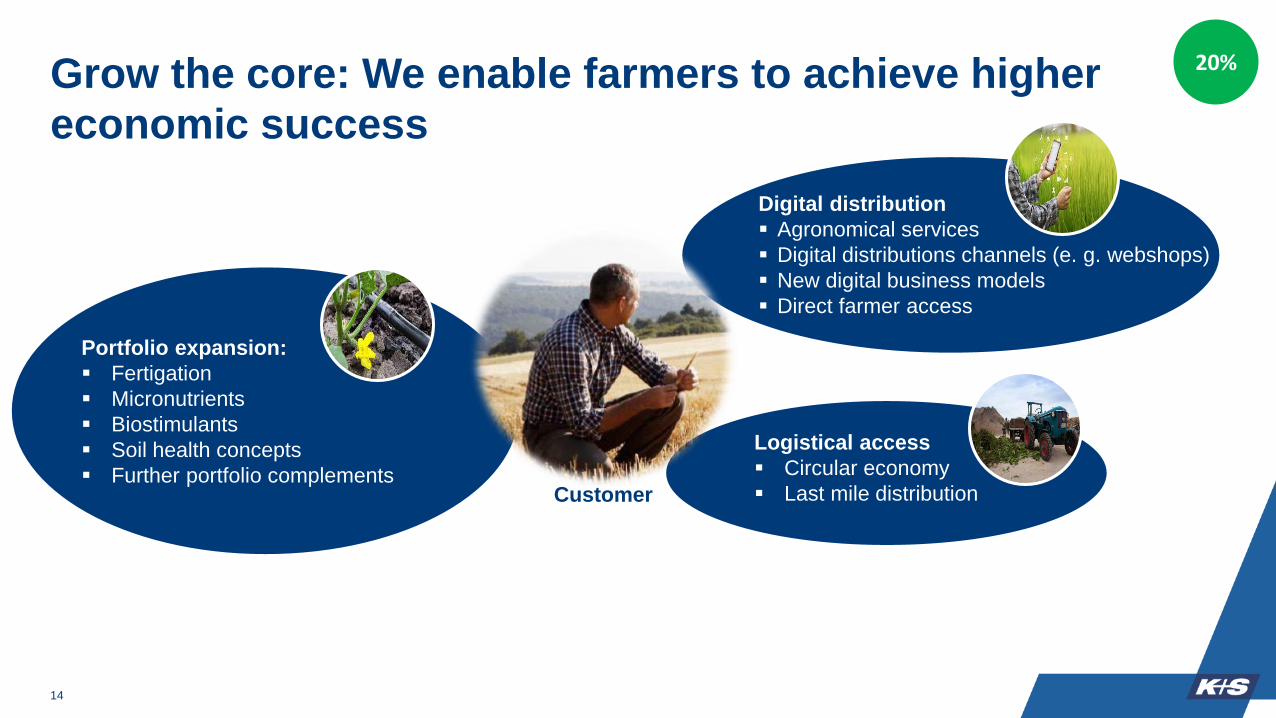
20%Grow the core: We enable farmers to achieve higher
economic success
Digital distribution
▪ Agronomical services
▪ Digital distributions channels (e. g. webshops)
▪ New digital business models
▪ Direct farmer access
Logistical access
▪ Circular economy
▪ Last mile distribution
Portfolio expansion:
▪ Fertigation
▪ Micronutrients
▪ Biostimulants
▪ Soil health concepts
▪ Further portfolio complementsCustomer

15
Phosphate
Nitrogen
Micronutrients
Potash
Fertigation
Biostimulants
NPK
Bullet size reflecting current market size: 1bln USD =
1% 5% 10%
Ma
rke
t a
ttra
ctive
ne
ss
Position/Strength K+S- -/+ +
--/
+
+
1. Micronutrients• Close to the core of our current products,
some of which already have a position on
the market
• Synergetic effects with macronutrients to
enhance plant growth/yield
2. Biostimulants• Symbiotic effects to increase plant
resilience towards abiotic stress
3. Fertigation• Increasing water scarcity and technological
advancing towards precision farming
require water soluble fertilizer concepts
4. Other inputs• Trading business in selected markets,
complementing portfolio
CAGRfor NPK production
Targeted product portfolio 20%
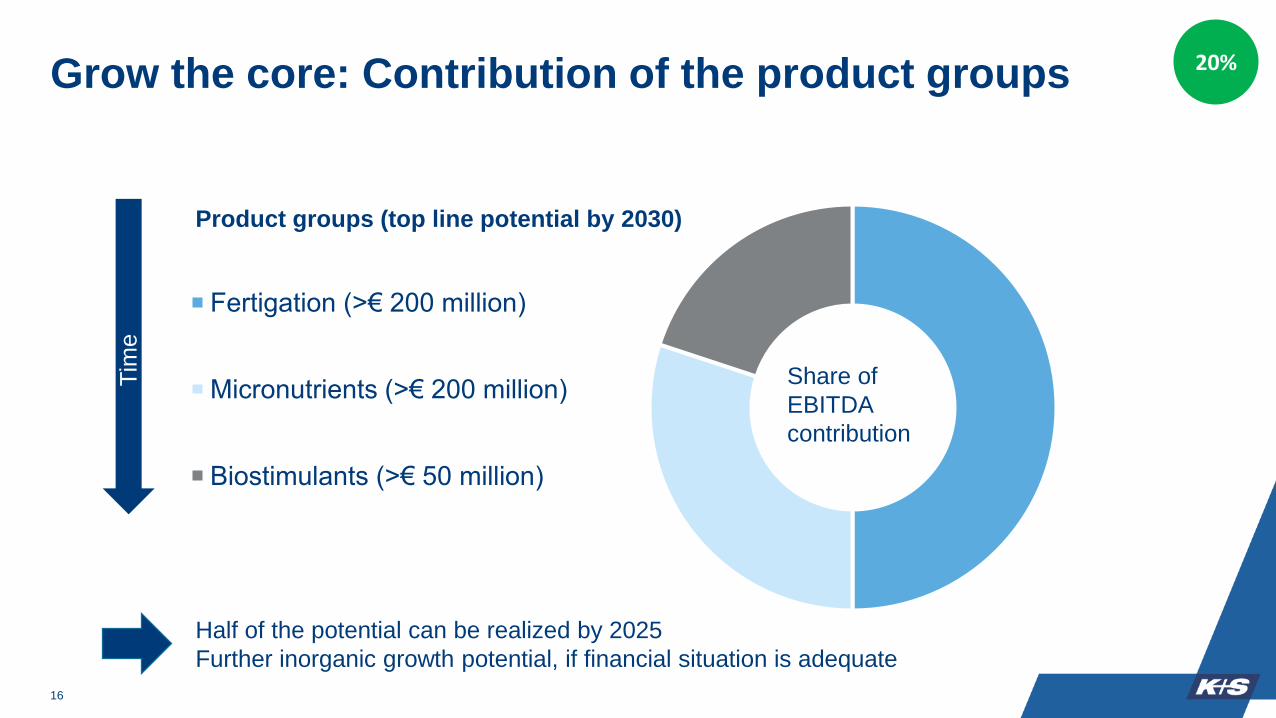
Grow the core: Contribution of the product groups
16
Fertigation (>€ 200 million)
Micronutrients (>€ 200 million)
Biostimulants (>€ 50 million)
Half of the potential can be realized by 2025
Further inorganic growth potential, if financial situation is adequate
Product groups (top line potential by 2030)
Share of
EBITDA
contribution
20%
Tim
e

Clear prioritization of the regions
17
Priority 1
• Europe is our home market
The challenges of the future are to be solved here first due to high regulatory pressure
• Brazil as a global agri-powerhouse and core market
Europe (Western + Eastern), Brasil
Priority 2
• Although China has the highest growth assumptions, it is highly competitive and thus less attractive
• India is one of the agricultural markets of the future, but still in early stages of its development
• Middle East, Turkey and Levant as a follow-up market to Europe
• Sub-Saharan / Africa with high future prospects, but after 2030
China, India, Middle East, Sub-Saharan/Africa
20%

Subsequent leverage of existing assets and
development of new business areas
18
Renewable and green energy:
Increasing use of renewable energy (wind, solar) for our facilities
Use of avialable land on our sites
Exploration of production and use of greenhydrogen
Carbon dioxide (CO2):
CCS: underground storage (solid and gaseous)
CCU: utilization for the production of biomass oras a raw material for base chemicals
Waste management & circular economy
Underground re-utilisation, underground storage
Extraction of valuable minerals from wastestreams (e.g. magnesia)
Post-mining use of our mines
Exploration of alternative use for agriculture oras production area for biotechnology
Mines Caverns Tailings piles LandTechnical / structural
infrastructure
Technological
know-how
Agronomical
know-how
10%

Q&A of both workshops
K+S Aktiengesellschaft
Capital Markets Day 2021 Workshop Q3/21, Outlook &Strategic Financial Targets
Thorsten Boeckers
CFO
November 11, 2021

▪ Q3/21 EBITDA increased to €121m (Q3/20: €25m, excluding
positive non-cash, one-off effect of € 56 million)
▪ COVID-19: Minor efficiency losses on the previous year’s Q3 level
▪ Adj. net profit positive at €1,285m (Q3/20: €-1,757m); thereof
€1,420m (Q3/20: €-1,792m) related to value fluctuations in PPE
Q3/21 EBITDA more than quadrupled YoY
1
25*
12156
132
28-7
-57
Q3/20 Pricing Volume FX Others Q3/21
EBITDA in €m
Financials (continuing operations)Highlights
€ million Q3/2020 Q3/2021 %
Revenues 566 746 +32
t/o Agriculture 373 529 +42
t/o Industry+ 193 217 +12
D&A 87 74 -15
EBITDA 25* 121 +384
Adj. net profit -1,757 1,285 −
t/o reversal of impairment
losses on assets-1,792 1,420 −
Adj. EPS (€) -9.18 6.71 −
t/o reversal of impairment
losses on assets-9.35 7.42 −
Operating cash flow 58 14 -24
Adj. FCF -42 -69 -64
Capex 114 88 -23
NFD/EBITDA (LTM)* 5.7x 2.0x −
+Higher
potash and
de-icing
sales
volumes
+Mainly pricing
Agriculture
- Higher costs:
(freight, energy,
raw material)
+Cost discipline
+Restructuring
headquarters
* excluding positive non-cash, one-off gain of €56 million
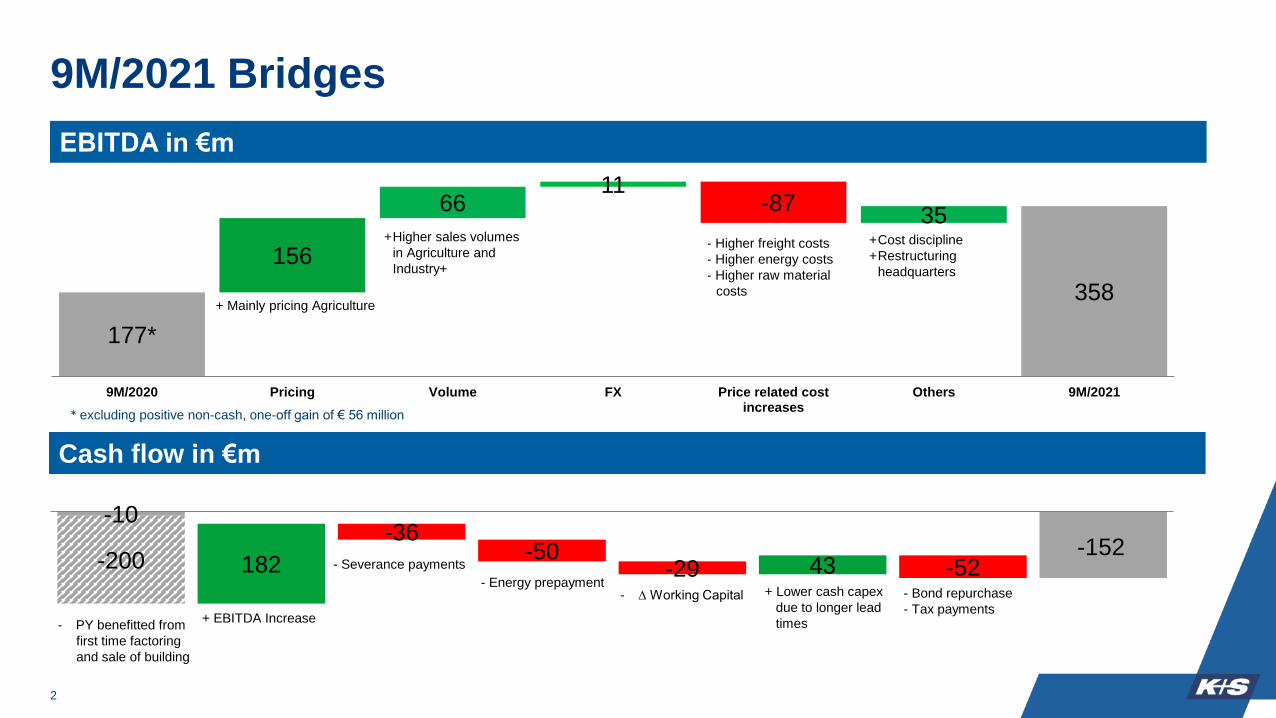
9M/2021 Bridges
2
177*
358
156
6611
-8735
9M/2020 Pricing Volume FX Price related costincreases
Others 9M/2021
EBITDA in €m
+ Mainly pricing Agriculture
+Cost discipline
+Restructuring
headquarters
- Higher freight costs
- Higher energy costs
- Higher raw material
costs
* excluding positive non-cash, one-off gain of € 56 million
-10
-200 182
-36-50
-29 43 -52-152
Cash flow in €m
- Severance payments
+ EBITDA Increase
- Bond repurchase
- Tax payments- ∆ Working Capital
- Energy prepayment
+Higher sales volumes
in Agriculture and
Industry+
- PY benefitted from
first time factoring
and sale of building
+ Lower cash capex
due to longer lead
times

200
300
400
500
600
700
800
200
250
300
350
400
450
500
550
600
650
700
750
800
850
MOP gran. Brazil USD/t, cfr (left scale)
MOP gran. Europe EUR/t, cfr (right scale)
3
Agriculture customer segment in Q3/21Q3/2021
• Price hike in Brazil continued
on the back of very strong
demand
• Concerns about supply due to
US sanctions against Belarus
• Positively influenced European
and specialty market
Outlook 2021
• World potash sales incl.
5 mt specialties meanwhile
expected slightly above last
year’s record level (2020:
about 76 mt), further growth
limited by supply
• FY ASP expected tangibly
higher than 9M/21Source: FMB Argus Potash
USD/t EUR/t
SOP Europe EUR/t, cfr (right scale)
Potassium
Sulfate
(SOP)
Europe
Potassium
Chloride
(MOP) Europe
Potassium
Chloride
(MOP) Brazil

Q3 trading update: Industry+
4
De-icing salt business▪ Strong performance in Q3
▪ Good early-fills business
Pharmaceutical industry▪ Increase after COVID-19-related declines in previous year
Food service▪ Still burdened by COVID-19-effects
Chemical industry▪ Increase after COVID-19-related declines in previous year, higher prices for industrial potash
Consumer products▪ Normalization after strong prior quarter benefitting from increased home consumption

2021 EBITDA outlook raised to €630 million
5
FCF including cash-in from sale of the OU Americas
expected significantly above €2 billion;
excluding this, FCF now expected neutral in 2021
(2020: €-109.9 million)
250
~630
2020 PricingAgriculture
VolumeAgriculture
De-icingbusiness
Costs, FX,others
2021e
EBITDA in €m
continuing operations
* without one-off effects
- Higher freight
costs
- Higher energy
costs
- Others
+SG&A
restructuring
▪ Significantly higher average price in
Agriculture product portfolio
▪ Sales volume in the Agriculture
customer segment expected to be
>7.5 million tonnes
(2020: 7.3 million tonnes)
▪ Sales volumes in de-icing salt
business: >2.6 million tonnes
expected (2020: 0.9 million tonnes;
normal year: 2-2.5 million tonnes)
267*

6
▪ EBITDA of €1 billion* in reach
▪ Significantly positive FCF
Cost inflation included:− freight rates, especially containers
− gas prices/energy costs
− price of raw materials, e.g. for pallets,
packaging or maintenance material, also
influencing capex
− personnel costs
Sneak preview 2022
* excluding REKS transaction

7
Capex in upcoming years
<400
~ 450
~350 ~350
-50 +50
0
100
200
300
400
500
2021 2022e 2023e 2024e
in m€
+ climate fund
+ site strategies
+ cost inflation
shift from the
previous year
due to availability
of material/lead
times

1. ROCE
above cost of capital through the cycle
(WACC 2020: 9.4%)
2. EBITDA margin
at minimum 20% through the cycle
3. Free cash flow
positive free cash flow even with
temporarily low potash prices and
green winters as of 2023
Base for the financial targets is a solid
balance sheet / solid leverage ratio
Strategic financial targets
8
Ø ROCE (%) 18.5 27.4 20.1 9.4 2.7
Ø WACC (%) 6.5 10.1 8.5 8.3 8.7
Δ ROCE-WACC 12.0 17.3 11.6 1.1 -6.0
Ø EBITDA margin (%) 13.6 18.6 26.0 21.2 14.7
Ø FCF adj. (million €) -51 231 155 -573 -125
0
200
400
600
800
1000
1200
2004-2006 2007-2010 2011-2013 2014-2016 2017-2020 2021
MOP gran. bulk CFR Brazil price development
USD/t
Key figures through cycles in the past:

9
Base
dividend:0.15 € / share
Discretionary
premium
upon balance
sheet structure,
outlook etc.
Our new dividend policy
Current situation:
▪ Still high environmental expenditures
▪ K+S still in restructuring phase
Considerations:
▪ Shareholders should participate in K+S’s success through attractive dividend
▪ Strategic measures aimed at increasing total shareholder return
▪ The dividend policy is intended to:
... provide continuity for shareholders
... be easy to understand and clearly communicable
... adequately signal and take into account the future years of ongoing restructuring
... demonstrate a disciplined capital deploitment policy

Targeted leverage ratio and rating
10
• Internal KPI: Net financial debt/EBITDA
• S&P and others including provisions,
for example
• Ability to refinance on the capital market is
strongly influenced by external ratings
• Leverage should be maintained over the cycle,
also in phases of lower EBITDA and cash flows
• Especially the last 15 years have produced
two crises in which financing for non-IG
companies was temporarily impossible:
financial crisis + Corona
• Temporary deviation from the target corridor is
possible, but a strict plan for the return is
necessary
Target rating:
low investment
grade

Q&A

K+S Aktiengesellschaft
Capital Markets Day 2021 Workshop K+S Climate Strategy
Markus Midden
Head of Technology & Energy
November 11, 2021

Evolvement and composition of the K+S Climate Strategy
1
K+S Climate Strategy
Contribution to decarbonization
Building a path towards net
zero
Climate fund for projects excluded from competition for
Capex allocation
Identify risks and
opportunities of climate change
Agenda:
1. Energy mix: Status quo
2. 2020 Climate Study
3. Decarbonization measures
4. Climate strategy until 2050

Global energy mix K+S
2
43%
31%
3%
12%
9%
Natural gas - drying
Natural gas - CHP*
Natural gas - boiler
External heat supply
External power supply
Fuels
2%
* Combined heat and power,
also known as cogeneration
Approximately
10,000,000
MWh/y

3
Energy price assumptions for Germany:
Short-term Mid-term Long-term
Natural gasNormalization expected,
mitigated by hedging Partially mitigated by hedging
External power
Energy system transformation*
Carbon Contracts for
Difference*
CO2 prices
Mitigated by hedging Partially mitigated by hedging
* Preconditions needed for net zero

4
80% reduction of GHG emissions (1990 – 2020) already achieved
Values in
million tCO2
0
20
40
60
80
100
739
1990
1.0
2020
%1,248 4.7
DE -40%
K+S -79%Germany
K+S
Germany compared to K+S (German potash production, scope 1)
By a change of fuels,
increase of energy efficiency
and closing of sites the GHG
emissions at K+S were
reduced by nearly 80%
between 1990 and 2020.
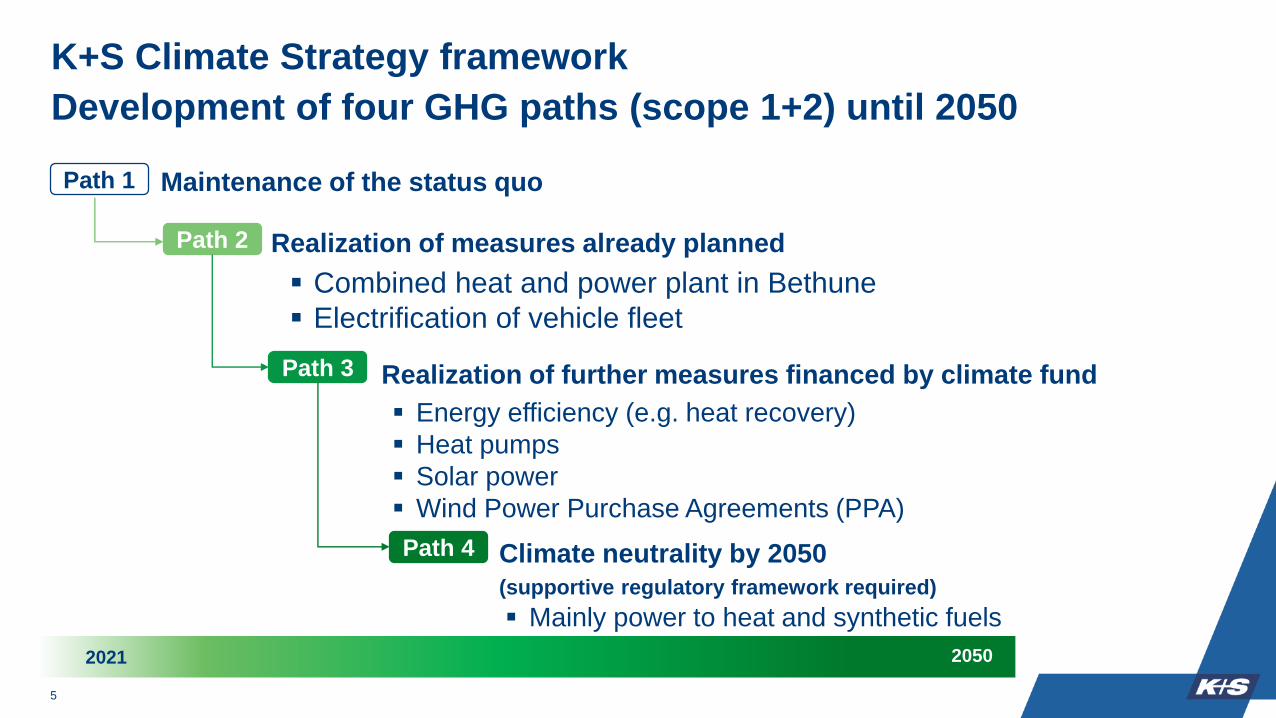
Maintenance of the status quo
Realization of measures already planned
▪ Combined heat and power plant in Bethune
▪ Electrification of vehicle fleet
Realization of further measures financed by climate fund
▪ Energy efficiency (e.g. heat recovery)
▪ Heat pumps
▪ Solar power
▪ Wind Power Purchase Agreements (PPA)
Climate neutrality by 2050
(supportive regulatory framework required)
▪ Mainly power to heat and synthetic fuels
Path 1
Path 2
Path 3
Path 4
20502021
5
K+S Climate Strategy framework
Development of four GHG paths (scope 1+2) until 2050
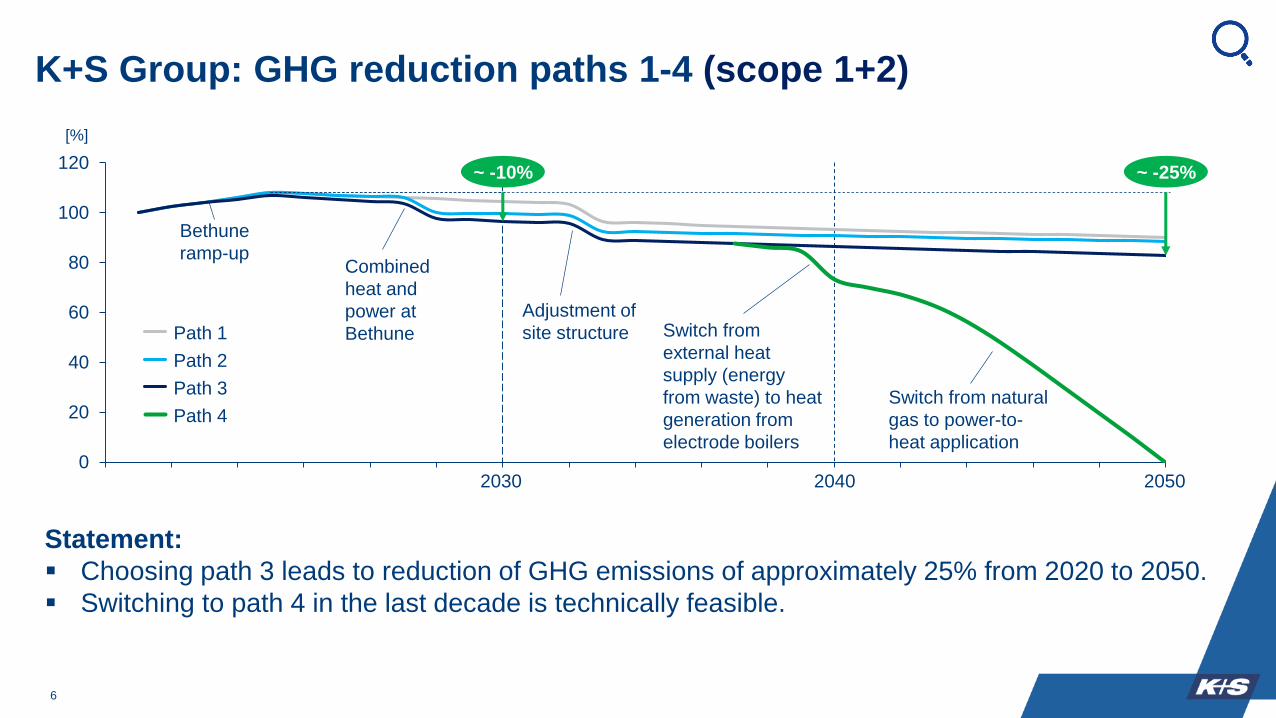
6
0
20
40
60
80
100
120
2018 2020 2022 2024 2026 2028 2030 2032 2034 2036 2038 2040 2042 2044 2046 2048 2050
~ -10% ~ -25%
Path 1
Path 2
Path 3
Path 4
Bethune
ramp-upCombined
heat and
power at
Bethune
Adjustment of
site structure Switch from
external heat
supply (energy
from waste) to heat
generation from
electrode boilers
Switch from natural
gas to power-to-
heat application
[%]
Statement:
▪ Choosing path 3 leads to reduction of GHG emissions of approximately 25% from 2020 to 2050.
▪ Switching to path 4 in the last decade is technically feasible.
K+S Group: GHG reduction paths 1-4 (scope 1+2)
2040 20502030

7
Capex costs path 3 and path 4*
Statement:
Capex for carbon neutrality will only amount to less than € 20 million p.a. over time.
* Not adjusted for general cost inflation
0
20
40
60
2020 2030 2040 2050
CHP Bethune
Electrode boilers (only path 4)
Vehicle fleet
Electric air heaters (only path 4)
Photovoltaic
Increase energy efficiency
Heat pump
Climate fund
will bring
forward
activities earlier
Current feasibility
studies indicate
opportunities for an
earlier start
Ø

OPEX path 4: How much will it cost?*
8
Statement:
• Costs for energy in path 3 can be handled over the time horizon
• Expectation of economically reasonable prices for renewable energy for path 4
2020 2030 2040 2050
External power
Synthetic fuels
External heat
Natural gas
GHG costs
Path 3
Power 4ct from 2035
Power 6ct from 2035
comparison:
peak in
2021/22
OPEX path 3
* Not adjusted for general cost inflation

What will bring us to path 4?
9
▪ We not only have ideas but also specific technologies to achieve climate
neutrality
▪ Openness to technology can offer opportunities not only for emissions
reductions but also for new business areas
− Carbon Capture Storage (CCS)
− Carbon Capture Utilization (CCU)
▪ Growth of infrastructure and renewables at economically reasonable prices can
enhance the speed to achieve climate neutrality even earlier
▪ Carbon leakage protection is further necessary for energy-intense industries
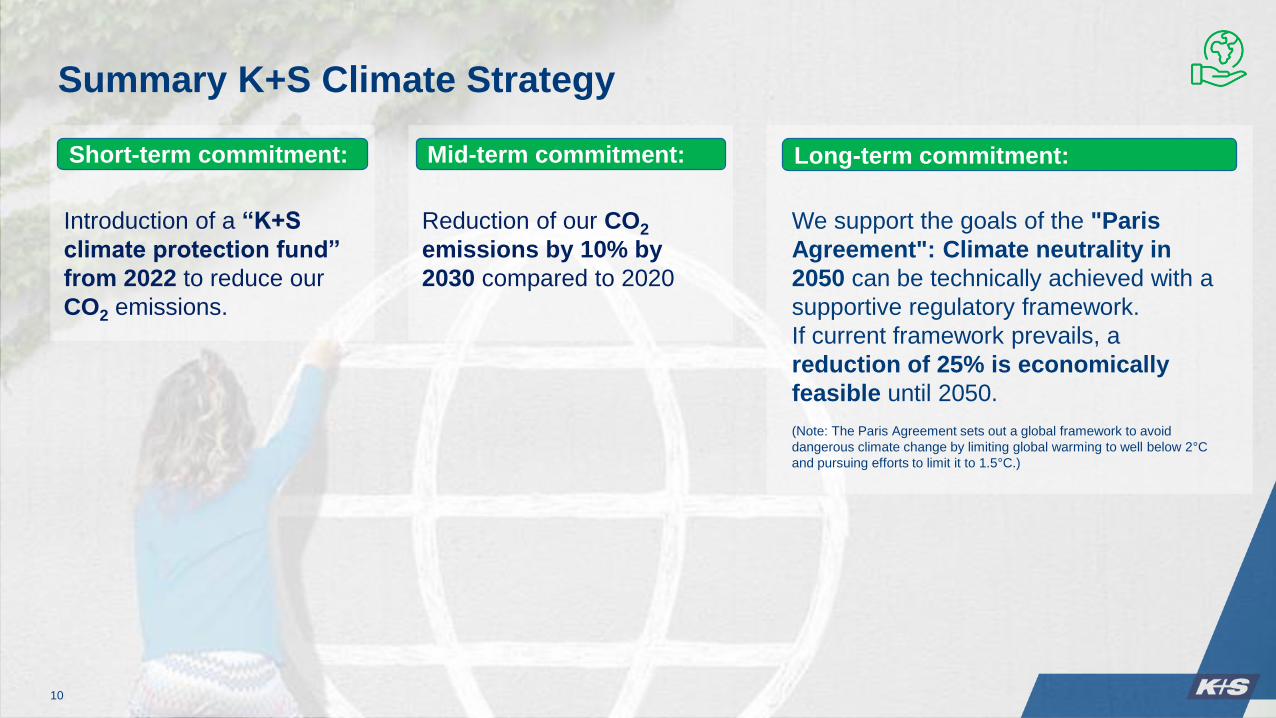
Summary K+S Climate Strategy
10
Short-term commitment:
Introduction of a “K+S
climate protection fund”
from 2022 to reduce our
CO2 emissions.
Mid-term commitment:
Reduction of our CO2
emissions by 10% by
2030 compared to 2020
Long-term commitment:
We support the goals of the "Paris
Agreement": Climate neutrality in
2050 can be technically achieved with a
supportive regulatory framework.
If current framework prevails, a
reduction of 25% is economically
feasible until 2050.
(Note: The Paris Agreement sets out a global framework to avoid
dangerous climate change by limiting global warming to well below 2°C
and pursuing efforts to limit it to 1.5°C.)

Q&A