capital market pressures and the format of intellectual ... · literature (e.g. bozzolan et al.,...
TRANSCRIPT
1
Capital Market Pressures and the Format of Intellectual Capital Disclosure in
Intellectual Capital Intensive Firms
Li, J. and Mangena, M.
Abstract
Purpose - A number of studies have examined firms’ intellectual capital (IC) disclosure
practices. However, the presentation format of IC disclosure (text, numerical and
graphs/pictures) is yet to be examined. In addition, there is little evidence on the impact of
capital market pressures on IC disclosure. This study aims to examine the relation between
presentation format of IC disclosures and three market factors (market-to-book ratio, share
price volatility and multiple listing).
Design/methodology/approach - Using content analysis, we examine the level of IC
disclosure provided in the annual reports of 100 IC-intensive listed UK firms. A 61-IC-item
research instrument is used to measure IC disclosure and regression analysis is employed to
examine the relation between disclosure and the market factors, controlling for corporate
governance and firm specific variables.
Findings - Text is the most commonly used format for IC disclosure, whilst the use of
graphs/pictures is very low. The findings of the relation between market factors and IC
disclosure are mixed. Market-to-book ratio is significantly related to disclosure in text and
numerical, but not to graphs/pictures. Share price volatility is only associated with
graphs/pictures, whilst multiple listing is only related to text.
Originality/value - Our findings suggest that the impact of capital market pressures on IC
disclosure might differ with presentation format. In this context, the study makes a significant
contribution to the IC disclosure literature.
Key words - Intellectual capital disclosure; content analysis; presentation format; market
factors; UK
Paper type – Research paper

2
1. Introduction and Background to Study
Business in the twenty-first century has changed fundamentally to relying on knowledge-
based assets (also referred to as intellectual capital (IC)) instead of just financial and physical
assets in creating value. This is evidenced by increasing large investments in IC assets, such
as human resources, information technology, R&D and advertising. Consequently, there is an
increased level of attention on IC, which is now recognised as an integral part of a firm’s
value-creating processes and key to building competitive advantage (e.g. Bukh, 2003;
Holland, 2003). However, because the existing GAAP allows immediate expensing of IC
investments, financial reports fail to reflect adequately these assets (Francis and Schipper,
1999). This compounds the information asymmetry problem between managers and investors
particularly given that IC reporting is largely unregulated (Francis and Schipper, 1999;
Aboody and Lev, 2000). The absence of regulation gives managers discretion on what
information to disclose, thus presenting difficulties for investors since IC is unique to specific
firms and cannot be inferred by looking at other firms.
Given the information asymmetry problem, there have been increasing calls for firms to
enhance the disclosure of IC information (e.g. Beattie, et al., 2004; ASB, 2007) to improve
the market’s understanding of the firm’s value creation processes and facilitate a more
precise valuation of the firm (e.g. Bukh, 2003; Holland, 2003; Mangena et al., 2014).
Consequently, a growing body of studies has examined the substance/content of IC
disclosures made by firms (e.g. Brennan, 2001; Beattie and Thomson, 2007; Campbell and
Abdul Rahman, 2010) and the factors, particularly firm-specific and corporate governance
factors, that help explain differences in IC disclosure (e.g. Bozzolan et al., 2003; Cerbioni
and Parbonetti, 2007; Li et al., 2008). These studies have shown an increasing trend in IC
disclosure and demonstrated that differences in disclosure can be explained by corporate
governance and firm-specific factors.
3
Whilst previous studies provide significant insights into IC disclosure practices, nothing
is known about presentation formats of IC information. Ambler et al. (2001) advocate for the
use of a mix of qualitative and quantitative data in reporting IC information to market
participants. For example, text and graphs/pictures have been shown to be important for
communicating non-financial information (see Beattie et al., 2004; Davison and Skerratt,
2007). A combination of text, numbers and graphs/pictures in annual reports enables firms to
construct their reported message about IC more meaningfully as a story. However, despite the
text, numbers and graphs/pictures all being powerful communicative reporting media for
constructed IC messages to be disclosed in annual reports, few studies have been conducted
to examine the extent of IC disclosure in the different presentation formats. Indeed, Jones
(2011) argues that the use of presentation formats in corporate disclosure research is an area
that has previously been neglected.
There are, however, some studies that have examined the format of presentation in
annual reports, particularly within the impression management literature (e.g., Beattie and
Jones, 1992; 2002; Beattie et al., 2008; Jones, 2011). These studies have demonstrated
increasing use of graphs/pictures in annual reports. They concluded that presentation formats,
for example graphs/pictures, in the corporate reporting process can be used in two different
ways (e.g. Muino and Trombetta, 2009; Jones, 2011). On the one hand, they can be used to
enhance communication when the different presentation formats are used as complementing
each other. On the other hand, they can also potentially be used to present information giving
a partial and selective view in order to portray the firm in a favourable light (Jones, 2011).
These studies have, however, focused on examining presentation formats relating to financial
information, such as the use and abuse of graphs in annual reports (e.g. Beattie and Jones,
2002; Muino and Trombetta, 2009), and very little work on the use of presentation format in
IC information. Given the importance of IC information to the capital market, an

4
understanding of IC disclosure in different presentation format helps us to build a picture of
how firms communicate its IC information to the market participants and other stakeholders.
In addition, and particularly relevant to the current study, the existing has not examined why
there are differences in disclosure presentation formats. For example, in previous disclosure
studies (see Gray et al., 1995; Mangena and Pike, 2005; Li et al., 2008), it has been argued
and demonstrated that there are factors that motivate firms to report information, such as
capital market pressures, corporate governance and firm-specific factors. However, there is
no evidence on how these factors influence disclosure in the different presentation formats of
IC information. In this study, we examine the impact of capital market pressures on
disclosure in the presentation format of IC information in the annual reports of IC-intensive
firms. Following previous studies (e.g. Lang and Lundholm, 1993; Bushee et al., 2003;
Debreceny and Rahman, 2005), our proxies for capital market pressures are market-to-book
ratios, share price volatility and multiple listing. The focus on IC-intensive firms is driven by
the rationale that these firms have greater need for capital to fund their intensive intangible
assets development (Mangena et al., 2014) and also, the capital market’s information
requirements about the value-creating processes is greater given the high risks involved
(Holland, 2006). This study therefore contributes to the literature in a number of ways. First,
we contribute to the literature on disclosure presentation formats by focusing on IC
information instead of financial information as in previous studies (e.g., Beattie and Jones,
2002; Muino and Trombetta, 2009; Jones, 2011). We also contribute to the IC disclosure
literature (e.g. Bozzolan et al., 2003; Cerbioni and Parbonetti, 2007) by quantifying IC
disclosure in three presentation formats (text, numerical and graphs/pictures) and examine the
impact of market related factors on the level of IC disclosure. The previous literature has
tended to focus on text and numerical disclosures, ignoring graphs/pictures, thus failing to
capture a comprehensive picture of a firm’s IC disclosure practice.
5
The remainder of this paper is organised as follows. Section 2 provides a review of the
literature and outlines the main hypotheses. Section 3 discusses the research design and
Section 4 reports the empirical results. Section 5 concludes the paper.
2. Literature Review and Hypotheses Development
2.1 Presentation Format in Corporate Reporting
The annual report, as a formal communication document, commonly comprises quantitative
information, narrative, pictures/photographs, and graphs. Campbell et al. (2009) argue that
the annual report is on longer used to just convey ‘simple’ accounting numbers, but to
provide narratives, graphical, pictorial and broader aesthetic content to a wide number of
constituencies. Campbell and Abdul Rahman (2010) suggest the users that are not skilled in
financial analysis would arguably place a greater importance on the narrative sections of the
report. In this context, they argue that the narrative reporting of IC would be a suitable
vehicle for communicating value to such users. The narrative sections of the annual report
include both qualitative aspects (text, graphs/pictures) and quantitative aspect (numerical,
both fiscal and non-fiscal). These three formats of disclosure (text, numerical, and
graphs/pictures) commonly found in annual reports are important in reporting, including IC
information communication (e.g. Abeysekera, 2003; Beattie and Thomson, 2007; Davison
and Skerratt, 2007).
Text provides the bulk and the backbone of the reported message and is an important
means not only of clarifying and validating the quantitative measures contained in financial
statements (Abeysekera, 2003), but also of offering useful insights into value creating drivers
of firms (Campbell and Abdul Rahman, 2010). For this reason, text has been the focus of
previous studies as it is the predominant unit used in IC communication to stakeholders (see
e.g. Guthrie et al., 2007; Campbell and Abdul Rahman, 2010). However, there are calls for
6
research to pay attention to the use of other visual forms of communication, such as
graphs/pictures, which have been typically neglected (Jones, 2011) despite having been
shown to provide an immediate and effective means of disclosure in annual reports (Beattie
and Jones, 2002). Pictures, diagrams and graphs are deemed to be self-evident and simple to
understand and are used by firms to synthesise and display information to readers in easily
digestible ways (Abeysekera, 2003; Jones, 2011). They also have various communicative
advantages such as their capacity to attract readers’ attention, reliance on spatial rather than
linguistic intelligence, enabling data to be readily retrieved and seen in a direct and
immediate way, the identification of patterns, trends and anomalies, and enhancing data recall
(Beattie and Jones, 2002).
In terms of empirical research, previous studies suggest that performance displayed in
charts is viewed most favourably by readers (Beattie and Jones, 2002), and financial graphs
are found to affect users’ perceptions of annual reports (Jones, 2011). Davison and Skerratt
(2007) examined the use of words and pictures in the communication of intangibles in annual
reports of FTSE 100 firms. They argue that pictures are important and provide richness and
variety to communicated messages. These authors found that approximately 94% of pictures
captured in the annual reports and reviews communicated intangible aspects of firms’
businesses and gave recognition to the communicative power of graphical representations.
Therefore, graphs/pictures are potentially powerful and highly effective methods for IC
communication.
2.2 Hypotheses Development
There are a number of studies investigating the relationship between IC disclosure and firm-
specific factors (such as firm size, industry) (e.g. Bozzolan et al., 2003; Striukova et al., 2008)
and corporate governance factors (e.g. Cerbioni and Parbonetti, 2007; Li et al., 2008; Li et al.,
2012). These studies have neither examined presentation formats of IC information nor the
7
impact of capital market pressures (such as market-to-book ratio, share price volatility and
multiple listing) on IC disclosures. The stock markets are an important source of finance for
firms and this creates incentives for managers to provide information. As Healy and Palepu
(2001) argue, investors’ perception of the firm is important to managers expecting to raise
capital. Information asymmetry between managers and outside investors can potentially make
capital more costly to raise, as investors demand a premium for bearing information risk
(Healy and Palepu, 2001). In the context of IC disclosure, Mangena et al. (2014) demonstrate
the capital market consequences of greater disclosure via a lower cost of capital. To the
extent that improved disclosure reduces the cost of capital, managers should be motivated to
provide greater levels of disclosure. Lang and Lundholm (1993) show evidence to suggest
that firms’ disclosure policies are influenced by capital market pressures. Gray et al. (1995)
also demonstrate that capital market pressures were key considerations in firms’ disclosure
policies. We draw from this literature, and develop hypotheses of the relationship between IC
disclosure in three presentation formats and capital market pressures, proxied by three
variables (market-to-book ratio, share price volatility and multiple listing).
2.2.1 Market-to-book Ratio
The literature demonstrates significant differences between market and book values (e.g. Gul
and Lev, 2004; Beattie and Thomson, 2005). Such differences, frequently illustrated by
market-to-book ratios, represent –albeit very imperfectly– the IC value of firms (Brennan,
2001). Bushee et al. (2003) argue that market-to-book ratios reflect the level of
informativeness of a firm’s accounting information, thus the higher the market-to-book ratio,
the greater the information asymmetry. To the extent that the market penalises firms with
greater information asymmetry, for example with a higher cost of capital (Healy and Palepu,
2001; Mangena et al., 2014), firms with higher market-to-book ratio are more likely to
provide greater IC disclosures voluntarily in their annual reports. Such IC disclosures might
8
be made in various presentation formats (e.g. text, numerical, and graphs/pictures), with the
aim of increasing information richness and decision usefulness. This should help reduce the
differences between the market and book values, and therefore the perceived risk associated
with the firm (Lang and Lundholm, 1993) and reduce the cost of capital (Healy and Palepu,
2001; Mangena et al., 2014).
Empirical evidence on the relation between market-to-book ratio and IC disclosure is
limited and mixed. Brennan (2001) and García-Meca et al. (2005) found insignificant results.
García-Meca and Martínez (2007) report a weak positive relation between IC information and
market-to-book ratio. Cerbioni and Parbonetti (2007) find no significant relationship between
market-to-book ratio and overall IC. However, they find a positive relation with internal
(weak) and external (significant) capital, and a negative relation with human capital. Drawing
from both the theoretical arguments and empirical literature discussed above, we hypothesise:
H1: There is a positive relationship between the level of IC disclosure and market-to-book
ratio, ceteris paribus.
2.2.2 Share Price Volatility
Healy and Palepu (2001) argue that the higher a firm’s share price volatility, the more
difficult it is for investors to assess the firm’s value, and the more likely they are to incur
information costs. Share price volatility reflects the perceived level of riskiness (Bushee et al.,
2003), and firms whose share prices are volatile are more likely to experience lower stock
liquidity and a higher cost of capital (Healy and Palepu, 2001). Expanded disclosure helps to
reduce the magnitude of periodic surprises about the firm’s performance, and thus reducing
share price volatility and cost of capital (Lang and Lundholm, 1993; Bushee et al., 2003).
Given the increasing importance of IC information to the stock market (Amir and Lev,
1996; Holland, 2003), failure to disclose will increase share price volatility, thus increasing
the perceived risk attached to the firm. Firms are therefore likely to increase IC disclosures in
9
their annual reports to mitigate the perceived risks of their shares. These disclosures could be
in different presentation formats, such as text, numbers and graphs/pictures, to improve
clarity.
Empirically, Debreceny and Rahman (2005) find that firms with higher price volatility
provide more regular and frequent online continuous disclosures. Lang and Lundholm (1993)
find a positive, although weak, association with corporate disclosure practices. Hence, it is
hypothesised that:
H2: There is a positive relationship between the level of IC disclosure and share price
volatility, ceteris paribus.
2.2.3 Multiple Listing
Prior research (e.g. Gray et al., 1995; Mangena and Pike, 2005) suggests a number of reasons
why multiple listed firms might provide greater disclosures. For example, the monitoring
problems for multiple listed firms are greater because share ownership is more dispersed, and
this makes monitoring costs of investors more significant (Mangena and Pike, 2005). Gray et
al. (1995) and Xiao et al. (2004) argue that multiple listed firms are faced with a combination
of competitive market pressures and reporting requirements of international financial markets,
and therefore engage in greater disclosures. Mangena and Tauringana (2007) points to that
multiple listed firms will disclose more information because of the need to raise cheaper
funding on foreign stock exchanges. They argue that foreign investors are more likely to be
less informed as the search for private information is more costly owing to distance, and
increased disclosure will support their assessment of the firm.
The costs for private information are more likely to be greater for IC because it is unique
to the specific firm and cannot be inferred by looking at other similar firms (Aboody and Lev,
2000). In this context, investors will demand a premium for bearing information risk, thus
forcing multiple listed firms to enhance their IC disclosures. IC disclosure in different
10
formats will improve the informativeness of information for multiple listed firms and help
them to enhance share liquidity and reduce the cost of capital (Healy and Palepu, 2001;
Mangena et al., 2014).
Prior studies have supported a positive relationship between multiple listing and the
extent of voluntary disclosure (e.g. Gray et al., 1995; Mangena and Pike, 2005; Mangena and
Tauringana, 2007). In the context of IC disclosure, studies (e.g. García-Meca et al., 2005;
Cerbioni and Parbonetti, 2007; García-Meca and Martínez, 2007) reported insignificant
results. We, however, hypothesise a positive relationship given the importance of IC
information to investors, thus:
H3: There is a positive relationship between the level of IC disclosure and multiple listing,
ceteris paribus.
2.2.4 Control Variables
To test the hypotheses, we control for a number of corporate governance factors and firm
characteristics. Following previous studies and for reasons specified therein, we control for
board independence, significant share ownership (Haniffa and Cooke, 2002; Mangena and
Tauringana, 2007; Li et al., 2008), audit committee size, frequency of meetings and share
ownership by audit committee members (Mangena and Pike, 2005; Li et al., 2012), listing
age, and firm size (Haniffa and Cooke, 2002).
3. Research Design
3.1 Sample
We draw our sample from UK IC-intensive sector firms that were fully London Stock
Exchange (LSE) listed as at 30 December 2005. Following previous studies (see Guthrie et
al., 2007; Striukova et al., 2008), the sectors we considered to be IC-intensive are listed in
Table 1. The decision to include IC-intensive sectors only derives from the fact that the
existing financial reporting model is not suited for IC-intensive sectors (Francis and Schipper,
1999) and thus, the role of IC information in firm valuation by the capital market participants
11
is particularly critical for firms in these sectors. The population size for the seven IC-
intensive sectors on the LSE was 319 firms, from which a sample of 100 was selected using
proportionate stratified sampling approach.1 Table 1 provides a breakdown of the number of
firms selected from each sector.
[Table 1 insert here]
3.2 IC Disclosure Measures
Content analysis is used to measure IC disclosure in each of the three presentation formats.
Our measure is developed from annual reports with financial year ends between March 2004
and February 2005. We chose the period of study with an aim to eliminate the possible
disclosure effects of the OFR requirements, which were to become effective early 2005.2 We
took the view that using annual reports published prior to, instead of after the mandatory
OFR, allows a clearer determination of voluntary IC disclosure and would result in greater
variations in the IC disclosure3 and hence a clearer analysis of the effect of market factors on
voluntary IC disclosure practice in its various presentation formats. Although the use of
annual reports as the sole source of content analysis data has its limitations (e.g. Striukova et
al., 2008), its use for measuring corporate disclosure is widely adopted and well justified in
the literature (see e.g. Bozzolan et al., 2003). Previous studies have also taken the view that
the annual report offers a relevant and useful proxy for the level of IC disclosure provided by
a firm along all disclosure avenues (e.g. Guthrie et al., 2007).
Our approach applies the 61-IC-item checklist developed by Li et al. (2008, see p.155-
1 To ensure that we build a sample that is representative of the sectors selected and the size of the firms, we used a 2-step selection process.
First, we computed the number of firms required from each of the seven sectors (see Table 1, columns 4-5). Second, to ensure that our
sample includes both large and small firms, we ranked firms in each sector by market capitalisation and systematically selected one firm
from every three firms in each industry grouping. 2 The statutory requirement for quoted companies to publish an OFR was repealed in January 2006. The requirements of an OFR cover some
of the issues relevant to IC, particularly human and relational capital. Instead, companies are now required to include Business Review in
the Director’s Report, which is a reduced version of OFR. It requires quoted companies to include information about environmental matters, the company’s employees, and social and community issues, and an analysis using financial and other key performance indicators (KPI)
(Companies Act, 2006, chap. 5). However, it does not stipulate any particular KPIs and issues related to employee, environment, social and
community, that companies have to include in the Business Review. Hence, the selection of KPIs and issues to be discussed in the review are at the discretion of the directors. 3 This is particularly important because multiple regressions work well when there is meaningful variability in the variables of interest, in
this case the extent of IC disclosure in different presentation formats. In a mandatory reporting environment, variability of IC disclosure in the three presentation formats is likely to be very small, thus making the results less powerful.
12
159) without any adjustments. This checklist provides a comprehensive list of voluntary IC
items. The scoring of the IC research instrument was performed manually covering the whole
annual report. Each IC item was scored based on three presentation formats (i.e. text,
numerical and graphical/pictorial), using the binary coding approach, i.e. an IC item scores 1
if disclosed under a presentation format and 0 otherwise. Thus a firm can score a maximum
of 61 points under each of the three presentation formats.4 All items are equally weighted
because weighting does not influence the results of regression analysis (see Haniffa and
Cooke, 2002).
After scoring all the 61 IC items in the three presentation formats, the IC disclosure
scores in each of the three presentation formats for each firm are computed as an index by
dividing the sum of items disclosed in a particular format (adding all the 1s) by the total
number of items expected (i.e. 61) (see Haniffa and Cooke, 2002). For each firm, we created
three disclosure indices to capture IC disclosure in text (ICDI_T), numerical (ICDI_N) and
graphs/pictures (ICDI_GP). The disclosure indices capture the variety of IC information
disclosed in a certain presentation format.5
3.3 Regression Model
Multiple regression analysis is used to test the relationship between IC disclosure in three
presentation formats and the market factors and control variables. We specify the following
regression model separately for IC disclosure indices.
4 All items in the designed research instrument were considered equally applicable and therefore equally capable of disclosure across all
sample firms in all three formats. This treatment is based on the view that deciding on whether certain IC items are non-applicable or non-
disclosure, when no disclosure is found, can be a very subjective judgement. Whilst it may help reduce the subjectivity when the researcher
goes through the whole annual report to determine whether an item is applicable or not (e.g. Marston and Shrives, 1991), given that the IC items in the research instrument can be disclosed in diverse and varied ways, it remains difficult to make the final judgement that an item
certainly cannot be disclosed by the firm. Take corporate culture as an example, for which it can be considered as difficult to disclose in
graphs/pictures. Firms can use diagrams/figures to present the key issues that are central to their corporate culture. They could also use pictures to demonstrate their corporate history to support their corporate culture. The diverse and varied ways of illustrating and presenting
IC information available led us to the view that all items in the IC research instrument were equally applicable and equally capable of
disclosure across all sample firms in all three formats. 5 The scoring process was mainly completed by one researcher. This raises questions about reliability of the scores (Beattie and Thomson,
2007). Therefore, seven annual reports were randomly selected and recoded by another two independent coders to test for and ensure
reliability in coding. Krippendorff’s (1980) alpha was computed to test for reliability because it can account for chance agreement among multiple coders. The independent scores (not tabulated) are all above the minimum 80% threshold considered reliable for content analysis.
13
IC Disclosure = β0 + β1LnM2B + β2LnSPV + β3ML + β4INED + β5SqSSO + β6SAC +
β7MAC + β8LnADISH + β9LnAGE + β10LnSA + ε
All variables are as defined in Table 2.
[Table 2 insert here]
4. Empirical Results
4.1 Descriptive Analysis
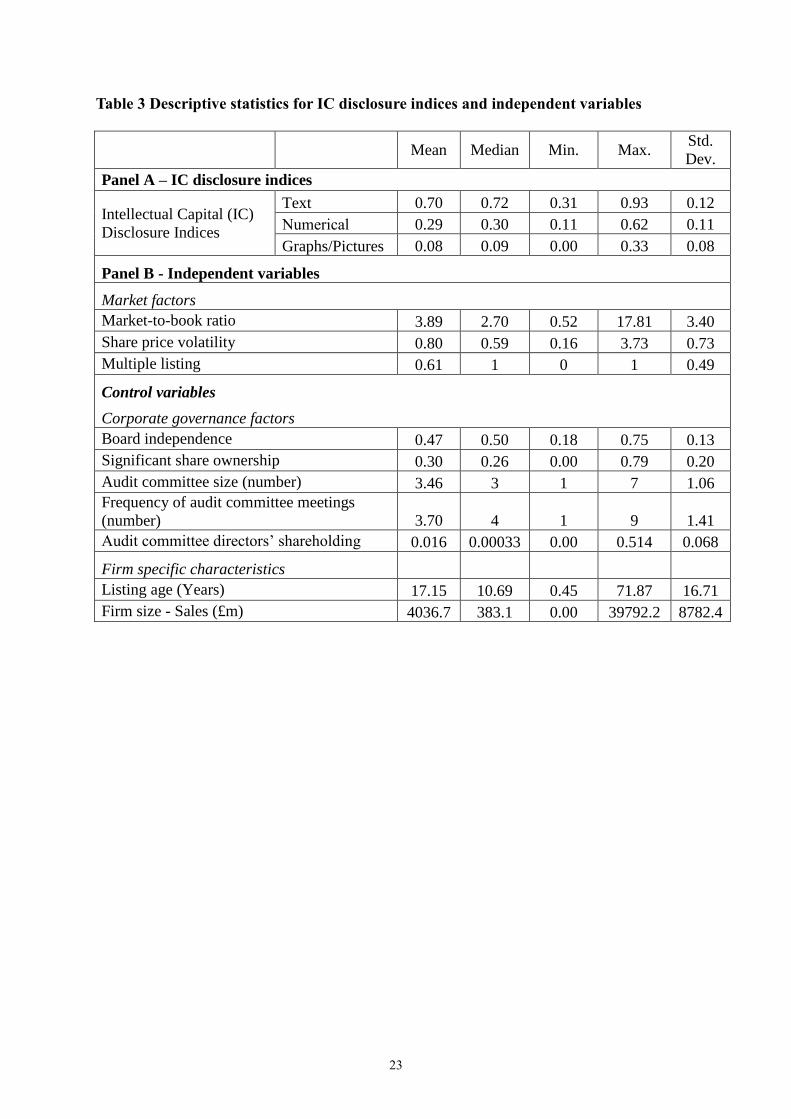
Table 3 Panel A presents the descriptive statistics of IC disclosure indices for the three
presentation formats.
[Table 3 insert here]
On average, out of the 61 IC items, 70% were disclosed in text, 29% in numerical form,
and 8% in graphs/pictures. These results reveal that IC disclosures are mainly in text form, in
line with findings of previous studies (e.g. Brennan, 2001; Guthrie et al., 2007), suggesting
that managers view narratives as providing better understanding to investors. This is
consistent with Brown and Duguid’s (2000) argument that people learn best from stories and
that a convincing narrative is the most effective way of communicating knowledge.
Therefore, the substantial use of text could be due to firms’ attempts to achieve the maximum
impact when constructing their IC story.
The results indicate that the use of numerical information in IC disclosure is greater than
the use of graphs/pictures. Nevertheless, the level of both quantified IC information reported
and graphs/pictures use is low. As Campbell and Abdul Rahman (2010) argue, this might
derive from the difficulty in conveying complex messages in simple, factual terms, such as
numbers or graphs. An interesting find is that although there are firms that chose not to
employ graphs/pictures, at the other extreme, some firms disclosed one-third of the IC items
in this form of reporting. Graphs/pictures use is particularly popular for items such as pictures
of employees, customers and brands, figures showing market presence, and photographs
demonstrating relationships with various stakeholders.
14
Table 3 Panel B presents the summary descriptive statistics for the independent variables
included in the model. The mean market-to-book ratio is 3.89 (ranging from 0.52 to 17.81)
which is consistent with those reported in Gu and Lev (2004) and Beattie and Thomson
(2005). The mean share price volatility is 0.80 (ranging from 0.16 to 3.73). Sixty-one percent
of the sampled firms are multiple listed. The mean significant share ownership is 29.6% and
board independence is 47.5% 6 . The mean audit committee size is approximately three
members, consistent with the recommendation of the Smith Report (2003) and the UK Code
(2012), and audit committees meet, on average, about four times per year. The mean audit
committee directors’ shareholding is 1.6%, ranging from 0% to 51.4%. The mean firm size is
£4,036.7 million and the average listing age is 17 years.
4.2 Multiple Regression Results
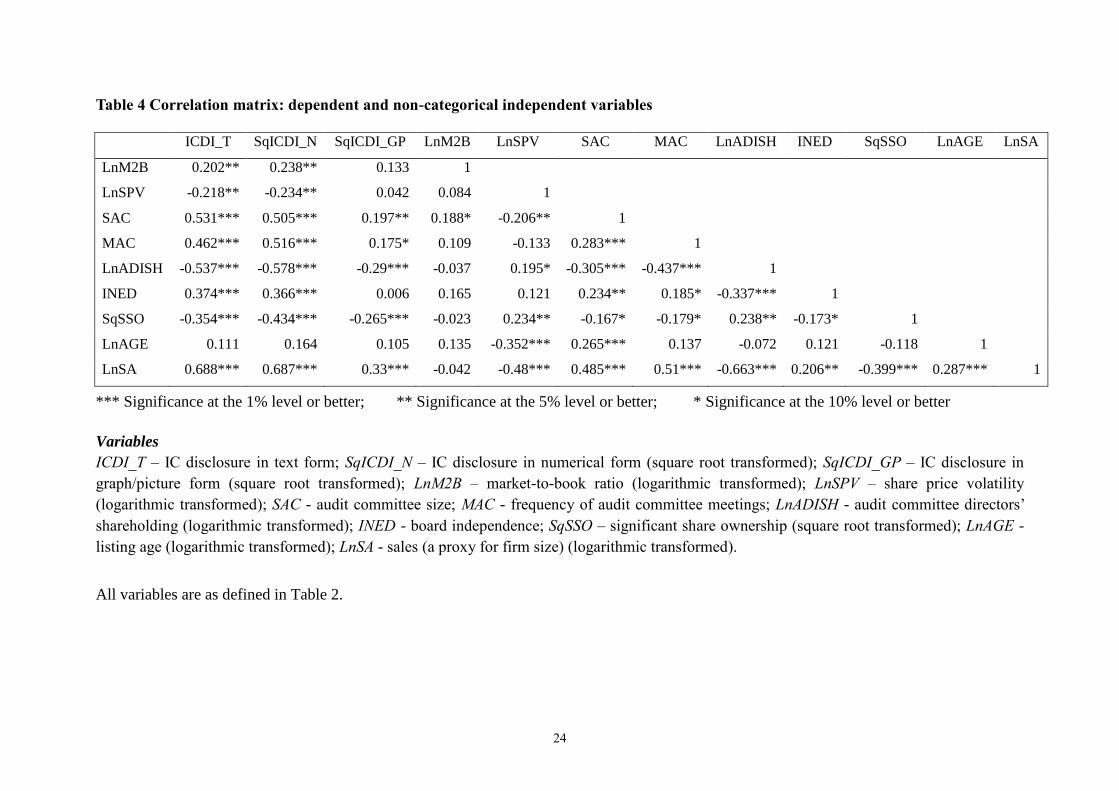
Prior to running the multiple regression analysis, we first examine our data to detect
violations of normality and problem of multicollinearity. We find that, whilst IC disclosure in
text is normally distributed, IC disclosure in numerical form and graphs/pictures and some of
the independent variables are not. These variables were thus transformed. 7 For
multicollinearity, we examine the correlation matrix among the independent variables (see
Table 4) and calculate the variation inflation factors (VIF) (see Table 5). The associations
between independent variables are all below 0.80 and the VIFs are all less than 3.6,
suggesting multicollinearity is not a major problem.8
[Table 4 insert here]
Table 5 presents the regression results. Model 1 presents the results of the ICDI_T model,
whilst Models 2 and 3 present the results for SqICDI_N and SqICDI_GP, respectively.
6 This suggests non-compliance with the recommendation of the then Combined Code (2003) and the current UK Code (2012) for at least
half of the board to be independent non-executive directors. 7 ICDI_N, ICDI_GP and significant share ownership are transformed using square root transformation, whereas the natural log
transformation is more effective for market-to-book ratio, share price volatility, audit committee directors’ shareholding, listing age and firm
size. The transformed variables all indicate normality of distribution (not tabulated). 8 Previous authors suggest multicollinearity becomes a serious problem where correlations exceed 0.8 or VIFs exceed 10 (see Li et al., 2008).
15
[Table 5 insert here]
As can be seen from Table 5, the explanatory powers (adjusted R2) of the model for ICDI_T
(60.7%) and SqICDI_N (61.3%) are very high, whereas it is much lower for SqICDI_GP
(17.2%). This suggests that the market and control variables in the model explain a
significant amount of variation in IC disclosure.
In respect to the market factors, the results show that market-to-book ratio (LnM2B), is
significantly and positively associated with both ICDI_T (p<0.05) and ICDI_N (p<0.01),
supporting hypothesis H1. The results differ from the insignificant results reported in
Brennan (2001) and García-Meca et al. (2005), but are consistent with Cerbioni and
Parbonetti (2007). The significant results suggest that IC-intensive firms with greater market-
to-book ratio are more likely to use IC disclosure in text and numerical forms to enhance
decision usefulness of the information and mitigate information asymmetry. The results for
ICDI_GP are not significant, suggesting for IC information in graphs/pictures market-to-book
ratio is not an influencing factor. These results are inconsistent with Davison and Skerratt’s
(2007) findings that firms with greater intangible assets contain extensive references to
intangibles in pictures.
Share price volatility (LnSPV), on the other hand, shows a significant positive
association with ICDI_GP, supporting hypothesis H2, but not with ICDI_T and ICDI_N. The
positive association is in line with the findings of Debreceny and Rahman (2005) in the
context of online continuous corporate disclosure. This suggests that firms with more volatile
share prices, and thus higher perceived level of risk, are more likely to use graphs/pictures as
a vehicle for IC communication. This implies that high share price volatility firms might
complement other format of IC disclosures with graphs/pictures to improve the quality of
their disclosures thus improving the market’s understanding of the firm.
The results also indicate that firms with multiple listings (ML) provide significantly
16
greater IC disclosure in text than firms with only a LSE listing. Hypotheses H3 is therefore
supported. However, no significant relationship between multiple listing and ICDI_N or
ICDI_GP is found, rejecting our hypothesis. The significant result for ICDI_T is consistent
with findings of Xiao et al. (2004) and Mangena and Pike (2005). This indicates that
international capital market pressures deriving from the needs of foreign investors and
regulators do influence IC disclosure practices in annual reports. The insignificant results in
ICDI_N and ICDI_GP may be due to the lack of regulatory requirements in the disclosure of
IC information in those formats, and thus less pressure for firms to disclose such information.
For the control variables, the results for board independence (INED) are mixed. INED is
associated positively with ICDI_T (p<0.05) and ICDI_N (p<0.10), but negatively with
ICDI_GP (p<0.05). Audit committee size (SAC) is significantly associated with ICDI_T and
ICDI_N (p<0.01), while frequency of audit committee meeting (MAC) and significant share
ownership (SqSSO) are significantly related to ICDI_N (p<0.05). The significant associations
suggest that audit committee resources in terms of their size and level of activity influence IC
disclosure practice in text and numerical forms. Share ownership by audit committee
members (LnADISH) is not significantly related to IC disclosure in any of the three formats.
The finding that none of the audit committee characteristics is associated with ICDI_GP may
suggest that audit committees do not consider these to be important in communicating with
investors. Finally, whilst firm size is significantly and positively associated with all three
formats of IC disclosure, listing age is only significant for ICDI_T at the 10% level.
5. Conclusion
Disclosure practice is a complex process, affected by a broad set of factors, both internal and
external (Gibbins et al., 1990; Haniffa and Cooke, 2002). This paper has examined whether
the extent of IC disclosure in three presentation formats are associated with capital market
factors. In this case, the study contributes to the IC disclosure literature by examining the
17
presentation format of disclosure, an issue largely neglected in the literature (see Jones, 2011).
It also contributes by providing insights into the relationship between the presentation format
of IC disclosure and market factors.
The findings demonstrate that IC disclosures captured are mainly in text, but there is
substantial disclosure made in the numerical form. The use of graphs/pictures in the
communication of many IC items is, however, significantly lower. In terms of the market
factors examined, the results indicate that market-to-book ratio is positively associated with
IC disclosure in text and numerical forms; share price volatility is positively associated with
IC disclosure in graphs/pictures; and multiple listing is positively associated with IC
disclosure in text form. This implies that the impact of capital market pressures on IC
disclosure might differ with presentation format.
The findings must be interpreted in the context of a number of limitations. Firstly, the
study uses annual reports for one year only. Further research could be conducted on other
communication media and over time. Second, the study focuses on IC-intensive industry
sectors only and cannot be generalised to other sectors. Future research could include both
IC-intensive and non-IC-intensive sectors in the analysis. Finally, the study does not address
issues relating to the processes by which the board influences disclosure decisions. Interviews
and questionnaire surveys may shed some interesting light into this.
18
References
Abeysekera, I. (2003). Intellectual Capital Reporting in Sri Lanka with A Focus on Human
Capital (1998-2000), Ph.D Thesis, Graduate School of Management, Macquarie
University, Australia.
Aboody, D., and Lev, B. (2000). “Information Asymmetry, R&D and Insider Gains”, Journal
of Finance, 55 (6): 2747-2766.
Accounting Standards Board (ASB) (2007). A Review of Narrative Reporting by UK Listed
Companies in 2006, London: FRC.
Ambler, T., Barwise, P., and Higson, C. (2001). Market Metrics: What Should We Tell the
Shareholders?, London: ICAEW, Centre for Business Performance.
Amir, E., and Lev, B. (1996). “Value-Relevance of Nonfinancial Information: The Wireless
Communication Industry”, Journal of Accounting and Economics, 22 (1-3): 3-30.
Beattie, V., Dhanani, A., and Jones, M.J. (2008). “Investigating Presentational Change in
U.K. Annual Reports”, Journal of Business Communication, 45 (2): 181-222.
Beattie, V., and Jones, M.J. (1992). “The Use and Abuse of Graphs in Annual Reports: A
Theoretical Framework and Empirical study”, Accounting and Business Research, 22 (88):
291-303.
Beattie, V., and Jones, M.J. (2002). “Measurement Distortion of Graphs in Corporate Reports:
An Experimental Study”, Accounting, Auditing and Accountability Journal, 15 (4): 546-
564.
Beattie, V., McInnes, B., and Fearnley, S. (2004). “A Methodology for Analysing and
Evaluating Narratives in Annual Reports: A Comprehensive Descriptive Profile and
Metrics for Disclosure Quality Attributes”, Accounting Forum, 28 (3): 205-236.
Beattie, V., and Thomson, S.J. (2005). “Intangibles and the OFR”, Financial Management,
June: 29-30.
Beattie, V., and Thomson, S.J. (2007). “Lifting the Lid on the Use of Content Analysis to
Investigate Intellectual Capital Disclosures”, Accounting Forum, 31 (2): 129-163.
Bozzolan, S., Favotto, F., and Ricceri, F. (2003). “Italian Annual Intellectual Capital
Disclosure: An Empirical Analysis”, Journal of Intellectual Capital, 4 (4): 543-558.
Brennan, N. (2001). “Reporting Intellectual Capital in Annual Reports: Evidence from
Ireland”, Accounting, Auditing and Accountability Journal, 14 (4): 423-436.
Brown, J.S., and Duguid, P. (2000). “Balancing Act: How to Capture Knowledge Without
Killing It”, Harvard Business Review, 78 (3): 73-80.
Bukh, P.N.D. (2003). “Commentary: The Relevance of Intellectual Capital Disclosure: A
Paradox?” Accounting, Auditing and Accountability Journal, 16 (1): 49-56.
Bushee, J.B., Matsumotob, A.D. and Millerc S.G. (2003). “Open versus Closed Conference
Calls: the Determinants and Effects of Broadening Access to Disclosure”, Journal of
Accounting and Economics, 34 (1-3): 149-180.
Campbell, D., and Abdul Rahman, M.R. (2010). “A Longitudinal Examination of Intellectual
Capital Reporting in Marks & Spencer Annual Reports, 1978-2008”, British Accounting
Review, 42 (1): 56-70.
Campbell, D., McPhail, K., and Slack, R. (2009). “A Study of the Management of Encounter
through Annual Reports, Informed by Levinas and Bauman”, Accounting, Auditing and
Accountability Journal, 22 (6): 907-932.
Cerbioni, F., and Parbonetti, A. (2007). “Exploring the Effects of Corporate Governance on
19
Intellectual Capital Disclosure: An Analysis of European Biotechnology Companies”,
European Accounting Review, 16 (4): 791-826.
Combined Code on Corporate Governance (2003). London: Financial Reporting Council.
Companies Act (2006, Chapter 5). Content of Directors’ Report: Business Review, URL:
http://www.legislation.gov.uk/ukpga/2006/46/section/417.
Davison, J., and Skerratt, L. (2007). Words, Pictures and Intangibles in the Corporate Report,
Edinburgh: ICAS.
Debreceny, R., and Rahman, A. (2005). “Firm-Specific Determinants of Continuous
Corporate Disclosures”, International Journal of Accounting, 40 (3): 249-278.
Francis, J.R., and Schipper, K. (1999). “Have Financial Statements Lost Their Relevance?”
Journal of Accounting Research, 37 (2): 319-352.
García-Meca, E., Larran, M., and Martínez, I. (2005). “The Explanatory Factors of
Intellectual Capital Disclosure to Financial Analysts”, European Accounting Review, 14
(1): 63-94.
García-Meca, E., and Martínez, I. (2007). “The Use of Intellectual Capital Information in
Investment Decisions: An Empirical Study Using Analyst Reports”, International Journal
of Accounting, 42 (1): 57-81.
Gibbins, M., Richardson, A., and Waterhouse, J. (1990). “The Management of Corporate
Financial Disclosure: Opportunism, Ritualism, Policies, and Processes”, Journal of
Accounting Research, 28 (1): 121-143.
Gray, S.J., Meek, G.K., Roberts, C.B. (1995). “International Capital Market Pressures and
Voluntary Annual Reports Disclosures by U.S. and U.K. Multinationals”, Journal of
International Financial Management and Accounting, 6 (1): 43-68.
Gu, F., and Lev, B. (2004). “The Information Content of Royalty Income”, Accounting
Horizons, 18 (1): 1-12.
Guthrie, J., Petty, R., and Riccerri, F. (2007). Intellectual Capital Reporting: Lessons from
Hong Kong and Australia, Edinburgh: ICAS.
Haniffa, M.R., and Cooke, T.E. (2002). “Culture, Corporate Governance and Disclosure in
Malaysian Corporations”, Abacus, 38 (3): 317-349.
Healy, P.M., and Palepu, K.G. (2001). “Information Asymmetry, Corporate Disclosure, and
the Capital Markets: A Review of the Empirical Disclosure Literature”, Journal of
Accounting and Economics, 31 (1/3): 405-440.
Holland, J. (2003). “Intellectual Capital and the Capital Market - Organisation and
Competence”, Accounting, Auditing and Accountability Journal, 16 (1): 39-48.
Holland, J. (2006). A Model of Corporate Financial Communication, Edinburgh: ICAS.
Jones, M.J. (2011). “The Nature, Use and Impression Management of Graphs in Social and
Environmental Accounting”, Accounting Forum, 35: 75-89.
Krippendorff, K. (1980). Content Analysis: An Introduction to Its Methodology, Beverly
Hills, CA: Sage.
Lang, M., and Lundholm, R. (1993). “Cross-Sectional Determinants of Analysts Ratings of
Corporate Disclosure”, Journal of Accounting Research, 31 (2): 246-271.
Li, J., Mangena, M., and Pike, R. (2012). “The Effect of Audit Committee Characteristics on
Intellectual Capital Disclosure”, British Accounting Review, 44 (2): 98-110.
Li, J., Pike, R., and Haniffa, R. (2008). “Intellectual Capital Disclosure and Corporate
Governance Structure in UK Firms”, Accounting and Business Research, 38 (2): 137-59.
Mangena, M., Li, J., and Tauringana, V. (2014). “'Disentangling the Effects of Corporate
20
Disclosure on the Cost of Equity Capital: A Study of the Role of Intellectual Capital
Disclosure”, Journal of Accounting, Auditing and Finance, DOI:
http://dx.doi.org/10.1177/0148558X14541443.
Mangena, M., and Pike, R. (2005). “The Effect of Audit Committee Shareholding, Financial
Expertise and Size on Interim Financial Disclosures”, Accounting and Business Research,
35 (4): 327-349.
Mangena, M., and Tauringana, V. (2007). “Corporate Compliance with Non-mandatory Best
Practice Statements: The Case of the ASB Statement on Interim Reports”, European
Accounting Review, 16 (2): 399-427.
Marston, C.L., and Shrives, P.J. (1991). “The Use of Disclosure Indices in Accounting
Research: A Review Article”, British Accounting Review, 23 (2): 195-210.
Muino, F. and M. Trombetta (2009). “Does Graph Disclosure Bias Reduce the Cost of Equity
Capital?’, Accounting and Business Research, 39: 83-102.
Striukova, L., Unerman, J., and Guthrie, J. (2008). “Corporate Reporting of Intellectual
Capital: Evidence from UK Companies”, British Accounting Review, 40 (4): 297-313.
UK Code (2012). UK Corporate Governance Code. London: FRC.
Xiao, J.Z., Yang, H., and Chow, W.C. (2004). “The Determinants and Characteristics of
Voluntary Internet-Based Disclosures by Listed Chinese Companies”, Journal of
Accounting and Public Policy, 23: 191-225.
21
Table 1 Number of samples by industry sector
Industry Category Population
of Firms
% of total
population
Sample
1 Biotechnology & Pharmaceutical (BPH) 40 12.54% 13
2 Information Technology (IT) 60 18.81% 19
3 Media & Publishing (M&P) 45 14.11% 14
4 Business Services Providers (BSP) 83 26.02% 26
5 Telecommunication Services (Telecom) 18 5.64% 6
6 Banks & Insurance (B&I) 51 15.99% 15
7 Food Production & Beverage (F&Bev) 22 6.90% 7
Total 319 100% (Round up) 100
22
Table 2 Dependent and independent variables, measurement and source of information
Variable Operationalisation Source Acronym
Panel A Dependent variables
IC disclosure
index
IC Disclosure in text,
numerical form,
graphs/pictures
An IC disclosure index is computed for each of the three presentation formats, i.e. IC
disclosure in text form (ICDI_T), in numerical form (ICDI_N), and in graphs/pictures
(ICDI_GP), as the number of IC items disclosed in the respective presentation format
divided by 61.
Annual
report
(AR)
ICDI_T
ICDI_N
ICDI_GP
Panel B Independent variables
Market factors Market-to-book ratio Stock market value over book value of assets as at the financial year end studied. The
ratio is transformed using natural logs.
Thomson
one
LnM2B
Share price volatility Difference between the highest and lowest share price during the financial year of
study, scaled by the lowest share price (e.g. Bushee et al., 2003). This is transformed
using natural logs.
Thomson
one LnSPV
Multiple listing Dummy variable with a value of 1 if the firm is listed on one or more international
stock exchange(s), otherwise a value of 0 is given (e.g. Haniffa and Cooke, 2002).
Thomson
one
ML
Control variables
Corporate
governance
factors
Board independence Number of independent non-executive directors on board (specified in the annual
reports) divided by total number of directors on board at the financial year end. (%)
AR INED
Significant share
ownership
Percentage cumulative shareholdings by individuals or organizations classified as
substantial shareholders (i.e. owning 3% or more of the firm’s share capital), excluding
significant directors’ shareholdings, to the total number of outstanding ordinary shares
at the financial year end. This is transformed using square root transformation.
AR SqSSO
Audit committee size Number of board directors on the audit committee as at the financial year end. AR SAC
Frequency of audit
committee meetings
Number of audit committee meetings held during the financial year of study. AR MAC
Audit committee
directors’ shareholding
Percentage cumulative shareholdings by audit committee directors to total number of
outstanding ordinary shares at the financial year end. This is transformed using natural
logs.
AR LnADISH
Firm specific
characteristics
Listing age Number of days listed on LSE scaled by 365 days a year, transformed using natural
logs.
LSE
website
LnAGE
Firm size (sales) The natural log of sales revenue of the financial year of study. AR LnSA
23
Table 3 Descriptive statistics for IC disclosure indices and independent variables
Mean Median Min. Max.
Std.
Dev.
Panel A – IC disclosure indices
Intellectual Capital (IC)
Disclosure Indices
Text 0.70 0.72 0.31 0.93 0.12
Numerical 0.29 0.30 0.11 0.62 0.11
Graphs/Pictures 0.08 0.09 0.00 0.33 0.08
Panel B - Independent variables
Market factors
Market-to-book ratio 3.89 2.70 0.52 17.81 3.40
Share price volatility 0.80 0.59 0.16 3.73 0.73
Multiple listing 0.61 1 0 1 0.49
Control variables
Corporate governance factors
Board independence 0.47 0.50 0.18 0.75 0.13
Significant share ownership 0.30 0.26 0.00 0.79 0.20
Audit committee size (number) 3.46 3 1 7 1.06
Frequency of audit committee meetings
(number) 3.70 4 1 9 1.41
Audit committee directors’ shareholding 0.016 0.00033 0.00 0.514 0.068
Firm specific characteristics
Listing age (Years) 17.15 10.69 0.45 71.87 16.71
Firm size - Sales (£m) 4036.7 383.1 0.00 39792.2 8782.4
24
Table 4 Correlation matrix: dependent and non-categorical independent variables
ICDI_T SqICDI_N SqICDI_GP LnM2B LnSPV SAC MAC LnADISH INED SqSSO LnAGE LnSA
LnM2B 0.202** 0.238** 0.133 1
LnSPV -0.218** -0.234** 0.042 0.084 1
SAC 0.531*** 0.505*** 0.197** 0.188* -0.206** 1
MAC 0.462*** 0.516*** 0.175* 0.109 -0.133 0.283*** 1
LnADISH -0.537*** -0.578*** -0.29*** -0.037 0.195* -0.305*** -0.437*** 1
INED 0.374*** 0.366*** 0.006 0.165 0.121 0.234** 0.185* -0.337*** 1
SqSSO -0.354*** -0.434*** -0.265*** -0.023 0.234** -0.167* -0.179* 0.238** -0.173* 1
LnAGE 0.111 0.164 0.105 0.135 -0.352*** 0.265*** 0.137 -0.072 0.121 -0.118 1
LnSA 0.688*** 0.687*** 0.33*** -0.042 -0.48*** 0.485*** 0.51*** -0.663*** 0.206** -0.399*** 0.287*** 1
*** Significance at the 1% level or better; ** Significance at the 5% level or better; * Significance at the 10% level or better
Variables
ICDI_T – IC disclosure in text form; SqICDI_N – IC disclosure in numerical form (square root transformed); SqICDI_GP – IC disclosure in
graph/picture form (square root transformed); LnM2B – market-to-book ratio (logarithmic transformed); LnSPV – share price volatility
(logarithmic transformed); SAC - audit committee size; MAC - frequency of audit committee meetings; LnADISH - audit committee directors’
shareholding (logarithmic transformed); INED - board independence; SqSSO – significant share ownership (square root transformed); LnAGE -
listing age (logarithmic transformed); LnSA - sales (a proxy for firm size) (logarithmic transformed).
All variables are as defined in Table 2.

25
Table 5 Multiple regression results: IC disclosure in three presentation formats
ICDI_T SqICDI_N SqICDI_GP
VIF t Sig. t Sig. t Sig.
(Constant) 8.181 .000 7.860 .000 3.408 .001
LnM2B 1.159 2.046 .044 2.738 .007 1.193 .236
LnSPV 1.679 .910 .365 .221 .825 3.057 .003
ML 1.428 2.358 .021 .156 .877 .945 .347
INED 1.291 2.151 .034 1.736 .086 -2.238 .028
SqSSO 1.311 -.509 .612 -2.506 .014 -1.643 .104
SAC 1.506 2.183 .032 2.119 .037 .128 .898
MAC 1.471 .775 .440 2.035 .045 -.648 .518
LnADISH 2.200 .330 .742 -1.238 .219 -.951 .344
LnAGE 1.279 -1.952 .054 -1.082 .282 1.010 .315
LnSA 3.578 4.972 .000 3.315 .001 2.196 .031
R2 .647 .652 .256
Adj. R2 .607 .613 .172
S.E. .073 .061 .114
F value 16.287 16.654 3.060
Sig. F .000 .000 .002
Variables
ICDI_T – IC disclosure in text form; SqICDI_N – IC disclosure in numerical form (square
root transformed); SqICDI_GP – IC disclosure in graph/picture form (square root
transformed); LnM2B – market-to-book ratio (logarithmic transformed); LnSPV – share price
volatility (logarithmic transformed); SAC - audit committee size; MAC - frequency of audit
committee meetings; LnADISH - audit committee directors’ shareholding (logarithmic
transformed); INED - board independence; SqSSO – significant share ownership (square root
transformed); LnAGE - listing age (logarithmic transformed); LnSA - sales (a proxy for firm
size) (logarithmic transformed).
All variables are as defined in Table 2.