cape verdeans in boston
TRANSCRIPT
Cap
e V
erde
ans
CITY OF BOSTON
Martin J. Walsh
Mayor 2016
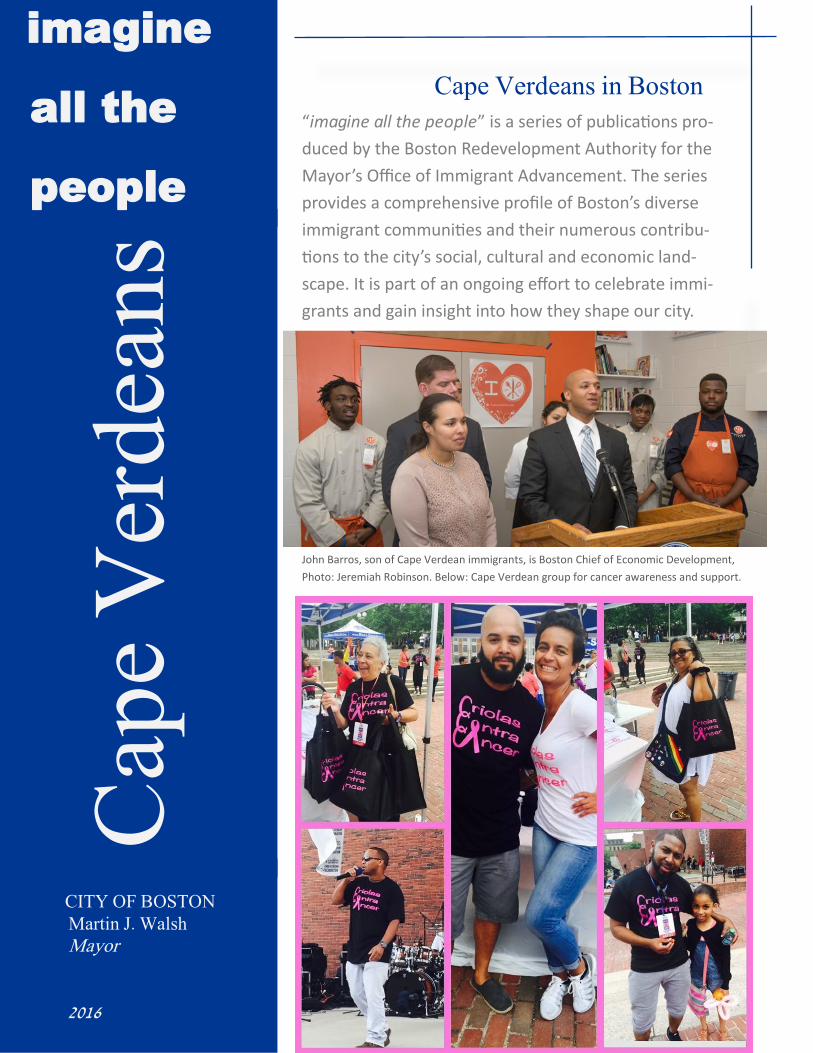
Cape Verdeans in Boston “imagine all the people” is a series of publications pro-
duced by the Boston Redevelopment Authority for the
Mayor’s Office of Immigrant Advancement. The series
provides a comprehensive profile of Boston’s diverse
immigrant communities and their numerous contribu-
tions to the city’s social, cultural and economic land-
scape. It is part of an ongoing effort to celebrate immi-
grants and gain insight into how they shape our city.
John Barros, son of Cape Verdean immigrants, is Boston Chief of Economic Development,
Photo: Jeremiah Robinson. Below: Cape Verdean group for cancer awareness and support.
imagine
all the
people
2
Cape Verde is an archipelago of nine islands off the coast of West Africa. From their settlement by Portuguese sailors in the late 15th century until 1975, the islands were a Portuguese colony. Large-scale migration to Massachusetts and Rhode Island started in the 1800s, when Cape Verdeans migrated to New Bed-ford to work in the whaling industry. Cape Verdeans remained in the region and worked in the cranberry industry after the decline in whaling. The 1924 Nations of Origins Act restricted new Cape Verdean migration to Massachu-setts, but the 1965 Immigration and Nationality Act reduced this restriction, and Cape Verdean migration to Massachusetts increased. By 1975 when Cape Verde gained its independence, Cape Verdean migration to Boston started to grow.1
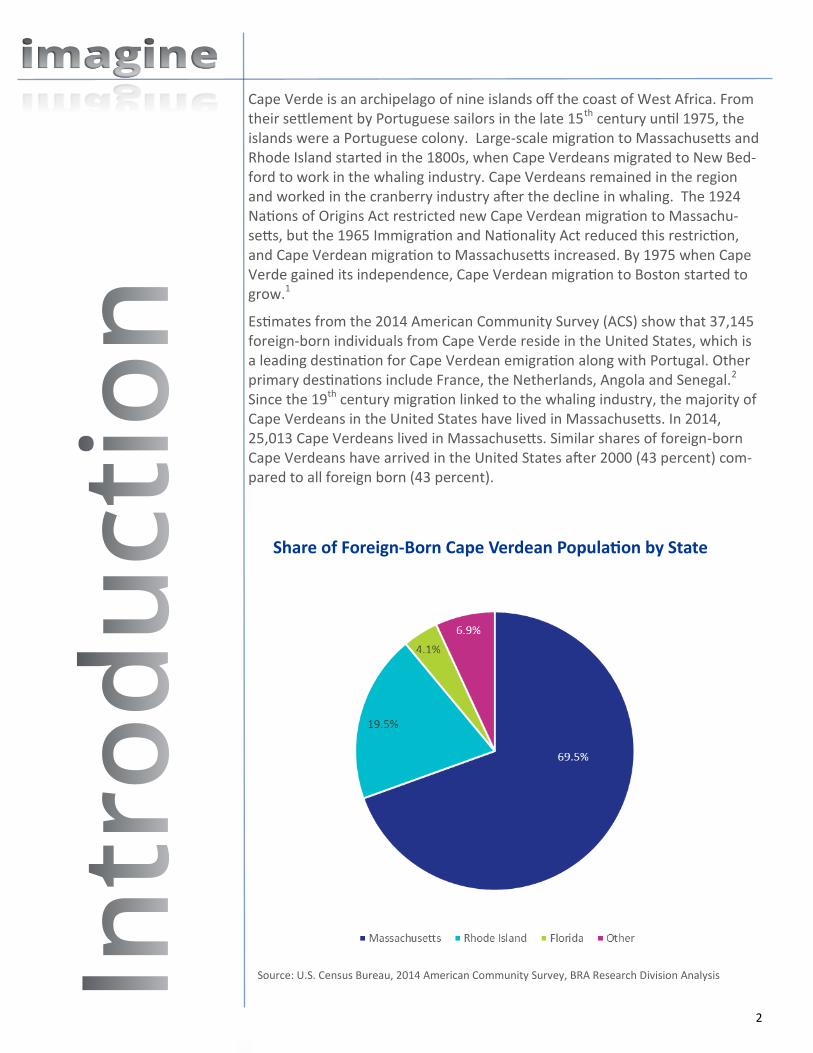
Estimates from the 2014 American Community Survey (ACS) show that 37,145 foreign-born individuals from Cape Verde reside in the United States, which is a leading destination for Cape Verdean emigration along with Portugal. Other primary destinations include France, the Netherlands, Angola and Senegal.2 Since the 19th century migration linked to the whaling industry, the majority of Cape Verdeans in the United States have lived in Massachusetts. In 2014, 25,013 Cape Verdeans lived in Massachusetts. Similar shares of foreign-born Cape Verdeans have arrived in the United States after 2000 (43 percent) com-pared to all foreign born (43 percent).
Source: U.S. Census Bureau, 2014 American Community Survey, BRA Research Division Analysis
Share of Foreign-Born Cape Verdean Population by State

3
1 in 5
Cape Verdeans in
the U.S. live in
Boston.
According to the 2014 American Community Survey (ACS), 7,826 Cape Verdeans reside in Boston.3 Cape Verde is the seventh largest country of origin for Boston’s foreign-born population. Overall, Cape Verdeans in Boston constitute 4.4 percent of the city’s total foreign-born residents.4 Dominicans and Chinese comprise the largest share of the city’s foreign-born population, followed by Haitians, Salvadorans, Vietnamese and Ja-maicans.
Boston’s foreign-born Cape Verdeans live primarily in the neighborhoods of Dorchester (68 percent), Roxbury (15 percent), and Mattapan (4 per-cent). Other neighborhoods with smaller shares are East Boston, the South End, and South Boston.5
The U.S. Census Bureau’s ACS Public Use Microdata Sample (PUMS) al-lows for the detailed socio-economic analysis of specific populations. For smaller populations like foreign-born Cape Verdeans in Boston, a 5-year sample is required to limit variation due to sampling error. The analysis that follows uses 2009-2013 ACS PUMS data.
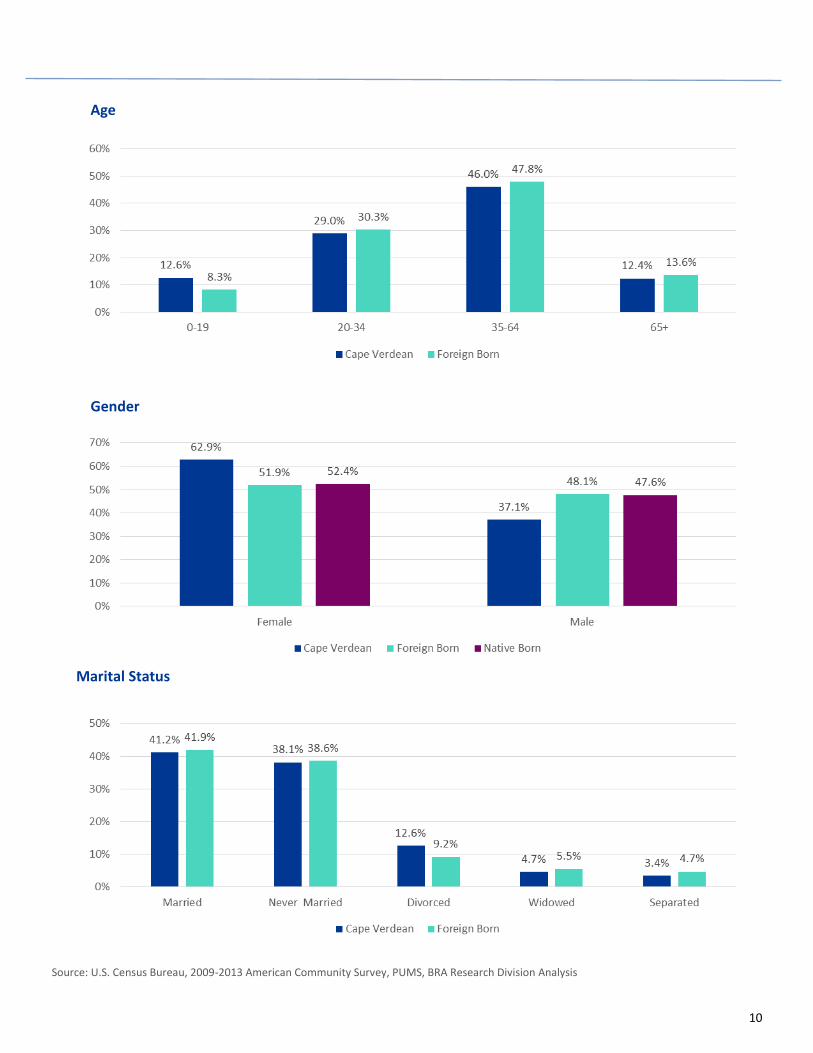
Cape Verdean migration has historically been disproportionately female, and 63 percent of foreign-born Cape Verdeans in Boston are female. More than 62 percent of foreign-born Cape Verdeans in Boston are ei-ther married (41 percent) or divorced/separated (16 percent) or wid-owed (5 percent). Approximately 46 percent of all foreign-born Cape Verdeans are between the ages of 35-64, and the median age of the population is 41 years. The majority of foreign-born Cape Verdeans (56 percent) are naturalized U.S. citizens.
Photo: CVC Unido
4
Almost half of adult
foreign-born Cape
Verdeans have not
completed high
school.
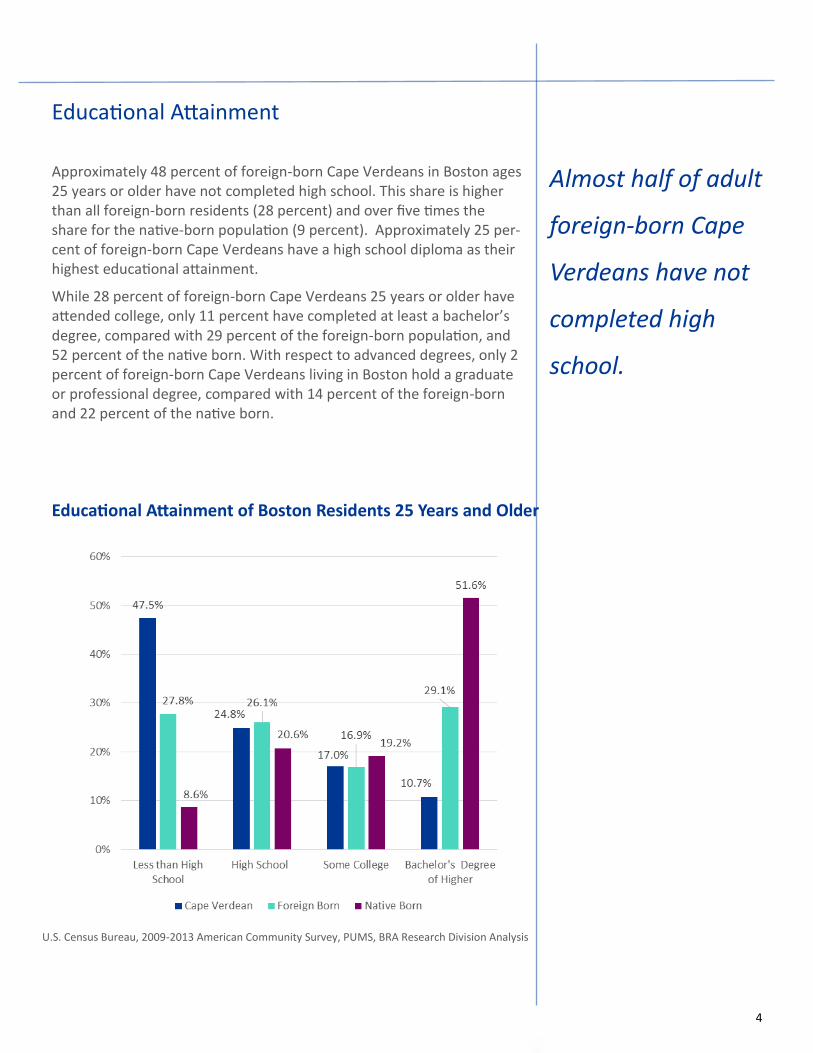
Educational Attainment of Boston Residents 25 Years and Older
Educational Attainment
Approximately 48 percent of foreign-born Cape Verdeans in Boston ages 25 years or older have not completed high school. This share is higher than all foreign-born residents (28 percent) and over five times the share for the native-born population (9 percent). Approximately 25 per-cent of foreign-born Cape Verdeans have a high school diploma as their highest educational attainment.
While 28 percent of foreign-born Cape Verdeans 25 years or older have attended college, only 11 percent have completed at least a bachelor’s degree, compared with 29 percent of the foreign-born population, and 52 percent of the native born. With respect to advanced degrees, only 2 percent of foreign-born Cape Verdeans living in Boston hold a graduate or professional degree, compared with 14 percent of the foreign-born and 22 percent of the native born.
U.S. Census Bureau, 2009-2013 American Community Survey, PUMS, BRA Research Division Analysis

5
41 percent of foreign-born Cape Verdeans in the workforce are employed in service occupations.6 The next largest occupational categories are con-struction, extraction, maintenance, and transportation (14 percent) and production (11 percent).
Foreign-born Cape Verdeans are over-represented in service occupations even when compared to all foreign born in Boston. Within service occupa-tions, 25 percent work in building and grounds, cleaning and maintenance occupations and 10 percent of all foreign-born Cape Verdeans work in food preparation. Conversely, foreign-born Cape Verdeans are significantly un-der-represented in managerial and professional occupations: 9 percent for Cape Verdeans compared with 18 percent for the total foreign-born popu-lation and 28 percent for the native born.
Occupations by Nativity
U.S. Census Bureau, 2009-2013 American Community Survey, PUMS, BRA Research Division Analysis
6
A greater share of
Cape Verdeans are
employed in private,
for-profit
organizations than
overall foreign-born
and native-born
populations.
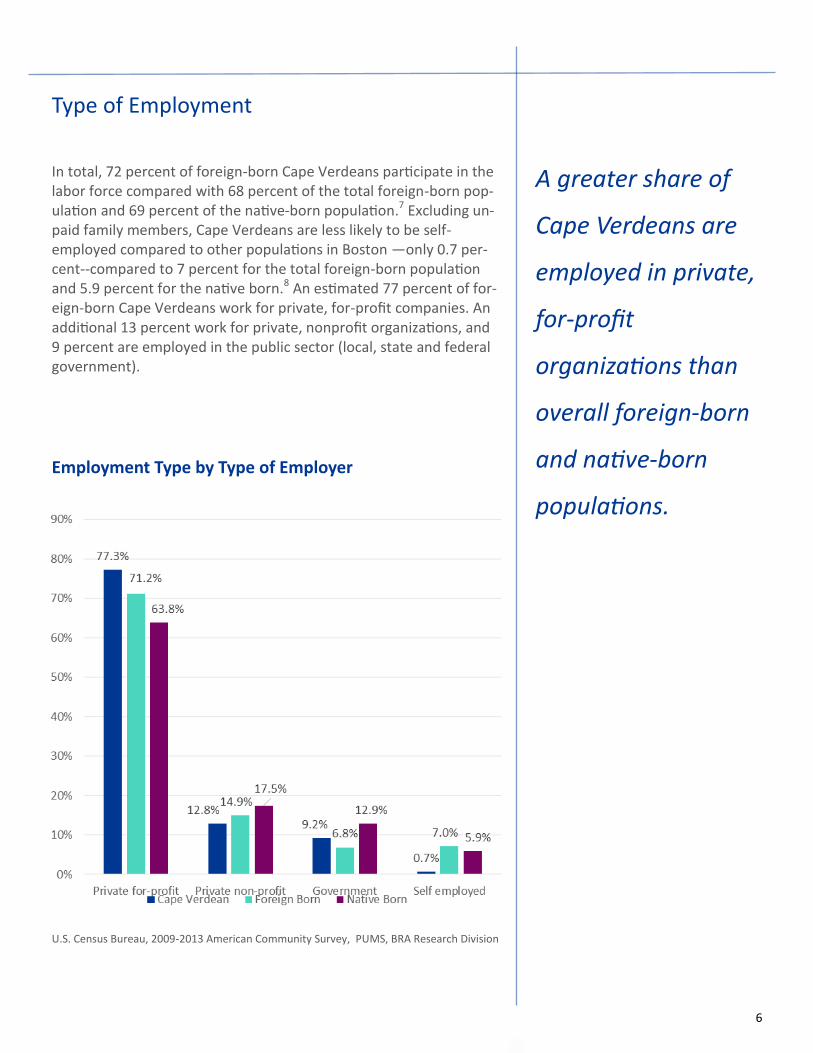
In total, 72 percent of foreign-born Cape Verdeans participate in the labor force compared with 68 percent of the total foreign-born pop-ulation and 69 percent of the native-born population.7 Excluding un-paid family members, Cape Verdeans are less likely to be self-employed compared to other populations in Boston —only 0.7 per-cent--compared to 7 percent for the total foreign-born population and 5.9 percent for the native born.8 An estimated 77 percent of for-eign-born Cape Verdeans work for private, for-profit companies. An additional 13 percent work for private, nonprofit organizations, and 9 percent are employed in the public sector (local, state and federal government).
Employment Type by Type of Employer
U.S. Census Bureau, 2009-2013 American Community Survey, PUMS, BRA Research Division
Type of Employment
7
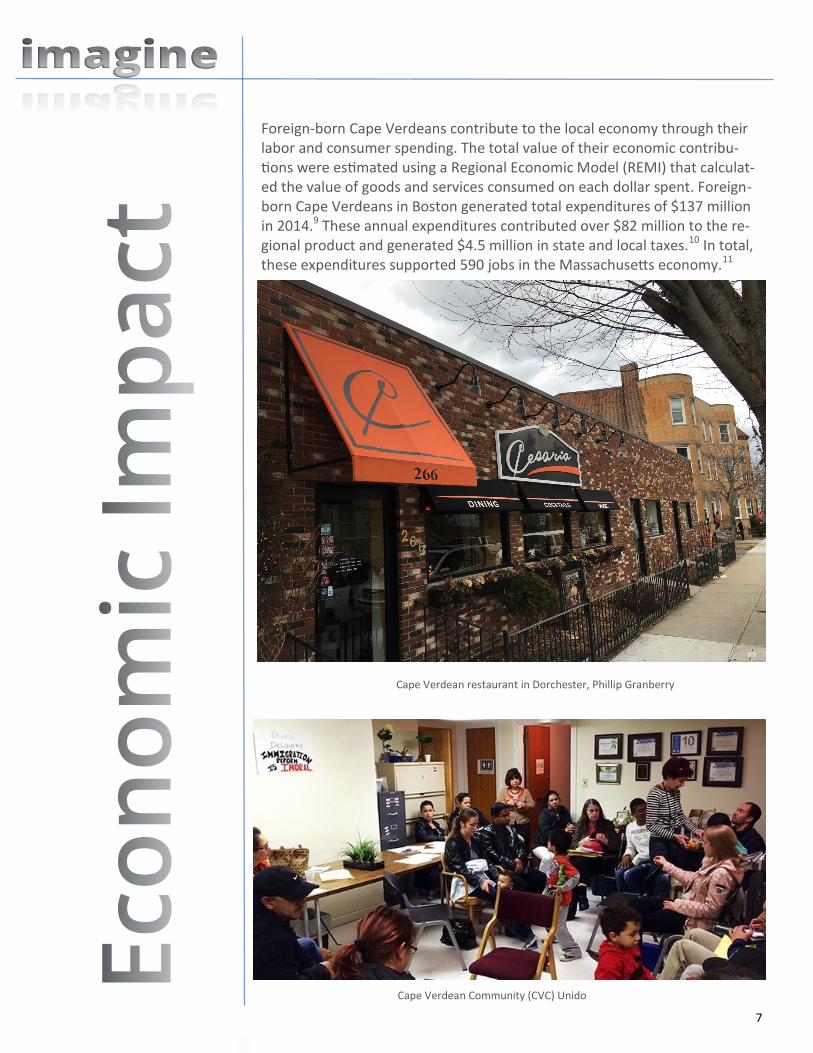
Foreign-born Cape Verdeans contribute to the local economy through their labor and consumer spending. The total value of their economic contribu-tions were estimated using a Regional Economic Model (REMI) that calculat-ed the value of goods and services consumed on each dollar spent. Foreign-born Cape Verdeans in Boston generated total expenditures of $137 million in 2014.9 These annual expenditures contributed over $82 million to the re-gional product and generated $4.5 million in state and local taxes.10 In total, these expenditures supported 590 jobs in the Massachusetts economy.11
Cape Verdean Community (CVC) Unido
Cape Verdean restaurant in Dorchester, Phillip Granberry

8
Over half of
adult Cape
Verdeans lack
either a high
school diploma
or English
proficiency.
Approximately 20 percent of foreign-born Cape Verdeans have achieved a middle class standard of living, compared with 45 percent of Boston’s native-born population, and 29 percent of all foreign-born. A family income four times the poverty line is used as a proxy for a middle-class standard of living. The actual income needed to achieve this standard depends on the size and composition of the family. For a two-person family in 2014, a middle class income would be at least $62,920.12 In contrast, 18 percent of foreign-born Cape Verdeans live below the federal poverty level compared to 20 percent for the city’s total population.
Low educational attainment and lack of English proficiency may contribute to Cape Verdeans’ low standard of living. While 18 percent of Boston’s adult foreign-born population lack a high school diploma and have limited English proficiency, the share among Cape Verdean-born adults is 34 percent.13
Educational Attainment and English Proficiency
Population age 25 and older
Standard of Living
U.S. Census Bureau, 2009-2013 American Community Survey, PUMS, BRA Research Division Analysis

9
10
Age
Gender
Marital Status
Source: U.S. Census Bureau, 2009-2013 American Community Survey, PUMS, BRA Research Division Analysis
11
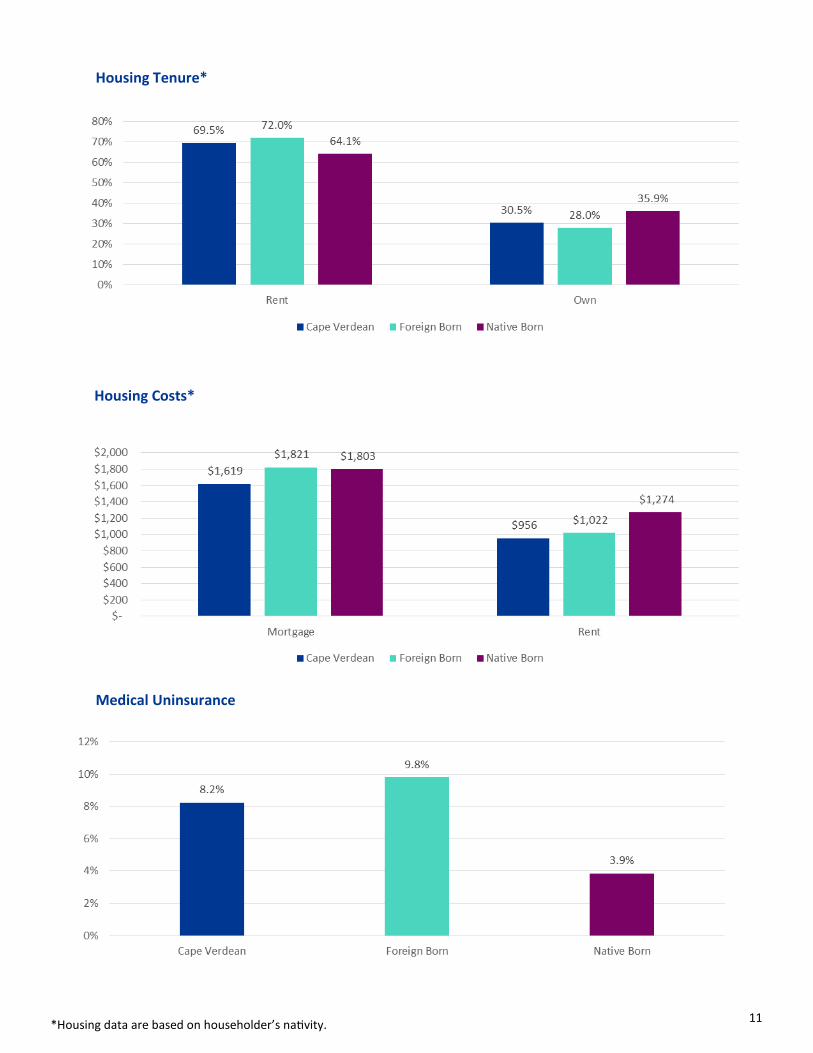
Housing Tenure*
Housing Costs*
Medical Uninsurance
*Housing data are based on householder’s nativity.
12
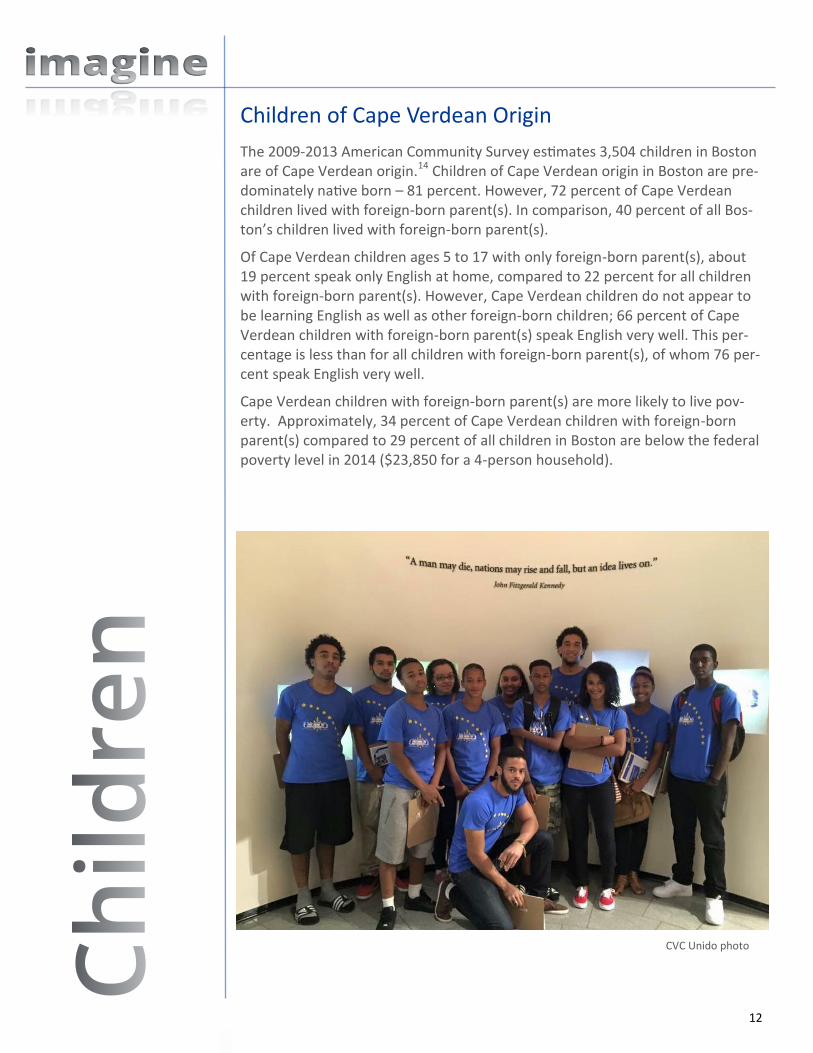
Children of Cape Verdean Origin
The 2009-2013 American Community Survey estimates 3,504 children in Boston are of Cape Verdean origin.14 Children of Cape Verdean origin in Boston are pre-dominately native born – 81 percent. However, 72 percent of Cape Verdean children lived with foreign-born parent(s). In comparison, 40 percent of all Bos-ton’s children lived with foreign-born parent(s).
Of Cape Verdean children ages 5 to 17 with only foreign-born parent(s), about 19 percent speak only English at home, compared to 22 percent for all children with foreign-born parent(s). However, Cape Verdean children do not appear to be learning English as well as other foreign-born children; 66 percent of Cape Verdean children with foreign-born parent(s) speak English very well. This per-centage is less than for all children with foreign-born parent(s), of whom 76 per-cent speak English very well.
Cape Verdean children with foreign-born parent(s) are more likely to live pov-erty. Approximately, 34 percent of Cape Verdean children with foreign-born parent(s) compared to 29 percent of all children in Boston are below the federal poverty level in 2014 ($23,850 for a 4-person household).
CVC Unido photo

13
Massachusetts is the leading destination of Cape Verdeans who migrate to the United States. This small Atlantic archipelago nation is the source of the sixth largest foreign-born population in Boston. Foreign-born Cape Verdeans actively contribute to the economy, culture, and civic life of their new home. Even though foreign-born Cape Verdeans have lower levels of educational attain-ment, they have high labor force participation. However, many of these jobs are in low-wage food preparation or cleaning and maintenance occupations. Even with occupational segregation, Cape Verdeans are slightly less likely to live be-low the federal poverty level than others in the city.
Photo: CVC Unido
14
1 Carling, Jørgen, Cape Verde: Towards the End of Emigration? Migration Policy In-stitute (2002).
2 Migração em Cabo Verde: Perfil Nacional 2009. Estimates of Cape Verdean emi-gration vary widely--between 200,000 and 500,000—and thus so does their nation-al distribution. The size of the migrant population varies, but both the United States and Portugal are considered leading destinations of Cape Verdean migration. 3 The ACS’s American Fact Finder website reports that there are an estimated 7,826 foreign-born Cape Verdeans in Boston. However, ACS Public Use Microdata Sample (PUMS) data for Boston reports a lower estimate of 7,727. Both are population esti-mates, and contain a margin of error due to sampling technique. Lower survey re-sponse rates due to language or documentation issues may result in an undercount of the population. For more information on American Fact Finder please see: http://factfinder.census.gov/home/saff/main.html?_lang=en. 4 2014 American Community Survey, PUMS data, BRA Research Analysis (2016). 5 2009-2013 American Community Survey, American Factfinder, BRA Research Anal-ysis (2016). 6 This analysis organizes occupations into 12 categories. Managerial and Profession-al contains categories of Management, Business, Science, and Arts Occupations, Business Operations Specialists, Financial Specialists, Computer and Mathematical Occupations, Architecture and Engineering Occupations, Life, Physical, and Social Science Occupations, and Legal Occupations. Healthcare Practitioners & Support contains the categories of Healthcare Practitioners and Technical Occupations and Healthcare Support Occupations. Service Occupations contains the categories of Protective Service Occupations, Food Preparation and Serving Occupations, Building and Grounds Cleaning and Maintenance Occupations, and Personal Care and Ser-vice Occupations. Construction, Extraction, Maintenance, and Transportation con-tains the categories of Construction and Extraction Occupations, Extraction Work-ers, Installation, Maintenance, and Repair Workers, and Transportation and Materi-al Moving Occupations. Other categories consisting of Farming, Fishing, and Forest-ry, Military Specific, and long-term unemployed are excluded.
7 Labor force participation: Defined as the share of the working-age population that is either currently employed or seeking work. U.S. Department of Labor, Bureau of Labor Statistics, 2016. 8 There is no agreement among researchers regarding the reasons for variations in the self-employment rates among different immigrant groups. Reasons cited in-clude human and financial capital of individual immigrants, high rates of solidarity and social capital in some immigrant communities, as well as the opportunity struc-ture encountered by immigrant entrepreneurs.

15
9 BRA Research Division Analysis, 2014, Regional Economic Model, Inc., REMI calcula-tions.
10 BRA Research Division Analysis, 2014, Regional Economic Model, Inc., REMI calcula-tions. 11 BRA Research Division Analysis, 2014, Regional Economic Model, Inc., REMI calcula-tions. 12 Following the Office of Management and Budget's (OMB) Statistical Policy Directive 14, the Census Bureau uses a set of money income thresholds that vary by family size and composition to determine who is in poverty. If a family's total income is less than the family's threshold, then that family and every individual in it is considered in pov-erty. The official poverty thresholds do not vary geographically. U.S. Census Bureau (2016). 13 Limited English Proficiency includes foreign-born adults who do not speak English well or at all. 14 The U.S. Census defines origin as “the heritage, nationality, lineage, or country of birth of the person or the person’s parents or ancestors before arriving in the United States.
In November 2014, Officer John Teixeira became the BPD’s 1st Cape Verdean-born officer to attain the rank of sergeant —
BPD photographer Marc Vaillancourt

16
Produced by the BRA Research Division
Alvaro Lima – Director of Research
Jonathan Lee– Deputy Director
Christina Kim – Research Manager
Phillip Granberry – Senior Researcher/Demographer
Matthew Resseger – Senior Researcher/Economist
Kevin Kang – Research Associate
Kevin Wandrei – Research Assistant
Interns:
Michael Bratsis
Jingwan Wang
Cyan O’Garro
Map by BRA Digital Cartography & GIS Alla Ziskin
Brian P. Golden, Director