capability traps? - harvard universityjune2010).pdf · preliminary version for comments: 1 please...
TRANSCRIPT
Preliminary version for comments: 1Please do not circulate without permission
Capability Traps?
The Mechanisms of Persistent Implementation Failure1
Lant Pritchett, Harvard Kennedy School
Michael Woolcock, World Bank
Matt Andrews, Harvard Kennedy School
May 3, 2010
Abstract: Many countries remain stuck in situations of low productivity (and hence lower GDP per capita and widespread poverty). This has been both well documented as a fact and has attracted many explanations, both of the deep structural causes of such stagnation as well as the more proximate mechanisms that allow and facilitate persistent slow growth. Economic growth is only one dimension of development; another is the expansion of the administrative capability of the state, the capability that allows governments to affect the course of events by implementing policies and programs. We document that many countries in the world remain in “state capability traps” in which the capability of the state to implement is both severely limited and improving (if at all) only very slowly: at their current pace of progress such countries would take hundreds (if not thousands) of years to reach the levels of high capability countries. We then explore how this can be so. That is, we do not attempt to explain why countries remain in capability traps – this would require a historical, political and social analysis – and an analysis that was unique to each country. Rather we focus on how countries manage to engage in the domestic and international logics of “development” and yet fail to acquire capability. What are the techniques of failures? Two stand out. First, ‘big development’ encourage progress through importing standard responses to predetermined problems. This encourages isomorphic mimicry as a technique of failure: the adoption of the forms of other functional states and organizations which camouflages a persistent lack of function. Second, an inadequate theory of developmental change reinforces a fundamental mismatch between expectations and the actual capacity of prevailing administrative systems to implement even the most routine administrative tasks. This leads to premature load bearing in which wishful thinking about the pace of progress and unrealistic expectations about the level and rate of improvement of capability lead to stresses and demands on systems that cause capability to weaken (if not collapse). A companion paper (Andrews, Pritchett and Woolcock 2010) explores how to create conditions for progress by sabotaging the techniques of failure.
1 Our thanks to seminar participants at the Center for Global Development, Harvard, USAID and the World Bankfor many helpful comments and suggestions. The usual disclaimers apply. Email addresses for correspondence: [email protected], [email protected], and [email protected].
Preliminary version for comments: 2Please do not circulate without permission
I. Introduction
Development necessarily entails change and hence all activities attempting to promote development – projects, programs, policy reform, technical assistance, training workshops,capacity building, research and evaluation – operate, implicitly or explicitly, on the basis of some theory of change. Successfully implementing these activities requires sustained change in the day to day, week by week practices of millions of individuals, and as such it is often the weak link connecting a policy’s conception and its realized attainment. Even so, however, implementation issues remain a conspicuously under-appreciated, under-theorized and under-researched area, usually considered only as an afterthought to the heavy intellectual lifting associated withdefining objectives, designing policies and formulating strategies.2
Despite the fact that development initiatives have failed at least as often from weak implementation as from deficient objectives, policies or strategies, failed implementation has largely been treated as a minor flaw, a treatable and transitory phenomena. Sometimes it is. But many times implementation failures are in fact the symptom – the practical manifestation – that reveals the very deep underlying problem in the theories of change. This is most clearly evident in ‘fragile’ or high-conflict countries, where persistent crises expose and exacerbate underlying fault-lines in the systems and organizations seeking to provide development assistance.
In this paper, we argue that persistent implementation failure in development, as and when it occurs, is often a product of the deployment of theories of change that inadequately map onto the types of problems they are increasingly being asked to address. These theories reflect and reinforce the ways in which the staff of development agencies perform their tasks, and in which those agencies themselves operate; they also, in turn, reflect and reinforce the structures of the broader systems within which both development staff (agents) and agencies (organizations)are embedded. As such, in order to propose an alternative theory of change, we need tounderstand the characteristics of the relationship between agents and organizations, and why, cumulatively, these systems have been (and remain) so attractive in so many different ideological contexts for so long. As development policy increasingly encounters deeply complex issues surrounding the extension of basic public services, land administration, public financial management and legal reform – tasks for which governments everywhere have a clear responsibility, if not mandate – it is unrealistic and inefficient at best, and counterproductive and unethical at worst, to expect that systems which so routinely fail to implement even relatively straightforward objectives will be able to successfully engage deeply complex ones. In short, international development in the twenty-first century needs a new operating system. We endeavor to provide a framework, grounded in case studies and a comparative analysis of contemporary trajectories of administrative capability, to move us in that direction.
The paper proceeds as follows. In Section II we provide a big-picture account of the development process, arguing that it essentially involves modernization across four realms: the polity, the economy, social relations, and public administration. This four-fold process may
2 It is striking that Pressman and Wildavsky (1984), a study of implementation issues surrounding pro-poor social programs in San Francisco, was initially conducted over three decades ago and remains one of the few comprehensive examinations of how and where implementation problems occur in large programs. World Bank (2003) covered some of these issues in developing countries.
Preliminary version for comments: 3Please do not circulate without permission
occur at different rates for different reasons along different trajectories, generating considerable heterogeneity in the timing, sequencing, and mix of institutional forms that accompany each country’s path to (or encounter with) modernity. These different rates of change are also likely to be a considerable source of conflict. Even so, our framework explicitly eschews the assumptions and Hegelian teleology of classical modernization theory, with its presumptions of a common historical path culminating in convergent institutional forms; our concern, rather, is with enhancing institutional functioning (or performance levels), achieved via whatever means enjoys political legitimacy and cultural resonance in the contexts wherein such change is being undertaken. The conflation of institutional forms and functions, we argue, has been one of the most ubiquitous but pernicious mistakes of development policy over the last sixty years, and is manifest most clearly in widespread implementation failure.
In Section III we draw on three development vignettes from three different sectors and countries to define and document the empirical phenomena of what we call the “Big Stuck” –countries and sectors making no, or extremely slow, progress on key development indicators because of a weak organizational capability for policy implementation. These cases are then complemented by a comparative longer-run historical analysis of the actual changes that have occurred in the performance of the economy and the quality of public administration in selected countries; these general and country-specific trajectories, we contend, are a more realistic basis on which to build policy expectations regarding the capacity of developing countries (and especially post-conflict developing countries) to enhance their implementation effectiveness.
To explain the phenomena of the Big Stuck, we explore the theories of change that inform most contemporary development initiatives. To this end, Section IV outlines a framework comprising agents, organizations and systems, using it to show that the Big Stuck is the result of an alignment of the incentives of agents (leaders and front-line workers), organizations and systems that results in the phenomena of ‘isomorphic mimicry’ (DiMaggio and Powell 1983) as a sustainable, if not optimal, organizational strategy. Isomorphic mimicry means that organizations gain the legitimacy they need to survive by adopting the forms of other legitimate organizations without actually attaining their functionality. Agents of development inadvertently often promote and solidify isomorphic mimicry by rewarding organizations that adopt “modern” or “best practice” forms or notional policies even when these are not followed up by, or are even consistent with, actual functional performance in the context of a given organization’s actualcapability for policy implementation. Moreover, these carbon-copy organizations are then asked to perform tasks that are too complex and/or too burdensome, too soon. Premature load-bearing, in this sense, leads not only to real-time implementation failure but, by failing in this way, undermines the longer-term capacity to ever accomplish sustained reform and improved performance.
In Section V, we integrate the analytics and the empirics to lay out an alternative approach to development, which we call ‘the middle way’, and its implications for guiding the actions of development agents and organizations, elements of which are often the opposite of the current systemic arrangement. We conclude by considering some of the specific implications of our analysis for post-conflict developing countries.
Preliminary version for comments: 4Please do not circulate without permission
II. What is Development? Four Great Transformations (in the Functional Space)
In order to better understand and respond to implementation failure, it is instructive to start with a big-picture summary of what we think most people believe ‘development’ to be, and to then consider the ways in which policies and strategies have characteristically been pursued to bring it about. As it happens, we argue that in the last four decades a fundamental paradox has emerged at the heart of development theory and practice, which can be summed up in the expression that everyone and no-one believes in modernization.
This paradox becomes apparent when one considers that, by ‘development’, most people refer, implicitly or explicitly, to a cumulative process whereby economies grow through enhanced productivity3, prevailing political systems represent the aggregate preferences of citizens4, rights and opportunities are extended to all social groups5, and organizations function according to meritocratic standards and professional norms (thereby becoming capable of administering larger numbers of more complex tasks).6 In and through such processes, a given society undergoes a four-fold transformation in its functional capacity to manage its economy, polity, society and public administration, becoming, in time, ‘developed’ (see Figure 1).7 When in everyday speech people say that France is ‘more developed’ than Congo, they mean, inter alia, that France has undergone a four-fold functional transformation akin to that outlined above, and that the Congo has not. Or not yet. The central premise of the international development enterprise of course is that today’s ‘less developed’ countries can, should and eventually will undergo a four-fold transformation of their own, and that it is the task of development agencies (domestic and foreign) to accelerate it, to harness science and technology to ‘speed up’ a process
3 The classic definition here is that of Simon Kuznets (1966), who argued that modern (as opposed to non-modern) economic growth was a product of enhanced productivity (as opposed to, say, natural resource extraction). Thus even though Slovenia and Saudi Arabia have roughly comparable levels of per capita wealth, in the former it is a product of modern economic growth (‘development’) whereas in the latter it is result of exporting oil.4 Note that this may or may not manifest itself in a democracy. For our purposes, modern polities are polities that reflect the aggregate preferences of the population (whatever those preferences happen to be).5 That is, rights and opportunities are incrementally afforded to people irrespective of their race, health status, ethnicity, gender, religion or other social/demographic category. Thus Saudi Arabia and Indonesia, both predominantly Islamic counties, differ with respect to how modern their views are regarding the status of women.6 So understood, most of the vociferous critics of ‘development’ raise objections to the means by which (and/or through whom) it is brought about, not the ends as articulated here. Even when criticizing a focus on economic growth, most such critics are not calling for a return to a pre-industrial economy or pre-modern health care.7 As Figure 1 imperfectly shows, an additional feature of modernity is that it ‘separates’ these four realms into discrete entities, requiring people to move (seamlessly or otherwise) between qualitatively different roles as (say) consumer, citizen, employee and parishioner. This was the essence of Karl Polanyi’s (1944) classis thesis on the ‘great transformation’, in which he argued that, as a result of the development process, “the economy” became increasingly dis-embedded from “society” and both thereby became subject to a different set of rules, expectations and power relations. In many ‘pre-modern’ countries – i.e., those at the center of Figure 1 – these four realms remain essentially one and the same: religious, political, judicial and communal leadership is exercised as a single entity. A defining feature of modernity, on the other hand, is the separation of church and state, the separation of powers, of science and religion, of media and state (a ‘free press’), of knowledge into professional ‘disciplines’, etc., a process that has usually been accompanied by great conflict. This becomes relevant to implementation issues when one recognizes that many front-line staff in developing countries do not regard these realms (e.g., work and family; profession and tribe) as separate; put more formally, such staff reside simultaneously in multiple overlapping ‘epistemic communities’, each of which can make legitimate claims on their loyalty, time and resources. When witnessing the failure of staff to make these distinctions, however, foreign eyes often see only ‘corruption’ or other uncharitable behavioral characteristics.

Preliminary version for comments: 5Please do not circulate without permission
that, left to its own devices, would occur too slowly and thus result in needless suffering.Development agencies are structured on the premise that how these transformations unfold is known (or at least knowable) – that is, they believe, though they may not explicitly articulate it in such terms, that there is a common underlying structure characterizing these transformations –and that as such their primary objective is to facilitate (via the deployment of their resources and staff) this ongoing transformational process, the better to bring it about in a faster and/or more equitable manner. As befits a system believed to have oversight over a common underlying structure, professional skills acquired in a given development sector and setting (say, agricultural extension in Pakistan) are non-problematically regarded as being readily transferable to another(social development in Egypt)8.
• ADMINISTRATION• Rational,
professional organizations
• SOCIETY• Equal social
rights, opportunities
• POLITY• Accurate
preference aggregation
• ECONOMY• Enhanced
productivity
Rules Systems
Figure 1: Development as a four-fold modernization process
If everybody (explicitly or implicitly) believes that development entails the modernization of economic, political, social and administrative life, no-one (for all intents and purposes) now believes that modernization theory should be the paradigmatic basis on which any such four-fold transformation should be undertaken as a deliberate policy project. Put differently, it is rare to encounter anyone who currently believes, as both the hard right and hard left once did (and which thereby gave modernization theory such widespread potency in its prime9), that history is unfolding according to some inevitable Hegelian teleology, that the culmination of this process (capitalism, communism) will be a convergence of institutional forms, and thus that the fastest and most expedient route to modernity is to adopt the ‘forms’ of those countries further along
8 This belief is embodied in the overt policy of development agencies (such as the World Bank) to rotate their staffbetween sectors and countries on a regular basis (made manifest at the Bank in the so-called 3-5-7 rule, in which staff are to be minimally in place for three years, optimally for five and maximally for seven before moving on).9 The enduring power and resonance of Scott (1998) resides in large part on his documenting of how fully, in the middle decades of the twentieth century, both the political left/right and the global north/south bought into bureaucratic high-modernism as the preferred “scheme” for “improving the human condition”.

Preliminary version for comments: 6Please do not circulate without permission
this path. Development discourse is replete with aphorisms that ‘one size doesn’t fit all’, that ‘there are no silver bullets’ and that ‘context matters’. Development professionals are extraordinarily well traveled and are acutely conscious of, and actively celebrate, cultural difference. Most would surely endorse former World Bank president James Wolfensohn’s oft-repeated assertion that low-income countries “should be in the driver’s seat” when it comes to determining the content, direction and speed of their development policies.
Yet the logic of the broader structure of the international aid architecture and the core incentives faced by staff of the major development organizations largely conspire against local innovation and context-specific engagement.10 This system instead rewards those who manage large portfolios with minimal fuss (actual accomplishment of objectives being a second-order consideration), is resistant to rigorous evaluation (since such an exercise may empirically document outright failure, which cannot be ignored11) and focuses primarily on measuring inputs (as opposed to achieved outcomes). Moreover, the more difficult the country context and the more ambiguous the appropriate policy response, the stronger the incentive to legitimize one’s actions – to clients, colleagues and superiors – by deferring to what others deem to be ‘best practices’ and to assess one’s performance in accordance with measurable ‘indicators’, which again tend to be inputs (since, unlike outcomes, those can be controlled, managed and predicted in relatively unproblematic ways). Given that virtually all developing country contexts are, almost by definition, ‘complex’ and facing all manner of ‘needs’, the systemic incentive to identify ‘proven solutions’ and ‘tool kits’ is powerful; those who can provide them (or claim to provide them) – from microfinance and conditional cash transfers to malaria nets and ‘property rights’ – are development’s stars.
For present purposes, the alignment of the idea of development as a four-fold modernization process (of economy, polity, society and administration) and the business of development (as an industry structured to disseminate standardized solutions) culminates in, and is reinforced by, a theory of change that conspires against serious engagement with implementation issues. Putting both aspects together, this theory of change can be fairly characterized as “accelerated modernization via transplanted best practices”. In other words, the abiding theory of change that underpins the actions of most large development agencies, national and international, is one that seeks to modernize institutions by intensifying a process of reformvia the importing of methods and designs deemed effective elsewhere. Such an approach, we should acknowledge, can be entirely appropriate for those development problems that do indeed have a universal technical solution, where there genuinely is no need to “reinvent the wheel”. Effective low-cost vaccines should of course be made available to all. For many central aspectsof political, administrative and legal reform, however, and for the delivery of key public services (especially health and education, which require enormous numbers of discretionary face-to-face transactions12), reform via cut-and-paste from a foreign setting is no reform at all. In such instances, the wheel must be reinvented, each and every time. For Big Development, however, organizational imperatives overwhelmingly favor tackling problems, or those aspects of problems, that lend themselves to a technical, universal answer.
10 Indeed, our current international aid architecture is a direct creation of the high moment of modernization theory in the mid-twentieth century.11 On this point see Pritchett (2002).12 The details of this argument are conveyed in Pritchett and Woolcock (2004).

Preliminary version for comments: 7Please do not circulate without permission
Accelerated Modernization is the modus operandi of the dominant paradigm we might call Big Development. For at least the last four decades, however, a counter-narrative has long recognized many of these problems, arguing for similar development objectives but attaining them via alternative modalities.13 As the most famous expression of this approach puts it, ‘small is beautiful’; the entry point for effective development should not be grand plans designed by technocrats in capital cities but local initiatives that tap into context-specific knowledge – what Scott (1998) calls ‘metis’ – and that work incrementally to improve human welfare. For adherents of (what we might call) Small Development, a core principle is sustainability, the imperative to be able to continue functioning once external support is withdrawn.14 In principle, Small Development has much to commend it, but in terms of the framework of development outlined above – the four-fold modernization of economic, political, social and administrative life – it is hard to argue that it achieves this. Put differently, for all the many local successes that can doubtless be attributed to Small Development, few have scaled up to effect systemic change. Famous cases such as Grameen Bank, for example, have not fundamentally altered the financial system in Bangladesh, even as one can duly recognize the many accomplishments it has achieved for its members (and, by extension, for those people elsewhere in the world who have joined similar programs).15 (Alternatively, we could note that Grameen Bank achieves what it does precisely because it has figured out, unlike the government, how to run a large, effective and dispersed – but ultimately very modern – administrative apparatus to serve the rural poor.) We stress here that we are broadly supportive of what many of these types of programs are trying to accomplish; for present purposes, however, where our focus in on implementation issues and the emergence of modern institutions, Small Development typically falls short in that its net systemic transformation effects are often, well, small.
Both Big and Small Development, then, can do certain things well, but can also be complicit in long-run development stagnation. Before proceeding further with the analytical framework that underpins our explanation of (and positive response to) implementation failure, it is helpful to ground these discussions in concrete cases. In the following section, we provide three short instances of implementation failure in different sectors in different countries, and then, on the basis of the best available data, a comparative analysis of the trajectories in implementation capacity in selected countries. In Section IV we draw on both sources of evidence, and the analysis provided above, to outline an alternative framework for policy and program implementation in development.16
13 See Cowen and Shenton (1996) for a broader discussion on the various ‘doctrines of development’ that have influenced policy and practice.14 An excellent recent overview of the ‘sustainability doctrine’ is provided in Swidler and Watkins (2009).15 In this regard Bangladesh is actually an unusual but instructive case in the developing world, since the sheer number of Small Development actors (i.e., NGOs) in the context of a highly fragmented and compromised state, means that they comprise, in effect, the primary service delivery vehicle for the rural poor. The long-run development objective, however, must be to facilitate the emergence of a modern polity and administrative apparatus capable of delivering on what is its clear mandate. 16 Our approach throughout this paper is in the spirit of several recent papers stressing the importance of local innovation and context specificity is the design of effective organizations for development. See, among others, Rondinelli (1993) on ‘projects as policy experiments’, Grindle (2004, 2010) on ‘good enough governance’, van de Walle (2007) on ‘paths from neo-patrimonialism’, Rodrik (2008) on ‘second-best institutions’, Adler, Sage and Woolcock (2009) on the importance of ‘good struggles’ for political and legal reform, and Levy and Fukuyama (2010) on ‘just enough governance’.

Preliminary version for comments: 8Please do not circulate without permission
III.Assessing Implementation Failure: Case Study and Historical Evidence
A. (i) Education in India
In 1996 the Indian activist and economist Jean Dreze led a team of researchers to document the conditions of schools in selected states of India and produced the justly famous Public Report on Basic Education (PROBE), which documented in detail the very sorry state of teaching and learning of government provided basic education. One of the shocking figures to emerge was that, in the rural areas of the states they surveyed, absences among teachers were a staggering 48 percent. The government of India in 2001 launched the nation-wide Sarva Shiksha Abhiyan (SSA) program in which the central government provided support to states to improve the quality of government-produced primary education. Drawing on the government’s previous experiences with education initiatives and world-wide experts, the SSA expanded budgets for schools, infrastructure improvements, teacher hiring, teacher training and an array of other pedagogical improvements. As enrollments rates increased and many of the quantitative indicators of schooling improved, many regarded SSA as a major success. In 2008 PROBE went back into the field. They did find higher enrollments and many instances of better physical conditions. Their (still very preliminary) finding on teachers absence rates: 48 percent. Tracking the learning achievement nation-wide, district by district, the ASER exercise has found almost no systematic increases in the actual basic literacy and mathematics competencies children possess.
(ii) Public Financial Management in Mozambique
Mozambique emerged from conflict nearly two decades ago, and has effected far-reaching changes to its governance systems ever since. The country’s progress is impressive, reflected in multiple peaceful elections and transitions in top leadership, for example, and reforms to public financial management (PFM) processes that have resulted in a system which compares favorably with African peers. Mozambique’s PFM system comes out as stronger than all African countries apart from South Africa and Mauritius when assessed using the donor-defined criteria of good PFM, the Public Expenditure and Financial Accountability (PEFA) assessment framework (Andrews 2009). It has revised PFM laws and introduced a state-of-the art information system, e-sistafe, through which money now flows more efficiently than ever before.
But there are some problems, as reflected in the PEFA measures and in self-assessments by Government officials. Budget processes are strong and budget documents are exemplary, but execution largely remains a black box. Information about execution risks is poor, with deficiencies in internal controls and internal audit and in-year monitoring systems, and weak or unheard of reporting from service delivery units and the politically powerful and high-spending state owned enterprises. Perhaps unsurprisingly, there are many questions about the extent and quality of implementation of the new laws and systems – and of what really happens in the day-to-day functionality in the PFM system. The questions emerge most clearly when considering that PEFA indicators reflecting de jure changes in form average a B and PEFA dimensions reflecting de facto implementation and functional adjustment average a C. When asked about this, officials in line ministries, departments and agencies (MDAs) note that the new laws and systems are part of the problem. They may look impressive, but are often poorly fitted to the needs of the MDAs using them, requiring management capacities they do not have, institutionalizing organizational scripts and allocation modalities that reflect international best

Preliminary version for comments: 9Please do not circulate without permission
practice but not political and organizational realities on the ground. These officials note that they were never asked about the kind of system they needed, and while recognizing the impressive nature of the new PFM system they lament the missed opportunity to craft a system that works to solve their specific needs (Andrews, Grinsted, Nucifora and Selligman 2010).
(iii) Land Administration in Cambodia
In 2002, a major development initiative was undertaken in Cambodia to modernize land administration, a cornerstone of which was a rural land titling program. Enthusiastically supported by donors and the World Bank—who in turn were acting on a broad consensus regarding the importance of ‘property rights’ for encouraging the poor to invest in, and create a vibrant market for, land—the strategy underpinning the land titling project centered on first parceling up unambiguously public land (e.g., land in the middle of national forests) as a prelude to working incrementally towards titling land located in more contentious zones on the periphery. The project was dutifully overseen by a bona fide international land administration expert, and in its first years was hailed as a resounding success, with over a million titles dispersed. In September 2009, however, the project was cancelled amidst widespread acrimony and political protest, generating frustration and high-profile embarrassment for a host of development actors. The technical design of the project, as determined by an external review panel, was for the most part exemplary: the administrative and procedural issues associated with granting titles would be complemented by extensive investments in local NGOs, who would serve as intermediaries in contentious areas and help mediate disputes. Implementation of the project had worked fine, at least initially on the administrative and procedural fronts; given much less attention was the messier task of recruiting, training and working with the front-line NGOs to manage the tensions generated by the formalization (and/or the outright replacement) of previously informal arrangements regarding land tenure, and the ways in which this would challenge prevailing power relations, alter social identities and raise expectations.
What do these three cases in three different countries in three different sectors have in common? First, they all deal with functions widely regarded as core government responsibilities: governments must assume responsibility for basic education, governments must control their budgets and expenditures, governments must sustain systems of property rights and land management; there is no debate about whether governments have responsibilities for these tasks.17 Second, they are activities in which success in reaching objectives requires not just “good policy” but also transaction intensive policy implementation – student learning at a national scale requires millions of effective learner-teacher experiences every day, budgetary systems must handle millions of individual transactions, land titling requires resolving tens of thousands of decisions about claims (and counterclaims) on property. Third, they are all examples of attempts at promoting development through “accelerated modernization through transplanted best practice” which is the de facto, if not consciously articulated, mainstream
17 Governments, of course, do not necessarily have to provide education (or health care or energy), but in virtually all countries they are ultimately responsible for it assuring its provision at some minimal and coherent standard..

Preliminary version for comments: 10Please do not circulate without permission
strategy of governments, international organizations (e.g., the UN) and all major external assistance agencies (both bilateral and multi-lateral).18
B. Comparative Cross-National Evidence on Implementation Trajectories
The vignettes outlined above also exemplify, we argue, instances of implementation failure that are widespread in the developing world. In countries or sectors where this is a systemic problem – i.e., where there has been little or no progress on key development indicators over a long period of time – it is possible to argue that they are caught in an “administrative capability trap”, or in more popular language, a “Big Stuck”. But how can we assert that countries are caught in a “Big Stuck” or “capability trap” without any historical data that measures the evolution of capability? Actually, for those countries with a very low level of capability it is reasonable to argue that their current level nearly completely reveals their long-run dynamics. Current conditions are the result of the past.19
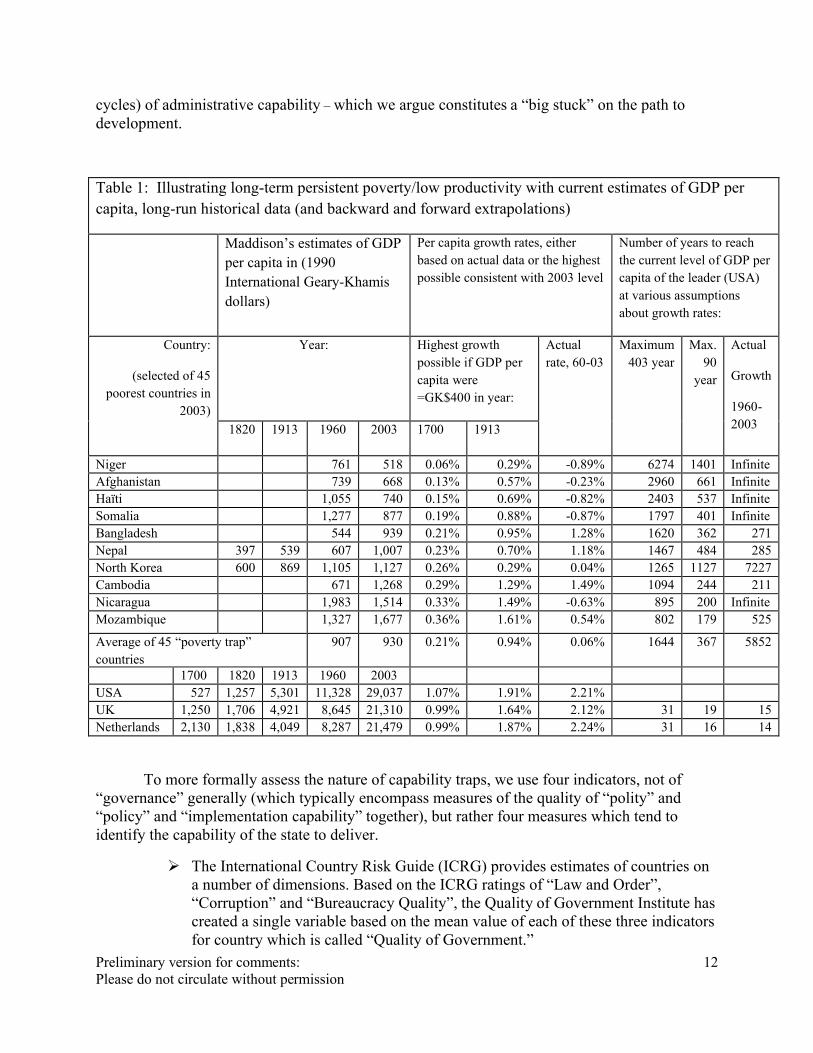
Before illustrating the Big Stuck in the space of state capability, let us illustrate it with a dimension of modernization for which there is very long historical series. The concept of “gross domestic product” – the total value added in a given territory (nation, province/state) – and standards to implement its measurement has facilitated a massive data compilation exercise. Estimates of GDP exist across nearly all countries of the world (made comparable through the use of purchasing power parity exchange rates) and over time (with inter-temporally comparable estimates for most countries since independence). Drawing on such methods, the economic historian Angus Maddison has created comparable estimate of GDP and population for many countries going back to 1700 (and earlier). Table 1 uses this data to illustrate three elements of a “poverty trap” by comparing the historical data of three rich countries (the Netherlands, the UK and the USA, each of which has been at one time a global leader) to the current (2003) GDP per capita of the 45 poorest countries.
First, many countries are today nearly as poor as today’s rich countries have ever been and much poorer than the richest country in the world (the Netherlands) over 400 years ago. The GDP per capita (in Geary-Khamis PPP adjusted current units) of the Netherlands in 1700 is estimated to be GK$2,130, which is less than half as high in Nepal and higher than the 45th
richest country, Mozambique.
Second, even without any historical data we know that the now-very-poor countries have had very slow growth rates. One can use a combination of the current measured level of GDP per capita and an estimate of how low GDP per capita could possibly be (in a roughly
18 We are of course keenly aware that key development indicators such as life expectancy, years of schooling and income have risen at historically unprecedented rates for many people in many poor countries. This we welcome and celebrate. Our concern here is with those intentional programmatic efforts to enhance human welfare that have clearly and repeatedly failed (in the manner of Scott 1998).19 Suppose you walked into a forest and discovered trees of various heights. You might think there is no way to know which trees grow fast and which grow slowly. But you can turn knowledge derived from a cross-section of trees into a defensible statement regarding long-run dynamics if you know a tree’s age and how tall it was as a seedling (zero). Since current height is the result of growth from zero to the current height during its lifetime you actually do know a tree’s cumulative growth rate: its growth rate from seed to today is the growth that led it to have the height it has today. Of course you do not know if the tree grew fast at first then slowed, or grew faster in wet years than dry years or anything about its future growth, but dynamics and current states are inextricably linked.

Preliminary version for comments: 11Please do not circulate without permission
demographically supportable, non-crisis, condition) and estimate the fastest growth could have been consistent with the current observed level. Maddison creates a somewhat conjectural estimate that the lowest GDP per capita has ever been is roughly GK$400 (which is consistent with the lowest observed levels in measured data and with his historical estimates of GDP per capita in A.D. 1). We use the assumption that in some starting year (either 1700 or 1913) each country had GDP per capita of GK$400. We can then calculate the fastest average growth rates could have been over the intervening years to 2003 (either 403 or 90) and be consistent with the observed GDP per capita in 2003. To illustrate, Nepal’s GDP per capita in 2003 was GK$1,007. Suppose Nepal’s GDP per capita was GK$400 in 1913 (so that there has been zero growth ever up to that point) and that all of the increase to 2003 happened from 1913 to 2003. In that case the upper bound on Nepal’s 90 year growth rate is: (1007/400)^(1/90)-1= .70%. The combination of the facts that the countries are so poor today and a lower bound on how poor a country could ever be (over an extended period) implies their long-run growth must be slow.
Third, estimates of the current GDP per capita of the leading countries demonstrate the achievable levels. Using either estimates of both the actual growth rates of the currently poor countries (from 1960 to 2003) or the most optimistic estimates of historical growth rates we can calculate how long it would take from the current country’s level to reach the leading country. So, again using Nepal as an illustration, its current GDPPC is GK$1007 and that of the USA is GK$29,037. How long will it take Nepal to reach the current level of the USA?20 At Nepal’s actual growth rate over the 43 years from 1960 to 2003 of 1.18% it would take 285 years; at its actual rate since 1913 it would take 484 years; at its maximum 403 year growth rate it would take 1467 years. This is the sense in which the national level “poverty” is also a “trap” – not necessarily an inevitable trap, but a possible trap: if their current growth persists it will take them a very long time to “modernize”. Since among these 45 countries actual growth to today wasvery slow, at those paces it would take nearly 6000 years for these countries to achieve the current US level.
This paper is not about economic growth; the above was just to illustrate two points. First, economists have developed models that rationalize the existence of poverty traps or long-term persistent poverty because the empirical data shows that many countries (nearly a third of the world’s countries) are in a situation such that their long-term historical and currently-observed growth rates are consistent with very extended periods of stagnation.21 Second, cross-sections are potentially rich with information about long-term dynamics, even if those are not observed, but this requires assumptions about where the upper and lower bounds of the feasible are, and about the time over which one assumes progress has been happening. With that, we can turn to the issue of “capability traps” – persistent stagnation (with perhaps upward and downward 20 Note that we are not asking how long it would take Nepal to “catch” the USA, as that would have to take into account future US growth and would hence be much longer.21 We want to be careful about the language of a “trap”, which is sometimes used to mean a situation of multiple equilibria, with a possible low and high stable equilibrium as opposed to a situation in which levels of income are driven to a unique equilibrium at a low level because of low “fundamentals.” We use “trap” only to mean a situation with very weak underlying dynamics pushing for an increase, whether that is a multiple equilibrium trap –as in Kraay and Raddatz (2007), who show that the standard formulations of multiple equilibrium traps in terms of savings and investment do not appear empirically plausible – or just a unique low level equilibrium (as in Collier et al (2003) on conflict, Bowles, Hoff and Durlauf (2006) on poverty, Bourguignon, Ferreira and Walton (2007) on inequality, and Sage and Woolcock (2008) on inequitable legal systems. Our distinction is just that there are no “natural” or “inevitable” pressures for improvement.
Preliminary version for comments: 12Please do not circulate without permission
cycles) of administrative capability – which we argue constitutes a “big stuck” on the path to development.
Table 1: Illustrating long-term persistent poverty/low productivity with current estimates of GDP per capita, long-run historical data (and backward and forward extrapolations)
Maddison’s estimates of GDP per capita in (1990 International Geary-Khamis dollars)
Per capita growth rates, either based on actual data or the highest possible consistent with 2003 level
Number of years to reach the current level of GDP per capita of the leader (USA) at various assumptions about growth rates:
Country:
(selected of 45 poorest countries in
2003)
Year: Highest growth possible if GDP per capita were =GK$400 in year:
Actual rate, 60-03
Maximum 403 year
Max. 90
year
Actual
Growth
1960-20031820 1913 1960 2003 1700 1913
Niger 761 518 0.06% 0.29% -0.89% 6274 1401 InfiniteAfghanistan 739 668 0.13% 0.57% -0.23% 2960 661 InfiniteHaïti 1,055 740 0.15% 0.69% -0.82% 2403 537 InfiniteSomalia 1,277 877 0.19% 0.88% -0.87% 1797 401 InfiniteBangladesh 544 939 0.21% 0.95% 1.28% 1620 362 271Nepal 397 539 607 1,007 0.23% 0.70% 1.18% 1467 484 285North Korea 600 869 1,105 1,127 0.26% 0.29% 0.04% 1265 1127 7227Cambodia 671 1,268 0.29% 1.29% 1.49% 1094 244 211Nicaragua 1,983 1,514 0.33% 1.49% -0.63% 895 200 InfiniteMozambique 1,327 1,677 0.36% 1.61% 0.54% 802 179 525
Average of 45 “poverty trap” countries
907 930 0.21% 0.94% 0.06% 1644 367 5852
1700 1820 1913 1960 2003USA 527 1,257 5,301 11,328 29,037 1.07% 1.91% 2.21%UK 1,250 1,706 4,921 8,645 21,310 0.99% 1.64% 2.12% 31 19 15Netherlands 2,130 1,838 4,049 8,287 21,479 0.99% 1.87% 2.24% 31 16 14
To more formally assess the nature of capability traps, we use four indicators, not of “governance” generally (which typically encompass measures of the quality of “polity” and “policy” and “implementation capability” together), but rather four measures which tend to identify the capability of the state to deliver.
The International Country Risk Guide (ICRG) provides estimates of countries on a number of dimensions. Based on the ICRG ratings of “Law and Order”, “Corruption” and “Bureaucracy Quality”, the Quality of Government Institute has created a single variable based on the mean value of each of these three indicators for country which is called “Quality of Government.”

Preliminary version for comments: 13Please do not circulate without permission
Kaufmann, Kraay and Mastruzzi (2009) (KKM) provide a technically sophisticated combination of an array of indicators into six components of governance: “Voice and Accountability”, “Political Stability and Absence of Violence”, “Government Effectiveness”, “Regulatory Quality”, “Rule of Law” and “Control of Corruption”, of which we use only the indicator of “Government Effectiveness.”
The “Failed Sate Index” (FSI) has 12 components but we use only their ranking of “Progressive Deterioration of Public Services”22 as an indicator of the capability of the government to not just maintain order but actually manage projects.
The Bertelsmann Transformation Index (BTI) another omnibus indicator of country progress from which we only use the indicator of “Resource Efficiency” which is based on three criteria of state performance23.
Each of these four we scale so that the worst country in the sample has a score of zero and the best has a score of 10. We choose these indicators as an attempt to focus on indicators of capability that are functional about state capability but at the same time are not either (a) prescriptively normative about what governments should be doing (e.g., a measure of the “rightness” of their policies), (b) a measure of outcomes or outputs, which depend on too many factors besides capability, or (c) omnibus indicators of “governance.” While the cross-national correlations are reasonably high, we report the results for each measure separately24.
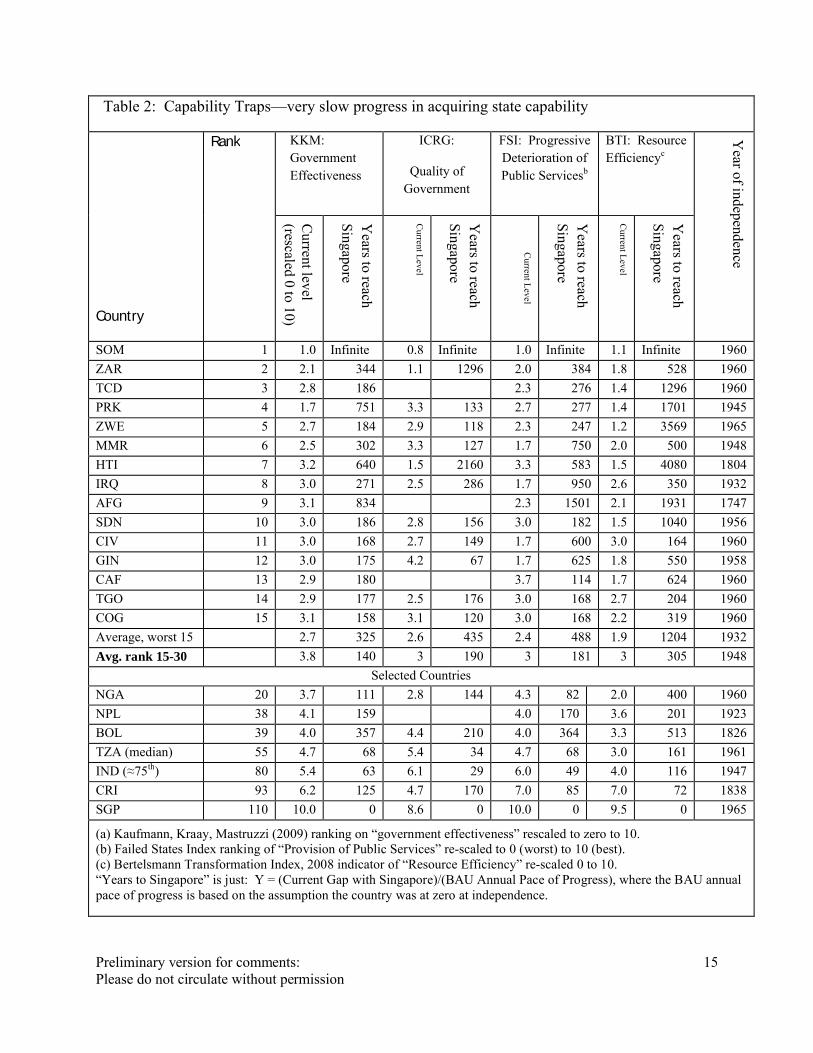
Table 2 shows the data and the results of a simple calculation of how long it would take each country to reach Singapore’s measured level of capability at an estimate of its long-run pace of progress. We turn the purely cross-sectional information into dynamics with an assumption about a minimum value and the duration of progress, as we did with GDP per capita. The fastest capability could have grown on average (again, saying nothing about shorter run dynamics and hence perhaps smoothing over periods of rapid increase, stagnation and decline) over the period of each country’s independence and be consistent with their existing observed level can be calculated by assuming the lowest it could have been. For that we assume that each country had Somalia’s current level of capability at independence. The estimated maximum annual pace of progress since independence is just arithmetically the country’s current capability less that of Somalia divided by the number of years since independence.
22 The description provided has two components: “Disappearance of basic state functions that serve the people, including failure to protect citizens from terrorism and violence and to provide essential services, such as health, education, sanitation, public transportation” and “State apparatus narrows to those agencies that serve the ruling elites, such as the security forces, presidential staff, central bank, diplomatic service, customs and collection agencies.”23 The description is “Government makes optimum use of available resources” with the three criteria: (1) To what extend does the government make efficient use of available economic and human resources? (2) To what extent can the government coordinate conflicting objectives into a coherent policy? and (3) To what extent can the government successfully contain corruption?24 The bi-variate correlations are: KKM GE with BTI RE .90, FSI PDS .82, ICRG QOG .83, ICRG with BTI RE .73, FSI PDS .72, BTI RE with FSI .75. If we suppose there are independent repeat measures of the same underlying “true” variable with equal magnitude of measurement error, then the bivariate correlation between these two variables is the same as the ratio of signal to signal plus pure measurement error in each. Bivariate correlations of .73 imply that either two variables are measuring different concepts well or the same concept with considerable imprecision (or both).

Preliminary version for comments: 14Please do not circulate without permission
)/()(Pr , IndepdenceSinceYearsCCCapabilityinogressRateAnnualMaximum SomaliaT
iT
iIndpedenceNow
As our major empirical point is that progress is glacially slow in many countries, this estimate of progress is biased against us as, if the country at independence had higher state capability than the complete lack of central government in Somalia – and many certainly did – then this estimate overstates progress. The only way this could understate the pace of change is if things were worse than Somalia which – given that Somalia is assessed as being substantially lower than demonstrably weak capability countries like Afghanistan, Iraq, Sudan, Dem. Rep. of Congo – we think is unlikely.
Using this optimistic estimate of long-run progress we can measure how many years it would take, at this pace, for the country to reach the level of capability reported in Singapore (which for two of the three indicators, Singapore achieves the maximum score). Since speed equals distance divided by time, the time required can be measured as distance divided by speed:
PaceAnnualCCSingaporereachtoYears iT
Singaporei /)(
This allows us to draw the dynamic implications of what we observe about state capability today. Of the 95 countries for which we have data on all three of these indicators we can see that there is a substantial fraction of states that are at extremely low levels of capability; if they continue their long-run trajectories they will attain high capability in centuries, if not millennia. Haiti, for example, gained its independence in 1804 and so has had 204 years to reach a level of KKM government effectiveness of 2.4 by 2008. To make it to Singapore’s level would require a gain of 7.6 points (to 10) and hence, at a progress of 2.4 points per 200 years, it willtake over 600 years to reach that level of capability. On the FSI deterioration of public services Haiti is only at .5 after 200 years so reaching 8.5 would require a gain of 8 points which at the business-as-usual pace would take over 4000 years. These are not predictions or even scenarios, just illustrative arithmetic.
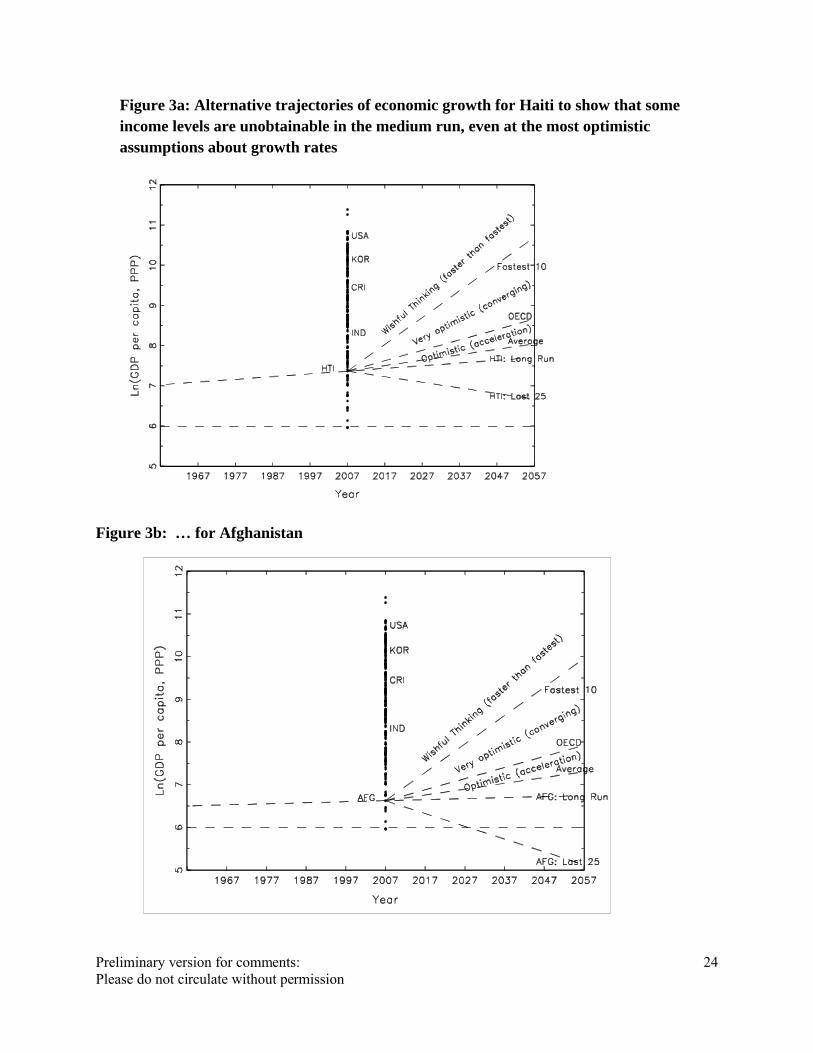
Figures 1a, 1b, 1c and 1d are the graphical counter-parts of the calculations in Table 2 that illustrate the calculations for Haiti. In each, the current distribution is illustrated at a point at the year 2008 with Somalia (the least), Singapore (the highest) and two cases of India and Costa Rica labeled for reference. The backward extrapolation that forms the moderate BAU pace going back to the date of independence and its forward extrapolation are shown. (By showing a line there is no implication this process was, or will be, a steady linear process). The graph covers 50 years before and after and shows that not only does Haiti not reach Singapore, but 50 years of its past pace do not suffice to teach even the level of capability of India (a country around the median on each indicator). Similar figures could be produced for any country by connecting the 2008 data for the country with a line that crosses the value for Somalia at the country’s date of independence.
Preliminary version for comments: 15Please do not circulate without permission
Table 2: Capability Traps—very slow progress in acquiring state capability
Country
Rank KKM: Government Effectiveness
ICRG:
Quality of Government
FSI: Progressive Deterioration of Public Servicesb
BTI: Resource Efficiencyc
Year of independence
Current level
(rescaled 0 to 10)
Years to reach
Singapore
Current L
evel
Years to reach
Singapore
Current L
evel
Years to reach
Singapore
Current L
evel
Years to reach
Singapore
SOM 1 1.0 Infinite 0.8 Infinite 1.0 Infinite 1.1 Infinite 1960
ZAR 2 2.1 344 1.1 1296 2.0 384 1.8 528 1960
TCD 3 2.8 186 2.3 276 1.4 1296 1960
PRK 4 1.7 751 3.3 133 2.7 277 1.4 1701 1945
ZWE 5 2.7 184 2.9 118 2.3 247 1.2 3569 1965
MMR 6 2.5 302 3.3 127 1.7 750 2.0 500 1948
HTI 7 3.2 640 1.5 2160 3.3 583 1.5 4080 1804
IRQ 8 3.0 271 2.5 286 1.7 950 2.6 350 1932
AFG 9 3.1 834 2.3 1501 2.1 1931 1747
SDN 10 3.0 186 2.8 156 3.0 182 1.5 1040 1956
CIV 11 3.0 168 2.7 149 1.7 600 3.0 164 1960
GIN 12 3.0 175 4.2 67 1.7 625 1.8 550 1958
CAF 13 2.9 180 3.7 114 1.7 624 1960
TGO 14 2.9 177 2.5 176 3.0 168 2.7 204 1960
COG 15 3.1 158 3.1 120 3.0 168 2.2 319 1960
Average, worst 15 2.7 325 2.6 435 2.4 488 1.9 1204 1932
Avg. rank 15-30 3.8 140 3 190 3 181 3 305 1948
Selected Countries
NGA 20 3.7 111 2.8 144 4.3 82 2.0 400 1960
NPL 38 4.1 159 4.0 170 3.6 201 1923
BOL 39 4.0 357 4.4 210 4.0 364 3.3 513 1826
TZA (median) 55 4.7 68 5.4 34 4.7 68 3.0 161 1961
IND (≈75th) (75thilepercentile)
80 5.4 63 6.1 29 6.0 49 4.0 116 1947
CRI 93 6.2 125 4.7 170 7.0 85 7.0 72 1838
SGP 110 10.0 0 8.6 0 10.0 0 9.5 0 1965
(a) Kaufmann, Kraay, Mastruzzi (2009) ranking on “government effectiveness” rescaled to zero to 10. (b) Failed States Index ranking of “Provision of Public Services” re-scaled to 0 (worst) to 10 (best). (c) Bertelsmann Transformation Index, 2008 indicator of “Resource Efficiency” re-scaled 0 to 10. “Years to Singapore” is just: Y = (Current Gap with Singapore)/(BAU Annual Pace of Progress), where the BAU annual pace of progress is based on the assumption the country was at zero at independence.

Preliminary version for comments: 16Please do not circulate without permission
Figure 1a: Slow evolution of state capability for Haiti: KKM Government effectiveness
Figure 1b: Slow evolution of state capability for Haiti: BTI Resource Efficiency
Figure 1c: Slow evolution of state capability in Haiti: FSI Progressive Deterioration of Services

Preliminary version for comments: 17Please do not circulate without permission
Figure 1d: Slow evolution of state capability in Haiti: ICRG “quality of government”
Given the method, countries that became independent more recently but at the same levels of capability are mechanically estimated to have had more rapid progress due to the assumption capability started at zero. Hence, although Republic of Congo is estimated to have lower KKM government effectiveness than Haiti, it is estimated to take only 159 years to reach high capability at optimistic BAU rates.
Preliminary version for comments: 18Please do not circulate without permission
These calculations illustrate the existence and even ubiquity of countries with weak capability and an apparently slow evolution of capability. While the existence of the egregiously weak or fragile states is widely acknowledged, even a country like Pakistan – which in 2008 (before much of the more recent unrest) was ranked 40th from the bottom – would take over 100 years to reach high capability on any of the three measures.
IV. How Does the Big Stuck stay Stuck?
To better understand and respond to this “capability trap” – countries progressing at a very slow pace in the expansion of state capability even in the modern world – we need better conceptual models. That is, it is obvious that the development of high levels of state capability we observe today in the rich countries took millennia to evolve, and there are major debates about the factors that initiated this sustained rise (e.g., Tilly 1990, Bayly 2004). But development thinking believed that modernization, once initiated and demonstrated as a possibility, would inevitably diffuse to all countries. Moreover, many countries are in the Big Stuck of low state capability in spite of both self-conscious efforts to accelerate modernization by domestic actors and wide scale (if not large) external assistance promoting development.
How do countries remain mired in a capability trap? While there are obviously many deep structural inter-related political, social and economic causes of why countries fail, we are interested in how countries fail, that is, in the techniques that allow and facilitate state failure in a “modern” world – including a modern world in which many agencies promote the expansion of state capability. When there has been a bank robbery one can ask why the bank was robbed25 –which may lead to as many reasons as robbers—but one can also ask how the bank was robbed. The mechanisms and techniques of bank robbery may be much more common and identifiable than the reasons. One technique that facilitates persistent failure is “isomorphic mimicry” – the ability of organizations to sustain legitimacy through the imitation of the forms of modern institutions without functionality26. Another is that external engagement can actively hinder the emergence of domestic, organically-evolved functional organizations, paradoxically, by pushing too hard and creating pre-mature load bearing so that stresses exceed capability. To account for these factors, we need a basic framework.
A. Agents, Organizations, Systems: A Framework of Isomorphic Mimicry
The dynamics of enacting a given project or policy can be construed as occurring within an ecological space comprising three constituent elements: agents (leaders, managers and front-line staff); organizations (firms, NGOs, line ministries); and systems (the broader administrative and political apparatus under whose jurisdiction the activity falls) (Figure 2)27.
25 The obvious explanation attributed to Sutton only explains why a bank was robbed not why a bank was robbed. 26 This concept and term draws on scholarship from the work of sociologists of organizations who describe isomorphic mimicry as an organizational strategy and discuss the types of mimicry—mimetic, normative, and coercive—each of which is in play in development. The classic references are Dimaggio and Powell (1983, 1991) with an accumulating body of evidence and theory since (e.g. ). 27 More colloquially, one might distinguish between crew, ship and ocean. The common aphorism lamenting the futility of “rearranging the deckchairs on the Titanic” alludes to a broader intuitive recognition that an accurate
Preliminary version for comments: 19Please do not circulate without permission
Such an ecological space is not static, but rather one that must engage with multiple, ongoing tensions (imperatives and incentives) that characterize this space and that either reward or inhibit innovation. Front-line workers, for example, have certain levels of training and experience (“capacity”), but their energy can be expended in mere compliance with rules28 or in seeking to work within the spirit of the rules to customize responses to the particular needs of clients. Similarly, the managers of front-line workers (“leaders”) can use the resources and rents over which they have responsibility to further their own purposes (“elite capture”) or to enhance broader wealth creation. For development to occur it is clearly preferable that such agents pursue the latter alternative, but whether or not they do is less a function of their individual talents and proclivities than the incentives they face and normative expectations that characterize their work environment.
Agents work within organizations, which in development usually means line ministries, NGOs, firms or international agencies. These organizations have actual or inferred administrative mandates to address particular sectoral issues, but the legitimacy of their actions –which often entail making hard trade-offs, bearing responsibility for controversial outcomes and continuing to function in difficult, uncertain and/or under-resourced circumstances – rests on two primary sources: demonstrated accomplishment (credibility and confidence is earned through providing services in a minimally effective and equitable manner) and/or appeal to an external structure and policies/programs that have been deemed to work elsewhere (we can legitimately perform this complex task in this way in this place because it seems to have achieved the desired result ‘over there’; these international experts have even declared it a “global best practice”).
The actions of agents are fundamentally concerned with upholding the legitimacy of their organization, but it is thus crucial which form this legitimacy – demonstrated accomplishment or mimicry – takes. If their organization’s legitimacy stems from accomplishment, agents will face incentives that reward innovation and ‘bureaucratic entrepreneurial’ behavior; if from mimicry, they will just follow the rules, even more so as conditions deteriorate and uncertainty rises. All this, of course, raises the question of the conditions under which a given organization’s legitimacy stems from accomplishment or mimicry. Our framework points to broader system characteristics, in particular its proclivity to require, recognize and reward novelty29. In a canonical open market system, for example, effective regulation and the quest for profit assessment of the actions of agents needs to be understood within the context of the interaction between the immediate organizational setting and the idiosyncrasies of the prevailing environment. If that environment is actually or potentially hostile (imminent large icebergs in freezing waters) and the organization, despite grand appearances, is critically vulnerable (iceberg detection systems are weak; ship will sink rapidly if punctured in the wrong place; too few lifeboats are on board), then their interaction places severe limits on the efficacy of particular actors (crew). The analogy is imperfect, but to better understand and learn from the specific event itself it is crucial to give attention to, and integrate, all three elements – different decisions by the crew (perhaps as a product of enhanced “capacity building” and “leadership”), a structure with fewer vulnerabilities or a more comprehensive emergency evacuation plan (“better technical design”, “good governance”), and a friendlier environment may well have averted disaster. But focusing on one element to the exclusion of the others, just because one happens to have a “tool” for addressing it, is unlikely to generate ecological-level learning that generates, over time, incrementally safer, cheaper, faster and more enjoyable ways of transporting passengers across the waters. 28 Or, in the case of certain forms of collective resistance, working exclusively in accordance with rules (e.g., ‘work to rule’ protests) and thereby bringing the organization to its knees.29 This discussion of “novelty” and its evaluation draws again on sociologists of organization who discuss how organizations (as a particular system itself) balance the need for “confirmatory” signals to generate organizational coherence and order with the need for “novelty” and means of evaluating novelty (Carlile and Lakhani)

Preliminary version for comments: 20Please do not circulate without permission
maximization does all three: it requires novelty (to develop superior products and services); it recognizes novelty (i.e., is able to distinguish genuine from trivial innovation); and it rewards it (compensation, prestige). Under the worst forms of socialism, at the other extreme, novelty was actively suppressed, with constituent organizations and agents acting almost entirely to uphold rules, and dealing with contingencies by creating yet more rules.30 Agents pretended to work and organizations pretended to pay them because that’s what the system’s characteristics decreed. It could perform certain tasks for a short time period, but was utterly inflexible. It collapsed.
Figure 2: Constituent Elements of an Ecology of Project/Policy Implementation
Understood as a process of sustaining processes of genuine innovation (‘creative destruction’), development is about moving the ecological equilibrium from the left to the right in figure 2. Put differently, ‘modernization’ is an ongoing process of encouraging diverse context-specific institutional forms, not convergence on or adoption of a single end-state, to accomplish agreed-upon institutional functions. Characteristically, however, responses to project/policy failure (or explanations of success, for that matter) focus only on individual elements of this ecology (capacity building for front-line staff, concern that ‘best practices’ aren’t being followed, etc) that are ‘legible’ to and actionable by external actors when it is the
30 This contrast is merely illustrative; for present purposes (and as we qualify in more detail below) we are notbrazenly claiming that all development systems would work better if only they adopted market principles. The point is that system characteristics, of all kinds, shape the actions of organizations and agents.
Space for
novelty
(E)Valuation of
novelty
Legitimation
Leadership
Front-line worker
use of capacity
Open
Functionality
Demonstrated
Success
Value Creation
Concerned
Flexibility
Closed
Agenda
Isomorphic
Rent Seeking/Re-
Compliance
Agents
(leaders, managers,
front-line workers)
Organizations
(firms, ministries, NGOs)
System Characteristics
Preliminary version for comments: 21Please do not circulate without permission
broader fitness environment of this ecology for its constituent elements that primarily shapes observed outcomes.
Some clarifications
Some key clarifications are in order before proceeding further. First, in expressing deep concerns about the dangers of isomorphic mimicry (or “institutional monocropping”, Evans 2004) and its associated quest for ‘global best practice’ solutions to development problems, we recognize that certain types of problems can and should be addressed in this manner. If a cure for cancer or a lost-cost procedure for desalinating water is ever invented, the more rapidly it can be made available to everyone, the better. Our concern, building on an earlier formulation (Pritchett and Woolcock 2004), is that for certain development problems the quest for the solution is itself the problem, and this is especially so in matters pertaining to political, legal and organizational reform, where combinations of high discretionary decision-making and numerous face-to-face transactions are required to craft supportable solutions (plural).
Second, in stressing the virtues of ecological learning and of encouraging multiple paths to high institutional performance, we are pushing back against – though not failing to appreciate the importance of – the Weberian ideal of a professionalized bureaucracy as the preferred mode of delivering core services. If Weberian organizations underpin modern economic and politicallife in high-income countries, isn’t this the goal to which low-income countries should aspire, and move as quickly as possible? If we know what effective organizations look like – if they constitute, in effect, a ‘global best practice’ – isn’t it just efficient, even ethically desirable, to introduce them as soon as possible? Has anyone actually ‘developed’ without them?
Our response to these concerns takes several forms. For starters, appearances can be deceiving. The education system in the Netherlands, for example, produces students who perform at (or slightly above) the OECD average, and from a distance the structure that presides over this may appear ‘Weberian’; closer scrutiny, however, reveals a system that is in many respects qualitatively different to its counterparts elsewhere in Europe and North America, in that it essentially funds students to attend a school of their choosing. That is, Dutch education is not a large, centralized, service-providing line ministry as it is elsewhere in the OECD, but rather a flat organizational structure that funds a highly decentralized ecology of different educational organizations. For present purposes we make no normative judgment as to which system is ‘better’; our key point is that high standards of education demonstrably can be attained by a system that varies significantly from the canonical Weberian ideal31. A similar argument emerges from a close examination of countries with high ‘governance’ scores (Andrews 2008). Far from having identical Weberian characteristics, the administrative structures that underpin such countries instead exhibit an extraordinary variety of organization forms, some of them classically Weberian but many of them significantly different (e.g., the relationship between
31 As we discuss in more detail below, how such a system emerged historically is crucial to understanding whether and how it can be adopted elsewhere. Put differently, even if the Dutch system produced the highest achieving students in the world, it’s not obvious that Chad and Uruguay should seek to import it. (Finland currently has the world’s highest achieving education system and as a result its ministry of education fields numerous visiting foreign delegations each year – to the point of distraction, according to some senior civil servants. While such visits clearly have their place, the idiosyncratic ecological and cultural context that underpins the Finnish system makes it unlikely that its organizational structures can attain equivalent results elsewhere, especially in the developing world.)

Preliminary version for comments: 22Please do not circulate without permission
banks and states in Japan versus the United Kingdom). Again, we make this point not to attack Weberian structures per se or to axiomatically celebrate alternatives, but rather to stress that the Weberian ideal isn’t inherently the gold standard to which everyone should aspire and against which alternatives should be assessed. In short, a variety of organizational forms can deliver similar institutional performance levels, just as identical organizational forms (as in the colonial period) can give rise to diverse performance levels. Finally, even in the most celebrated cases of Weberian effectiveness, such as Japan’s Ministry of International Trade and Industry (MITI) (Johnson 1982), it’s not clear that its effectiveness was achieved because of, or in spite of, its ‘Weberian-ness’.
The more vexing questions which our framework must confront center on strategies for recognizing and rewarding innovation in organizations that have a ‘natural’ monopoly (for whatever reason). There should only be one police force, for example, so pressures that may facilitate innovation in competitive markets cannot really be harnessed; we don’t want rival police forces. Similarly, for relatively routine (though clearly important) activities such as issuing drivers licenses, there’s likely to be a clear limit to how much innovation is actually desirable or possible. If the prevailing system works reasonably well, only the most marginal improvements need be sought. Another set of issues turn on the question of how to overcome the classic ‘Peter Principle’ problem: if organizations are inherently dysfunction because (a) everyone rises to their level of incompetence and (b) promotion turns on achieving yesterday’s core objectives rather than envisioning and realizing tomorrow’s innovation, how can this logic be broken? Finally, our framework must illuminate how genuinely useful innovative can be more reliably distinguished in real time from mere innovation for its own sake. Personal computers, for example, completely altered the world of computing, replacing mainframes as the dominant way in which everyday computing was conducted. At the time (1970s) it was not at all obvious that PCs were a superior technology, but they were (or would come to be). Within development agencies, one hears frequent reference to the quest for “cutting edge thinking”, but how can such agencies enhance the likelihood that PCs, rather than just new-and-improved mainframes, will emerge?32
B. Distinguishing Optimism from Wishful Thinking
Countries like South Korea have demonstrated that rapid development is possible in each of the dimensions of development. The fact that a country is poor today reveals much about its long-term pace of progress, but history is not destiny and a wide variety of countries have through domestically led initiatives seen rapid and sustained improvements in their polity, theiradministrative capability, their economy, and in their social relations. However, there are limits to how fast growth can be and attempting to drive growth faster than its sustainable pace can cause frictions, and social/political backlash. In the worst scenarios, attempts to push ahead too fast can actually create the conditions for failure. Is there an analogous upper-bound to optimism
32 The popular expression for generating qualitatively different ideas is “thinking outside the box” (manifest in Apple’s grammatically jarring tag line that it “thinks different”), but the problem remains: how can one more accurately discern in real time when such thinking is astute or foolish? The canonical venture capital model is to “let a thousand flowers bloom” and then let the market determine which approach is superior, but at the ecological level there may be little scope (or ethical space or political support) for such an approach in public organizations. There can surely only be so many ways to process passport applications, and governments can’t exactly outsource this activity (a matter of national security) to the private sector.
Preliminary version for comments: 23Please do not circulate without permission
of expectations in the pace of progress in expanding administrative capability? We would be the last to suggest that change agents should not be optimistic about the scope for change – many successes starting even in unpromising conditions demonstrate the possibility of success – but wishful thinking is unhelpful, and, as we suggest below, even potentially counter-productive.
As in section III.B above, we will start with data about GDP per capita, not because it is most important or the topic at hand, but because the data is there and is useful to show the approach and develop the intuition of how to calculate a maximally optimistic scenario.
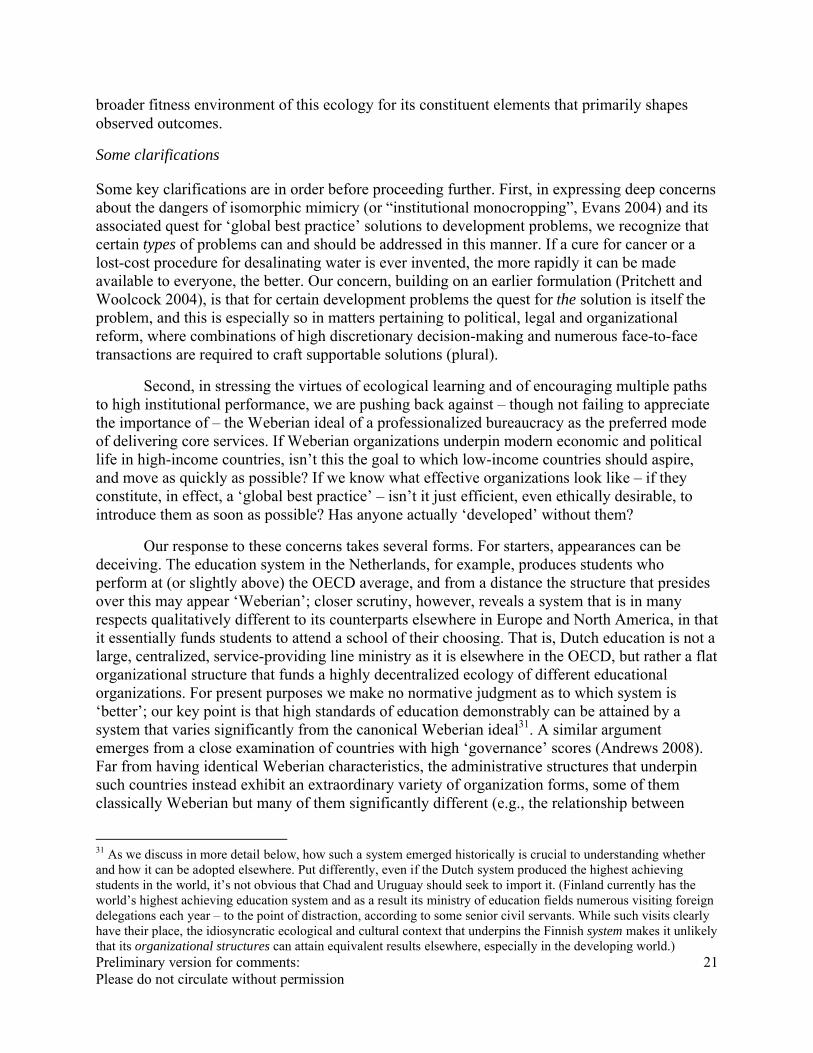
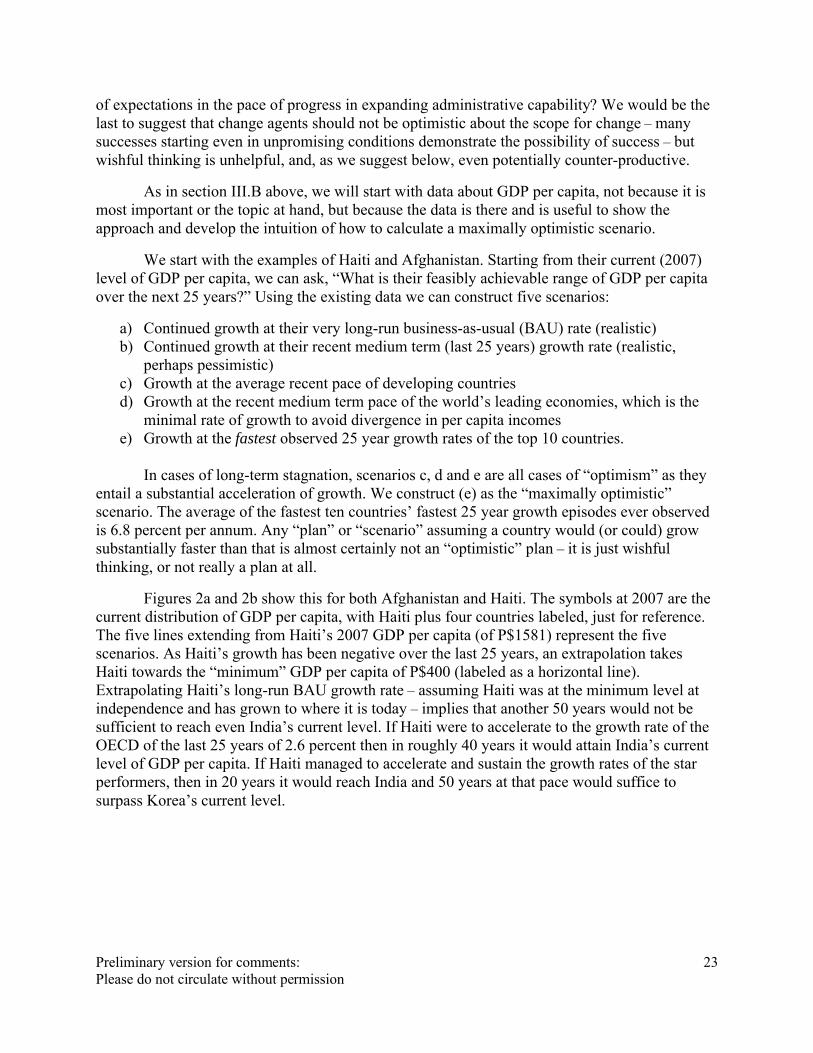
We start with the examples of Haiti and Afghanistan. Starting from their current (2007) level of GDP per capita, we can ask, “What is their feasibly achievable range of GDP per capita over the next 25 years?” Using the existing data we can construct five scenarios:
a) Continued growth at their very long-run business-as-usual (BAU) rate (realistic)b) Continued growth at their recent medium term (last 25 years) growth rate (realistic,
perhaps pessimistic)c) Growth at the average recent pace of developing countriesd) Growth at the recent medium term pace of the world’s leading economies, which is the
minimal rate of growth to avoid divergence in per capita incomese) Growth at the fastest observed 25 year growth rates of the top 10 countries.
In cases of long-term stagnation, scenarios c, d and e are all cases of “optimism” as they entail a substantial acceleration of growth. We construct (e) as the “maximally optimistic” scenario. The average of the fastest ten countries’ fastest 25 year growth episodes ever observed is 6.8 percent per annum. Any “plan” or “scenario” assuming a country would (or could) grow substantially faster than that is almost certainly not an “optimistic” plan – it is just wishful thinking, or not really a plan at all.
Figures 2a and 2b show this for both Afghanistan and Haiti. The symbols at 2007 are the current distribution of GDP per capita, with Haiti plus four countries labeled, just for reference. The five lines extending from Haiti’s 2007 GDP per capita (of P$1581) represent the five scenarios. As Haiti’s growth has been negative over the last 25 years, an extrapolation takes Haiti towards the “minimum” GDP per capita of P$400 (labeled as a horizontal line). Extrapolating Haiti’s long-run BAU growth rate – assuming Haiti was at the minimum level at independence and has grown to where it is today – implies that another 50 years would not be sufficient to reach even India’s current level. If Haiti were to accelerate to the growth rate of the OECD of the last 25 years of 2.6 percent then in roughly 40 years it would attain India’s current level of GDP per capita. If Haiti managed to accelerate and sustain the growth rates of the star performers, then in 20 years it would reach India and 50 years at that pace would suffice to surpass Korea’s current level.
Preliminary version for comments: 24Please do not circulate without permission
Figure 3a: Alternative trajectories of economic growth for Haiti to show that some income levels are unobtainable in the medium run, even at the most optimistic assumptions about growth rates
Figure 3b: … for Afghanistan

Preliminary version for comments: 25Please do not circulate without permission
But, the entire area of the graph to the north-east of the “fastest 10” scenario are levels of GDP per capita that almost certainly will not be attained, and to plan on reaching the level of GDP per capita of Costa Rica of P$ 11,830 in 25 years is just not in the cards. Reaching that level would require a per annum growth rate of GDP per capita of 8.4 percent. China’s fastest 25 year growth rate is 7.8 ppa, Japan’s fastest since 1950 is 7.9 ppa, Korea’s 6.8 ppa. Or, put another way, the average non-OECD growth rate is 1.3 percent with a standard deviation of 2.1.A growth rate of 8.4 is almost 3.5 standard deviations above the mean – essentially impossible, and certainly not a plan. Similar calculations apply to Afghanistan, where again the very long-run BAU is only slightly positive and the last 25 year is negative.
In short, such “expectations” regarding improvements in economic performance in Afghanistan and Haiti are just unrealistic – at some point expectations pass from optimism to wishful thinking. This is not to say that, because of their past growth trajectories, one should be pessimistic about their future growth. In fact, there is very little persistence in growth rates and so recent past growth does not predict future growth in general (Easterly, et. al. 1993). Moreover, it has been shown that growth accelerations to rapid growth are common, even from low or negative growth (Hausmann, Pritchett and Rodrik 2005).
As we noted above, these calculations are simply to show the intuition and calculations with one dimension of development (growth in productivity) where there is comparable data over long periods. We can use the same approach, however, to think about how rapidly countries can be expected to improve their implementation capability. The methodological issue is that there are not reliable, comparable measures of how “government capability for implementation” has evolved over time. This makes it very difficult to track progress or to anchor expectations. When this lack of measurement is combined with perfectly legitimate desires for accelerated expansion in capability to achieve important development targets and with comparisons to government capability in the now developed countries, the result can be wildly over-ambitious targets for government capability – and targets for what governments can therefore accomplish with that capability.
We use our four indicators of state capability to just illustrate (not demonstrate, not prove, not settle) that, even in the most optimistic scenarios, countries that lack state capability are likely to have low state capability in the future. That is, even if “fragile” or “failing” states begin to acquire capability at the most rapid pace observed by other countries, this still implies it will take decades or more to reach the government capability of even “weak” states and, even at the most rapid observed pace, half a century to reach the capability of the current developed countries or high capability countries like Singapore or Chile.
The major problem is lack of consistent measurement of anything like “state capability” over time. We address this problem in two ways. First, we have two indicators, the KKM indicator of ‘Government Effectiveness’ and the ICRG rating of ‘Quality of Government’ that do have at least a modest amount of coverage: 10 years (1998-2008) for KKM and up to 24 years for the ICRG quality of government (1994 to 2008). With these data we can calculate, in ways analogous to GDP per capita, the pace of progress of each country and then calculate the pace of progress of the N fastest improvers (in the graphs we choose N to be 20). For our other two indicators, the BTI ‘Resource Efficiency’ and FSI ‘Progressive Deterioration of Services’, we have only the levels. But for those countries we can also calculate the maximum pace of progress
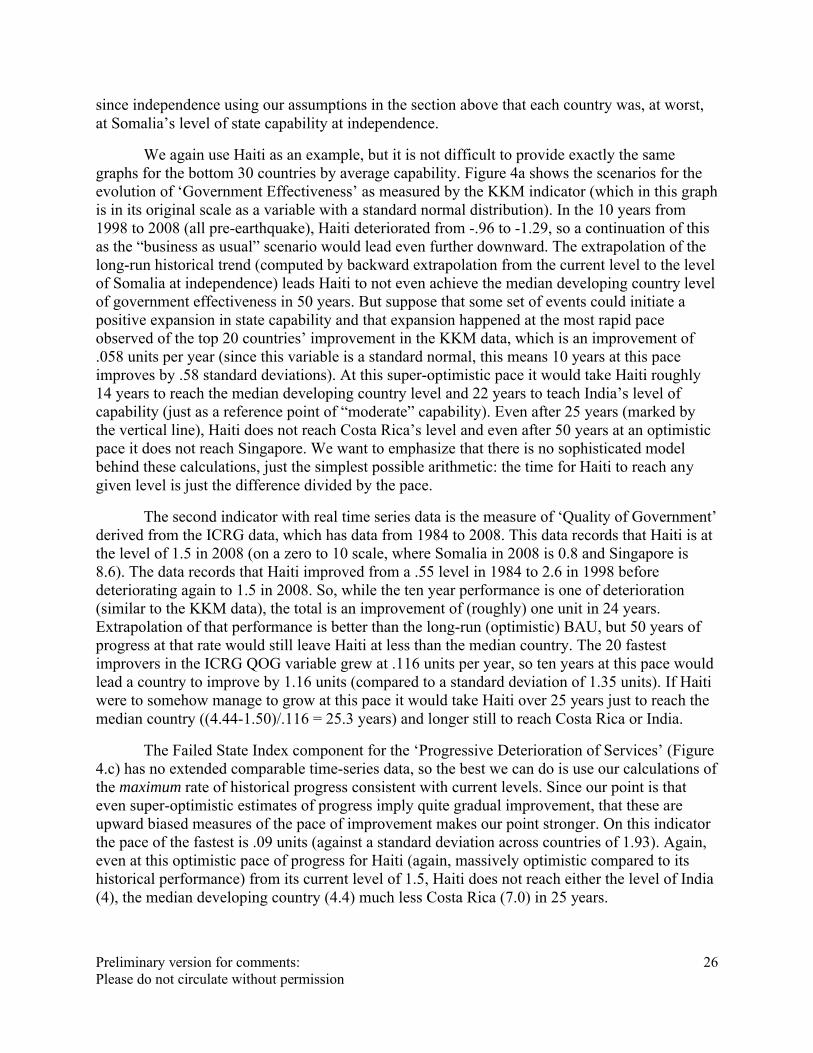
Preliminary version for comments: 26Please do not circulate without permission
since independence using our assumptions in the section above that each country was, at worst, at Somalia’s level of state capability at independence.
We again use Haiti as an example, but it is not difficult to provide exactly the same graphs for the bottom 30 countries by average capability. Figure 4a shows the scenarios for the evolution of ‘Government Effectiveness’ as measured by the KKM indicator (which in this graph is in its original scale as a variable with a standard normal distribution). In the 10 years from 1998 to 2008 (all pre-earthquake), Haiti deteriorated from -.96 to -1.29, so a continuation of this as the “business as usual” scenario would lead even further downward. The extrapolation of the long-run historical trend (computed by backward extrapolation from the current level to the level of Somalia at independence) leads Haiti to not even achieve the median developing country level of government effectiveness in 50 years. But suppose that some set of events could initiate a positive expansion in state capability and that expansion happened at the most rapid pace observed of the top 20 countries’ improvement in the KKM data, which is an improvement of .058 units per year (since this variable is a standard normal, this means 10 years at this pace improves by .58 standard deviations). At this super-optimistic pace it would take Haiti roughly 14 years to reach the median developing country level and 22 years to teach India’s level of capability (just as a reference point of “moderate” capability). Even after 25 years (marked by the vertical line), Haiti does not reach Costa Rica’s level and even after 50 years at an optimistic pace it does not reach Singapore. We want to emphasize that there is no sophisticated model behind these calculations, just the simplest possible arithmetic: the time for Haiti to reach any given level is just the difference divided by the pace.
The second indicator with real time series data is the measure of ‘Quality of Government’ derived from the ICRG data, which has data from 1984 to 2008. This data records that Haiti is at the level of 1.5 in 2008 (on a zero to 10 scale, where Somalia in 2008 is 0.8 and Singapore is 8.6). The data records that Haiti improved from a .55 level in 1984 to 2.6 in 1998 before deteriorating again to 1.5 in 2008. So, while the ten year performance is one of deterioration (similar to the KKM data), the total is an improvement of (roughly) one unit in 24 years. Extrapolation of that performance is better than the long-run (optimistic) BAU, but 50 years of progress at that rate would still leave Haiti at less than the median country. The 20 fastest improvers in the ICRG QOG variable grew at .116 units per year, so ten years at this pace would lead a country to improve by 1.16 units (compared to a standard deviation of 1.35 units). If Haiti were to somehow manage to grow at this pace it would take Haiti over 25 years just to reach the median country ((4.44-1.50)/.116 = 25.3 years) and longer still to reach Costa Rica or India.
The Failed State Index component for the ‘Progressive Deterioration of Services’ (Figure 4.c) has no extended comparable time-series data, so the best we can do is use our calculations of the maximum rate of historical progress consistent with current levels. Since our point is that even super-optimistic estimates of progress imply quite gradual improvement, that these are upward biased measures of the pace of improvement makes our point stronger. On this indicator the pace of the fastest is .09 units (against a standard deviation across countries of 1.93). Again, even at this optimistic pace of progress for Haiti (again, massively optimistic compared to its historical performance) from its current level of 1.5, Haiti does not reach either the level of India (4), the median developing country (4.4) much less Costa Rica (7.0) in 25 years.
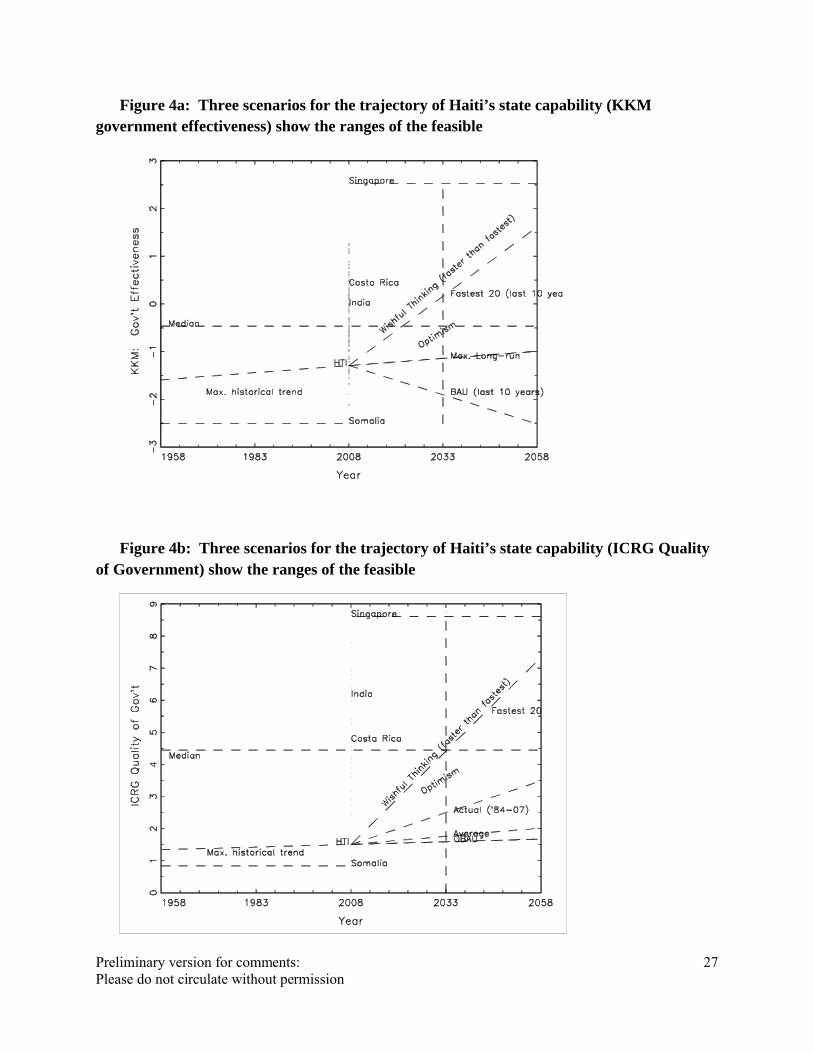
Preliminary version for comments: 27Please do not circulate without permission
Figure 4a: Three scenarios for the trajectory of Haiti’s state capability (KKM government effectiveness) show the ranges of the feasible
Figure 4b: Three scenarios for the trajectory of Haiti’s state capability (ICRG Quality of Government) show the ranges of the feasible
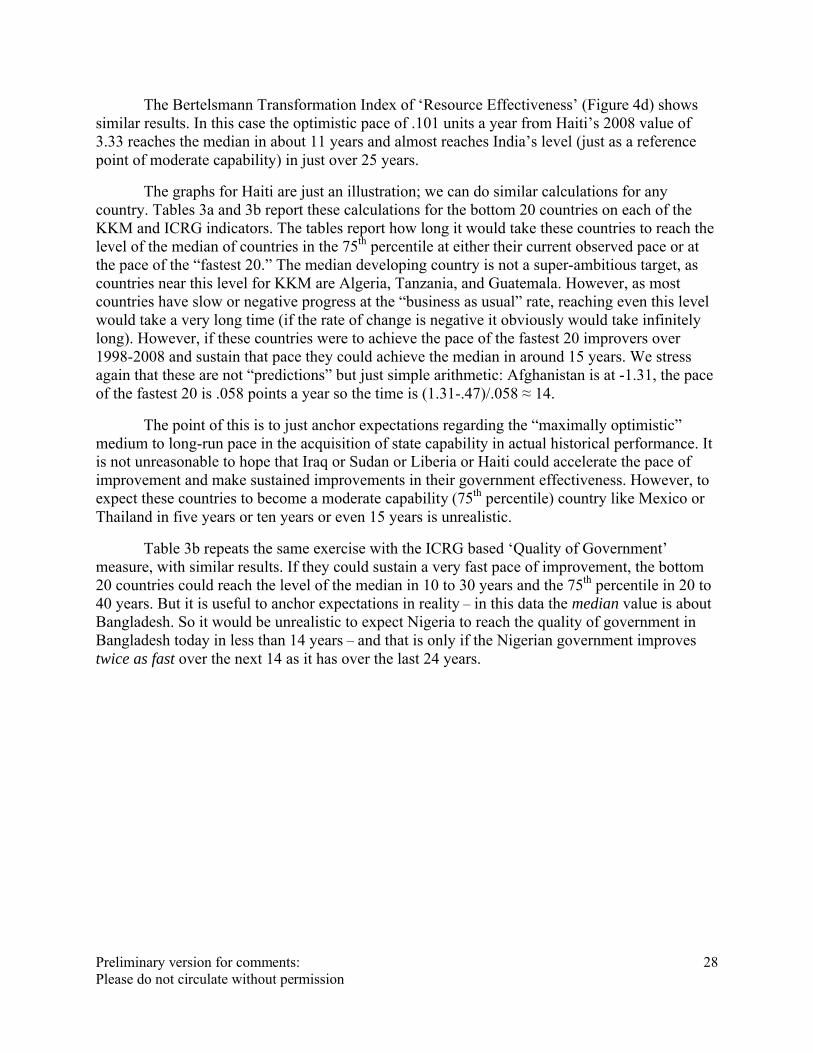
Preliminary version for comments: 28Please do not circulate without permission
The Bertelsmann Transformation Index of ‘Resource Effectiveness’ (Figure 4d) shows similar results. In this case the optimistic pace of .101 units a year from Haiti’s 2008 value of 3.33 reaches the median in about 11 years and almost reaches India’s level (just as a reference point of moderate capability) in just over 25 years.
The graphs for Haiti are just an illustration; we can do similar calculations for any country. Tables 3a and 3b report these calculations for the bottom 20 countries on each of the KKM and ICRG indicators. The tables report how long it would take these countries to reach the level of the median of countries in the 75th percentile at either their current observed pace or at the pace of the “fastest 20.” The median developing country is not a super-ambitious target, as countries near this level for KKM are Algeria, Tanzania, and Guatemala. However, as most countries have slow or negative progress at the “business as usual” rate, reaching even this level would take a very long time (if the rate of change is negative it obviously would take infinitely long). However, if these countries were to achieve the pace of the fastest 20 improvers over 1998-2008 and sustain that pace they could achieve the median in around 15 years. We stress again that these are not “predictions” but just simple arithmetic: Afghanistan is at -1.31, the pace of the fastest 20 is .058 points a year so the time is (1.31-.47)/.058 ≈ 14.
The point of this is to just anchor expectations regarding the “maximally optimistic” medium to long-run pace in the acquisition of state capability in actual historical performance. It is not unreasonable to hope that Iraq or Sudan or Liberia or Haiti could accelerate the pace of improvement and make sustained improvements in their government effectiveness. However, to expect these countries to become a moderate capability (75th percentile) country like Mexico or Thailand in five years or ten years or even 15 years is unrealistic.
Table 3b repeats the same exercise with the ICRG based ‘Quality of Government’ measure, with similar results. If they could sustain a very fast pace of improvement, the bottom 20 countries could reach the level of the median in 10 to 30 years and the 75th percentile in 20 to 40 years. But it is useful to anchor expectations in reality – in this data the median value is about Bangladesh. So it would be unrealistic to expect Nigeria to reach the quality of government in Bangladesh today in less than 14 years – and that is only if the Nigerian government improves twice as fast over the next 14 as it has over the last 24 years.

Preliminary version for comments: 29Please do not circulate without permission
Figure 4c: … scenarios for FSI Progressive Deterioration of Services
Figure 4c: … scenarios for BTI Resource Efficiency

Preliminary version for comments: 30Please do not circulate without permission
Table 3a: Years to achieve higher levels of capability using KKM ‘Government Effectiveness’: even at optimistic pace achieving acceptable levels will take time
Years to developing country median (-.467)(e.g. Algeria -.503, Tanzania -.451, Guatemala -.492)
Years to 75th percentile of developing countries (.114)(e.g. Mexico .176, Thailand .110, Kuwait .114)
Current Value(2008)
Recent pace of change (1998-2008)
Pace of fastest 20 (1998-2008)
Recent pace of change (1998-2008)
Pace of fastest 20 (1998-2008)
SOM -2.51 Infinity 33 Infinity 43PRK -2.12 Infinity 27 Infinity 36ZAR -1.89 265 23 373 33MMR -1.68 Infinity 20 Infinity 29ZWE -1.56 Infinity 18 Infinity 27TCD -1.48 Infinity 16 Infinity 26CAF -1.45 1074 16 1708 25TGO -1.43 Infinity 16 Infinity 25ERI -1.41 Infinity 15 Infinity 25SDN -1.41 Infinity 15 Infinity 25IRQ -1.41 17 15 28 25GIN -1.39 Infinity 15 Infinity 24CIV -1.39 Infinity 15 Infinity 24LBR -1.36 13 14 21 24COG -1.34 226 14 377 24AFG* -1.31 80 14 135 24HTI -1.29 Infinity 14 Infinity 24BDI -1.21 17 14 29 24
TKM -1.16 Infinity 14 Infinity 24SLE -1.13 15 14 27 24
* for Afghanistan recent growth is from 2002 to 2008.

Preliminary version for comments: 31Please do not circulate without permission
Table 3b: Years to achieve target levels of capability using ICRG-based ‘Quality of Government’ even at optimistic pace achieving acceptable levels will take time
Country Years to median (4.19)(e.g. Algeria 4.17, Bangladesh 4.44, Malawi 4.27)
Years to 75th percentile of developing countries (5.25)(e.g. Iran 5.00, Mexico 5.25, Indonesia 5.32)
Current (2008) Value
Recent pace of change (1984-2008)
Pace of fastest 20 (1984-2008)
Recent pace of change (1984-2008)
Pace of fastest 20 (1984-2008)
SOM 0.83 Infinity 32 Infinity 43ZAR 1.11 133 30 179 40HTI 1.50 68 26 95 36VEN 2.45 Infinity 17 Infinity 27IRQ 2.47 Infinity 17 Infinity 27TGO 2.50 Infinity 16 Infinity 27PRY 2.50 97 16 159 27CIV 2.73 Infinity 14 Infinity 24SLE 2.78 Infinity 14 Infinity 24LBR 2.78 31 14 54 24SDN 2.78 39 14 68 24NGA 2.78 26 14 46 24MLI 2.78 30 14 53 24ZWE 2.92 Infinity 12 Infinity 23COG 3.06 Infinity 11 Infinity 21YEM 3.06 Infinity 11 Infinity 21KEN 3.06 Infinity 11 Infinity 21NER 3.13 Infinity 10 Infinity 21GTM 3.17 16 10 33 20PRK 3.33 Infinity 8 Infinity 19
Before returning to the main flow of the argument about how persistent stagnation in the acquisition of state capability is possible, there is one technical question about the data on governance we have been using, which is whether these cross-sectional rankings of dimensions of state capability are truly comparable and are amenable to the comparison of growth rates. Each indicator has an essentially arbitrary scale which some might argue is more ordinal than cardinal (that is, only ranks are comparable not the levels) but the calculation of growth rates requires the scales be treated as cardinal. We address this concern by comparing all of the indicators in terms of two numbers. One uses only the range from Somalia to Singapore as the norm so that one can think of the changes in units as being increments of the Somalia to Singapore gap. Then, rather than comparing the raw growth rates of the various indicators (which are not comparable) one can ask: “At the calculated pace of change of the ‘fastest 20’,how long would it take to go from Somalia to Singapore?” The other way to change the growth rates to a comparable scale is to ask: “How many years does it take at the pace of the ‘fastest 20’ to move one standard deviation of the observed country distribution?”

Preliminary version for comments: 32Please do not circulate without permission
Table 4 shows that, irrespective of what the underlying properties of these measures are, they give quite similar results in estimating the pace of progress. Comparing the four measures on the “simulated” growth rates produces rates from Somalia to Singapore at the (maximum) pace of the fastest 20 countries of 87 (ICRG), 75 (KKM), 89 (BTI) and 93 (FSI) years. The years to move a standard deviation at the simulated fast pace are 15.3 (ICRG), 11.8 (KKM), 17.1 (BTI) and 21.3 (FSI). If we just compare the ICRG and KKM for which there are actual data (of 24 and 10 years respectively) the years at the fastest observed pace to move from Somalia to Singapore is 67 (ICRG) and 87 (KKM) years and the years to move a standard deviation 11.7 and 13.6. It does not appear that anything about the general findings of the pace of progress seems to critically hinge on the individual measures that we use.
Table 4: Comparisons of the estimated pace of progress in the four measures of “state capability” to each other and to GDP per capita
VariableICRG Quality of Government
KKM Government Effectiveness
BTI: Resource Efficiency
FSI: Prog. DeteriorationOf Services
AverageOf the four state capability measures
GDP per capita (ln)
Actual Simulated Actual Simulated Simulated Simulated ActualPace fastest 20 0.116 0.089 0.058 0.067 0.101 0.091 6.2%Range 7.78 7.78 5.04 5.04 9 8.4 4.57Years to traverse rangefrom Somalia to Singapore 67 87 87 75 89 93 83 74Standard Deviation 1.36 1.36 0.79 0.79 1.73 1.93 1.22Years to move one std. dev 11.7 15.3 13.6 11.8 17.1 21.3 15 19.6
One additional feature of Table 4 is that it compares the pace of growth in state capability and in GDP per capita, which one might think an odd, if not impossible, comparison as one is an arbitrary scale and one is a cardinal number that emerges from national accounting. But we can ask the same question: “If a country were to grow from Somalia’s level of income to Singapore’s level of income at the pace of the fastest 20 growing countries how long would it take to traverse this range?” The answer is 74 years, which only modestly slower than countries are predicted to traverse the range in state capability. Alternatively, if one asked “How many years of rapid growth are necessary to move ahead one standard deviation of the distribution of (natural log) income per capita?” the answer is 19.6 years, compared to only 15 to move across the standard deviation of the state capability indicators. So, while there are many caveats to be placed around any statement, there does not appear to be any systematic tendency to be “pessimistic” about progress in state capability or anything wired into the data that implies that state capability grows faster or slower than economic output per capita.

Preliminary version for comments: 33Please do not circulate without permission
C. Premature Load Bearing: Asking Too Much of Too Little Too Soon Too Often33
Wishful thinking pervades development assistance, perhaps particularly when it comes to state capability. The lack of empirical measures that have consistently tracked progress on a comparable basis across countries means that goals, plans and targets for improvement in “state capability” or “organizational capability” can be unhinged as they are not anchored in grounded expectations of the feasible. This is true when it comes to issues like “corruption” or “rule of law” about which people can easily imagine there are absolute standards and that deviation from these standards is not just unfortunate but normatively, even morally, unacceptable. This wishful thinking can also become pervasive when goals are set that require state capability (and resources) to accomplish and those goals are set without consideration of whether or not the capability exists, on the presumption that the capability can be created to accomplish goals relatively quickly (if resources and ‘political will’ are available)34.
Perhaps wishful thinking is a positive thing, in that even though the goals/plans/targets cannot be reached the striving for those targets creates more positive pressure and action than if there were no target at all or a less ambitious target. This is a central premise of the Millennium Development Goals, and certainly the popular literature on individual and organizational motivation is replete with sentiments such as “Reach for the moon; even if you miss you’ll land among the stars”.35 But there is at least a risk that pressuring countries to appear as if they are fully “modern” and take on difficult tasks before they have the capability to do so actually creates a negative dynamic in the evolution of capability. One can build the scaffolding of a bridge that looks almost exactly like a functional bridge – but if one confuses a scaffolding with a real bridge and attempts to drive a heavy truck over it, this pre-mature load bearing will cause the scaffolding to collapse, so that, rather than being in the first stages of bridge construction,one is actually back at square one.
The first step in this argument about pre-mature load bearing is to conceive of the “capability” of an organization not in a single dimension (high or low) but as a function that has two elements: capability under ideal conditions and the robustness of that capability to countervailing pressures. Figure 5 just illustrates two possible organizational capability frontiers. One organization has high capability under ideal conditions but is very fragile, such that under modest amounts of external stress to the organization the capability deteriorates very sharply (into complete dysfunction). A different type of organization might have low capability under ideal conditions – but can exercise that capability under a wide range of external stresses on the organization.
33 This section draws on Pritchett (2010).34 Clemens (2004) illustrates that meeting the MDGs on primary completion would have required a pace of progress far higher than any that had ever been observed – it will come as no surprise therefore that many countries will not reach the education MDG. 35 Even though this saying makes no sense at all.

Preliminary version for comments: 34Please do not circulate without permission
To the organizational capability frontier add “stress” on the agents of the organization,which is determined by the nature of the tasks they are asked to perform.
The easiest organizational examples to think of are how armies organize themselves to fight. The vertical axis is the damage they can inflict on the enemy while the horizontal axis would be the battlefield stress (both the “fog of war” as well as actions by the enemy). An army can be a “paper tiger” that looks good on the parade ground or in exercises but actually collapses under modest amounts of battlefield stress. On the other hand, some modes of organizing and training and commanding forces in battle can lead a force to be able to withstand enormous stress and yet not break under the pressure. The non-linear shape of the “capability frontiers” with respect to stress is a conjecture about how organizations respond to stress. Stress may either cause a more or less linear degradation in performance, but in many organizational situations in which one agent’s performance depends on many other agents’ performance around them (both in terms of their own behavior and its overall impact) there are “threshold” effects in which there are sustainable equilibrium of “full compliance” or “zero compliance” with a relatively sharp dividing line in between.
What is implementation stress and how do programs/policies create it? Public policy (or program) implementation is the process of agents of the state mapping from “states of the world” to actions. This involves both a declaration of the administratively relevant state of the world and an action based on that – two steps which may be separated or carried out by the same agent. Tax implementation is the declaration of the “state of the world” as a taxable amount (e.g. sales, income, dutiable import, property valuation) and a collection of the amount due according to a determination of the amount due given the taxable amount. Building code implementation is an assessment of the state of the world (e.g., Are the plans in compliance with the code? Is building proceeding according to the plans?) and actions based on those. Procurement implementation is
Organizational capability
Stress on agents of the organization
Figure 5: Organizational capability frontiers – maximum realizable capability (measured in functional performance) as a function of the stress on the agents of the organization – illustrate different possible combinations (e.g. high but fragile, low but robust)
Low Ideal Capability but Robust
High Ideal Capability but Fragile

Preliminary version for comments: 35Please do not circulate without permission
an assessment of the state of the world (Is this the best qualified bid according to the stipulated procedures?) followed by actions. All of government service delivery from the simplest logistical tasks like giving driver’s licenses to the complex operations of police forces to provide order and law are the result of agents of the state assessing the state of the world and acting on it.
Stress results when agents are put in states of the world in which there is a large divergence between what is in their best interest and what would comply with the policy/program and/or fulfill their organization’s stated purpose. Consider the example of implementing a customs code to collect taxes on imports. If the tariff is very high then the importer is willing to offer the customs collector (either individually or collectively) a higher side payment to avoid (or reduce) the tariff owed. Higher rates would entail greater stress. But it is not just that. The tariff code might make complex distinctions between goods which then have very different tariff rates or might create legal exemptions from tariffs based on intended use or importer. This makes collusion with importers easier as customs collectors can declare for administrative purposes states of the world that are very difficult to verify (e.g., certify that something is in an exempt category, or is really in one category rather than another similar but higher tariff category). So a low and uniform specific tax creates the least organizational stress while a high tariff, assessed on an ad valorem basis, with highly differentiated rates and complex available exemptions, creates massive stress.
These same considerations apply to the whole range of activities of the state, from policing to the justice system to public financial management to education to health to construction of infrastructure. Different tasks create different organizational stresses –inducements to deviate from the organizational goal appropriate action – depending on a variety of factors, including their complexity and how wide the gap is between the agent’s private interests and the organization’s in given states of the world. (Obviously the army analogy is again apt, as sometimes “stress” is at its maximum when soldiers are asked to risk their life.)
What happens when organizations undertake, or are mandated by law or policy to undertake, activities whose implementation creates higher levels of stress than the organizational capability can withstand? This can induce a rout – a collapse of organizational coherence and integrity, such that agents cease to exercise even what individual capacity they have to pursue the organization’s notional or stated goals. In fact, in some conditions the organizational collapse causes the organization to re-form and even solidify around alternative purposes. That is, bodies whose legal and official purpose it is to enforce regulation or collect taxes or educate children become organizations of revenue extraction. Unfortunately, revenue extraction is an organizational function which induces very little stress (as organizational goals and individual goals are in greater alignment) and organizations of very little capability in their stated purpose do have sufficient capability in this new organizational task.

Preliminary version for comments: 36Please do not circulate without permission
As noted above, we are discussing not the causes but the techniques of persistent implementation failure. As such, pre-mature load bearing is a technique whereby both governments and external assistance agencies of a variety of types can all appear to be actively engaged in convincingly “development” activities year after year while no cumulative progress is made. In the example in Figure 6 the country with low capability (both in “ideal” capability and in robustness) will putatively be attempting to implement a legitimate policy, one that would, if correctly implemented, lead to desirable outputs and outcomes. But in fact the organization will collapse and not be effective in implementation (inducing agents to undertake the correct actions in the appropriate states of the world). What makes pre-mature load bearing not just a technique for failure but a technique for persistent failure is that there are so many seemingly attractive options for responding to failure that will also fail while options that might work are unattractive.
When policies or programs fail because of implementation failure there are many good bad options:
Adopt a “better” policy. One obvious response to failure is to assume that the reason for failure was that the policy, if it had been implemented, would not have accomplished the objective anyway (as has been “learned” from other experiences) and hence failure requires a new policy. However, even if the new policy is demonstrably better (in the sense that when implemented it leads to better outcomes) if the new policy is equally (or more)organizationally stress-inducing in implementation, this will lead, after a number of intervening years, to failure.
Organizational capability (efficacy of policy implementation)
Organizational stress (pressure on agents to deviate)
Stress level induced by implementation of the technically optimal policy
Low MediumHigh
Figure 6: Organizational collapse under pre-mature load bearing

Preliminary version for comments: 37Please do not circulate without permission
Engage in “capacity building.” One attractive and obvious response to policy implementation failure is to assume that the problem was that the individual agents lacked “capacity” in the sense that they could not have implemented the policy even had they wanted to. This is nearly always plausible, as policy implementation requires agents to successfully recognize states of the world and know what to do in each instance (e.g., a nurse mandated to do community nutrition outreach has to be able to recognize a variety of symptoms and know which to treat, which to inform parents about how to respond, which to refer, etc). What could be a more obvious response of public sector failure in sector X (health, education, procurement, policing, regulation, justice) than to “train” health workers, teachers, procurement officers, policemen, regulators, lawyers – particularly as it will be demonstrably the case that “ideal capability” (i.e., the organizational capability if all individuals worked to capacity) is low?36 However, if the organization is under excessive stress due to the attempt to implement over-ambitious policies, the achievable increments to ideal capability may neither (i) augment the “robustness” of the organization and hence be irrelevant in practice nor (ii) shift the entire capacity frontier outward far enough to actuallyavoid the low level equilibrium. (In Figure 6 even substantial outward shifts in the “low” capability case would still lead to the equilibrium of zero implementation.)
Cocoon particular projects/programs/sectors. Another reaction to implementation failure, particularly when external assistance agencies (either donors or NGOs) are involved, is to succeed in “their” project in a low capability environment by creating parallel systems. These parallel systems come in many varieties, from project implementation units to “bottom up” channels in which funds are channeled directly to “communities.” The common difficulty with cocooning is that there is often no coherent plan as to how the cocooned success will scale to become the routine practice. In fact, the cocooned implementation modes are often so resource intensive (in either scarce human capital resources “donated” by NGOs or financial resources) that they are not scalable. Again, cocooning is a valuable technique of persistent failure as one can have long strings of demonstrably successful projects while a sector never improves.
Throw more resources into it. It is easy to see how ‘isomorphic mimicry” and premature load bearing make a powerful partnership. When governments are carrying out necessary and desirable goals (e.g., building roads, educating children, maintaining law and orders) and are doing so by pursuing demonstrably successful policies (that is, whose effectiveness as a mapping from inputs to outcomes has been shown to achieve results when implemented) andare doing so through isomorphic organizational structures (e.g., police forces or education ministries whose organizational charts and de jure operational manuals are identical to those in functional countries) then doubling down the bet seems the only viable strategy. After all, this is known to work: it works in Denmark. Because most places with low state capability also have low productivity and hence governments are working with few resources, it is hard to not believe that simply applying more resources to achieve good goals by implementing good policies through good organizations is not the obvious, if not only, strategy.
36 Moreover, as the development saying goes, “A project that gives a man a fish feeds him for a day, but a project to teach a man to fish lets you give your friend the technical assistance contract.”

Preliminary version for comments: 38Please do not circulate without permission
Not only are there many good bad options but some potentially good options are bad options.37
Scaling policies to the available implementation capability is often professionally and normatively unattractive.
Expanding capability in ways that are perhaps more “robust” but which do not expand the “ideal” are often decidedly unattractive to development actors who prefer the “modern” and technically state-of-the-art.
Attacking organizational failure is unattractive, as once an organization’s goals have been inverted to rent collection these are often subsequently capitalized into the political system in ways that eliminate potential constituencies for organizational “reform.”
V. Conclusion
There are multiple dimensions to “development”, one of which is the acquisition of administrative capability, which in the standard characterization of the modernization process is the acquisition of state capability.
While many have documented poverty traps, we document “capability traps” by turning current cross-national rankings of state capability for implementation into long-run dynamics by (a) benchmarking the minimum state capability at Somalia’s 2008 levels and (b) using country “age” to fix the period over which progress can have happened. This gives us the fastest rate at which capability can have improved since a country’s independence compatible with their current level. We show that, even at this optimistically estimated long-run pace, many countries would take centuries (if not millennia) to teach high levels of state capability.
The causes of the capability failure are complex and diverse and we do not pretend to explain why this failure occurs; rather, we focus on how. How do governments and countries manage to maintain persistent failure to acquire the capability to implement while at the same time engaging in domestic and international logics and rhetorics of “progress” and development? We discuss two techniques of persistent failure.
Isomorphic mimicry allows organizations (and states) to maintain legitimacy by adopting the forms of successful organizations and states even without their functions. Societal and institutional structures can create an ecosystem in which isomorphic mimicry is actually the optimal strategy for state organizations and, in consequence, their leaders and managers.
37 In separate work, Pritchett (2010) documents empirical instances of complete (and persistent) organizational dysfunction, drawing on research in a variety of sectors from health to education to the simple task of giving driver’s licenses. In their landmark study of attempting to improve the attendance of nurses in Rajasthan, Banerjee, Duflo, and Glennerster (2008) demonstrate the resilience of deep organizational failure. What is striking about these examples is that they all come from India, which is, on average across the four indicators we use of “state capability”, in the upper tier of developing countries.
Preliminary version for comments: 39Please do not circulate without permission
Pre-mature load bearing allows failure to exist while creating the illusion of implementing developmental policies and proves a robust technique of failure by providing many seemingly attractive options that allow failure to continue.
The next stage, “The Middle Way out of the Big Stuck” discusses ways to sabotage the techniques of failure38.
38 In the sense of Sparrow (2008) of sabotaging, which harms without eliminating at least one of their required components.

Preliminary version for comments: 40Please do not circulate without permission
References
Adler, Daniel, Caroline Sage and Michael Woolcock (2009) ‘Interim Institutions and the Development Process: Opening Spaces for Reform in Cambodia and Indonesia’ Working Paper No. 86, Brooks World Poverty Institute, University of Manchester
Andrews, Matthew (2008) “The Good Governance Agenda: Beyond Indicators without Theory” Oxford Development Studies 36(4): 379-407
Andrews, Matthew, Lant Pritchett and Michael Woolcock (2010) ‘The Middle Way out of the Big Stuck’ Mimeo
Andrews, Matt, Anne-Louise Grinstead, Antonio Nucifora and Renaud Saligmann (2010) ‘Mozambique’s PFM Reform Lessons’ Mimeo, World Bank Africa Region, PREM
Banerjee, Abjit, Esther Duflo and Rachael Glennerster (2008) ‘Putting a Band-Aid on a Corpse: Incentives for Nurses in the Indian Public Health Care System’ Journal of the European Economic Association 6(2-3): 487-500
Bayly, C.A. (2004) The Birth of the Modern World, 1780-1914: Global Connections and Comparisons Malden, MA: Blackwell
Bourguignon, Francois, Francisco H.G. Ferreira and Michael Walton (2007) ‘Equity, Efficiency and Inequality Traps: A Research Agenda’ Journal of Economic Inequality 5(2): 235-256
Bowles, Samuel, Karla Hoff and Steven Durlauf (eds.) (2006) Poverty Traps Princeton, NJ: Princeton University Press
Clemens, Michael (2004) ‘The Long Walk to School: International Education Goals in Historical Perspective’ Working Paper No. 37, Washington, DC: Center for Global Development
Collier, Paul et al (2003) Breaking the Conflict Trap New York: Oxford University Press
Cowen, M.P. and R.W. Shenton (1996) Doctrines of Development London: Routledge
DiMaggio, Paul and Walter W. Powell (1983) ‘The Iron Cage Revisited: Institutional Isomorphism and Collective Rationality in Organizational Fields’ American Sociological Review48(April): 137-160
Easterly, William, Michael Kremer, Lant Pritchett and Lawrence Summers (1993) ‘Good Policy or Good Luck? Country Growth Performance and Temporary Shocks’ Journal of Monetary Economics 32(3): 459-83
Preliminary version for comments: 41Please do not circulate without permission
Evans, Peter (2004) ‘Development as Institutional Change: The Pitfalls of Monocropping and the Potentials of Deliberation’ Studies in Comparative International Development 38(4): 30-52
Grindle, Merillee (2004) ‘Good Enough Governance: Poverty Reduction and Reform inDeveloping Countries’, Governance: An International Journal of Policy, Administration and Institutions 17: 525-48.
Grindle, Merillee (2010) ‘Social Policy in Development: Coherence and Cooperation in the Real World’ Background paper prepared for the The World Economic and Social Survey 2010
Haggard, Stephan, Andrew MacIntyre and Lydia Tiede (2008) ‘The Rule of Law and Economic Development’ Annual Review of Political Science 11: 205-34
Hausmann, Ricardo, Lant Pritchett and Dani Rodrik (2005) ‘Growth Accelerations’ Journal of Economic Growth 10(4): 303-29
Johnson, Chalmers (1982) MITI and the Japanese Miracle: The Growth of Industrial Policy, 1925-1975 Palo Alto, CA: Stanford University Press
Kaufmann, Daniel, Aart Kraay and Mastruzzi (2009) ‘Governance Matters VIII: Aggregate and Individual Governance Indicators for 1996-2008’ Policy Research Working Paper No. 4978, Washington, DC: The World Bank
Kraay, Aart and Claudio Raddatz (2007) ‘Poverty Traps, Aid and Growth’ Journal of Development Economics 82(2): 315-47
Kuznets, Simon (1966) Modern Economic Growth: Rate, Structure and Spread New Haven: Yale University Press
Levy, Brian and Francis Fukuyama (2010) ‘Development Strategies: Integrating Governance and Growth’ Policy Research Working Paper No. 5196, Washington, World Bank
Polanyi, Karl (1944) The Great Transformation Boston: Beacon Press
Pressman, Jeffrey L. and Aaron Wildavsky (1984) Implementation (3rd edition, expanded) Berkeley, CA: University of California Press
Pritchett, Lant (2002) ‘It Pays to be Ignorant: A Simple Political Economy of Rigorous Program Evaluation’ Policy Reform 5(4): 251–269
Pritchett, Lant (2010) ‘The Problem with Paper Tigers: Development Lessons from the Financial Crisis of 2008’, in Nancy Birdsall and Francis Fukuyama (eds.) New Ideas in Development after the Financial Crisis PUBLISHER
Pritchett, Lant and Michael Woolcock (2004) ‘Solutions when the Solution is the Problem: Arraying the Disarray in Development’ World Development 32(2): 191-212

Preliminary version for comments: 42Please do not circulate without permission
Rodrik, Dani (2008) ‘Second-Best Institutions’ American Economic Review: Papers and Proceedings 98(2): 100-104
Rondinelli, Dennis (1993) Development Projects as Policy Experiments: An Adaptive Approach to Development Administration New York: Routledge
van de Walle, Nicholas (2007) ‘The paths from neo-patrimonialism: democracy and clientelism in Africa today’ Cornell University, Center for International Studies, Working Paper No. 3-07
Sage, Caroline and Michael Woolcock (2008) ‘Breaking Legal Inequality Traps: New Approaches to Building Justice Systems for the Poor in Developing Countries’, in Anis Dani and Arjan de Han (eds.) Inclusive States: Social Policy and Structural Inequalities Washington, DC: The World Bank, pp. 369-393
Scott, James (1998) Seeing Like a State: How Certain Schemes to Improve the Human Condition Have Failed New Haven: Yale University Press
Sparrow, Malcolm K. (2008) The Character of Harms: Operational Challenges in Control New York: Cambridge University Press
Swidler, Ann and Susan Watkins (2009) ‘“Teach a Man to Fish”: The Sustainability Doctrine and its Social Consequences’ World Development 37(7): 1182-96
Tilly, Charles (1990) Coercion, Capital and European States, AD 90 -1992 London: Paradigm Publishers
Woolcock, Michael (2009) ‘Toward a Plurality of Methods in Project Evaluation: A Contextualized Approach to Understanding Impact Trajectories and Efficacy’ Journal of Development Effectiveness 1(1): 1-14
World Bank (2003) World Development Report 2004: Making Services Work for Poor PeopleNew York: Oxford University Press