canonical correlation partial least...
TRANSCRIPT

Canonical Correlation &
Partial Least Squares
How to relate two blocks of variables?
X ... Block of p variables
Y ... Block of q variables
p x n
q x n
We seek two linear combinations Xu and Yv so that
max Cor(Xu, Yv) Canonical Correlation Analysis u, v
max Cov(Xu, Yv) Partial least squares Analysis two-block plsu, v
u‘u = v‘v = 1
Low-dimensional representation of the pattern of correlations/covariances between two blocks of variables:
A second dimension can be computed as directionsorthogonal to the first ones, accounting for the second mostcorrelation/covariance.
A direction in each of the two data spaces, for which thecorrelation/covariance between them is a maximum.
PLS usually better interpretable than CCA
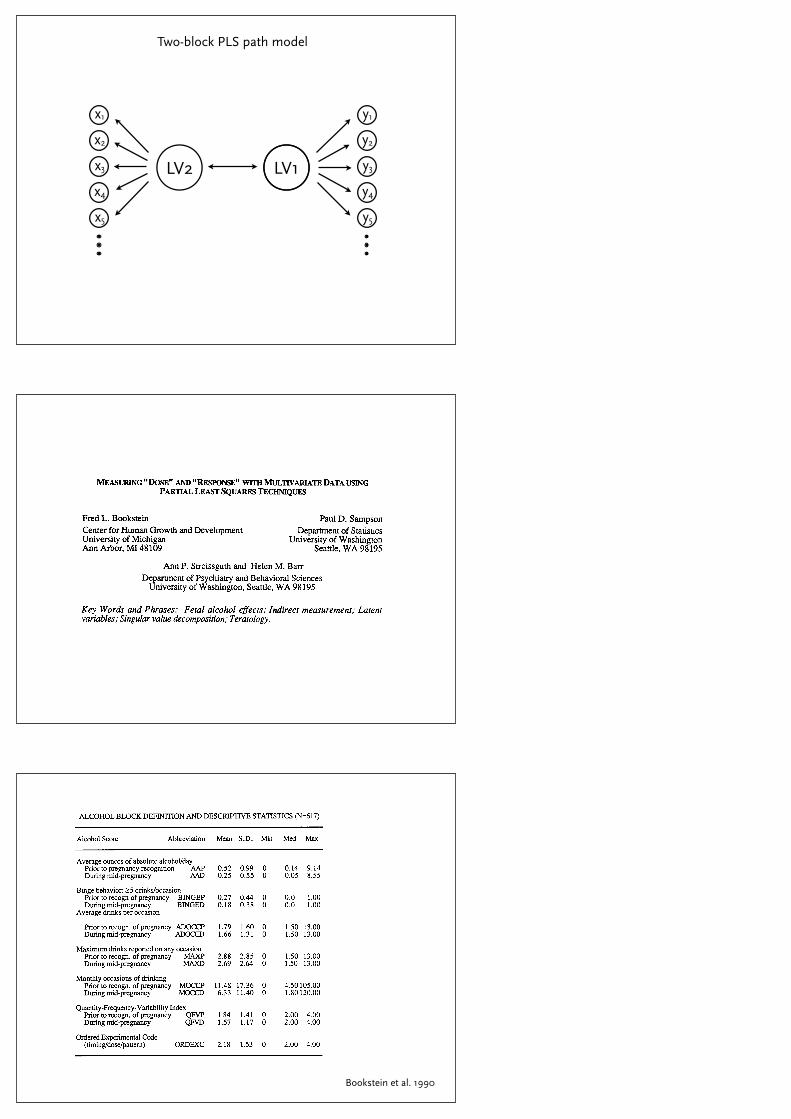
LV1LV2
x1
x2
x3
x4
x5
y1
y2
y3
y4
y5
Two-block PLS path model
COMMUN. STATIST. -THEORY METH. , 19(3), 765-804 (1990)
WURING "DOSE" AND 8 * R ~ ~ m ~ ~ w WITH MULTLVARIATE DATA USING PARTIAL LEAST SQUARES TECHNIQUES
Fred L. Bookstein Paul D. Sampson Center for Human Growth and Development Department of Statistics University of Michigan University of Washington Ann Arbor, MI 48 109 Seattle, WA 98 195
Ann P. Streissguth and Helen M. Barr Department of Psychiatry and Behavioral Sciences
University of Washington, Seattle, WA 98 195
Key Words and Phrases: Fetal alcohol effects; Indirect measurement; Latent variables; Singular value decomposition; Teratology.
Existing statistical methodology is weak in exploiting the multiplicity of measurement in complex uncontrolled human teratology studies of "dose" and "response". We describe a study of the neurobehavioral effects of moderate levels of prenatal alcohol exposure which examines 13 alternate measures of alcohol exposure (reflecting timing and variability of maternal alcohol consumption) with respect to hundreds of outcome measures over seven years of elapsed time. We demonstrate how one fundamental statistical tactic, the modeling of cross- correlation matrices by Partial Least Squares, has permitted us to address the problem of jointly studying dose and response in terms of the salience of alcohol exposure for the outcome measures and of the outcome deficits for estimation of dose. Using this technique we summarize the apparently distinct mechanisms of alcohol exposure (in regard to timing and variability of dose) with respect to 474 outcomes organized in 15 blocks of variables at 5 ages.
Copyright O 1990 by Marcel Dekker, Inc.
Downloaded By: [Universitat Wien] At: 13:30 26 June 2009
MEASURING DOSE AND RESPONSE WITH MULTIVARIATE DATA 769
TABLE I
ALCOHOL BLOCK DEFINITION AND DESCIUFTTVE STATISTICS (N=617)
Alcohol Score Abbreviation Mean S.D. Min Med Max
Average ounces of absolute alcohoVday Prior to pregnancy recognition AAP During mid-pregnancy AAD
Binge behavior: 25 drinksloccasion Prior to recogn of pregnancy BINGEP During mid-pregnancy BINGED
Average drinks per occasion
Prior to recogn. of pregnancy AMXCP During mid-pregnancy ADOCCD
Maximum drinks reported on any occasion Prior to recogn. of pregnancy MAXP During mid-pregnancy MAXD
Monthly occasions of drinking Prior to recogn. of pregnancy MOCCP During mid-pregnancy MOCCD
Quantity-Frequency-Variability Index Prior to recogn. of pregnancy QFVP During mid-pregnancy QFvD
Ordered Experimental Code (timing,dose/pattern) ORDEXC
AA is a continuous variable; AA21.00 = average of 22 drinks per day of wine, beer, liquor, or combination.
BINGE is a dichotomous variable representing whether or not 5 or more drinks were reported on at least one occasion..
AMXC represents the average number of drinks reported for any drinking occasion. MAX is the maximum number of drinks reported per drinking occasion. MOCC is the number of occasions per month in which drinking is reported. QFV is a three-dimensional categorical score (Quantity, Frequency, Variability) deriving from
Cahalan, et al. (1%9) reversed in order for consistency with the other drinking scales. ORDEXC is an a prion' code (Ordered Experimental Categories) developed at the outset of this
study (Streissguth et al. 1981) to describe the presumed risk to the fetus of different drinking patterns, in order to enroll women in the follow-up study.
P refers to the month or so prior to pregnancy recognition, D to drinking during mid-pregnancy, assessed at the 5th month of pregnancy.
Downloaded By: [Universitat Wien] At: 13:30 26 June 2009
Bookstein et al. 1990
780 BOOKSTEIN ET AL.
TABLE V
TWO-BLOCK PARTJAL LEAST SQUARES ANALYSIS OF ALCOHOL EXPOSURE SCORES AND IQ SUBTEST SCORES
A-s AAP -0.19 AAD -0.04 BINGEP -0.30 BINGED -0.32 ADOCCP -0.42 ADOCCD -0.35 MAXP -0.35 MAXD -0.29 MOCCP -0.06 MOCCD 0.12 QFvp -0.37 QFvD -0.27 ORDEXC -0.20
I 0 Subtest Saliences (WISC-R) Information 0.34 Similarities 0.35 Arithmetic 0.48 Vocabulary 0.20 Comprehension 0.2 1 Digit Span 0.42 Picture Completion 0.25 Picture Assembly 0.19 Block Design 0.39 Object Assembly 0.08 Coding 0.13
Surnrnarv: LV Covariance 1.02 Fraction of Squared Correlation Explained 0.88 LV Correlation 0.20
Note that the PLS factors computed do not necessarily bear any relation to principal components of the blocks considered separately. For instance, the first principal component of the IQ block weights the subscales of Verbal (and Performance) IQ nearly equally, but the PLS analysis selects primarily Digit Span and Arithmetic as expressing the dependence on alcohol. Table VI presents results of this PC analysis for contrasting with the IQ saliences Pi for the PLS analysis of Table V. PLS latent variables "explain" the cross-correlation matrix RAB in the sense just described; they are not computed to explain the within-block correlation matrices RAA and RBB as principal components do. This focus on cross-block correlation or prediction, together with the lack of assumptions on the structure of within-block correlations, distinguishes PLS analysis from the relatively better known "linear structural relations" modeling approach provided by the LISREL computer package (Joreskog and Sorbom, 1984); this comparison is dealt with at length in (Bookstein, 1986).
Downloaded By: [Universitat Wien] At: 13:30 26 June 2009
Bookstein et al. 1990
ARTICLE
Functional Morphology of the First CervicalVertebra in Humans and Nonhuman PrimatesEVELYN MANFREDA, PHILIPP MITTEROECKER,* FRED L. BOOKSTEIN, AND KATRIN SCHAEFER
The cervical vertebral column bears or balances the weight of the head supported by the nuchal muscles that partlyoriginate from the cervical vertebrae. The position of the head relative to the vertebral column, and consequentlylocomotion and posture behavior, could thus be associated with the form of the cervical vertebrae. In spite of thisassumption and some empirical indications along these lines, primate vertebral morphologies have been reported tobe very similar and not clearly related to locomotion. We therefore study the relationship between the morphology ofthe first cervical vertebra, the atlas, and the locomotion pattern within primates using a geometric morphometricapproach. Our analysis is based on a total of 116 vertebrae of adult Homo sapiens, Gorilla gorilla, Pan troglodytes,Pongo pygmaeus, Hylobates lar, Macaca mulatta, Papio hamadryas, Ateles geoffroyi, and Alouatta palliata. On eachatlas, 56 landmarks were digitized and superimposed by Procrustes registration. The resulting shape variables wereanalyzed by principal component analysis, multivariate regression, and partial least-squares analysis. We found thatthe nine primate species differ clearly in their atlas morphology and that allometric shape change is distinct betweenthe nonhuman primates and Homo sapiens. We could further identify morphological features that relate to thespecies’ locomotion pattern. Human atlas shape, however, cannot be predicted by an extrapolation of the nonhumanprimate model. This implies that either the primate atlas is generalized enough to allow bipedal locomotion or else thehuman atlas morphology is a unique adaptation different from that in the more orthograde nonhuman primates. AnatRec (Part B: New Anat) 289B:184–194, 2006. © 2006 Wiley-Liss, Inc.
KEY WORDS: anatomy; allometry; atlas; locomotion; primate evolution; Procrustes; vertebral morphology
INTRODUCTIONA major interest in primate evolution-ary morphology is the relationship be-tween locomotion and bony morphol-ogy in recent primates. Frequently,models of functional morphologyhave been used to infer positional be-havior in extinct taxa. Skeletal ele-
ments that are typically correlatedwith locomotion patterns are, for ex-ample, the hip bones, the limbs, andthe vertebral column (Baba, 1985;Hildebrand et al., 1985; Tuttle andWatts, 1985; Fleagle and Meldrum,1988; Gebo, 1993; Aiello and Dean,2002). Our understanding of vertebral
morphology is largely influenced byqualitative anatomical descriptionssuch as the classic studies of Schultzet al. (1961) and Ankel (1967, 1970,1972). Recent and quantitative studiesthat focus on specific vertebrae dealwith the lumbar vertebrae only, sothat relatively little is known about thefunctional morphology of the cervicalvertebrae.
The cervical spine bears less weightthan other parts of the body, but it stillbears or balances the weight of thehead. The nuchal muscles connect thecervical vertebrae with the occipitalpart of the cranium to enable the ac-tive movement of the head. The massand force of the nuchal muscles de-pend on the position of the head rela-tive to the vertebral column as well ason the weight of the head (Schulz,1942). Allometry, the effect of (body)size on shape, is therefore also ex-pected to account for some morpho-logical variation observed in cervicalvertebrae. Additionally, specific phy-
Dr. Manfreda has studied physical anthro-pology and medicine and is currently onthe medical faculty at the University ofDresden. Her scientific work is on primatefunctional anatomy, paleopathology, andchild and adolescent psychiatry.Dr. Mitteroecker has studied physical an-thropology at the University of Vienna,Austria, where he is working as lecturerand research assistant. His research in-cludes human evolution and development,geometric morphometrics, and theoreticaland behavioral biology.Dr. Bookstein is professor of anthropologyat the University of Vienna and professorof statistics and of psychiatry at the Uni-versity of Washington. His research inter-ests include methods for the statisticalanalysis of shape, diagnosis and progno-sis for birth defects due to fetal alcoholexposure, evolution of Homo sapiens, and
history and philosophy of biological sci-ence.Dr. Schaefer received a PhD from the Uni-versity of Vienna, where she is an associ-ate professor in the Department of An-thropology. Her present research interestis the biology and psychology of humanshape variation.Manfreda and Mitteroecker contributedequally to this work.*Correspondence to: Philipp Mitteroecker,Department of Anthropology, University ofVienna, Althanstrasse 14, 1091 Vienna,Austria. Fax: 43-1-4277-9547. E-mail:[email protected]
DOI 10.1002/ar.b.20113Published online in Wiley InterScience(www.interscience.wiley.com).
THE ANATOMICAL RECORD (PART B: NEW ANAT.) 289B:184–194, 2006
© 2006 Wiley-Liss, Inc.
atlas shape is similar to, or is an extrap-olation of, the more erect primate taxaalong these dimensions.
As several previous studies on atlas
morphology focused on the shape ofthe superior articular facets, specifi-cally their convexity, we measure theangle in space between the two trian-
gles of landmarks covering the facets(see the gray lines in Fig. 1). We aver-age the angles for the left and rightfacets on each atlas and subsequentlyaverage those for each species.
RESULTSSpecies DifferencesFigure 2 presents the results of theprincipal component (PC) analysis ofthe Procrustes shape coordinates (rel-ative warps). The first PC explains ap-proximately 16% of total shape varia-tion and the second 13%. Apparently,the species form distinct clusters that(except for Pongo and Gorilla) onlymarginally overlap in the first two
Figure 2. PC scores of the Procrustes shape coordinates. The two series of atlas surfacerepresentations are deformations of the average shape (the two middle shapes) along thefirst and second PC, respectively. The shapes correspond to their positions along the axes atwhich they are drawn.
Figure 3. Separate principal componentanalysis of Gorilla and Pongo. The legendsfor this and the subsequent figures are as inFigure 2.
Figure 1. Cranial (a) and caudal (b) views of a human atlas. c: All 116 superimposed landmark configurations. d: Surface visualization ofthe average atlas shape in our sample, showing the major anatomical structures that are visible in a cranial view. The two atlantocranialarticular surfaces are drawn in dark gray.
188 THE ANATOMICAL RECORD (PART B: NEW ANAT.) ARTICLE
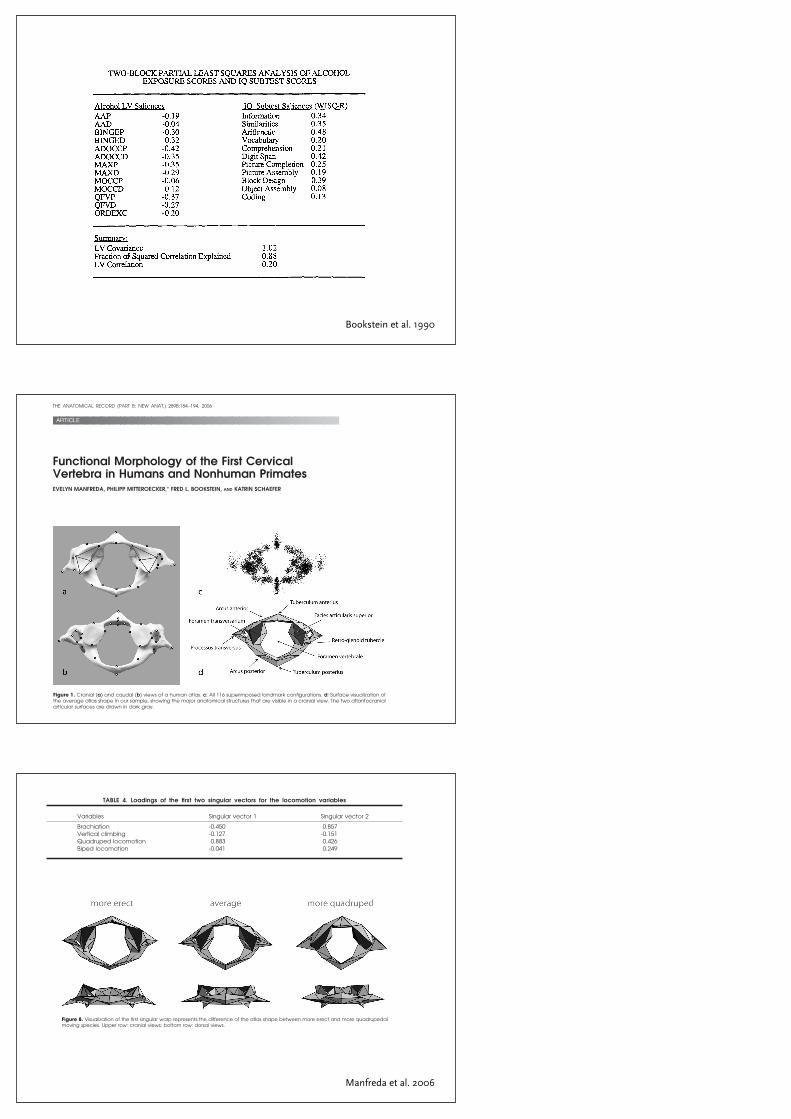
the difference between more uprightand more quadruped moving nonhu-man primate species. Figure 8 visual-izes the corresponding shape differ-ences as predicted by the loadings ofthe first singular vector for the shapevariables. The middle column of thatfigure shows the average atlas shapefrom a cranial (top) and a dorsal view(bottom). The left shape corresponds toan atlas of a more erect primate, whilethe right atlas is representing a quadru-ped species. (We scale these differencesover three standard deviations to easethe visual interpretation.) Within non-human primates, the shape featuresthat are associated with high scoresalong the first singular warp, and thatthus correspond to a more quadrupedlocomotion, include increased robust-ness of the atlas, a pronounced tuber-culum posterius, and a relativelysmaller foramen vertebrale. The proces-sus transversus is inclined more dor-sally and cranially, and the facies ar-ticularis superior is less curved andmore transversally oriented.
DISCUSSIONIn her extensive work on comparativevertebral anatomy, Ankel concludedthat, in general, vertebral morphologyis relatively similar among primates
and not clearly related to locomotion.Our geometric morphometric analysisfinds that Ankel’s statements do nothold for the primate atlas. The PCAsin Figures 2 and 3 unequivocally dem-onstrate that the atlas shapes of eachspecies form distinct, mainly nonover-lapping, clusters. For nonhuman pri-mates, we could also identify shapedeformations that relate to locomo-tion. We found that the locomotionpattern that most strongly covarieswith atlas shape is the gradient fromquadrupedalism to a more erect loco-motion (Figs. 6–8). For more ortho-grade species, the associated shapefeatures are a relatively thinner ante-rior and posterior arcus, a more ven-trally and caudally oriented processustransversus, and a more inclined andlaterally rounded facies articularis su-perior. It is noteworthy that boththese sets of patterns, that for locomo-tion variables and that for shape vari-ables, were not a priori selected butare those that exhibit the highest mu-tual predictive power; they are the la-tent variables as calculated by the PLSalgorithm. It is thus a finding, not anassumption, that it is the gradient be-tween more erect and more quadrupe-dal locmotion that best covaries withatlas shape. This result stays stableeven when using slightly different sets
of locomotion variables or landmarksin the PLS analysis (results notshown). It might change if posturalvariables are included (Dagosto andGebo, 1998), but these are not atpresent available from the literature.
Our findings on atlas morphologyand locomotion concur with the morerecent literature on the functional mor-phology of lumbar vertebrae (Rose,1974; Swindler and Wood, 1982; Sha-piro, 1993, 1995; Ward, 1993; Johnsonand Shapiro, 1998; Sanders, 1998; Sha-piro and Simons, 2002; Martelli andSchmid, 2003; Nakatsukasa and Hi-rose, 2003; Shapiro et al., 2005). Theseauthors could identify shape differ-ences in the vertebrae among severalprimate species and explain some ofthem as responsive to locomotion. Also,and in spite of her contradictory gener-alization, Ankel (1967) described differ-ences in the angulation of the dens andthe superior articular facets of the axisamong humans and other primates.
As observed by other authors (Olivier,1964; Gommery, 1996, 1997; Aiello andDean, 2002), we also find species differ-ences in the concavity of the superiorarticular facets (Table 1). Humans ex-hibit flatter (less concave) facets thanapes or baboons. But it is unclear fromour data whether the concavity of thefacets directly relates to locomotion.Gorilla and Pan, both mainly quadrupe-dal, also possess relatively flat facets,while Ateles, a frequently brachiatingspecies, has strongly concave articularfacets.
Figure 5 displayed the overall atlasshape differences that owe to evolu-tionary (cross-taxon) and static (with-in-taxon) allometry. In either, the at-las, especially its arcus posterior,becomes more robust with size andthe processus transversus more crani-ally inclined. Nonhuman static allom-etry also involves an elongation of thelateral processus. Additionally, weperformed these shape regressions on
Figure 6. The first two latent variable (LV) scores for the locomotion variables. LV 1 distin-guishes between more erect (left side) and more quadrupedal (right side) locomotion,whereas LV 2 approximately contrasts brachiation and vertical climbing.
TABLE 4. Loadings of the first two singular vectors for the locomotion variables
Variables Singular vector 1 Singular vector 2
Brachiation -0.450 0.857Vertical climbing -0.127 -0.151Quadruped locomotion 0.883 0.426Biped locomotion -0.041 0.249
ARTICLE THE ANATOMICAL RECORD (PART B: NEW ANAT.) 191
femur head diameter and body sizeestimates instead of atlas centroidsize. The three computations yieldedvery similar results so that the shapedeformations shown in Figure 5 arenot only related to atlas size but alsoto body size. As the cervical vertebraebear the weight of the head, these al-lometric shape changes can be con-strued straightforwardly as adaptations
to, or effects of, a heavier head and theresulting more massive nuchal muscles.The muscles connecting the atlas withthe head arise at the arcus posterior andthe processus transversus of the atlas,so that these structures are mostly af-fected by allometric increase in robust-icity. Whether body size influences lo-comotion behavior itself, and thusmight additionally influence atlas mor-
phology, is still debated (Fleagle andMittermeier, 1980; Doran, 1993; Geboand Chapman, 1995; McGraw, 1998).
As in nonhuman primates, the pro-cessus transversus in the human atlasbecomes somewhat enlarged and morecranially oriented with increasing size.But while evolutionary allometry andnonhuman static allometry both indi-cate an allometric increase of robustic-
Figure 7. The first two singular warp scores for the shape coordinates. The first and the second dimensions here correspond to the first andthe second dimensions in Figure 6. The gray ellipses approximately mark three different locomotion patterns. Specimens of Homo sapienswere not used in the computation of these axes; locations of these points were produced using the formulas for the singular warp scoresof the nonhuman primates only. Note that the human atlas shapes then score intermediate along both components.
Figure 8. Visualization of the first singular warp represents the difference of the atlas shape between more erect and more quadrupedalmoving species. Upper row: cranial views; bottom row: dorsal views.
192 THE ANATOMICAL RECORD (PART B: NEW ANAT.) ARTICLE
Manfreda et al. 2006