canola is a variety of rapeseed that was bred by a ... winter canola in... · canola is a variety...
TRANSCRIPT

Canola is a variety of rapeseed that was bred by a Canadian scientist to remove erucic acid and glucosinolates. This can be found in the name as it stands for Canadian Oil of Low Acid. This improved the negative health effects and bitter taste associated with rapeseed, making it edible. One million acres of canola are produced in the U.S. and 90% of this is produced in North Dakota.
Canola contains edible oil low in saturated fats with a high oleic acid/omega‐3 content.
The low saturated fat content can also help to improve cold weather performance (double bonds creates a kink in the structure which keeps it from solidifying)
Canola can work into a rotation with soybean or sorghum
1

This slide shows a good comparison of different oilseed feedstocks based on the expected yields of biodiesel on a per acre basis. Sunflower and rapeseed (canola) are on the upper end of this chart which is why we will be going through the agronomics of growing these for biodiesel production. Soybean has much lower yields because the seed only contains about 20% oil whereas sunflower and rapeseed (canola) have about 40% oil.
2

In the south, we can grow a winter variety of canola whereas the northern climates (North Dakota and Canada) rely on a spring variety. Within winter canola there are also early and late maturing varieties. Planting both can help mitigate risk in two ways. The early maturing varieties have the highest yields but are susceptible to winter freeze injury. The late varieties are more vulnerable to drought. Therefore, depending on the year, one may perform better than the other. Also, with winter canola it is important to get these out of the field as soon as possible to prevent reduced yields. Planting both early and late maturing varieties allows for extending the harvest window and providing extra time to harvest.
Try to get seed that are resistant to blackleg disease.
There is winter canola available that has the Clearfield technology which allows growers to use Beyond herbicide to remove broadleaf weeds without harming the canola.
3

The rule of thumb is to plant about 6 weeks before killing frost. Planting too early or too late can cause winter kill…either the plant has bolted or the plant is too small to make it through the winter. On the USDA Plant Hardiness Zone Map, Zone 7a could plant canola between Sept. 10 – Oct. 15 and Zone 7b between Sept 15 – Oct. 25.
In medium textured well‐drained soil, canola can be planted at about ½ inch depth, 6‐14 inch row spacing, 5‐8 lbs per acre.
Plants can compensate for planting density; more space, plants grow larger.
4

As with sunflower, it is important to manage the residue properly in no‐till systems when planting winter canola. Planting in the residue can lead to a higher crown height and roots may not even penetrate the soil. This could lead to substantial winter loss. Using a harrow or burning the residue can assist with this if the residue is very thick or unevenly distributed. Increasing seeding rate by 15‐20% and using a “wavy” coulter (to remove residue from the seed row) can also help to ensure a good stand.
No‐till soils are generally lower in temperature than conventionally tilled soils due to the insulation effect of the residue. Therefore, it is a good idea to plant in the earlier part of the planting window to ensure proper germination and development before the first killing frost.
A no‐till grain drill with a small seed box like the one in the image can be used for planting no‐till winter canola.
5

Soil testing is recommended prior to fertilizer application to reduce the chance of excess applications. Fertilizer rates are similar to wheat except for N and S. N is usually 20‐25% more than wheat. N can be split applied (50:50) in fall and spring. Nearly 40% of N is removed with seed so much N may still be left for summer crop. There is no good fertilizer rate data for winter canola in Tennessee. The recommendations from other nearby states create quite a range of recommendations. In Missouri, the recommendation for N is 90 to 150lbs N /acre. In Virginia, they recommend applying 100 lbs/acre N. Georgia recommends 135 to 180 lbs N/acre.
Canola needs S for proteins, if soil has less than 25 lbs/acre then add an additional 25 lbs/acre.
Apply P, K, micronutrients (Boron, 1 lb/acre) preplant. In Virginia, they recommend applying 100 lbs/acre P and K (if P soil test is medium and K soil test is high). In Missouri, they recommend applying 50‐60 lbs P or K per acre.
Lime if pH is below 5.8
6
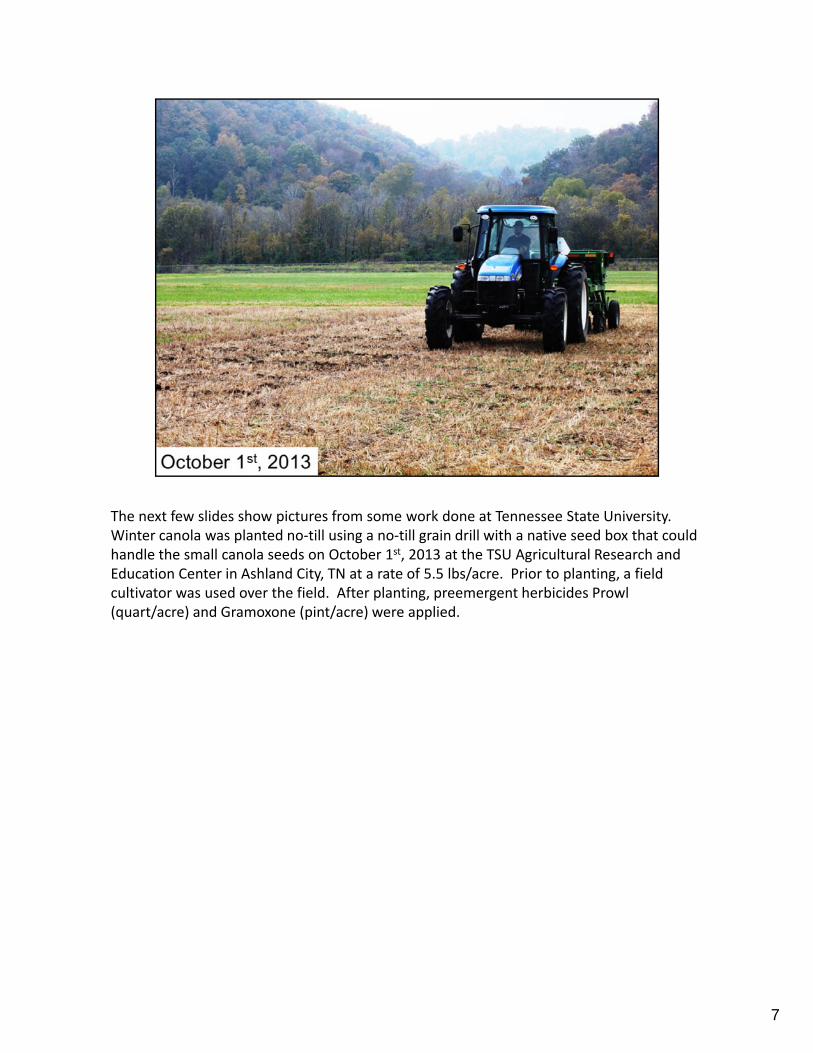
The next few slides show pictures from some work done at Tennessee State University. Winter canola was planted no‐till using a no‐till grain drill with a native seed box that could handle the small canola seeds on October 1st, 2013 at the TSU Agricultural Research and Education Center in Ashland City, TN at a rate of 5.5 lbs/acre. Prior to planting, a field cultivator was used over the field. After planting, preemergent herbicides Prowl (quart/acre) and Gramoxone (pint/acre) were applied.
7

About 4 weeks later there was good emergence…
8

By 8 weeks after planting we had some large plants that would be able to make it through the winter.
9

This slide is after the first polar vortex came through and we had a lot of winter kill. Even in an average year, you will see some winter kill but as long as that growing point in the center of the plant is still viable, it will still come on strong in the spring.
10

In this case, the polar vortex did not cause any noticeable issues and you can start to see flower production by the middle of April.
11

By the late May/early June, you start to see the winter canola become mature. It takes about 145 to 160 days from planting for the canola to reach maturity.
12

This is a picture around the same time but in Franklin County. There are a number of farmers in southern middle TN and northern middle TN that grow winter canola. You can see these plants are becoming mature at about the same time as what TSU had.
13

This is still in Franklin County on the same day and you can see that the winter wheat is maturing at about the same time. Since the lifecycle of winter wheat is about the same as winter canola these can be rotated with each other. This has been found to increase winter wheat yields and is most likely due to reduced weed, disease and insect competition provided by the rotation.
14

As mentioned previously, it is important to harvest the winter canola as soon as it is mature. This is usually once the plant has reached about 10% shatter (10% of seed pods on the plant have shattered). The seeds should all be dark like those on the bottom of the slide. Greater than 2% green seeds will lead to a reduction in revenue at the crushing facility. The seed moisture at harvest should be 8‐10%. Canola can be harvested directly using a combine with the concave nearly wide open and slower cylinder/rotor speeds. Chaffer and shoe sieves are usually closed more than for wheat. It is also a good idea to patch any holes with duct tape to reduce losses in yield.
15

Storage is important so that the seed does not get too moist and start to mold. Higher temperatures will lead to a greater risk of moisture than cooler temperatures so it is important to keep the humidity low inside the grain bin/elevator under these conditions. Storage life doubles for every 10 degree drop below 77°F or 1% moisture reduction below 9%.
16

17

Canola is a good winter crop for Tennessee because most of our crop land is located in West TN and is made up of highly erosive soils. Many farmer leave their land fallow in the winter and canola is a cover crop that could be used to reduce soil and nutrient losses. It also can help produce additional revenue for a farmer and the oils can be used to produce biodiesel. As part of my Extension programming talk to farmers about growing these oilseeds to use for the production of their own fuel on the farm. Anywhere from 1‐15% of a farmer’s land can be used to grow these biodiesel feedstocks which can produce enough biodiesel to run the diesel equipment on their farm for a year. The remainder can be sold to local crushing facilities in Kentucky or Georgia. This has led to my participation in the National Winter Canola variety trials and
18

With farmers sharing the equipment, it can be reduced to about $1.40 per gallon.
Canola is a good rotation with winter wheat and can be a good cover crop.
19

Randomized complete block design with 4 replicates.
Harvested 1st planting date June 8‐11 (one block per day)
Laboratory analyses were performed by Sure‐Tech Laboratories in Indianapolis, IN and used AOAC methods for feed analysis. %meal was determined by
20

The grain yield ranges from 2500 to over 4000 lbs/acre. This equates to 50‐80 bushels per acre (125 ‐ 200 gallons oil/acre).
21

According to local winter canola contracts, the oil content must be between 38.1 and 42.0%. All of the higher yielding varieties exhibited this. If oil content is above 42.1 or above%, farmers get an additional 1% bonus for every 1% higher oil content. It is calculated to the nearest 0.1%
Red star indicates 2% bonus, yellow stars represent 1% bonus. The red star for MH12AC17 is significantly different from all of the others. Quartz is next greatest and those with yellow stars are not significantly different from Quartz. Though the MH12AC17 has a high oil content, its relative yield was found to be about 1500 lbs/acre lower than Quartz which would most likely be more of an issue.
22

According to the literature, the density of canola oil at room temperature is about 7.6 lbs/gallon.
Oil extraction efficiency came from our own research using our seed press, the lowest speed produces the most efficient extraction which is about 69%
According to the literature, the biodiesel conversion efficiency ranges from 93‐98% so we went with the more conservative estimate.
I found a number of different estimates of farm fuel consumption and I went with the highest rate which was 5.4 gallons/acre, again to estimate on the conservative side.
This gave the final value as the percentage of acreage that would need to be devoted to growing winter canola to produce enough biodiesel for the cropping season.
23

For low yielding varieties, this value got as high as 16%
24

Sumner had the greatest protein content in the meal (37.7%) and Claremore was statistically similar at 36.9%. The remainder ranged from 31‐36% protein. Average soybean meal protein content is about 45‐50% (about 30% higher than canola). This leads to its lower cost of $262/ton vs. soybean meal at $325/ton in 2015‐2016 according to USDA. So to keep canola meal competitive, 35% protein content or higher would probably be best. Otherwise, you will have to feed more canola meal to cattle than soybean to provide the same amount of protein. Based on the results, if someone wanted to have a small acreage for growing winter canola for biodiesel production, I’d probably recommend the Claremore variety because it’s a triple threat…it has high grain yield, high oil content and high protein content in the meal that is produced.
25

Only 5 of those with high yields are currently commercially available in the U.S. There is no significant difference between them for oil content or for protein content in the meal. Therefore as far as recommendations go, it is a tossup. You might go with Quartz because it had the highest grain yield of all varieties, it has highest numerical oil content between commercially‐available high‐yielding cultivars and is up there for protein content too.
26

Highest yielding varieties. DK Severnyi had about 5000 lbs/acre. Hekip had 3900 lbs/acre.These two were both among the high yielding cultivars for the first planting date too.
27

Protein and oil content for both DK Severnyi and Hekip were not statistically different and were 33‐34% for meal protein and 43‐44% oil. Hekip is commercially available in the U.S. With respect to farm acreage required, DK Severnyi required about 3% and Hekip required about 4%. There was no significant difference between the two. Low producers got as high as 13%
28

This is due to its availability, high yield and oil content and moderate meal protein content. An prior season of data will be used to make a final determination. However, as of now based on preliminary results, it looks like Hekip, Hornet and Edimax CL are promising cultivars that are commercially available in the U.S.
29

30

31

Economics of Canola Production
Danny Morris
Area Farm Management Specialist
UT Extension

Production Concerns
• Review some of the challenges of canola– Identifying a buyer
– Logistics
• Storing canola
• Other minor considerations of raising canola
• Cost of production
• Economics of canola production

Identifying a Buyer
• Canola is not commonly purchased by local grain elevators.
• This can pose a problem as far as being able to physically deliver the commodity.
• Since canola is harvested during the summer months, it can complicate things for farmers.
• Often, farmers are looking to quickly move the crop so they can return to spraying other crops or planting double crop soybeans.

Identifying a Buyer
• Farmers are always faced with the risk of their grain buyers not being able to honor their contractual obligations.
• This is why each state has a grain indemnity fund. • This fund is designed to pay producers in the event of
a commercial dealer or warehouse being unable to fulfill the financial obligations it owes its customers.
• If producers pay the assessment in a state’s program, then they will receive an indemnity payment even when dealing with a processor.– Keep in mind that each state’s program will vary slightly
from one another.

Identifying a Buyer
• Canola is not often purchased by local elevators.
• Harvest time of canola is close to the same harvest time as wheat.
• Because of this buyers may require that farmers deliver on a “buyer’s call” basis.– Grain buyer will set certain delivery times that the
commodity can be delivered. – This can force producers to have to store the
commodity until that delivery time. We will come back to this.

Identifying a Buyer
• In West Tennessee, canola has been either delivered to a nearby drop off point or straight to a processor in Kentucky.
• However, due to financial issues related to a local processor, the delivery point for West Tennessee producers may be Christian County Grain in Pembroke, KY.– For producers in my area that is 260 miles
round trip. What would that cost per bushel?

Cost of Hauling Canola 130 MilesHaul Details Unit ValueDistance (One Way) miles 130
Total Number of Bushels bu 4,500
Bushels per Load bu 900 77.78$
Number of Loads # 5 130.00$
Loading Time (per load) hrs 0.5
Unloading Time (per Load) hrs 1.5
Average Fuel Use miles/gal 5 92.38$
Average Speed miles/hr 45 834.31$
Inputs 268.98$
Diesel Fuel $/gal 2.50
Wage Rate $/hr 10.00 2,234.56$ Interest Rate % 6.0% 0.50$ Share of Annual Truck Use % 16% 1.72$ Truck/Trailer Information
Purchase
Price ($)
Useful Life
(hrs)
Annual
Use
(hrs)
Repair
Factor
Salvage
Value ($)
Number of Single
Axles
Number of
Tandem Axles
Truck (Tractor) 35,000 2,400 240 0.25 1,000 1 1
Trailer 40,000 3,600 200 0.15 5,000 0 1
Custom Rate Eq. ($/mile round trip)
Fixed Cost (Share of Total Annual Cost)
Estimated CostsVariable Cost ($/Load)
Labor Cost
Fuel Cost
Repair and Maintenance
Capital Recovery
Taxes, Insurance, and Housing
Total CostCost per Bushel

Logistics: How do you overcome the distance?
• Some local elevators are talking about becoming a local drop off point for West Tennessee producers.
• In the past, some elevators have done this. – No plans have been finalized for 2017.
• However, no elevator has committed to doing this yet in West Tennessee due to the limited amount of acreage of canola.

Logistics: Selling to a Nearby Elevator vs. Processor
• You will incur a discounted price by not going directly to the processor.– Example: In the past, there has been an
approximately a $0.20 discount if dropped off at Mayfield, KY elevator versus going to processor in Trenton, KY.
– The cost of transportation may make it cost prohibitive to haul it straight to the processor yourself.

Storing Canola
• Canola is an oilseed, which can make it slightly more difficult to store than say corn or wheat.
• What truly makes it hard to store is the size of the seed.
• The seed is so small that it can spill out of cracks in the side of bins.
• The size of the seed also makes it hard for air to flow through the oilseed while it is in storage.

Storing Canola
• For example, if you have a 10,000 bushel bin, then you will likely have to store less than the max capacity to allow for airflow.
• In fact, in order to force air through the canola, you will likely need a high pressurized air system.– Something that not every farmer has.

Storage and Transportation• Canola Storage can require closer monitoring than wheat.• Transportation and storage equipment should be checked for leaks
and taped or caulked. Canola will leak from very small holes.• Storage requires consideration of moisture, temperature, and
soundness of the container.• Seed moisture should be 8 to 10%, and if drying is necessary
temperature should not exceed 110 degrees F. Relative humidity should be kept below 65%, and long term storage temperature at 50 degrees F or lower.
• Canola can continue to "breathe" for up to 6 to 8 weeks after harvest before becoming dormant. Monitor regularly and use aeration fans to avoid heating.
• Every reduction of 10 degrees F below 77 degrees F and 1% seed moisture below 9% will double the storage live of canola.
• Sealed round metal bins are best for storage. *Source: Oklahoma State University

Storing Canola
• Canola will store at less than 10% moisture. At 100 degrees outside temperature, the seed temp will be 20 degrees higher on average.
• Use grain levelers in all gins when unloading canola.• Fines, dirt and weed seed will collect in the center of
bin, if not leveled, and cause heating.• Aeration - the bigger the gin, the more difficult it will be
to move air thru the grain (push air thru, not pull)• Consider adding a layer of wheat on bottom of bin to
cover up aeration pad, and start air movement evenly. *Source: Oklahoma State University

Storage of Canola
• Monitor Bins Frequently Seed needs to be rotated if heating occurs
• Larger bins create increased potential for heating related problems with the seed
• Outside/Inside fluctuations in temperature will cause changes in the stored seed.
• Once seed reaches 8%, storage problems are minimized. (Continue to Monitor Bins!)
• If Canola seed has been properly stored, trucking seed should not cause problems.– Low humidity along with high temperatures reduced chances for storage
related losses. However, we have high humidity here.
*Source: Oklahoma State University

Expenses Related to Storing Canola
• Labor
• Utilities
• Changes in storage equipment– Higher pressurized air flow systems
• Storing canola in harvest bags (or silo bags) if permanent storage is unavailable can be a viable option.

Other Considerations for Planting Canola
• Crop rotation is key when planting canola. • According to the Canola Council of
Canada, there should be at least one year between crops.– Preferably two to three years between canola
crops– An average of 10%-20% reduction in yields
can occur if canola is planted after canola• Recommend canola-wheat-wheat rotation.• Disease and pest management is the main reason.

Canada Canola Council Guide to Field Selection of Canola Crops

Crop Production Costs
• A producer survey was conducted determine the actual costs of canola production in West Tennessee.
• Four producers in three separate counties agreed to sit down for interviews to discuss their cost of production.– Participating counties included Gibson, Henry,
and Weakley.

Crop Production Costs
• Surveys indicated that there were variations in production practices of each producer.
• Some key differences included:– Fertilizer rates
• Especially in micronutrients– Chemical applications
• Burndowns and fungicide applications varied greatly– Equipment costs
• Talk about this more in detail later on– Rent expense– Crop Insurance

Crop Production Costs
• Producers were not able to provide the following expenses on a per acres basis:– Repair & Maintenance– Fuel, Oil, & Filter,– Operator Labor
• Producers did comment that we needed to make an adjustment of 25%-33% adjustment to account for slower harvest times.

Unit Quantity Price Total
Revenue
Canola Bu 57.05 8.05$ 459.22$
Total Revenue 459.22$ Variable Expenses
Seed lbs 2.00 13.53$ 27.06$
Fertilizer & Lime Acre 1.00 139.59$ 139.59$
Chemical Acre 1.00 59.95$ 59.95$
Crop Scout Acre 1.00 ‐$ ‐$
Repair & Maintenance Acre 1.00 32.06$ 32.06$
Fuel, Oil & Filter Acre 1.00 13.53$ 13.53$
Operator Labor Acre 1.00 9.21$ 9.21$
Machinery Rental Acre 1.00 ‐$ ‐$
Custom Work Acre 1.00 ‐$ ‐$
Drying Bu 50.00 ‐$ ‐$
Cash Rent Acre 1.00 104.13$ 104.13$
Crop Insurance Acre 1.00 11.31$ 11.31$
Operating Interest % 396.83 6.00% 11.90$
Other Variable Costs Acre 1.00 ‐$ ‐$
Total Variable Expenses 408.73$ Return Above Variable Expenses 50.49$ Fixed Expenses
Machinery
Capital Recovery Acre 1.00 59.75$ 59.75$
Other Fixed Machinery Costs Acre 1.00 ‐$ ‐$
Property Taxes Acre 1.00 ‐$ ‐$
Insurance (Non‐Machinery) Acre 1.00 ‐$ ‐$
Management Labor Acre 1.00 26.00$ 26.00$
Other Fixed Costs Acre 1.00 ‐$ ‐$
Total Fixed Expenses 85.75$ (35.26)$
2016 Canola, Conventional Tillage, Non‐Irrigated BudgetAverage of Producer Surveys and
UT Crop Budgets (2017)
Return Above All Specified Expenses

Fertilizer Usage From Surveys
Table 1. Fertilizer & LimeFertilizer Description Quantity (lbs) Price ($)Nitrogen Urea 147 $0.36Phosphorous P2O5 91 $0.34Potassium K20 138 $0.26Lime Limestone 1000 $36.50Other Sulfur 20 $0.35Other Boron 0.5 $5.33Total
Table 1. Fertilizer & Lime
Fertilizer Description Quantity (lbs) Price ($) Total ($/Acre) Your Farm ($/Acre)Nitrogen Urea 160 $0.36 $57.04 _________
Phosphorous P2O5 80 $0.34 $27.25 _________
Potassium K20 130 $0.26 $34.23 _________
Lime Limestone 1,000 $36.50 $18.25 _________
Other Sulfur 20 $0.35 $7.00 _________
Other Boron 0.5 $5.33 $2.67 _________
Total $146.44 _________
Fertilizer Usage From UT Extension 2017 Crop Budgets

Chemical Usage From Survey
Chemical Function Description Unit Number of Apps. Quantity Price Total
($/Acre)Herbicides Pre‐plant Herbicide pt. 1 1 $27.50 $27.50
Harvest Desiccant acre 1 1 $17.50 $17.50
$0.00 $0.00
$0.00 $0.00
$0.00 $0.00
$0.00 $0.00
Insecticides Seed Treatment acre 1 1 $5.00 $5.00
Fungicides Foliar acre 1 1 $9.00 $9.00
Total $59.00

Equipment Usage for Canola From SurveysTable 3. Machinery 4
Power Unit Implement Size Capital Recovery
Repairs & Maintenance
Fuel, Oil & Filter Labor Total
Chisel Tractor, 215 hp Chisel Plow 21' $1.90 $2.38 $1.55 $1.16 $6.98Disk Tractor, 215 hp Tandem Disk 29' $4.48 $2.59 $1.25 $0.93 $9.25Plant Tractor, 215 hp Grain Drill 20 ft $4.69 $7.26 $1.98 $1.47 $15.40Weed Control
SP Boom Sprayer 90' $4.19 $0.24 $0.20 $0.16 $4.79
Desiccant SP Boom Sprayer 90' $4.19 $0.24 $0.20 $0.16 $4.79Fungicide SP Boom Sprayer 90' $4.19 $0.24 $0.20 $0.16 $4.79Harvest Combine Grain Head 30 ft $11.11 $9.80 $3.45 $1.23 $25.59Haul Tractor, 215 hp Grain Cart $2.31 $1.06 $0.69 $0.52 $4.57Haul Semi Tractor/Trailer 800 bu $4.83 $0.52 $1.16 $0.93 $7.44Chop Stalks Tractor, 215 hp Rotary Mower 15' $0.00 $0.00 $0.00 $0.00 $0.00Weed Control
SP Boom Sprayer
90 $4.19 $0.24 $0.20 $0.16 $4.79
Weed Control
SP Boom Sprayer
90 $4.19 $0.24 $0.20 $0.16 $4.79
Total $50.28 $24.81 $11.08 $7.03 $93.20
Vary from UT Extension Budgets due to 5 passes with a sprayer: 1. Burndown, 2. Application of liquid N, 3. Application of liquid N, 4. Application of Fungicide, 5. Application of desiccant.

LOW HIGH LOW HIGHYield Range (bu/acre) 55 75 45 60Contract Price ($/bu) 5.25 5.25 8.3 8.3
Gross Return/Acre 288.8 393.8 373.5 498.0
Variable Expenses ($/Acre)Burndown Herbicide/Tillage 15.0 15.0 15.0 15.0Seed 50.0 50.0 30.0 30.0Planting 15.0 15.0 15.0 15.0Fertilizer 100.0 120.0 130.0 155.0Lime 7.0 7.0 7.0 7.0Herbicides 25.0 25.0 12.0 12.0Insecticides 10.0 10.0 5.0 5.0Fungicides 30.0 30.0 30.0 30.0Desiccant 0.0 0.0 17.0 17.0Application Charges ($4/ac/app) 16.0 16.0 20.0 20.0Harvesting (Combine/Grain Cart) 33.0 33.0 33.0 33.0
Crop Insurance 12.0 12.0 12.0 12.0Hauling 2.5 2.5 2.5 2.5Total Variable Expenses Costs ($/Acre) 315.5 335.5 328.5 353.5
Return Above Variable Expenses -26.8 58.3 45.0 144.5
Note: The price for canola is FOB NW TN
NORTHWEST TENNESSEE ENTERPRISE BUDGETS
Winter Crops
WHEAT CANOLA
Note: The basis for wheat is assumed $0.0 under Jul 16 Wheat
Sample Budget from Industry

Unit Quantity Price Total
Revenue
Canola Bu 57.05 8.05$ 459.22$
Total Revenue 459.22$ Variable Expenses
Seed lbs 2.00 13.53$ 27.06$
Fertilizer & Lime Acre 1.00 139.59$ 139.59$
Chemical Acre 1.00 59.95$ 59.95$
Crop Scout Acre 1.00 ‐$ ‐$
Repair & Maintenance Acre 1.00 32.06$ 32.06$
Fuel, Oil & Filter Acre 1.00 13.53$ 13.53$
Operator Labor Acre 1.00 9.21$ 9.21$
Machinery Rental Acre 1.00 ‐$ ‐$
Custom Work Acre 1.00 ‐$ ‐$
Drying Bu 50.00 ‐$ ‐$
Cash Rent Acre 1.00 104.13$ 104.13$
Crop Insurance Acre 1.00 11.31$ 11.31$
Operating Interest % 396.83 6.00% 11.90$
Other Variable Costs Acre 1.00 ‐$ ‐$
Total Variable Expenses 408.73$ Return Above Variable Expenses 50.49$ Fixed Expenses
Machinery
Capital Recovery Acre 1.00 59.75$ 59.75$
Other Fixed Machinery Costs Acre 1.00 ‐$ ‐$
Property Taxes Acre 1.00 ‐$ ‐$
Insurance (Non‐Machinery) Acre 1.00 ‐$ ‐$
Management Labor Acre 1.00 26.00$ 26.00$
Other Fixed Costs Acre 1.00 ‐$ ‐$
Total Fixed Expenses 85.75$ (35.26)$
2016 Canola, Conventional Tillage, Non‐Irrigated BudgetAverage of Producer Surveys and
UT Crop Budgets (2017)
Return Above All Specified Expenses

Conclusion
• Canola can be a good addition to your crop rotation ifyou can create a cost structure that reduces fixed expenses to a profitable level.– Canola on land that you own could be a viable option.
• Delivery to a buyer and storing of canola can present challenges.
• Yield and price levels have to be high enough to justify the expenses of planting the crop and transporting it to a far away buyer.– This is not the case for those closer to the buyer.
• Canola is new to many producers and will require more planning ahead than corn, soybeans, and wheat.

Questions or Comments?
Danny Morris
UT Extension
Area Farm Management Specialist
Cell: 731-487-0222
Email: [email protected]

Soil health is a holistic approach that goes beyond determining the nutrient status of the soil. It includes assessment of the physical and biological status to determine all important aspects of the soil that can have an effect on its health and sustainability which can affect crop production.
1

Measuring soil health is important for a number of reasons. It can help to identify constraints of your land that would limit yields (i.e. compaction, nutrient availability, beneficial/non‐beneficial organisms). Once you know these constraints, you can identify specific management practices that can be used to improve these issues. By monitoring soil health each year you can identify the effects of changes that you might make in the field (i.e. changing tillage practices). You can identify if you are moving in the right or wrong direction. If you are able to increase the health of the soil from what it was when you first bought or rented your land, it should be worth more. Also, just like with a house, you can use this equity when you need it (i.e. reducing fertilizer applications one year if prices are too high).
2

There are different levels of monitoring your soil for its health. The list shown on the slide is in increasing order of complexity, time and cost (i.e. general field observations are lowest, comprehensive soil tests are highest).
3

With general field observations, this is similar to monitoring your own health. Is something hurting? Do you have enough energy? In the field, you can ask questions like, am I getting similar yields or is there a consistent decrease? Is there ponding or soil crusting on the field? Are the plants under more influences of disease or pests? Does it take more power to run tillage equipment or planting equipment through the soil? If you are seeing any negative factors, it is a good idea to seek more information on the causes of these symptoms.
4

This is a way to take qualitative measurements of your field without lab analyses. It is important to take samples from a number of different areas within the same field since the soil is quite variable. Also, if taking these measurements on an annual basis, be sure to take the measurements at the same time of year and under the same conditions. Differences in conditions or timing may cause differences in what you see that may have nothing to do with the soil health but are more determined by these other conditions.
Look at the handout with the Georgia soil health scorecard (there is not currently one for Tennessee) and go over some of the items to give participants an understanding of how they work. More discussion of some of these will take place on the following slides.
5

To measure the strength of soil aggregates, you can perform what is called a “slake test”. Basically you can use this to compare soil aggregates under different growing and management conditions. You can take a soil aggregate from the top few inches of soil and place it in a jar with water to see if the aggregate holds together or slakes (falls apart). If it holds together you can swirl the contents around to see if the aggregate still holds together. A soil that slakes will be more susceptible to erosion and can reduce air and water infiltration within the soil.
6

All of these indicators can be observed during or right after a hard rain.
Soil crusting is a dense crust that forms on the top layer of soil and becomes hard when dry. The crust can reduce emergence of seedlings and reduce crop yields.
Ponding can be identified when standing water is found in low spots on a field. Also, slaked soil (aggregates that have disintegrated) or cracks in the soil can indicate ponding. This indicates poor drainage and can cause issues related to poor root growth and disease.
Runoff and erosion can be observed during a hard rain as water cuts through a field and removes soil and nutrients. After a hard rain evidence such as slaked soil along a change in elevation, rills or, in extreme situations, gullies can be formed through a field indicating soil loss. You can compare different crops and different management areas to assess which ones may reduce these issues.
7

The best way to measure this is with a penetrometer which can give you a value of the strength of your soil. If the soil has a strength that is too high (greater than 300 psi), it will restrict root growth. Other tools that can be used to give a relative idea of the soil strength include a spade, a tile finder or a stiff wire. It is a good idea to measure the strength throughout the year as conditions can change due to tillage, moisture, crop canopy, and packing and settling of soil. Too much field traffic can cause compaction of the soil which will also reduce infiltration and increase the potential for erosion. A high degree of tillage can introduce a plow layer which compacts the subsoil and reduces root penetration and water movement down within the soil profile. Also, dig up some of the top layer of soil and see if it breaks up into small aggregates or large clumps. Large clumps are not the soil structure that is best for water infiltration or root growth.
8

Soil microorganisms are smaller than what can be seen with the naked eye. As this infographic says there are more soil microorganisms in a teaspoon of healthy soil than there are people on the earth. Earthworms are larger macroorganisms and can be assessed in the field to determine soil health. The best time to assess is mid‐spring after the soil has had a chance to warm and in mid‐fall as long as it is not excessively wet. If you see a lot of earthworm activity (10 worms per square foot), the soil may be pretty healthy but if it is devoid of any life, it may indicate that there is a problem. Earthworms help to break down organic matter so microbes can further break it down into nutrients that the plant can access. They also help provide porosity to the soil which aids in water movement.
9

You can check the status of root development once the plants have reached the fast‐growing vegetative stage. Check to see if the roots are properly branched, extending in all directions with numerous lateral roots. Also, they should be holding onto the soil and forming aggregates. Problem indicators could be short, stubby or decaying roots. If the roots are bunched up in one area but devoid of another area this could indicate high soil strength or a hardpan. It is a good idea to dig deep enough to see the full extent of the root development.
10

Nutrient deficiency symptoms can be found on plant leaves when soil fertility levels are low for a particular nutrient. This picture by Dr. Pitchay at TSU shows interveinal necrosis for this squash plant leaf when deficient in Mg. The symptoms are different for each nutrient and can also vary from plant to plant. In general, N deficiency can be observed by a lighter shade of green on lower (older) leaves that becomes more yellow as the deficiency becomes worse. Potassium deficiencies can be identified sometimes by interveinal chlorosis where the areas between the leaf veins become yellow. With phosphorus deficiency, older leaves can turn a dark green or reddish purple.
11

With comprehensive soil tests it is recommended to perform these every 2 or 3 years in spring when soils are moist (field capacity) (not too wet or too dry). The overall Cornell Soil Health test includes a number of specific tests for different characteristics that all relate to soil health. The results are color‐coded to identify areas that need improvement (i.e. red) as well as an overall quality score. In addition to chemical indicators it also measures 4 physical indicators and 4 biological indicators. In the example shown, the chemical factors are good (green) but the biological and physical factors are not. This is a good example of how soil nutrient testing alone does not give the whole story.
The combined test costs anywhere from $50‐$140 per sample. The one shown here is $95 per sample. On the other hand, if you identify some specific areas of concern from some of your own more qualitative tests that were described above, you can have an individual test run at $15 to 25 per sample.
12

This is a soil health test offered by Midwest Labs. They utilize some different parameters to identify the level of soil health but provide an overall calculation and individual indicators to determine where your issues might be, similar to the Cornell Soil Health Test results. These tests are $75/sample and do not include any testing of soil physical properties, only chemical and biological properties.
13

There are some do‐it‐yourself kits out there so that you can get more accurate measurements in the field. This kit costs $800 but you can make your own kits using some resources offered by the NRCS. If you “Google” Soil Quality Kit NRCS, you can find information for individual tests as well as information on the materials you need to perform these tests.
14

Most soil health can be improved using the six approaches identified. These effects are all additive. The handout also includes other specific options as recommended by NRCS. The short‐term practices provide quicker responses that will have to be done multiple times to prevent a recurrence of the issue. The long‐term practices will take longer to see their effects but will treat the issue more sustainably.
Go over the NRCS handout with different management practices for different soil health issues.
15

Think of the soil as a bank. If you have to use a practice that is “bad” (like harvesting crops under wet soil conditions), try to compensate by incorporating a “good” practice.
Engaging in no‐till, strip‐till or zone tillage can help reduce organic matter losses, erosion and degradation of soil structure. Controlled‐traffic farming can help reduce the potential for compaction but may require adjustments to planting equipment and acquisition of a GPS system.
Crop rotations even between crop and forage systems can reduce weed, disease and insect competition and help to build up soil nutrients and organic matter.
Cover crops can reduce erosion of soil and nutrients. They can also reduce weed competition, add N to soil (legumes) and reduce compaction (radish)
Organic matter inputs can counter the negative effects of tillage. It is important to make sure that you don’t apply too much material, causing nutrient surpluses and that the material is relatively disease‐free. Fresh organic matter (manure, cover crops) will immediately stimulate biological activity and provide a lot of available N. More stable organic matter (compost, crop residues) will assist with long‐term building of soil health.
16

Perennial forage crops will reduce tillage, erosion and improve soil physical and biological properties.
Silage harvests do not leave much residue so manure can be applied in its place.
As with the previous slide, no‐till, strip‐till or zone tillage can be used. Manure can be injected to reduce tillage or gently incorporated with aerators.
Manure spreaders can be heavy, spread manure when soil is dry or inject in winter. Build storage for manure so you have the ability to apply it when conditions are best. Aerate pastures to reduce the effects of compaction from foot traffic.
Nutrient losses from too much manure can be a problem. Regular soil testing can ensure optimal usage.
17

The majority of the soil health information came out of the book, “Building soils for better crops” which is a publication by the Southern SARE (Sustainable Agriculture Research and Education) program and can be found on their website. A complete pdf of the book can be downloaded for free off of their website.
Any future questions can be directed toward the contact information indicated.
18