candida flareri - oklahoma state …digital.library.okstate.edu/etd/umi-okstate-2346.pdf2.5...
TRANSCRIPT
RIBOFLAVIN PRODUCTION BY ENCAPSULATED
CANDIDA FLARERI
By
HOUSSAM AREF ALOSTA
Bachelor of Science in Civil EngineeringBeirut Arab University
Beirut, Lebanon1999
Master of Science in Biosystems EngineeringOklahoma State University
Stillwater, OK2002
Submitted to the Faculty of theGraduate College of the
Oklahoma State Universityin partial fulfillment of
the requirements forthe Degree of
DOCTOR OF PHILOSOPHYJuly, 2007
ii
RIBOFLAVIN PRODUCTION BY ENCAPSULATED
CANDIDA FLARERI
Dissertation Approved:
Danielle D. Bellmer
Dissertation Adviser
Mark R. Wilkins
William W. Clarkson
Babu Z. Fathepure
A. Gordon Emslie
Dean of the Graduate College
iii
ACKNOWLEDGEMENT
I would like to express my gratitude to my advisor, Danielle Bellmer, for her
support, patience, and encouragement throughout my graduate studies. It is not often that
one finds an advisor and colleague that always finds the time for listening to the problems
that unavoidably crop up in the course of performing research. Her technical and editorial
advice was essential to the completion of this dissertation.
My thanks also go to the members of my committee, William Clarkson, Babu
Fathepure, and Mark Wilkins, for reading the draft of this dissertation and providing
many valuable comments that improved the presentation and contents of this dissertation.
Thanks also to all my colleagues at the Department of Biosystems Engineering for
providing a good working atmosphere, especially the persons in the Bioengineering
laboratory.
Last, but not least, I would like to thank my wife Suzanne for her understanding
and love during the past few years. Her support and encouragement was in the end what
made this dissertation possible. My parents, Hoda and Aref, receive my deepest gratitude
and love for their dedication and the many years of support during both my
undergraduate and graduate studies that provided the foundation for this work.
iv
TABLE OF CONTENTS
Chapter Page
I. Background
1.1 Background ........................................................................................................11.2 Objectives ..........................................................................................................21.2 Literature Cited ..................................................................................................3
II. Literature Review
2.1 Riboflavin, Structure and Importance................................................................52.2 Riboflavin Production........................................................................................62.3 Microbial Production of Riboflavin...................................................................72.4 Riboflavin Biosynthesis ...................................................................................112.5 Industrial Production of Riboflavin, Synthetic vs. Microbial Fermentation ...132.6 Recovery of Riboflavin from Fermented Media..............................................142.7 Cell Immobilization Technology .....................................................................152.8 Characteristics of Calcium Alginate Capsules.................................................212.9 Other Applications of Alginate Gels................................................................232.10 Calculation of Diffusion Coefficient .............................................................242.11 Literature Cited ..............................................................................................27
III. Effect of Nonionic Surfactants on the Diffusional Properties of Hydrogel Capsules
3.1 Abstract ............................................................................................................313.2 Introduction......................................................................................................323.3 Experimental Methods .....................................................................................333.4 Results and Discussion ....................................................................................383.5 Conclusion .......................................................................................................443.6 Literature Cited ................................................................................................45
IV. Continuous Riboflavin Production by Candida Flareri Immobilized in Surfactant-Modified Calcium Alginate Capsules.
4.1 Abstract ............................................................................................................474.2 Introduction......................................................................................................484.3 Materials and Methods.....................................................................................494.4 Results and Discussion ....................................................................................574.5 Conclusion .......................................................................................................65
v
Chapter Page
4.6 Literature Cited ................................................................................................66
V. Summary and Future Recommendations
5.1 Summary..........................................................................................................675.2 Future Recommendations ................................................................................685.3 Literature Cited ................................................................................................69
APPENDICES .............................................................................................................70

vi
LIST OF TABLES
Table Page
2.1 Summary of riboflavin productivities of several natural strains..............................82.2 Examples of cell entrapment in polymeric beads ..................................................192.3 Applications of various encapsulation techniques.................................................213.1 Nonionic surfactants used in the diffusion experiments ........................................343.2 Diffusivity of glucose into Ca-alginate capsules ...................................................413.3 Diffusion of riboflavin from Ca-alginate capsules ................................................414.1 Batch yields of product on substrate......................................................................60A.1 Student’s t comparison of capsules thicknesses....................................................71A.2 Student’s t comparison of combined diffusion of glucose....................................71A.3 Student’s t comparison of combined diffusion of riboflavin ................................72A.4 Free cell growth data obtained from batch runs....................................................72
vii
LIST OF FIGURES
Figure Page
1.1. Chemical and fermentation processes for riboflavin synthesis...............................12.1. Riboflavin structure ................................................................................................62.2. Proposed models for the metabolic pathways of riboflavin production ...............122.3 Structure of alginate...............................................................................................233.1 Diffusion of glucose into capsules.........................................................................393.2 Diffusion of riboflavin away from capsules ..........................................................393.3 Effects of HLB on combined diffusion coefficient of glucose ..............................403.4 Effects of HLB on combined diffusion coefficient of riboflavin ..........................413.5 Effects of HLB on thickness of calcium alginate capsules....................................423.6 Effect of HLB on diameter of calcium alginate capsules ......................................433.7 SEM photograph of Ca-alginate capsules made ....................................................444.1 Growth reactor set-up ............................................................................................514.2 Production reactor set-up .......................................................................................534.3 Flowchart for analytical procedure of samples ......................................................544.4 Batch riboflavin production ...................................................................................584.5 Batch glucose utilization........................................................................................584.6 Initial substrate utilization rates .............................................................................594.7 Continuous glucose consumption ..........................................................................624.8 Normalized continuous riboflavin production .......................................................634.9 Variation of productivity with time at different dilution rates...............................644.10 Variation of relative substrate concentrations with dilution rates .......................65A.1 Plot of Ln[X] versus time......................................................................................73A.2 Cell leak profile into the broth ..............................................................................74A.3 Riboflavin production profile................................................................................74
1
CHAPTER IINTRODUCTION
1.1 Background
Vitamins belong to the group of nutrients which are necessary for growth. Riboflavin
is an important B vitamin for maintaining human health (Shimizu, 2001). There is a large
need for extra vitamins, and the quantities derived from plant and animal food sources are
not enough due to food shortage or disease (Chandra et al., 1996). Added vitamins are
now either prepared chemically or biotechnologically via fermentation processes. Some
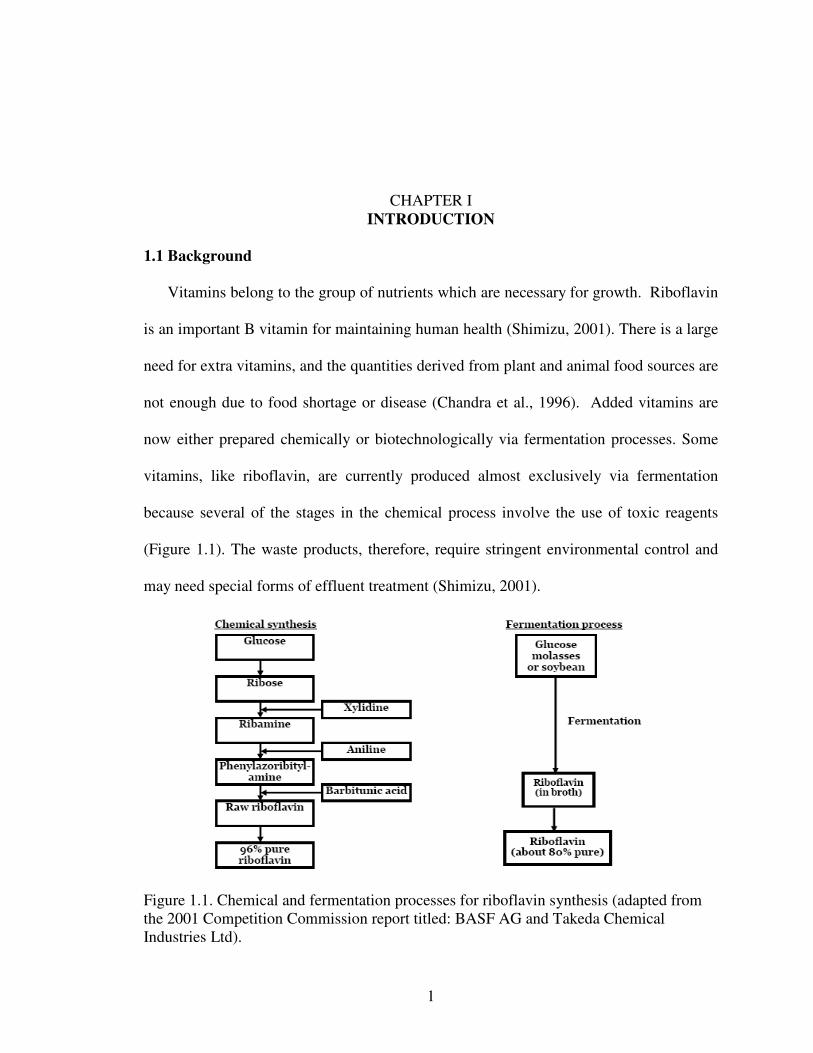
vitamins, like riboflavin, are currently produced almost exclusively via fermentation
because several of the stages in the chemical process involve the use of toxic reagents
(Figure 1.1). The waste products, therefore, require stringent environmental control and
may need special forms of effluent treatment (Shimizu, 2001).
Figure 1.1. Chemical and fermentation processes for riboflavin synthesis (adapted fromthe 2001 Competition Commission report titled: BASF AG and Takeda ChemicalIndustries Ltd).
2
Improved fermentation processes using immobilized systems for the synthesis of
vitamin compounds are gaining importance because the recovery and purification of
these vitamin compounds from suspended systems remains highly complex. The major
advantage of immobilization is the simplification of product recovery because fewer
operations are required for biomass separation/product recovery (Raymond et al., 2004).
Problems with mass transfer are common in immobilized systems, in fact the success
of an immobilization material is often measured in terms of the extent to which it does
not restrict the diffusion of various solutes into and out of the gel. One of the most
important factors that affects mass transfer, other than capsule size, is the pore size of the
gel membrane (Nguyen and Luong, 1986; Chai et. al., 2004). Thus mass transfer can be
enhanced by making the beads more porous. Previous work has shown that the use of
surfactants influenced the rate of drug release from alginate microspheres (Wan et al.,
1993). The drawback of such an attempt is the increased possibility of cell/biocatalyst
leakage.
1.2 Objectives
The main objectives of this study are to develop immobilization techniques, and then
to compare riboflavin production efficiencies in suspended and immobilized reactor
systems.
Specific objectives include:
• Develop capsule immobilization techniques.
The encapsulation technique consists of dropping a calcium chloride/chitin mixture
into a Na-alginate solution. Therefore, a thickening agent is required for the first mixture.
3
Several thickeners were investigated (PEG6000, CMC, etc…) and the best
type/concentration were chosen for the studies.
• Investigate the effect of nonionic surfactants on the diffusion properties of capsules.
The effects of 5 different non-ionic surfactants on the diffusion properties of capsules
were investigated. Because of the significant differences between beads and capsules, the
effects of surfactants were expected to vary significantly for beads and capsules.
• Compare fermentation efficiencies in suspended vs. attached growth systems.
Increasing dilution rates in continuous bioreactors generally increases production rate.
However, as dilution rate approaches a certain percentage of the maximum specific
growth rate (µmax), cell wash-out occurs in suspended growth systems. This problem is
not an issue in attached growth systems as long as dilution rate does not exceed diffusion
rate of substrate. Fermentation efficiencies of the optimum attached growth system will
be compared to that of a suspended growth system.
1.3 Literature Cited
Chandra TS, Kalingan AE, Krishnan MRV. 1996. Fungal fermentation of agro-industrialwastes to produce riboflavin. Indi Chem Eng, Section A: J Indi Inst Chem Eng 38(2):43-47.
Chai Y, Mei LH, Lin DQ, Yao SJ. 2004. Diffusion coefficients in intrahollow calciumalginate microcapsules. J Chem Eng Data 49: 475-478.
Competition Commission. 2001. BASF AG and Takeda Chemical Industries Ltd: Areport on the acquisition by BASF AG of certain assets of Takeda ChemicalIndustries Ltd.http://www.competition-commission.org.uk/rep_pub/reports/2001/456basftake.htm
Nguyen A, Luong J. 1986. Diffusion in k-carrageenan gel beads. Biotechnol Bioeng 28:1261-1266.
Raymond MC, Neufeld RJ, Poncelet D. 2004. Encapsulation of brewers yeast in chitosancoated carrageenan microspheres by emulsification/thermal gelation. Artif Cells,Blood Subst, and Immobil Biotechnol 32(2): 275-291.
4
Shimizu S. 2001 Vitamins and related compounds: Microbial production. Biotechnology(2nd Edition) New York: MacGraw Hill.
Wan LSC, Heng PWS, Chan LW. 1993. Influence of hydrophile-lipophile balance onalginate microspheres. Int J Pharma 95: 77-83.
5
CHAPTER IILITERATURE REVIEW
2.1 Riboflavin Structure and Importance
Riboflavin, also known as vitamin B2, is an easily absorbed micronutrient with a key
role in maintaining health in humans and animals. It is the central component of the
cofactors flavin adenine dinucleotide (FAD) and flavin mononucleotide (FMN), and is
therefore required by all flavoproteins (Lago and Kaplan, 1981). As such, vitamin B2 is
required for a wide variety of cellular processes. Like the other B vitamins, it plays a key
role in energy metabolism and is required for the metabolism of fats, carbohydrates, and
proteins. In addition to producing energy for the body, riboflavin also works as an
antioxidant by scavenging damaging particles in the body known as free radicals (Lim et
al., 2001).
Riboflavin is yellow or orange-yellow in color. Good sources of riboflavin are milk,
cheese, leafy green vegetables, liver, yeast, almonds, and legumes such as mature
soybeans. In addition, it is used as a food coloring and to fortify some foods like baby
foods, breakfast cereals, and pastas, and processed cheese (Graham et al., 2005). It is
difficult to incorporate riboflavin into many liquid products because it has poor solubility
in water. Hence there is a need for riboflavin-5'-phosphate, a more expensive but more
soluble form of riboflavin. It is the principal form in which riboflavin is found in cells
(Bacher et al., 2000).
6
In humans, signs and symptoms of riboflavin deficiency include cracked and red lips,
inflammation of the lining of mouth and tongue, mouth ulcers, cracks at the corners of
the mouth, and a sore throat (Graham et al., 2005). A deficiency may also cause dry and
scaling skin, fluid in the mucous membranes, and iron-deficiency anemia. The eyes may
also become bloodshot, itchy, watery and sensitive to bright light. In animals, riboflavin
deficiency results in lack of growth, failure to thrive, and eventual death.
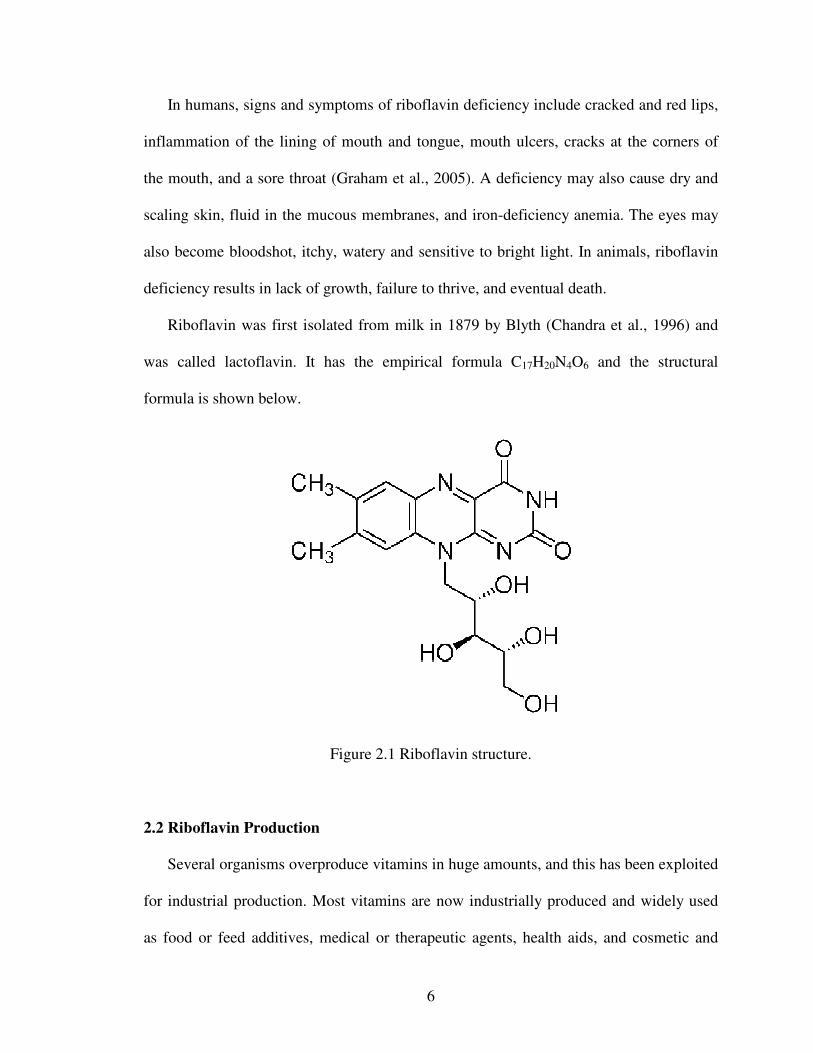
Riboflavin was first isolated from milk in 1879 by Blyth (Chandra et al., 1996) and
was called lactoflavin. It has the empirical formula C17H20N4O6 and the structural
formula is shown below.
Figure 2.1 Riboflavin structure.
2.2 Riboflavin Production
Several organisms overproduce vitamins in huge amounts, and this has been exploited
for industrial production. Most vitamins are now industrially produced and widely used
as food or feed additives, medical or therapeutic agents, health aids, and cosmetic and
7
technical aids. Thus, vitamins are important products for which many biotechnological
production processes, like microbial, enzymatic, as well as organic chemical synthetic
transformation have been reported (Bacher et al., 2000). Some biological processes are
now used for large-scale production. This is mainly due to the recent advances in
metabolic and genetic engineering.
Chemical riboflavin production from ribose is currently being replaced by biological
processes, which have the advantages of reducing costs of operation and the ability to use
renewable substrates such as plant oil or sugar instead of mineral oil. Riboflavin can be
produced either on an industrial or a laboratory scale by a wide variety of
microorganisms (Buzzini and Rossi, 1997). The yeast Candida famata is an example of a
natural overproducer of riboflavin via aerobic fermentation of organic substrates.
However, the wild-type C. famata is very sensitive to iron inhibition. Therefore an iron-
resistant industrial-scale strain has been developed by several companies, and riboflavin
concentrations in the range of 20-30 g/L have been reported using this yeast (Lim et al.,
2001). A recent more competitive process for riboflavin production employed by Roche
Vitamins AG is the process employed by using Bacillus subtilis. Currently, the yearly
riboflavin production by Roche Vitamins AG is 3000 t with B. subtilis at a site in
Germany (F.Hoffmann-La Roche Ltd, 2007).
2.3 Microbial Production of Riboflavin
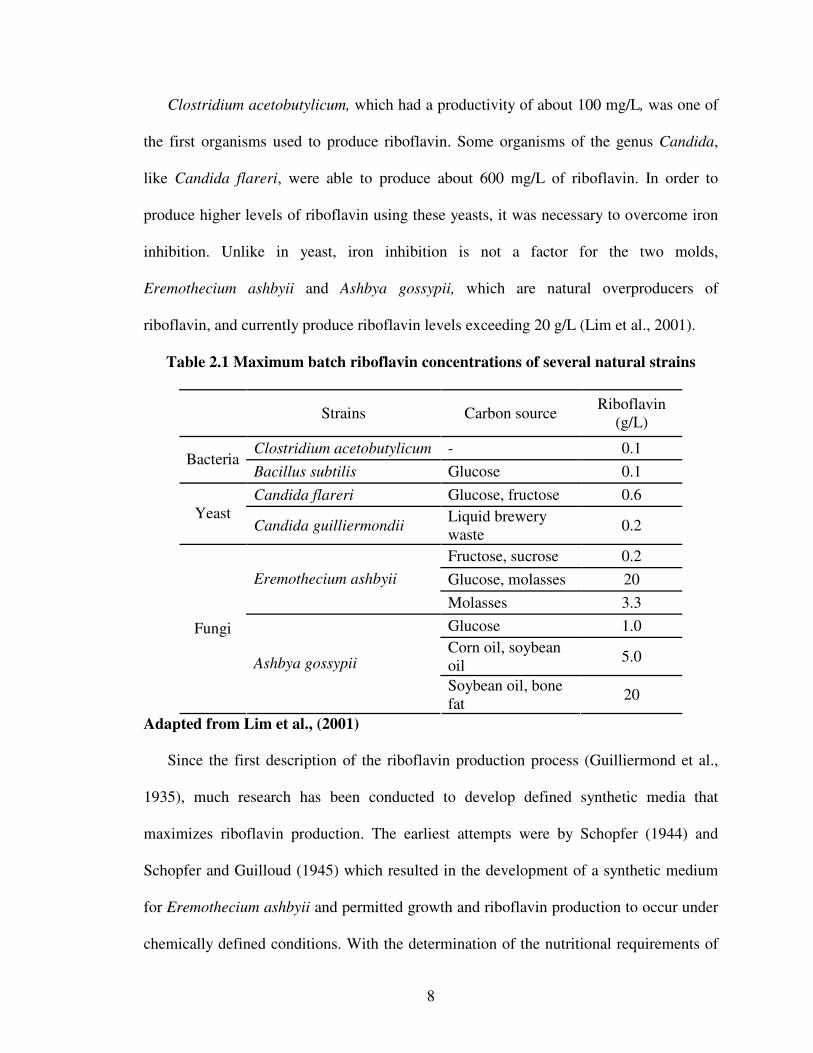
Riboflavin can be synthesized in large enough amounts by some fungi and bacteria to
be exploited successfully on an industrial scale. Table 2.1 shows several riboflavin-
producing microorganisms.
8
Clostridium acetobutylicum, which had a productivity of about 100 mg/L, was one of
the first organisms used to produce riboflavin. Some organisms of the genus Candida,
like Candida flareri, were able to produce about 600 mg/L of riboflavin. In order to
produce higher levels of riboflavin using these yeasts, it was necessary to overcome iron
inhibition. Unlike in yeast, iron inhibition is not a factor for the two molds,
Eremothecium ashbyii and Ashbya gossypii, which are natural overproducers of
riboflavin, and currently produce riboflavin levels exceeding 20 g/L (Lim et al., 2001).
Table 2.1 Maximum batch riboflavin concentrations of several natural strains
Strains Carbon sourceRiboflavin
(g/L)
Clostridium acetobutylicum - 0.1Bacteria
Bacillus subtilis Glucose 0.1
Candida flareri Glucose, fructose 0.6Yeast
Candida guilliermondiiLiquid brewerywaste
0.2
Fructose, sucrose 0.2
Glucose, molasses 20Eremothecium ashbyii
Molasses 3.3
Glucose 1.0Corn oil, soybeanoil
5.0
Fungi
Ashbya gossypii
Soybean oil, bonefat
20
Adapted from Lim et al., (2001)
Since the first description of the riboflavin production process (Guilliermond et al.,
1935), much research has been conducted to develop defined synthetic media that
maximizes riboflavin production. The earliest attempts were by Schopfer (1944) and
Schopfer and Guilloud (1945) which resulted in the development of a synthetic medium
for Eremothecium ashbyii and permitted growth and riboflavin production to occur under
chemically defined conditions. With the determination of the nutritional requirements of
9
several riboflavin producers, it became possible to perform studies on the mechanism of
riboflavin biosynthesis by means of precursors that modify riboflavin yield. Early studies
on increasing riboflavin yields found that the biochemical key to riboflavin
overproduction appears to involve resistance to the repressive effects of iron (Lim et al.,
2001).
Natural overproducers of riboflavin can be divided into three categories based on the
degree of accumulation of the vitamin: weak overproducers, moderate overproducers, and
strong overproducers. Weak overproducers include the bacterial strain Clostridium
acetobutylicum, moderate overproducers include several Candida species, and strong
overproducers include the two molds Eremothecium ashbyii and Ashbya gossygii.
Most bacteria do not overproduce riboflavin (Demain, 1972), however some strains
of Clostridia are weak overproducers. For example, early work by Hickey (1945)
employed Clostridium acetobutylicum to produce riboflavin yields of 100 mg/L. The
process was anaerobic and extremely sensitive to iron, where significant inhibition of
vitamin overproduction occurred at iron levels of 1 ppm.
The moderate overproducing group, as listed by Demain (1972), is composed of
yeasts including Candida flareri (considered synonymous to C. famata by ATCC),
Candida guilliermondii, Candida robusta, Candida ghoshii, Debaryomyces subglobosus,
and Torulopsis famata. These yeasts have been reported to produce approximately 600
mg riboflavin/L (Buzzini and Rossi, 1997). Carbon sources for these overproducers are
glucose, fructose, mannose, sucrose, xylose, arabinose, and acetate. Nitrogen sources are
preferably organic; the compounds most frequently used are asparagine, urea, glycine,
and alanine. These organic nitrogen sources are preferred by some yeast strains while
10
being useless, or sometimes detrimental, to others. For example, adenine is the
appropriate nitrogen source for C. ghoshii, but is inhibitory to C. flareri (Goodwin and
McEvoy, 1959). With the later organism, guanine and xanthine are preferred. Like the
bacteria, yeasts are sensitive to iron toxicity while cobalt and zinc stimulate
overproduction without increasing growth, possibly by reversal of iron inhibition
(Fedorovych et al., 2001).
The most active overproducers known are the two yeast-like ascomycetes molds
Eremothecium ashbyii and A. gossygii. Fermentation by either organism occurs optimally
at 26-28°C, and the process is aerobic and unaffected by iron. The overproduction of
riboflavin by E. ashbyii was discovered by Guilliermond et al. (1935). Since then, much
work has been done on this strain. In the early 1950s, media that produced riboflavin
levels of 200 mg/L were developed (Pfeifer et al., 1950). Currently, yields of 1.5 to 2.5
g/L are possible with crude sources of media. Riboflavin overproduction by E. ashbyii
can be carried out using either carbohydrates or lipids as the carbon source.
Overproduction occurs in chemically-defined media with asparagine as the amino acid of
choice.
The ability of A. gossypii to overproduce riboflavin was discovered in 1946
(Wickerham et al., 1946). After the discovery of A. gossypii, industrial production of
riboflavin by E. ashbyii was replaced by A. gossypii. In early studies, some defined media
were established using Tween 80 and purine, and riboflavin levels of 370 mg/L were pro-
duced with these media (Lim et al., 2001). In later more improved media, the production
of riboflavin reached 1 g/L. Apart from these media, more complex media for industrial
application were studied, and using soybean oil as a carbon source and collagenous
11
protein and corn steep liquor as nitrogen sources, yields of more than 5 g/L are currently
being achieved (Lim et al., 2001).
2.4 Riboflavin Biosynthesis
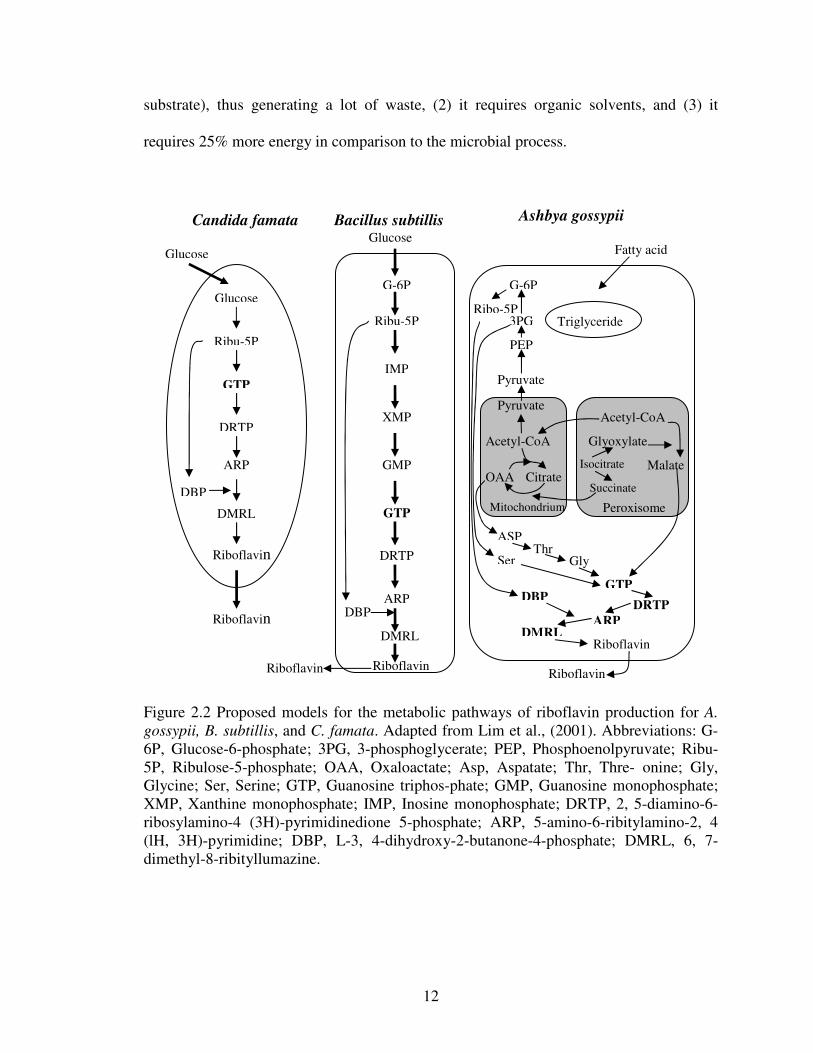
The metabolic pathways of the three kinds of riboflavin overproducers, yeasts, gram-
positive bacteria, and filamentous fungi, are shown in Fig. 2.2 (Lim et al., 2001). C.
famata has a simple pathway from glucose to guanosine triphosphate (GTP), which is the
entrance of riboflavin biosynthesis. Bacilli cells follow a different pathway from yeast,
and convert glucose to guanosine monophosphate (GMP), which is also a precursor of
GTP. Ashbya gossypii uses plant oil, which is obtained by breaking down fatty acids, and
the resulting fatty acids enter to the peroxisomes. Then, several pathways are possible
depending on the specific strain (Figure 2.2)
The resulting metabolites from carbon sources in several riboflavin overproducers
enter the riboflavin biosynthetic pathway. Biosynthesis starts from GTP and the final
product is riboflavin.
2.5 Industrial Production of Riboflavin, Synthetic vs. Microbial Fermentation
Synthetic riboflavin production is a mineral-oil-based process. The process is
described in detail by Stahmann et al. (2000). It starts with D-ribose reacting with 3,4-
xylidine in methanol. This reaction step produces riboside. The riboside formed is
hydrogenated to give N-(3,4-dimethylphenyl)-D-1’-ribamine. This transient product is
coupled with a phenyl diazonium halogenide, which produces an azo compound which is
used in a cyclo-condensation with barbituric acid to give riboflavin. The main
disadvantages of the procedure are: (1) it has a maximum yield of about 60% (from
12
substrate), thus generating a lot of waste, (2) it requires organic solvents, and (3) it
requires 25% more energy in comparison to the microbial process.
Figure 2.2 Proposed models for the metabolic pathways of riboflavin production for A.gossypii, B. subtillis, and C. famata. Adapted from Lim et al., (2001). Abbreviations: G-6P, Glucose-6-phosphate; 3PG, 3-phosphoglycerate; PEP, Phosphoenolpyruvate; Ribu-5P, Ribulose-5-phosphate; OAA, Oxaloactate; Asp, Aspatate; Thr, Thre- onine; Gly,Glycine; Ser, Serine; GTP, Guanosine triphos-phate; GMP, Guanosine monophosphate;XMP, Xanthine monophosphate; IMP, Inosine monophosphate; DRTP, 2, 5-diamino-6-ribosylamino-4 (3H)-pyrimidinedione 5-phosphate; ARP, 5-amino-6-ribitylamino-2, 4(lH, 3H)-pyrimidine; DBP, L-3, 4-dihydroxy-2-butanone-4-phosphate; DMRL, 6, 7-dimethyl-8-ribityllumazine.
Glucose
DBP
Glucose
Ribu-5P
GTP
DRTP
ARP
DMRL
Riboflavin
Riboflavin
Candida famata Bacillus subtillisGlucose
G-6P
Ribu-5P
IMP
XMP
GMP
GTP
DRTP
ARP
DMRL
Riboflavin
DBP
Ashbya gossypii
Fatty acid
Triglyceride
Acetyl-CoA
Malate
Glyoxylate
Isocitrate
Succinate
Peroxisome
Pyruvate
Acetyl-CoA
OAA Citrate
Mitochondrium
G-6P
3PG
PEP
Pyruvate
Ribo-5P
ASPThr
Gly
GTP
Ser
DRTPARP
DMRLRiboflavin
DBP
RiboflavinRiboflavin
13
The first commercial fermentations for riboflavin production were established using
Clostridium acetobutylicum (Meade et al., 1947). In 1965, commercial riboflavin
production by fermentation was started by three companies, but a few years later all three
plants were shut down because it was economically uncompetitive with the chemical
process (Lago and Kaplan, 1981). Merck & Co., Inc. started riboflavin production by
employing A. gossypii in 1974. Currently, yields of up to 15 g/L are being achieved using
mutants of A. gossypii and E. ashbyi (Stahmann et al., 2000). A production plant with A.
gossypii was started by BASF (Germany) in 1990, and in 1996 the chemical process was
finally shut down (BASF 1996).
In 2000, La Roche Ltd replaced its chemical production by a biotechnical process
with genetically enhanced B. subtilis. The plant is currently producing 3000 tons
riboflavin/year and, according to Hoffmann-La Roche, is saving half the costs in
comparison to the chemical process.
While the microbial fermentation process has many potential advantages, one major
disadvantage is the purity of the final product. The 80% pure vitamin B2 produced by
fermentation is suitable for use only in animal feed without further refining. BASF
reported that the cost of purification could exceed 40% of total operating costs in its
plants (Competition Commission, 2001). On the other hand, only about 2% of impurities
need to be removed using the chemically-produced vitamin B2. Therefore, the
purification plant can be significantly smaller. Thus, manufacturers using the chemical
production route to produce vitamin B2 have a significant advantage if they produce the
food-grade product rather than feed-grade vitamin B2.
14
2.6 Recovery of Riboflavin from Fermented Media
A typical recovery process is described in detail by Perlman (1979). After the
fermentation process has been completed, the solids are either dried to a feed-grade
product for animal-feed supplementation or processed to a U.S. pharmaceutical-grade
product for human consumption. For either case, the first step is to adjust the pH of the
fermentation broth to 4.5. If a feed-grade product is required, the broth is concentrated to
30% solids and dried on double-drum driers.
If a pharmaceutical-grade product is needed, insoluble riboflavin must be re-
solubilized before the purification step. The fermented broth is heated for 1 hr at 121°C to
solubilize all the riboflavin. The suspended matter is removed by centrifugation and
riboflavin is recovered by conversion to the less soluble form. Two patented methods
have been described for the purification step, a chemical method (Hines, 1945a) and a
microbiological method (Hines, 1945b). In the microbiological method, the medium
containing dissolved riboflavin is mixed with necessary nutrients and adjusted to pH 5.5-
7.5. The temperature is maintained at 8-47°C, depending on the bacterial species used.
The fermentation is allowed to continue for 18-24 hrs and the precipitate formed
(riboflavin) is centrifuged and collected.
In the chemical method (Hines, 1945a), the solution containing riboflavin is filtered
prior to any treatment. The solution is then adjusted to a pH of 5.0-5.5 before a reducing
agent mixture is added to the solution. The mixture contains compounds such as
Na2S2O4, TiCl3, SnCl2, VSO4, CrCl2, and CrSO4 and the temperature of the solution is
kept at 20-30°C. The riboflavin precursor is thus precipitated and the supernatant liquor
is decanted. The residue is filtered and the filtrate extracted by any well-known method
15
(e.g. 75% isopropyl alcohol). Recovery of riboflavin gives a yield of 70-90.5%. The
precipitated riboflavin is then dissolved in water, a polar solvent, or an alkaline solution
and recovered by re-crystallization from the aqueous or polar solvent, or by acidification
of the alkaline solution.
2.7 Cell Immobilization Technology
Immobilized cell technology has been widely used in a variety of industrial
applications and laboratory experiments. Immobilization is the process of confining cells
in a region or matrix. Various types of cells can be immobilized; examples are bacteria,
yeast, fungi, plant cells, and animal and insect cells. The major advantage of cell
immobilization is the simplification of product recovery because fewer operations are
required for biomass separation/product recovery (Raymond et al., 2004). Therefore, the
application of cell immobilization is a practical solution to reduce the cost of complicated
and expensive product recovery. Other advantages include the retention of catalytic
activities for repeated use and an increase in cell densities while maintaining activity over
a long period of operation (Buzzini and Rossi, 1997). Moreover, the immobilized cells
are retained easily in the bioreactor and, consequently, utilized continuously.
Some immobilized systems have been developed to eliminate inhibition caused by
high concentrations of substrate and product and to enhance productivity and yield of
ethanol production. Accordingly, Takamitsu et al. (1993) showed that ethanol production
in an immobilized cell reactor using Zymomonas mobilis was doubled compared to a
similar suspended reactor system. The work done by Najafpour et al. (2004) aimed at
obtaining high ethanol production with high yield of productivity and, consequently,
lowering the high operating costs. Their results showed that continuous ethanol
16
production in an immobilized cell reactor (ICR) fed with high sugar concentration was
successful. Moreover, glucose concentration as high as 150 g/L did not cause inhibition
while 50 g/L glucose was enough to significantly inhibit a suspended system. Also,
ethanol production increased 5-fold when glucose concentration was doubled from 25 to
50 g/L, and a similar behavior was not observed in the suspended system. The results
indicated that the immobilization of Saccharomyces cerevisiae possesses the capacity not
only to utilize high concentrations of sugar but also to yield higher ethanol productivities
during the course of continuous fermentation.
In addition, work done by Najafpour (1990) showed that if intact microbial cells are
directly immobilized, the removal of microorganisms from downstream product can be
omitted and the loss of cellular activity can be kept to a minimum level. Immobilized
systems were developed as an alternative to expensive and complicated chemical
processes, for example chemical production of xylitol requires high temperature and
pressure and highly purified xylose which makes the process very costly (Cunha et al.,
2007). As an alternative to the chemical process, bioproduction of xylitol from sugarcane
bagasse hydrolysate was investigated (Cunha et al., 2007). They used polyvinyl alcohol
(PVA) hydrogel entrapped C. guilliermondii cells in repeated batches with cell recycling.
Their results showed that hydrogel beads exhibited good mechanical strength which
makes them suitable for long-term use.
The immobilization matrix can be formed into geometries that provide improved
mass transfer within the biological reactor, thus increasing the efficiency of nutrient
supply and product removal. A particularly attractive geometry is the spherical
configuration provided by hollow capsule membranes. The advantage of hollow capsules
17
is the decreased diffusion barrier provided by the interior, which should give rise to rapid
equilibrium and more uniform distribution of substrate in the capsules (Chinnayelka and
McShane, 2004).
Application of immobilized cell systems ranges from wastewater treatment to the
production of therapeutics. These systems have been used to solve problems encountered
in conventional bioreactors using suspended cell culture, including low biomass
concentrations, low biomass productivity and product formation, inefficiency in
continuous production, low stability to sudden fluctuation, and limited dilution rate in the
case of continuous operation (Raymond et al., 2004).
In general, there are three major groups of immobilization techniques:
• Carrier-Binding: the binding of cells or enzymes to water-insoluble carriers.
• Cross-Linking: intermolecular cross-linking of cells or enzymes by bi-functional or
multi-functional reagents.
• Entrapping/Encapsulating: incorporating cells or enzymes into the lattices of a semi-
permeable gel or enclosing the enzymes in a semi-permeable polymer membrane.
Carrier-Binding is the simplest way of preparing immobilized cells or enzymes
(Martinsen et al., 1992). The method relies on non-specific physical interaction between
the enzyme and the surface of the matrix. A major advantage of adsorption is that usually
no reagents and only a minimum of activation steps are required. This method has a
disadvantage that the adsorbed enzyme may leak from the carrier during use due to weak
binding between enzyme and carrier. Another disadvantage is non-specific adsorption of
other proteins or other substances as the immobilized enzyme is used.
18
Cross-linking is the intermolecular immobilization of cells or enzymes either to other
protein molecules or to functional groups on an insoluble support matrix (Martinsen et
al., 1992). Since the cell or enzyme is covalently attached to the support matrix, very
little desorption will occur using this method. Generally, cross-linking is best used in
conjunction with one of the other methods since using this method alone usually results
in relatively low enzymatic activity.
Another method of immobilization is the confining of enzymes or cells within the
lattices of polymerized gels. This allows the free diffusion of low molecular weight
substrates and reaction products (Nguyen and Luong, 1986). Entrapping/encapsulating
methods differ from the carrier-binding and cross linking in that cells or enzymes do not
bind to the gel matrix or membrane. This results in a wide applicability provided that
suitable conditions for the immobilization of various enzymes are chosen.
Polyacrylamide, calcium alginate, and gelatin are three media commonly used in
entrapment techniques. Although many other materials for entrapment exist, all these gels
can be formed with a simple set of equipment and share similar procedures.
Various methods for the entrapment/encapsulation of cells have been reported.
Examples are immobilization by polyacrylamides, polysaccharides, and proteins (Bucke
and Brown, 1983). Table 2.2 shows examples of cell entrapment in polymeric beads.
Immobilization by polyacrylamide was the first gel to be used to entrap living
microbial cells (Bucke and Brown, 1983). The entrapment of cells is achieved by stirring
cell preparations into the polyacrylamide solution and adding a polymerizing agent (e.g.
tetramethyl ethylene diamine) to initiate polymerization. The resultant gel may be shaped
19
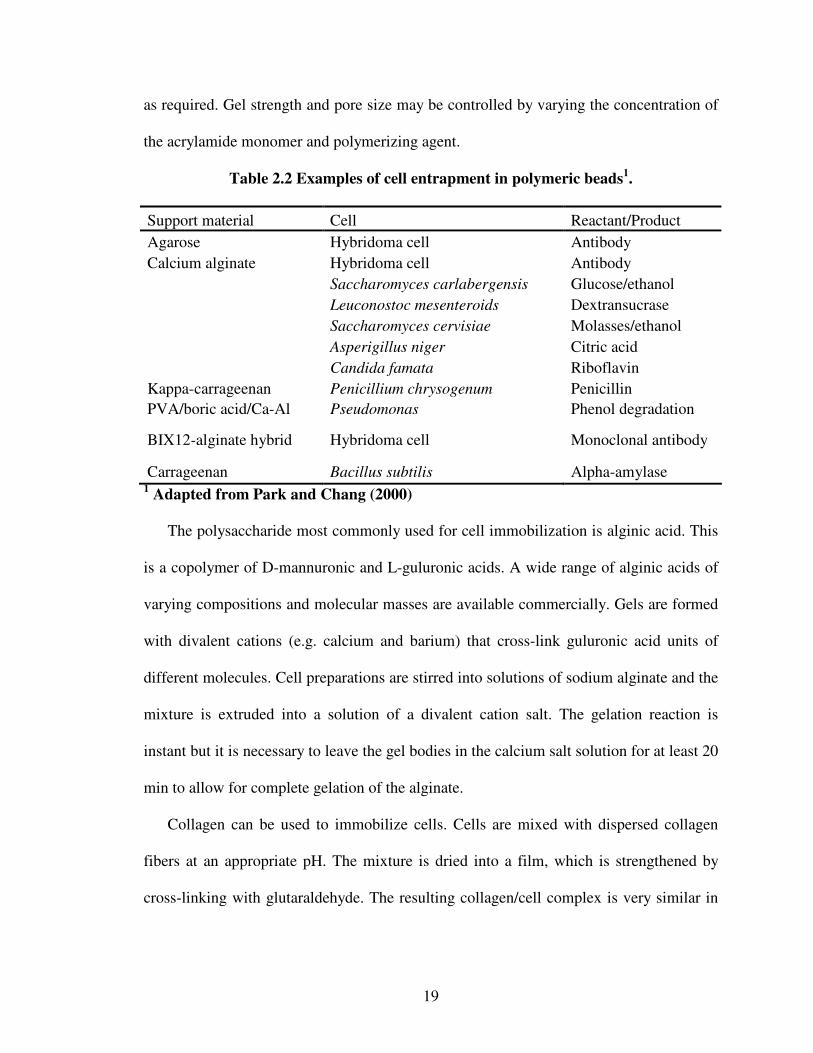
as required. Gel strength and pore size may be controlled by varying the concentration of
the acrylamide monomer and polymerizing agent.
Table 2.2 Examples of cell entrapment in polymeric beads1.
Support material Cell Reactant/ProductAgarose Hybridoma cell AntibodyCalcium alginate Hybridoma cell Antibody
Saccharomyces carlabergensis Glucose/ethanolLeuconostoc mesenteroids DextransucraseSaccharomyces cervisiae Molasses/ethanolAsperigillus niger Citric acidCandida famata Riboflavin
Kappa-carrageenan Penicillium chrysogenum PenicillinPVA/boric acid/Ca-Al Pseudomonas Phenol degradation
BIX12-alginate hybrid Hybridoma cell Monoclonal antibody
Carrageenan Bacillus subtilis Alpha-amylase1 Adapted from Park and Chang (2000)
The polysaccharide most commonly used for cell immobilization is alginic acid. This
is a copolymer of D-mannuronic and L-guluronic acids. A wide range of alginic acids of
varying compositions and molecular masses are available commercially. Gels are formed
with divalent cations (e.g. calcium and barium) that cross-link guluronic acid units of
different molecules. Cell preparations are stirred into solutions of sodium alginate and the
mixture is extruded into a solution of a divalent cation salt. The gelation reaction is
instant but it is necessary to leave the gel bodies in the calcium salt solution for at least 20
min to allow for complete gelation of the alginate.
Collagen can be used to immobilize cells. Cells are mixed with dispersed collagen
fibers at an appropriate pH. The mixture is dried into a film, which is strengthened by
cross-linking with glutaraldehyde. The resulting collagen/cell complex is very similar in
20
general terms to whole mammalian tissues in which cell masses are connected and
supported by collagen.
The major disadvantages of cell entrapment are cell leakage and subsequent growth in
the medium solution and the fact that cells usually grow on the surface and in the pore
spaces of the matrix where the space available for cell growth is limited. To overcome
these problems, cells can be encapsulated instead. Liquid core capsules have some
important advantages for microbial cell immobilization over conventional bead
entrapment. The liquid core gives a larger space for cell immobilization, cells are free to
grow, and mass transfer resistance is reduced inside the capsule. There are several
techniques for encapsulation of cells. The most popular techniques are coacervation and
liquid droplet forming methods.
Coacervation is the phenomenon when a liquid phase separates from a solution,
usually a polymer, and coats a liquid core. The phase separation occurs as a result of
changing some parameters of the system such as temperature, pH, or the addition of a
chemical. The liquid core droplet is called coacervate. The coating material is solidified
by several means including cross-linking.
Klein et al. (1983) developed the liquid droplet forming method by reversing the
procedure of the calcium alginate bead method. Cells are mixed in a solution of calcium
chloride and dropped into a stirred sodium alginate solution. A calcium alginate
membrane is formed instantaneously on the surface of the droplet. Wall thickness, pore
size, and mechanical strength of the capsules can easily be controlled by variation of the
concentrations of alginate and calcium. Table 2.3 shows examples of cell encapsulation
using encapsulation techniques.
21
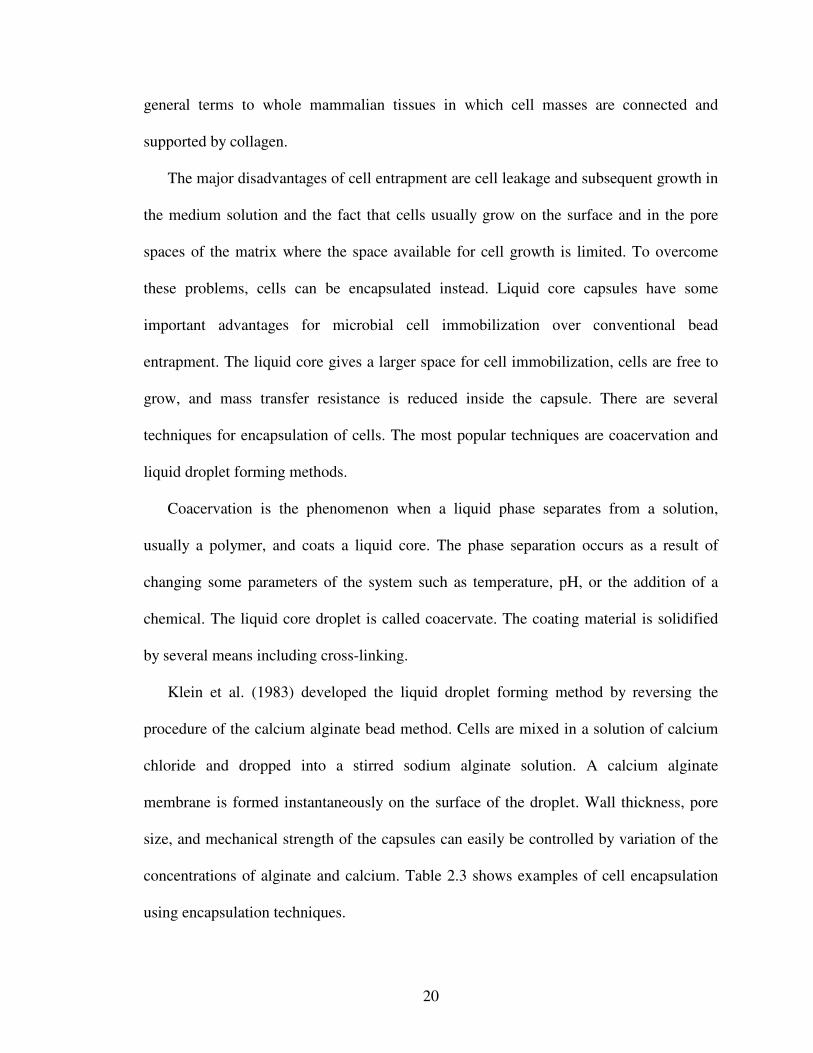
Problems with mass transfer are common in immobilized systems. In fact the success
of an immobilization material is often measured in terms of the extent to which it does
not restrict the diffusion of various solutes into and out of the gel. Thus, it is important to
know how the properties of the immobilizing material affect the transport of various
solutes.
Table 2.3 Applications of various encapsulation techniques1.
Method/material Cell
Pre-gel dissolvingAlginate/poly-L-lysine/alginate E. ColiAlginate/poly-L-lysine/polyethyleneimine Rat pancreatic tissue
Liquid droplet formingPolyacrylate Hybridoma cellCalcium alginate Monkey kidney cell
Interfacial polymerizationChitosan/hexamethylene diisocyanate Lactobacillus caseiGelatine/toluene2,4diisocyanate Lactococcus lactis
CoacervationCollodion Erythrocyte hemolysate
1 Adapted from Park and Chang (2000)
2.8 Characteristics of Calcium Alginate Capsules
An important aspect in immobilized cells is the choice of the support material and the
immobilization procedure. Materials and procedures should be compatible with the
biocatalyst and the process, i.e. the immobilization procedure should be mild, diffusion of
substrates and products in the support material should be relatively easy and the support
material should be stable during the process.
Successful application of an immobilization material is generally measured in terms
of its restriction to the diffusion of solutes into and out of the gel. Thus, it is important to
22
know how the properties of the immobilizing material will affect the transport of solutes
through the gel.
Alginate is used because of its non-toxicity and ability to form hydrogels under mild
conditions. Alginates are linear chains of (1-4)-linked monomers of β-D-mannuronic acid
and α-L-guluronic acid extracted from seaweed. There are different sequences and
compositions of these monomers in the various available types of alginates. The
monomers occur in the alginate chain in blocks. The regions are referred to as M blocks
for poly(mannuronic acid), G blocks for poly(guluronic acid), and MG blocks for
poly(mannuronic-guluronic acid) (Figure 2.3). The differences in the nature of the
linkage between M blocks and G blocks are reflected in the conformation of these
sections in the polymer chain. The M block section is flat while the G block section is
buckled (Clare et al. 1993), which causes the alginate polymer to exhibit different chain
flexibility in solution.
The difference in flexibility comes from the restriction about the carbon-oxygen
bonds joining the monomers (Amsden and Turner, 1999). Moreover, alginate with high
M content is more flexible in solution than alginate with high G content (Whittington,
1971). Also, the greater the content of guluronic acid monomers in the alginate, the
stronger and more brittle the gel is (Clare et al. 1993).
Work done by Martinsen et al. (1992) showed that the greater the M content of the
polymer, the greater the retardation to movement through the gel the solute experiences.
In contrast, the work done by Amsden (1998) showed that the greater the G content of the
gel, the greater the restriction to solute transport.
23
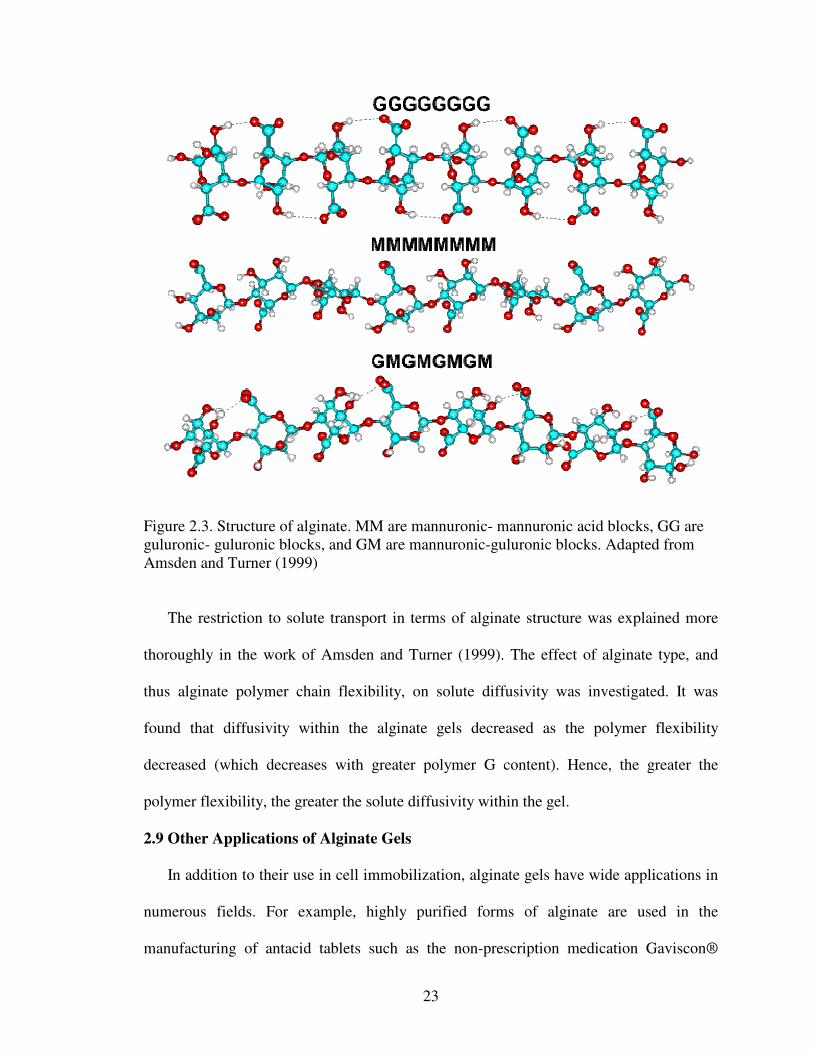
Figure 2.3. Structure of alginate. MM are mannuronic- mannuronic acid blocks, GG areguluronic- guluronic blocks, and GM are mannuronic-guluronic blocks. Adapted fromAmsden and Turner (1999)
The restriction to solute transport in terms of alginate structure was explained more
thoroughly in the work of Amsden and Turner (1999). The effect of alginate type, and
thus alginate polymer chain flexibility, on solute diffusivity was investigated. It was
found that diffusivity within the alginate gels decreased as the polymer flexibility
decreased (which decreases with greater polymer G content). Hence, the greater the
polymer flexibility, the greater the solute diffusivity within the gel.
2.9 Other Applications of Alginate Gels
In addition to their use in cell immobilization, alginate gels have wide applications in
numerous fields. For example, highly purified forms of alginate are used in the
manufacturing of antacid tablets such as the non-prescription medication Gaviscon®
24
which is produced under patent by GlaxoSmithKline Inc. When taken by mouth the
combination of the alginic acid and bicarbonate creates a foam barrier that floats on the
stomach acid.
In the textile industry, alginate is used as a holding fiber. When the cloth is finished,
the alginate is dissolved leaving an open area. It is also used in the food industry, such as
thickening soups and jellies. Calcium alginate is also used in different types of medical
products, including wound dressings. For example, calcium alginate dressings gave
significant protection against infection by pathogenic isolates of Agrobacterium
tumefaciens (Deacon et al., 1988). Calcium alginate acted by physically excluding the
pathogen from wound surfaces.
2.10 Calculation of Diffusion Coefficient
Diffusion is the process by which concentration gradients in a solution spontaneously
decrease due to the Brownian motion of the individual molecules (Pfeifer et al., 1950).
The substrate conversion rate of most immobilized cells depends not only on the
availability of substrates and microbial kinetics, but on the diffusion rate of metabolites
through the immobilized cell system as well (Pu and Yang, 1988). Therefore,
characterization of the internal mass transfer properties may be considered essential for
the modeling, design and scale-up of immobilized cell systems.
Microorganisms that are entrapped in gel beads behave similarly to suspended cells
(Nguyen and Luong, 1986). Immobilization by entrapment often does not affect the
immobilized cells and, therefore, cells exhibit the same kinetics as suspended cells.
Observed differences are generally caused by diffusion limitations (Westrin, 1990.). As a
25
result, the kinetics of immobilized cells are apparently different from suspended cells.
These differences are usually attributed to mass transfer phenomena.
Resistance to mass transfer is, in fact, one of the most common problems imposed by
the gel membrane around the liquid core, especially when diffusion of large substrates is
involved (Nguyen and Luong, 1986). Mass transfer of a substrate to a reaction site or of
product away from it may be impeded and reactor performance may suffer significantly.
The diffusivities of various solutes in calcium alginate beads/capsules have been studied
by several researchers (Nguyen and Luong, 1986; Pu and Yang 1988;Chai et. al., 2004).
For example, Pu and Yang (1988) determined the diffusion coefficient of sucrose and
yohimbine in calcium alginate beads. The results showed that cell-free beads showed
little mass transfer resistance to both solutes. Therefore, the effective diffusion coefficient
was affected significantly by the concentration of cells in the beads since, according to
their results, diffusivity decreased sharply as the concentration of cells increased.
One of the most important factors that affect mass transfer, other than capsule size, is
the pore size of the gel membrane (Nguyen and Luong, 1986; Chai et. al., 2004). Thus
mass transfer can be enhanced by making the beads more porous. The drawback of such
an attempt is the increased possibility of cell/biocatalyst leakage. The work done by Wan
et al. (1992) showed that the hydrophile-lipophile balance (HLB) of some surfactants
influenced the rate of drug release from alginate microspheres. However, no definite
conclusion about the effect of HLB on diffusivity could be drawn.
Consequently, quantifying diffusivity (i.e. diffusion coefficient) is essential for
predicting immobilized reactor system performance. Several experimental approaches
may be used for the determination of diffusion coefficients of immobilized cell supports.
26
An ideal method for the measurement of diffusion coefficients in immobilized cell
systems does not exist, so depending on the shape of the immobilized cell support and the
required precision, the best method has to be chosen. These methods are grouped as
steady-state concentration gradient methods, non-steady-state concentration gradient
methods, and instrumental methods (Westrin et al., 1994).
The steady-state diaphragm cell is an example of the steady-state concentration
gradient method (Westrin et al., 1994). In this method, a diffusional steady-state flux is
set up through a gel diaphragm separating two liquid-filled, stirred compartments. The
steady-state approach has a constant upstream and a zero downstream diffusant
concentration, while the pseudo-steady-state diaphragm cell allows concentration
variation in the compartments. The time-lag diaphragm cell, the uptake/release from gel
bodies dispersed in a stirred solution, the concentration profile in a semi-infinite slab, and
the finite couples methods are all examples of the non-steady-state concentration gradient
methods (Westrin et al., 1994).
The time-lag diaphragm cell method uses similar equipment as the steady-state
diaphragm cell method. The upstream diffusant concentration is constant, while the
downstream compartment and the gel diaphragm are initially free from diffusant.
In the uptake/release from gel bodies dispersed in a stirred solution method, the
decrease or increase in diffusant concentration in the liquid phase is measured, and the
diffusion coefficient D is obtained. Applications include uptake or release from gel beads
and cylinders or discs dispersed in a finite, stirred solution (Westrin, 1990).
Methods that use a concentration profile in a semi-infinite slab focus on the
concentration profile inside an initially diffusant-free gel slab in contact with a liquid
27
solution containing the diffusant. Unlike all the methods presented above, the method of
finite couples employs one single measurement of the mean concentration in an initially
diffusant-free slab placed in contact with an initially diffusant-containing slab.
Instrumental methods used to calculate diffusion coefficients are often expensive,
complicated, and require highly skilled technicians. Examples of such methods are: the
Fourier transform pulsed-gradient spin-echo (FT-PGSE) method, the dynamic light
scattering method, and the holographic relaxation spectroscopy method. These methods
do not measure diffusion coefficient directly; rather they measure a parameter, like the
frequency of scattered light in the dynamic light scattering method, and the diffusion
coefficient is deduced.
2.11 Literature Cited
Amsden B. 1998. Solute diffusion within hydrogels. Mechanisms and models.Macromol 31(23): 8382-8395.
Amsden B, Turner N. 1999. Diffusion characteristics of calcium alginate gels.Biotechnol Bioeng 65(5): 605-610
Bacher A, Eberhardt S, Fischer M, Kis K, Richter G. 2000. Biosynthesis of Vitamin B2(Riboflavin). Ann Rev Nutr 20 153-167.
BASF. 1996. http://www.basf.com/corporate/index.html
Bucke C, Brown DE. 1983. Immobilized cells. Philosoph Trans Royal Soc London.Series B, Biol Sci 300(1100): 369-389.
Buzzini P, Rossi J. 1997. Riboflavin production by yeasts as an alternative approach forthe utilization of agro-industrial residues. Agro-Food-Ind Hi-Tech 8(5): 30-32.
Chai Y, Mei LH, Lin DQ, Yao SJ. 2004. Diffusion coefficients in intrahollow calciumalginate microcapsules. J Chem Eng Data 49: 475-478.
Chandra TS, Kalingan AE, Krishnan MRV. 1996. Fungal fermentation of agro-industrialwastes to produce riboflavin. Indi Chem Eng, Section A: J Indi Inst Chem Eng 38(2):43-47.
28
Chinnayelka S, McShane MJ. 2004. Glucose-Sensitive Nanoassemblies ComprisingAffinity-Binding Complexes Trapped in Fuzzy Microshells. J Fluores 14(5): 585-595.
Clare K, Winston PE Jr, Dial HD, Ortega TM. 1993 Alginate -gum-polymer film-formingsize composition. Eur Pat Appl 5 pp.
Competition Commission. 2001. BASF AG and Takeda Chemical Industries Ltd: Areport on the acquisition by BASF AG of certain assets of Takeda ChemicalIndustries Ltd.http://www.competition-commission.org.uk/rep_pub/reports/2001/456basftake.htm
Cunha MAA, Rodrigues RCB, Santos JC, Converti A, da Silva SS. 2007. Repeated-BatchXylitol Bioproduction Using Yeast Cells Entrapped in Polyvinyl Alcohol-Hydrogel.Curr Microbiol 54(2): 91-96.
Deacon JW, MacDonald RK, Fox FM, Lascaris D. 1988. Application of alginate gel forprotection of wounds against crown gall (Agrobacterium tumefaciens). Plant Path 37(4): 522–528.
Demain, AL. 1972. Riboflavin oversynthesis. Ann Rev Microbiol 26: 369-88.
Fedorovych D, Kszeminska H, Babjak L, Kaszycki P, Koloczek H. 2001. Hexavalentchromium stimulation of riboflavin synthesis in flavinogenic yeast. BioMetals 14(1):23-31.
Goodwin TW, McEvoy D. 1959. Biosynthesis of riboflavin. V. General factorscontrolling flavinogenesis in the yeast Candida flareri. Biochem J 71: 742-748.
Graham JM, Peerson JM, Haskell MJ, Shrestha RK, Brown KH, Allen LH. 2005.Erythrocyte riboflavin for the detection of riboflavin deficiency in pregnant Nepaliwomen. Clin Chem 51: 2162-2165.
Guilliermond A, Fontaine M, Raffy A. 1935. The existence of a yellow pigment in theEremothecium ashbyii related to the group of flavins. Compt rend 201: 1077-1080.
Hickey R Jr. 1945. The inactivation of iron by 2,2'-bipyridine and its effect on riboflavinsynthesis by Clostridium acetobutylicum. Arch Biochem 8: 439-447.
Hines GE Jr. 1945a. U.S. Patent 2,367,644
Hines GE Jr. 1945b. U.S. Patent 2,387,023
Klein J, Stock J, Vorlop KD. 1983. Pore size and properties of spherical calcium alginatebiocatalysts. Eur J App Microbiol Biotechnol 18(2): 86-91.
29
Lago BD, Kaplan L. 1981. Vitamin fermentations: B2 and B12. Adv. Biotechnol [ProcInt Ferment Symp] 6th Meeting Date 1980 3: 241-246.
Lim SH, Choi JS, Park EY. 2001. Microbial production of riboflavin using riboflavinoverproducers, Ashbya gossypii, Bacillus subtilis, and Candida famata. An overview.Biotechnol Bioproc Eng 6(2): 75-88.
Martinsen A, Storroe I, Skjaak-Braek G. 1992. Alginate as immobilization material: IIIdiffusional properties. Biotechnol Bioeng 39(2): 186-194.
Meade RE, Pollard HL, Rodgers NE. 1947. Riboflavin from lacteal material U.S. Patent2433063.
Najafpour G. 1990. Immobilization of microbial cells for the production of organic acids.J Sc 1(3): 172-176.
Najafpour G, Younesi H, Syahidah KK. 2004. Ethanol fermentation in an immobilizedcell reactor using Saccharomyces cerevisiae. Biores Technol 92(3): 251-260.
Nguyen A, Luong J. 1986. Diffusion in k-carrageenan gel beads. Biotechnol Bioeng 28:1261-1266.
Park JK, Chang HN. 2000. Microencapsulation of microbial cells. Biotechnol Adv. 18(4):303-19.
Perlman D. 1979. Microbial process for riboflavin production. Microb Technol (2nd Ed.)1: 521-527.
Pfeifer VF, Tanner FW Jr., Vojnovich C, Traufler DH. 1950. Riboflavin by fermentationwith Ashbya gossypii. J Ind Eng Chem 42: 1776-1781.
Pu HT, Yang RYK. 1988. Diffusion of sucrose and yohimbine in calcium alginate gelbeads with or without entrapped plant cells. Biotechnol Bioeng 32: 891-896.
Raymond MC, Neufeld RJ, Poncelet D. 2004. Encapsulation of brewers yeast in chitosancoated carrageenan microspheres by emulsification/thermal gelation. Artif cells,blood subst, and immobil biotechnol 32(2): 275-291.
La Roche Ltd. 2007. Comments for the Codex Committee on Nutrition and Foods forSpecial Dietary Uses (CCNFSDU).
http://www.fsis.usda.gov/OPPDE/Comments/03-024N/03-024N-2.pdf
Schopfer WH. 1944. Biotin, aneurine, and meso-inositol, as growth factors forEremothecium ashbyii Guillermond. The biosynthesis of riboflavin. Helv Chimi Acta27: 1017-1032.
30
Schopfer WH, Guilloud M. 1945. The action of sulfanilamides on the flavine formationof Eremothecium ashbyii. Experientia 1: 333-334.
Stahmann KP, Revuelta JL, Seulberger H. 2000. Three biotechnical processes usingAshbya gossypii, Candida famata, or Bacillus subtilis compete with chemicalriboflavin production. App Microbiol Biotechnol 53(5): 509-516.
Takamitsu I, Izumida H, Akagi Y, Sakamoto M. 1993. Continuous ethanol fermentationin molasses medium using Zymomonas mobilis immobilized in photo-cross linkableresin gels. J Ferment Bioeng 75: 32–35.
Wan LSC, Heng PWS, Chan LW. 1993. Influence of hydrophile-lipophile balance onalginate microspheres. Int J Pharma 95: 77-83.
Westrin BA. 1990. Measurement of the diffusion coefficient of ethanol in agarose gelbeads: a reproducibility study. Biotechnol Tech 4(6): 409-414.
Whittington SG. 1971. Conformational energy calculations on alginic acid. I: Helixparameters and flexibility of the homopolymers. Biopol 10(9): 1481-1489.
Wickerham LJ, Flickinger MH, Johnston RM. 1946. The production of riboflavin byAshbya gossypii. Arch Biochem 9: 95-98.
31
CHAPTER IIIEFFECT OF NONIONIC SURFACTANTS ON THE DIFFUSIONAL
PROPERTIES OF HYDROGEL CAPSULES
3.1 Abstract
Calcium alginate capsules were prepared using nonionic surfactants having various
hydrophile-lipophile balance (HLB) values. The effect of the various nonionic surfactants
on the diffusion of glucose and riboflavin through hollow capsules was investigated using
the uptake release from gel bodies method developed by Nguyen and Luong (1986). The
addition of surfactants increased the average thickness of the capsule membranes from 97
µm for control capsules to 148 µm for capsules made with a surfactant mixture having an
HLB of 1.8. Moreover, the addition of surfactants increased the average diameter of
capsules from 0.29 cm for controls to 0.35 cm for capsules made with a surfactant
mixture having an HLB of 5.94. The addition of a surfactant with high HLB (16.7)
increased the combined diffusion coefficient of glucose by 66% compared to controls. In
contrast, the addition of a surfactant with low HLB (1.8) increased the combined
diffusion coefficient of riboflavin by 65% compared to controls. The results show that
diffusion through the membrane is the controlling factor for all cases tested and the
increase in diffusion coefficients of glucose and riboflavin could be due to the increase in
membrane porosity.
32
3.2 Introduction
Riboflavin (Vitamin B2), a water-soluble vitamin, is essential for converting food
into energy and for the metabolism and growth of humans and animals. Riboflavin can be
produced commercially by either chemical synthesis or fermentation processes. The
microbial method has become the preferred method in recent years due to advances in
metabolic and genetic engineering (Özbaş and Kutsal, 1991). Immobilization of cells and
enzymes has also gained increasing interest in recent years. As a result, different methods
of immobilization have been investigated. Immobilization based on chemical binding or
physical retention are the two main types of immobilization, each with its own
advantages and limitations. Various methods for immobilization by physical retention
exist in the literature (Hartmeyer, 1988; Brodelius & Mosbach, 1982, Cheetham et al.,
1979). Among them, immobilization by calcium alginate is generally preferred because
of the mild immobilization conditions, rapid gelation, low cost, and simplicity of
preparation.
Cells can be immobilized by calcium alginate either by entrapment inside a lattice-
type structure or by encapsulation inside a spherical shell that consists of a cell-free
calcium alginate membrane. The major advantage of encapsulation over entrapment on a
solid matrix is that cells are free to grow inside the liquid core structure while allowing a
more uniform substrate/cell contact (Chai et. al, 2004). One common problem imposed
by the gel membrane around the liquid core is the resistance to mass transfer, especially
when diffusion of large substrates is involved (Nguyen and Luong, 1986). Mass transfer
of a substrate to a reaction site or of product away from it may be impeded and reactor
33
performance may suffer significantly. Consequently, quantifying diffusion is essential for
predicting immobilized reactor system performance.
One of the most important factors that affect mass transfer, other than capsule size, is
the pore size of the gel membrane (Nguyen and Luong, 1986; Chai et. al., 2004). Thus
mass transfer can be enhanced by making the beads more porous. The drawback of such
an attempt is the increased possibility of cell/biocatalyst leakage. Work done by Wan et
al. (1993) showed that the hydrophile-lipophile balance (HLB) of some surfactants
influenced the rate of drug release from alginate microspheres. However, no definite
conclusion about the effect of HLB on diffusivity could be drawn.
The main purpose of this work was to examine the effect of HLB of various
surfactants on the diffusivity of riboflavin and glucose through hollow calcium
alginate/chitosan capsules. Diffusion coefficients of riboflavin and glucose through
hollow capsules have not been previously reported.
3.3 Experimental Methods
Experimental Setup
Batch experiments were performed to evaluate the effects of nonionic surfactants on
diffusion of glucose and riboflavin through calcium alginate capsules. Parameters of
interest were diffusion rates of glucose and riboflavin, membrane thickness and diameter
of capsules, and surface texture of capsules. Riboflavin was added to the
CaCl2/Chitosan/PEG mixture prior to mixing with cells and riboflavin release rates were
measured. These data were used to calculate the diffusion coefficient of riboflavin from
capsules. Finally, reduction of glucose concentration in solution was measured with time
as well and these data were used to measure glucose diffusion into the capsules.
34
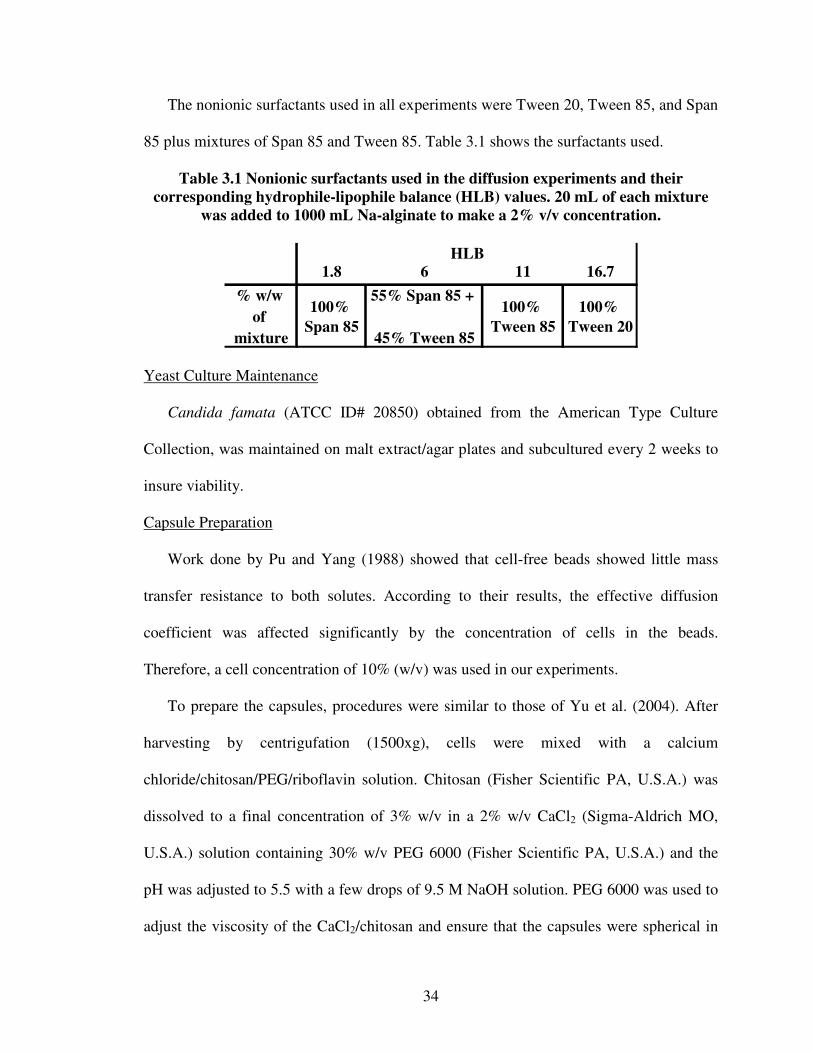
The nonionic surfactants used in all experiments were Tween 20, Tween 85, and Span
85 plus mixtures of Span 85 and Tween 85. Table 3.1 shows the surfactants used.
Table 3.1 Nonionic surfactants used in the diffusion experiments and theircorresponding hydrophile-lipophile balance (HLB) values. 20 mL of each mixture
was added to 1000 mL Na-alginate to make a 2% v/v concentration.
1.8 6 11 16.7
% w/wof
mixture
100%Span 85
55% Span 85 +
45% Tween 85
100%Tween 85
100%Tween 20
HLB
Yeast Culture Maintenance
Candida famata (ATCC ID# 20850) obtained from the American Type Culture
Collection, was maintained on malt extract/agar plates and subcultured every 2 weeks to
insure viability.
Capsule Preparation
Work done by Pu and Yang (1988) showed that cell-free beads showed little mass
transfer resistance to both solutes. According to their results, the effective diffusion
coefficient was affected significantly by the concentration of cells in the beads.
Therefore, a cell concentration of 10% (w/v) was used in our experiments.
To prepare the capsules, procedures were similar to those of Yu et al. (2004). After
harvesting by centrigufation (1500xg), cells were mixed with a calcium
chloride/chitosan/PEG/riboflavin solution. Chitosan (Fisher Scientific PA, U.S.A.) was
dissolved to a final concentration of 3% w/v in a 2% w/v CaCl2 (Sigma-Aldrich MO,
U.S.A.) solution containing 30% w/v PEG 6000 (Fisher Scientific PA, U.S.A.) and the
pH was adjusted to 5.5 with a few drops of 9.5 M NaOH solution. PEG 6000 was used to
adjust the viscosity of the CaCl2/chitosan and ensure that the capsules were spherical in
35
shape. Riboflavin (50 mg/L) was added to the final solution prior to extrusion. The 2%
w/v alginic acid solution was prepared by dispersing 20 g of alginate (Sigma-Aldrich
MO, U.S.A.) in enough deionized water to make 1L. The CaCl2/chitosan/PEG solution
containing the cells was extruded dropwise via a 30 mL syringe equipped with a 26G
needle into the stirred alginate solution containing 2% (v/v) of a nonionic surfactant.
After a reaction period of 20 min, the beads were collected and washed with deionized
water and hardened for 15 min in 1% CaCl2 solution.
Capsule Measurement
The average diameter of the capsules was measured by lining up 20 capsules along a
ruler (Wijffels et al., 1995). To determine the membrane thickness, the capsules were
freeze-dried, cut in half using a blade scalpel (Fisher Scientific PA, U.S.A.), transferred
to a scanning electron microscope (JEOL-JSM 6360, Japan), and the membrane thickness
was measured in three different locations. To investigate the effect of surfactants on
porosity, three capsules were randomly taken and prepared for SEM as mentioned above.
Photos of the surface texture (×30) as well as membrane thickness (×200 to ×220) were
taken at various locations.
Riboflavin Concentration
To determine the initial concentration of riboflavin (Fisher Scientific PA, U.S.A.) in
the capsules (the initial concentration of riboflavin, C0, was different in each case
depending on encapsulation efficiency), capsules were dissolved in a 5% w/v solution of
sodium hexametaphosphate (Buzzini and Rossi, 1997). The solution was then centrifuged
at 1750 g, and a 2 mL sample was collected and filtered through a 0.2 µm membrane
filter (Whatman Inc. NJ, U.S.A.). The concentration of riboflavin was measured by
36
absorbance at 446 nm where 0.5 mL was withdrawn from the flask and transferred to a 2
mL centrifuge tube containing 0.5 mL deionized water. The tube then was centrifuged for
5 min at 1500 rpm and the supernatant was carefully withdrawn and filtered into a 2 mL
cuvette. Absorbance readings were taken at 446 nm using a UV-vis spectrophotometer
(Cary 50 Bio, Varian Inc., U.S.A.) and concentration of riboflavin was determined using
a calibration curve.
Glucose Concentration
To determine the concentration of glucose in solution, samples were prepared as
above. The concentration was determined by a liquid chromatograph (Agilent
technologies, U.S.A.) equipped with a refractive index detector (RID-G1362A).
Separation was achieved with a Biorad Aminex® HPX-87P ion exchange column (85°C).
Mobile phase was deionized water at 0.6 mL/min.
Diffusivity Measurements
Diffusivity measurements were conducted at 30°C in 250 mL Erlenmeyer flasks
equipped with three baffles. Temperature was maintained at 30°C using a Fisher
Isotemp incubator (Fisher Scientific PA, U.S.A.). The flask containing 30 g/L glucose
(50 mL liquid volume) was placed on an orbital shaker at 200 rpm. A determined number
of capsules was suspended in the substrate solution such that the number of capsules
chosen gave a capsule-to-liquid ratio of 0.35 w/v. Due to the concentration gradients,
glucose diffused into the capsules and riboflavin diffused out. The diffusion coefficients
of glucose and riboflavin were determined from their change in the concentrations.
The concentration of a solute due to its diffusion into a solute-free spherical solid
bead (C(t)) is given by Crank (1956) as follows:
37
( ) ( )( )
+++
++
= ∑∞
=
−
122
0
19
161
1
2
2
n n
r
tqD
q
eCtC
ne
ααα
αα
where r is the radius of the sphere, t is time, D is the diffusion coefficient, α is the
ratio of the liquid volume to bead volume, and qn is the positive nonzero root of:
23
3tan
n
nn q
α+=
Similarly, the concentration of a solute due to its diffusion from the bead into a
solute-free solution is given by:
( ) ( )( )
+++
−+
= ∑∞
=
−
122
0
19
161
1
2
2
n n
r
tqD
q
eCtC
ne
αααα
α
When it comes to hollow capsules, however, the diffusivity through their membranes
(D1) is different than that through the liquid core inside the capsule (D2). Diffusion in this
case is more complex. Therefore, the capsule is assumed as a solid sphere and the
diffusion coefficient (D) in equations 1 and 3 can be substituted by a combined diffusion
coefficient Dm (Chai et al., 2004). Dm is defined as the combination of diffusivity in the
membrane and diffusivity in the liquid core and the relationship between Dm, D1, and D2
is given as (Chai et al., 2004):
21 D
r
D
rrr
Daab
bm
+−
=
Where ra and rb are the internal and external radii respectively. It is assumed also that
the diffusion process in the liquid core of the capsules is considered as that in pure water
hence, D2 = Dw. Using this assumption, D1 can be calculated after Dm has been
38
determined. The values of Dw for glucose and riboflavin are 3.77×10⁻⁴ and 4.34×10⁻⁴
cm2/min respectively (Yamamoto et al., 2005).
Statistical Analysis
Statistical comparison was performed using Student's t-test for the comparison of two
means. A significance level of 0.05 was chosen. Microsoft Excel was used to calculate
the means and standard deviation.
3.4 Results and Discussion
Diffusion Measurements
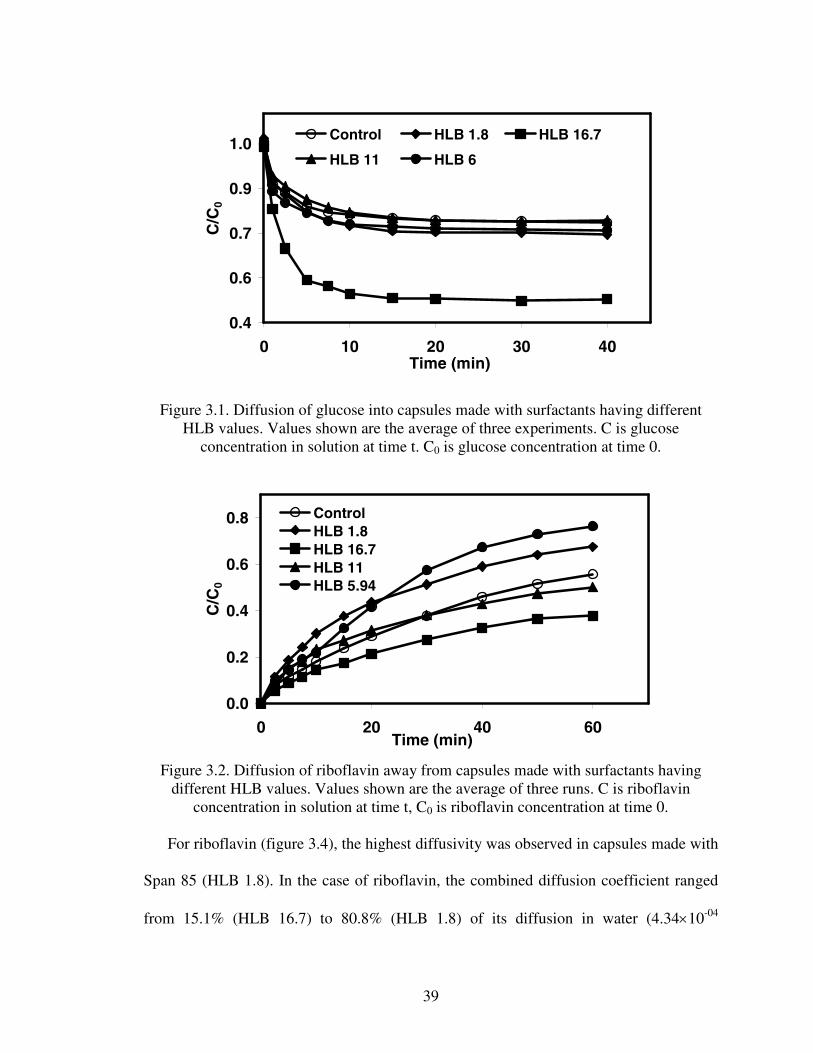
Diffusion of glucose and riboflavin through capsules is shown in Figures 3.1 and 3.2
respectively. Each experiment was run in triplicate. Figures 3.1 and 3.2 show that
concentration of the bulk solutions decreased sharply immediately after the addition of
capsules, then after 10 minutes the decrease gradually leveled off. Figure 3.1 also shows
that the relative glucose concentration was the lowest in the flasks containing Tween 20
(HLB 16.7).
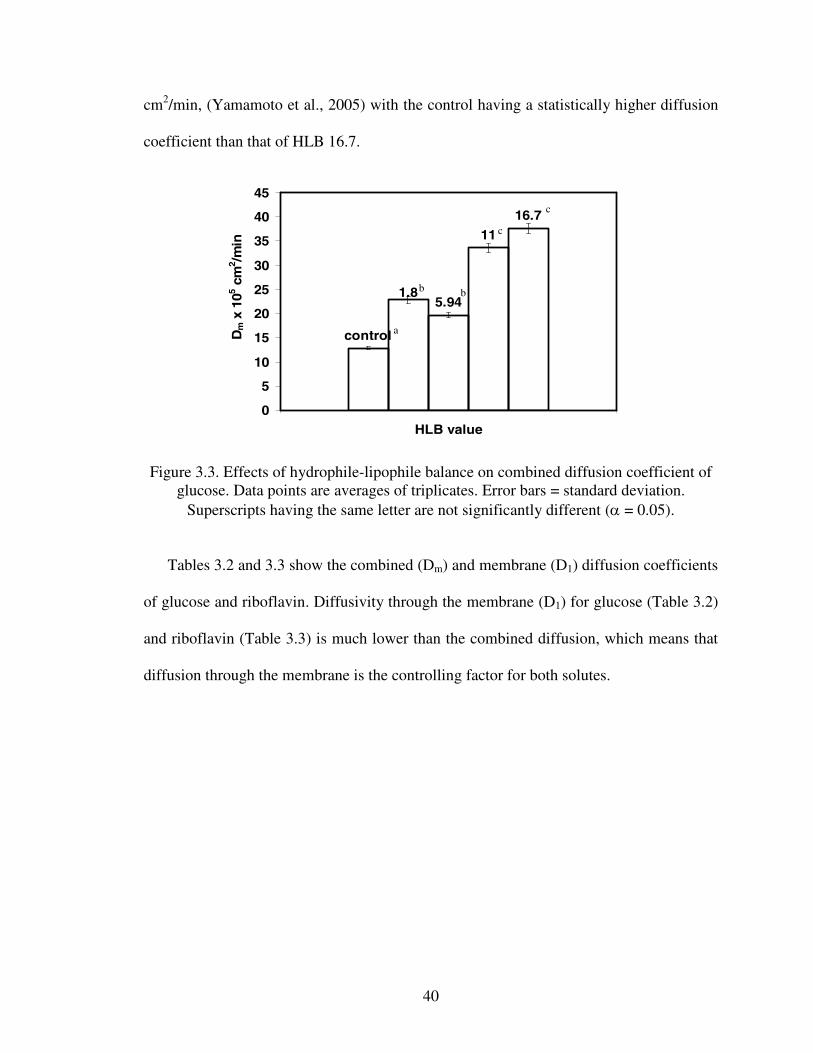
Diffusion coefficients were calculated using Mathematica 5.2 (2005). The average
values of Dm for glucose and riboflavin are shown in Figures 3.3 and 3.4 respectively.
Figure 3.3 shows that capsules made with Tween 20 (HLB 16.7) had the highest glucose
diffusivity.
39
0.4
0.6
0.7
0.9
1.0
0 10 20 30 40Time (min)
C/C
0
Control HLB 1.8 HLB 16.7
HLB 11 HLB 6
Figure 3.1. Diffusion of glucose into capsules made with surfactants having differentHLB values. Values shown are the average of three experiments. C is glucose
concentration in solution at time t. C0 is glucose concentration at time 0.
0.0
0.2
0.4
0.6
0.8
0 20 40 60Time (min)
C/C
0
ControlHLB 1.8HLB 16.7HLB 11HLB 5.94
Figure 3.2. Diffusion of riboflavin away from capsules made with surfactants havingdifferent HLB values. Values shown are the average of three runs. C is riboflavin
concentration in solution at time t, C0 is riboflavin concentration at time 0.
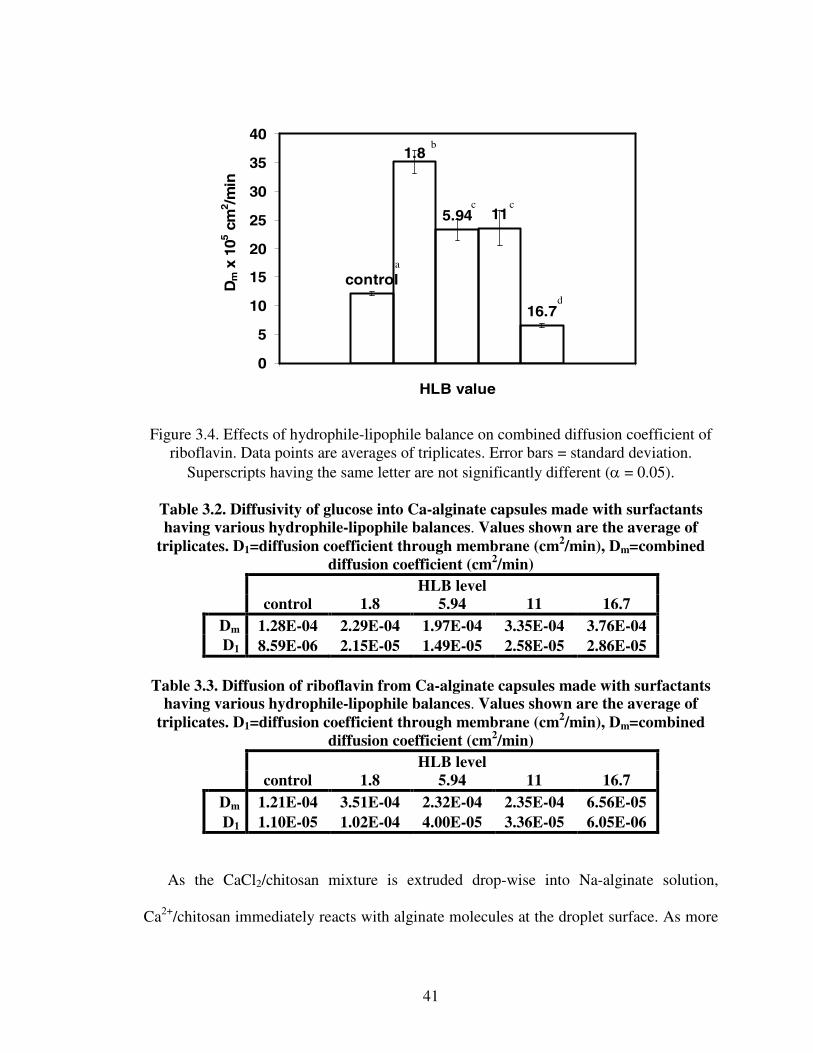
For riboflavin (figure 3.4), the highest diffusivity was observed in capsules made with
Span 85 (HLB 1.8). In the case of riboflavin, the combined diffusion coefficient ranged
from 15.1% (HLB 16.7) to 80.8% (HLB 1.8) of its diffusion in water (4.34×10-04
40
cm2/min, (Yamamoto et al., 2005) with the control having a statistically higher diffusion
coefficient than that of HLB 16.7.
control
5.94
11
16.7
1.8
0
5
10
15
20
25
30
35
40
45
HLB value
Dm
x10
5cm
2 /min
Figure 3.3. Effects of hydrophile-lipophile balance on combined diffusion coefficient ofglucose. Data points are averages of triplicates. Error bars = standard deviation.
Superscripts having the same letter are not significantly different (α = 0.05).
Tables 3.2 and 3.3 show the combined (Dm) and membrane (D1) diffusion coefficients
of glucose and riboflavin. Diffusivity through the membrane (D1) for glucose (Table 3.2)
and riboflavin (Table 3.3) is much lower than the combined diffusion, which means that
diffusion through the membrane is the controlling factor for both solutes.
a
b b
c
c
41
control
5.94 11
16.7
1.8
0
5
10
15
20
25
30
35
40
HLB value
Dm
x10
5cm
2 /min
Figure 3.4. Effects of hydrophile-lipophile balance on combined diffusion coefficient ofriboflavin. Data points are averages of triplicates. Error bars = standard deviation.
Superscripts having the same letter are not significantly different (α = 0.05).
Table 3.2. Diffusivity of glucose into Ca-alginate capsules made with surfactantshaving various hydrophile-lipophile balances. Values shown are the average of
triplicates. D1=diffusion coefficient through membrane (cm2/min), Dm=combineddiffusion coefficient (cm2/min)
HLB levelcontrol 1.8 5.94 11 16.7
Dm 1.28E-04 2.29E-04 1.97E-04 3.35E-04 3.76E-04D1 8.59E-06 2.15E-05 1.49E-05 2.58E-05 2.86E-05
Table 3.3. Diffusion of riboflavin from Ca-alginate capsules made with surfactantshaving various hydrophile-lipophile balances. Values shown are the average of
triplicates. D1=diffusion coefficient through membrane (cm2/min), Dm=combineddiffusion coefficient (cm2/min)
HLB levelcontrol 1.8 5.94 11 16.7
Dm 1.21E-04 3.51E-04 2.32E-04 2.35E-04 6.56E-05D1 1.10E-05 1.02E-04 4.00E-05 3.36E-05 6.05E-06
As the CaCl2/chitosan mixture is extruded drop-wise into Na-alginate solution,
Ca2+/chitosan immediately reacts with alginate molecules at the droplet surface. As more
a
b
c c
d
42
contact time is allowed, more Ca2+/chitosan diffuses outward and reacts to form the
insoluble membrane. The presence of surfactants in the Na-alginate solution during the
formation of capsules may have caused more or less resistance (depending on the HLB
number of the surfactant) to subsequent Ca2+/chitosan, resulting in a Ca2+/chitosan
gradient as the reaction progressed outward. As the resistance increases (with different
HLB number) the gradient increases and the structure becomes less uniform and more
porous.
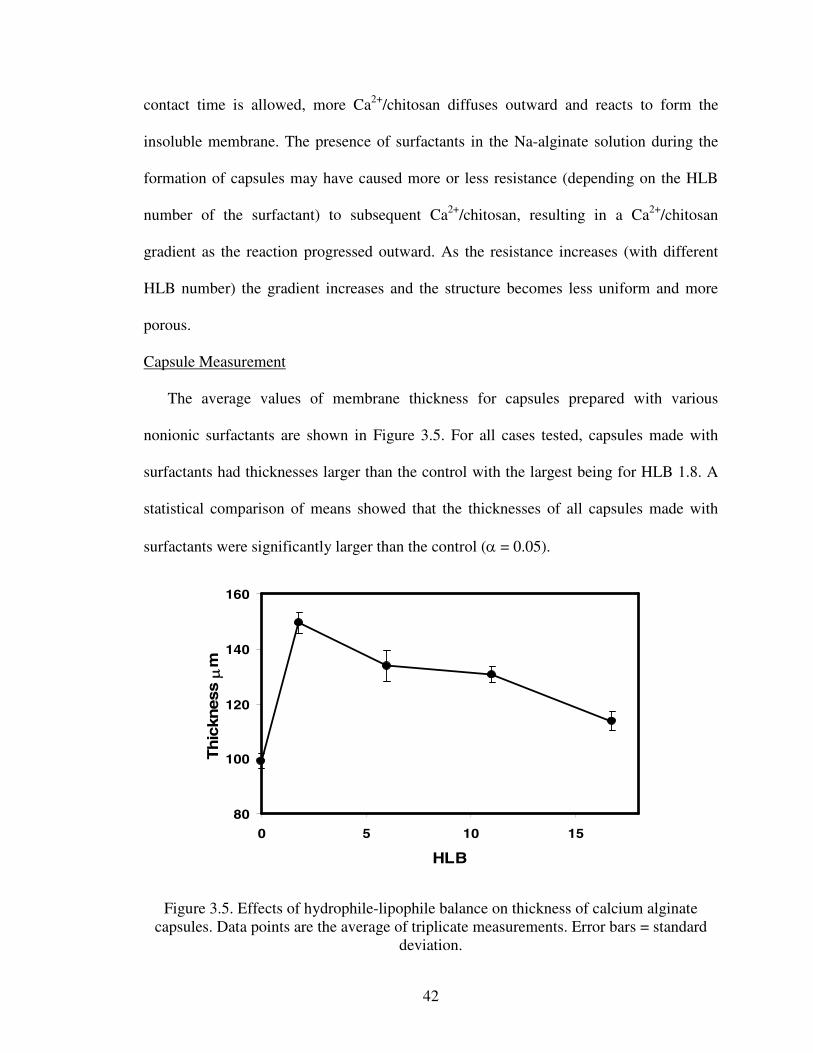
Capsule Measurement
The average values of membrane thickness for capsules prepared with various
nonionic surfactants are shown in Figure 3.5. For all cases tested, capsules made with
surfactants had thicknesses larger than the control with the largest being for HLB 1.8. A
statistical comparison of means showed that the thicknesses of all capsules made with
surfactants were significantly larger than the control (α = 0.05).
80
100
120
140
160
0 5 10 15
HLB
Th
ickn
essµ
m
Figure 3.5. Effects of hydrophile-lipophile balance on thickness of calcium alginatecapsules. Data points are the average of triplicate measurements. Error bars = standard
deviation.
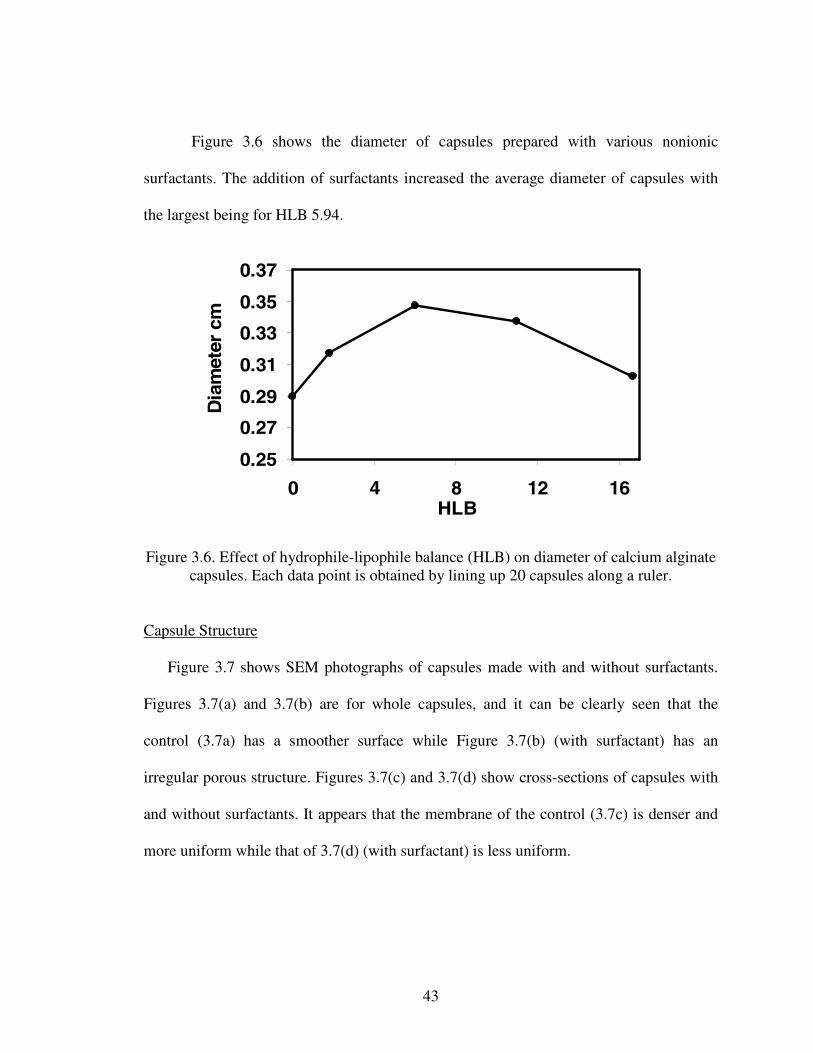
43
Figure 3.6 shows the diameter of capsules prepared with various nonionic
surfactants. The addition of surfactants increased the average diameter of capsules with
the largest being for HLB 5.94.
0.25
0.27
0.29
0.31
0.33
0.35
0.37
0 4 8 12 16HLB
Dia
met
ercm
Figure 3.6. Effect of hydrophile-lipophile balance (HLB) on diameter of calcium alginatecapsules. Each data point is obtained by lining up 20 capsules along a ruler.
Capsule Structure
Figure 3.7 shows SEM photographs of capsules made with and without surfactants.
Figures 3.7(a) and 3.7(b) are for whole capsules, and it can be clearly seen that the
control (3.7a) has a smoother surface while Figure 3.7(b) (with surfactant) has an
irregular porous structure. Figures 3.7(c) and 3.7(d) show cross-sections of capsules with
and without surfactants. It appears that the membrane of the control (3.7c) is denser and
more uniform while that of 3.7(d) (with surfactant) is less uniform.
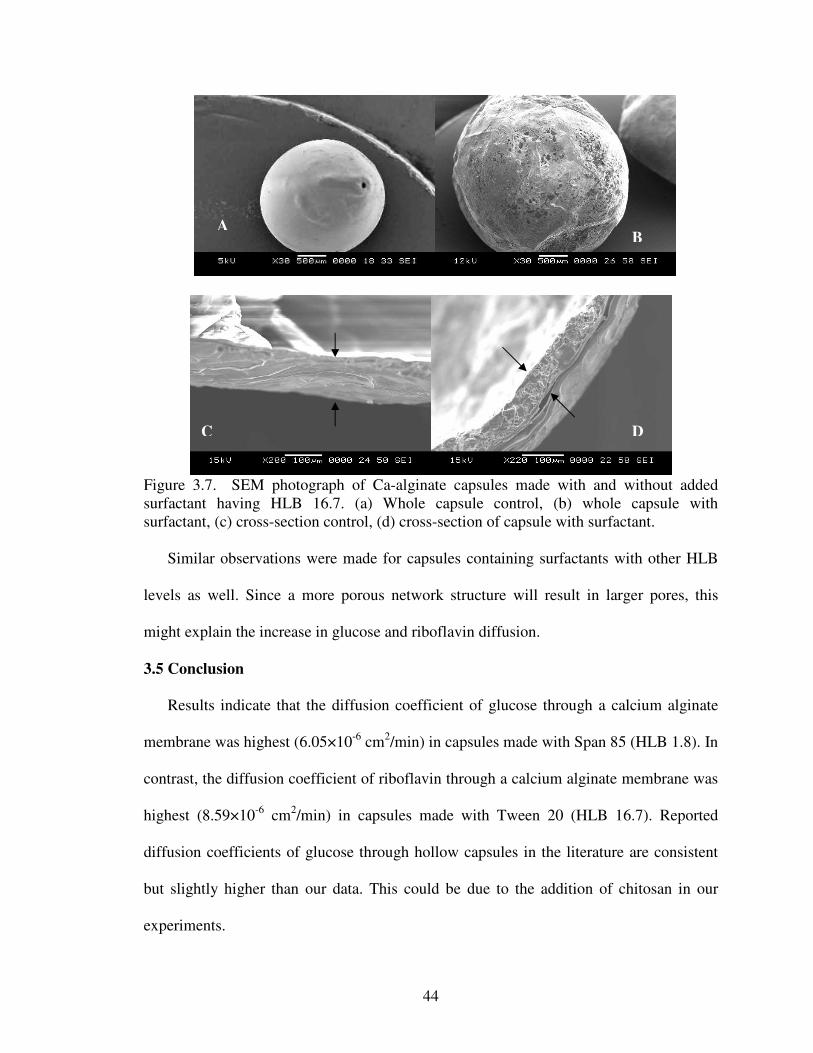
44
Figure 3.7. SEM photograph of Ca-alginate capsules made with and without addedsurfactant having HLB 16.7. (a) Whole capsule control, (b) whole capsule withsurfactant, (c) cross-section control, (d) cross-section of capsule with surfactant.
Similar observations were made for capsules containing surfactants with other HLB
levels as well. Since a more porous network structure will result in larger pores, this
might explain the increase in glucose and riboflavin diffusion.
3.5 Conclusion
Results indicate that the diffusion coefficient of glucose through a calcium alginate
membrane was highest (6.05×10⁻⁶ cm2/min) in capsules made with Span 85 (HLB 1.8). In
contrast, the diffusion coefficient of riboflavin through a calcium alginate membrane was
highest (8.59×10⁻⁶ cm2/min) in capsules made with Tween 20 (HLB 16.7). Reported
diffusion coefficients of glucose through hollow capsules in the literature are consistent
but slightly higher than our data. This could be due to the addition of chitosan in our
experiments.
C D
AB
45
The addition of surfactants that are more oil soluble (low HLB) during capsule
preparation increased the diffusion coefficient of riboflavin away from capsules, while
the addition of surfactants that are more water soluble (high HLB) increased the diffusion
coefficient of glucose into the capsules. The effects of surfactants on the production of
microcapsules have been previously investigated (Wan et al., 1993), and their study
showed that the use of surfactants increased the rate of drug release. These results agree
with those of Wan et al. (1993).
The addition of surfactants in general increased the average thickness of capsule
membranes. The thickest membrane (148.6 µm) was for capsules made with Span 85
(HLB 1.8), which is an increase of 34% over controls (97.5 µm). Similarly, the addition
of surfactants increased the average diameter of capsules. The largest diameter (0.348
cm) was for capsules made with a mixture of 55% Span 85 + 45% Tween 85 (HLB 6).
This is an increase of 16% over controls (0.29 cm). Finally, the addition of surfactants
resulted in capsules that have an irregular porous surface and a less uniform membrane.
In contrast, the controls had a smoother surface and a more uniform membrane. Taking
all these observations into consideration, although all surfactants tested increased
membrane thickness and diameter of capsules, their addition may have rendered the
membrane more permeable by making the capsules more porous, thus increasing solute
diffusion through it.
3.6 Literature Cited
Brodelius P, Mosbach K. 1982. Immobilized plant cells. Adv App Microbiol 28: 1-26.
Buzzini P, Rossi J. 1997. Riboflavin production by yeasts as an alternative approach forthe utilization of agro-industrial residues. Agro-Food-Ind Hi-Tech 8(5): 30-32.
46
Chai Y, Mei LH, Lin DQ, Yao SJ. 2004. Diffusion coefficients in intrahollow calciumalginate microcapsules. J Chem Eng Data 49: 475-478.
Cheetham PS, Blunt KW, Bucke C. 1979. Physical studies on cell immobilization usingcalcium alginate gels. Biotechnol Bioeng 21(12): 2155-2168.
Crank J. 1956 Mathematics of diffusion. Oxford University Press pp. 347.
Hartmeyer S. 1988. Immobilized Biocatalysts. Springer, Berlin pp 348.
Nguyen A, Luong J. 1986. Diffusion in k-carrageenan gel beads. Biotechnol Bioeng 28:1261-1266.
Ozbas T, Kutsal, T. 1991. Effects of agitation and aeration rates on riboflavinfermentation by ashbya gossypii. Biotechnol Appl Biochem13(1): 97-105
Pu HT, Yang RYK. 1988. Diffusion of sucrose and yohimbine in calcium alginate gelbeads with or without entrapped plant cells. Biotechnol Bioeng 32: 891-896.
Wan LSC, Heng PWS, Chan LW. 1993. Influence of hydrophile-lipophile balance onalginate microspheres. Int J Pharma 95: 77-83.
Westrin BA. 1990. Measurement of the diffusion coefficient of ethanol in agarose gelbeads: a reproducibility study. Biotechnol Tech 4(6): 409-414.
Wijffels RH, Tramper J. 1995. Nitrification by immobilized cells. Enz Microb Technol17(6): 482-492.
Yamamoto K, Hiwatari M, Kohori F, Sakai K, Fukuda M, Hiyoshi T. 2005. Membranefouling and dialysate flow pattern in an internal filtrationenhancing dialyzer. J ArtifOrgans 8:198–205
Yu X, Li Y, Wu D. 2004. Microencapsulation of tannase by chitosan-alginate complexcoacervate membrane: synthesis of antioxidant propyl gallate in biphasic media. JChem Technol Biotechnol 79: 475-479.
A B
47
CHAPTER IV CONTINUOUS RIBOFLAVIN PRODUCTION BY CANDIDA FLARERI
IMMOBILIZED IN SURFACTANT-MODIFIEDCALCIUM ALGINATE CAPSULES
4.1 Abstract
The performance of three immobilized yeast bioreactors producing riboflavin using
hollow calcium alginate capsules was investigated. Capsules were prepared with and
without the addition of nonionic surfactants. Both riboflavin production and glucose
consumption occurred at faster rates with immobilized cells than when free cells were
used. The utilization rate of glucose for capsules made with HLB 1.8 and HLB 16.7 were
16.5 and 15.5 g/L.d, respectively, while that of freely suspended cells was found to be 6.1
g/L.d. The effect of increasing dilution rates on reactor performance was studied as well.
The highest riboflavin level in the suspended cell system was 720 mg/L with a dilution
rate of 0.02 h-1. However, riboflavin production decreased sharply when dilution rate
increased to 0.03h-1. For the control system (capsules made without addition of
surfactants), higher riboflavin production (770 mg/L) at a dilution rate of 0.02 h-1 was
observed and no significant decrease in the productivity of riboflavin was observed at
higher dilution rates. Riboflavin productivity for systems made with Span 85 (HLB 1.8)
and Tween 20 (HLB 16.7) was higher than the control system. Results suggest that the
reactors having capsules made with Span 85 (HLB 1.8) and Tween 20 (HLB 16.7) were
superior to the free cell and control systems at higher dilution rates.
48
4.2 Introduction
The major limiting factor in the development of continuous biological reactors is the
inability to maintain stable and viable cell cultures for significant periods of time (Shin et
al., 2004). In the bioprocessing industry, a major problem is the low cell density and low
productivity observed with conventional cell suspension culture. Furthermore, many
products of cells, especially mammalian cells, are produced and secreted in the stationary
phase of the culture (non-growth associated) (Cunha et al., 2007). The application of cell
immobilization on or within a solid matrix has several advantages in biochemical
reactors. In general, these systems improve stability, increase cell densities more than is
possible in normal suspension cultures, and enable long-term continuous processes
resulting in potentially high reactor productivities (Mandavilli, 2000).
Takamitsu et al., (1993) showed that ethanol production in an immobilized cell
reactor using Z. mobilis was doubled compared to a similar suspended reactor system. In
addition, work done by Najafpour (1990) showed that if undisturbed microbial cells are
directly immobilized, the recovery of microorganisms from downstream product can be
eliminated and the loss of cellular activity can be kept to a minimum level.
The substrate conversion rate of most immobilized cells depends not only on the
availability of substrates and microbial kinetics, but on the diffusion rate of metabolites
through the immobilized cell system as well (Najafpour, 1990). Mass transfer of a
substrate to a reaction site or of product away from it may be impeded and reactor
performance may suffer significantly.
Increasing dilution rates in continuous bioreactors generally increases production rate
(Takamitsu et al., 1993). However, as dilution rate approaches a certain percentage of the
49
maximum specific growth rate (µmax) cell wash-out occurs in suspended growth
systems. This problem is not an issue in attached growth systems as long as dilution rate
does not exceed the diffusion rate of substrate (Mandavilli, 2000). Thus, if substrate
diffusion rate can be enhanced, greater dilution rate can be achieved and, in turn, better
productivity can be obtained.
The purpose of this study was to develop an immobilized yeast bioreactor to produce
riboflavin using calcium alginate capsules. Some of the capsules were prepared with
added surfactants, since previous work has shown that the addition of nonionic
surfactants to capsules increases substrate and product diffusivity. Surfactants were
chosen with relatively low or high hydrophile-lipophile balance (HLB) values. Three
different immobilized systems were investigated: a control, a system with capsules made
with the addition of Span 85 (HLB 1.8), and a system with capsules made with the
addition of Tween 20 (HLB 16.7). Fermentation efficiencies of the immobilized systems
were compared, along with a suspended growth system.
4.3 Materials and Methods
Experimental Setup
Four different reactor systems were compared in both batch and continuous modes;
three immobilized systems and one suspended cell system. Calcium alginate capsules
were prepared with two different types of surfactant, plus a control with no surfactant.
During each run, dilution rate was incrementally increased and glucose uptake and
riboflavin production were monitored. The increased diffusivity of capsules should
enable the reactor to operate at relatively higher dilution rates without loss of efficiency.
50
Organism
Cells of the yeast Candida flareri ATCC # 20850, provided by the American Type
Culture Collection, were used in this study. The strain was maintained on YM Agar
(Fisher Scientific, U.S.A.) plates, which were stored at 4 ºC after growth and
subsequently transferred to a freshly prepared agar plate every 3 weeks.
Growth Medium and Growth Reactor
A loopful of colony from the agar plate was aseptically transferred to 250 mL
Erlenmeyer flasks containing 100 mL of YPD Broth (Fisher Scientific, U.S.A.). The
inoculum was cultivated in a rotary shaker at 200 rpm at 26 ºC for 3 days before
harvesting. Afterward, the cells were collected by centrifugation (2000 ×g for 15
minutes), rinsed with sterile distilled water, centrifuged, and resuspended in sterile
distilled water to yield a suspension with high cell concentration. Yeast harvested from
the flasks was used to inoculate a growth reactor. This strategy ensured that a source of
viable yeast was readily available.
Figure 4.1 shows the growth reactor configuration. The process was carried out in a
5L glass bottle with 3L liquid volume. Agitation speed (200 rev/min) was provided by a
magnetic stirrer (Fisher Scientific, U.S.A.), temperature (26 °C) was maintained by heat
tape and temperature sensors, humidified sterile air flow was provided through a glass
fiber diffuser, and antifoam (0.1% w/v of antifoam solution B, Fisher Scientific, U.S.A.)
was added manually.
Production Medium
Production medium was similar to that of Buzzini & Rossi (1997). The medium
contained the following in 1 L: 30 g glucose, 0.5 g KH2PO4, 0.5 g CaCl2.2H2O, 0.5 g
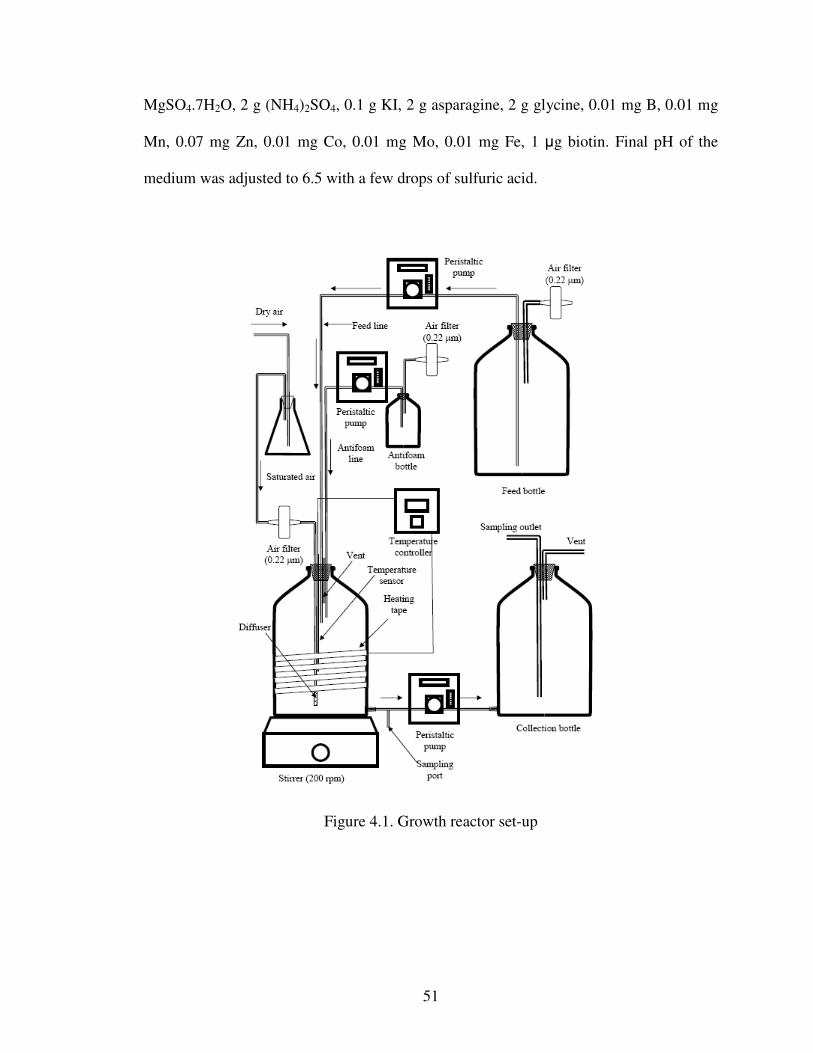
51
MgSO4.7H2O, 2 g (NH4)2SO4, 0.1 g KI, 2 g asparagine, 2 g glycine, 0.01 mg B, 0.01 mg
Mn, 0.07 mg Zn, 0.01 mg Co, 0.01 mg Mo, 0.01 mg Fe, 1 µg biotin. Final pH of the
medium was adjusted to 6.5 with a few drops of sulfuric acid.
Figure 4.1. Growth reactor set-up
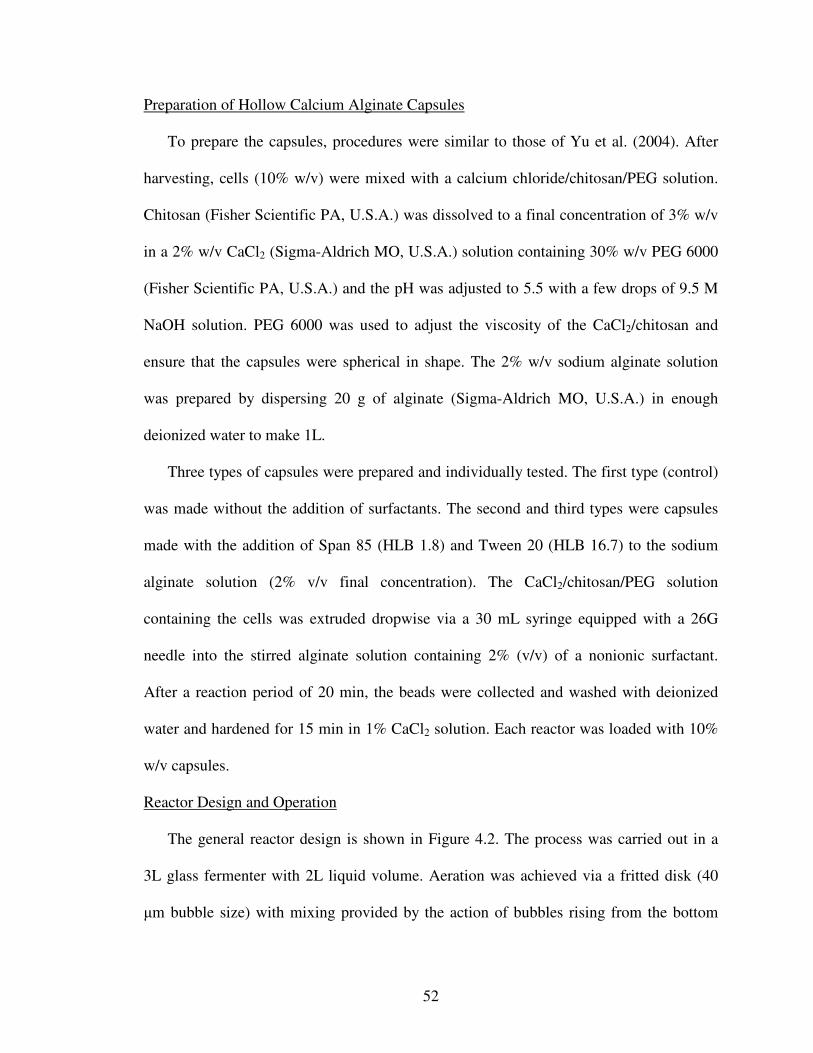
52
Preparation of Hollow Calcium Alginate Capsules
To prepare the capsules, procedures were similar to those of Yu et al. (2004). After
harvesting, cells (10% w/v) were mixed with a calcium chloride/chitosan/PEG solution.
Chitosan (Fisher Scientific PA, U.S.A.) was dissolved to a final concentration of 3% w/v
in a 2% w/v CaCl2 (Sigma-Aldrich MO, U.S.A.) solution containing 30% w/v PEG 6000
(Fisher Scientific PA, U.S.A.) and the pH was adjusted to 5.5 with a few drops of 9.5 M
NaOH solution. PEG 6000 was used to adjust the viscosity of the CaCl2/chitosan and
ensure that the capsules were spherical in shape. The 2% w/v sodium alginate solution
was prepared by dispersing 20 g of alginate (Sigma-Aldrich MO, U.S.A.) in enough
deionized water to make 1L.
Three types of capsules were prepared and individually tested. The first type (control)
was made without the addition of surfactants. The second and third types were capsules
made with the addition of Span 85 (HLB 1.8) and Tween 20 (HLB 16.7) to the sodium
alginate solution (2% v/v final concentration). The CaCl2/chitosan/PEG solution
containing the cells was extruded dropwise via a 30 mL syringe equipped with a 26G
needle into the stirred alginate solution containing 2% (v/v) of a nonionic surfactant.
After a reaction period of 20 min, the beads were collected and washed with deionized
water and hardened for 15 min in 1% CaCl2 solution. Each reactor was loaded with 10%
w/v capsules.
Reactor Design and Operation
The general reactor design is shown in Figure 4.2. The process was carried out in a
3L glass fermenter with 2L liquid volume. Aeration was achieved via a fritted disk (40
µm bubble size) with mixing provided by the action of bubbles rising from the bottom
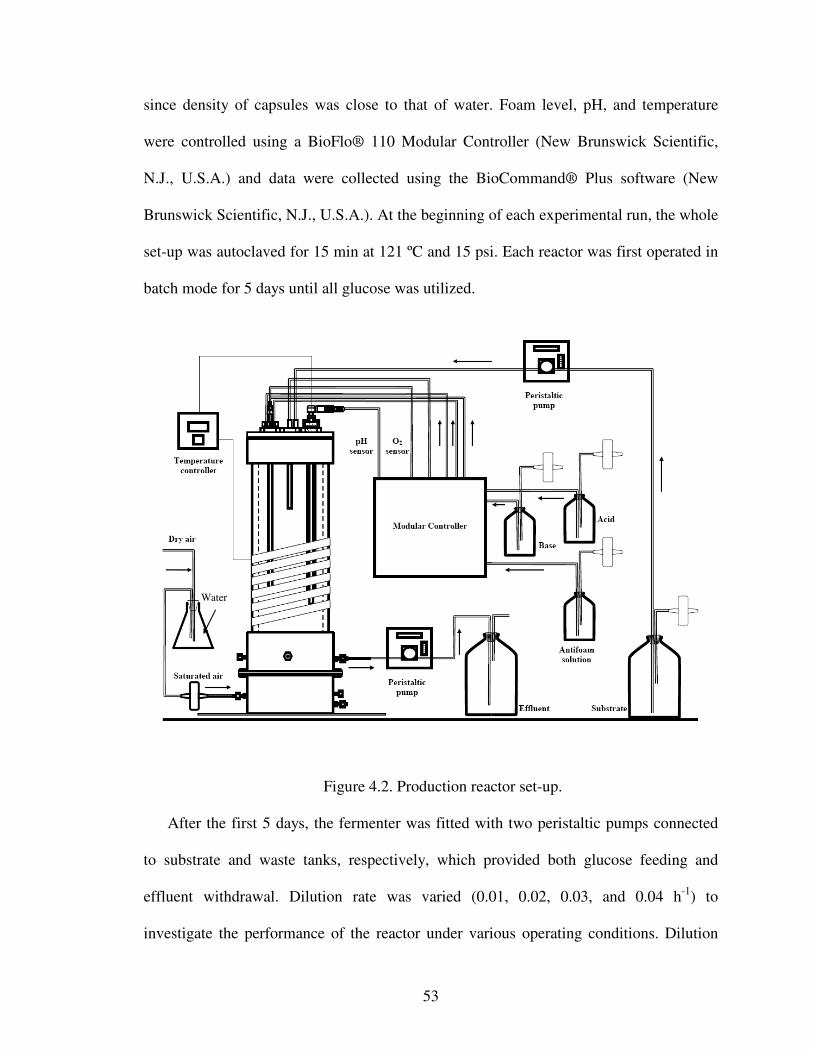
53
since density of capsules was close to that of water. Foam level, pH, and temperature
were controlled using a BioFlo® 110 Modular Controller (New Brunswick Scientific,
N.J., U.S.A.) and data were collected using the BioCommand® Plus software (New
Brunswick Scientific, N.J., U.S.A.). At the beginning of each experimental run, the whole
set-up was autoclaved for 15 min at 121 ºC and 15 psi. Each reactor was first operated in
batch mode for 5 days until all glucose was utilized.
Figure 4.2. Production reactor set-up.
After the first 5 days, the fermenter was fitted with two peristaltic pumps connected
to substrate and waste tanks, respectively, which provided both glucose feeding and
effluent withdrawal. Dilution rate was varied (0.01, 0.02, 0.03, and 0.04 h-1) to
investigate the performance of the reactor under various operating conditions. Dilution
Water
54
rates were increased only when steady state vitamin B2 (riboflavin) production was
observed (when variation in riboflavin concentration was less than 3%).
Analytical Methods
A flowchart showing sample analysis and related procedures is shown in Figure 4.3.
During each run, concentration of cells immobilized in the capsules and broth, glucose,
dissolved O2, riboflavin concentration, pH, and temperature were measured at specified
intervals (once every 12 hrs for the first two days and once daily after that).
Figure 4.3 Flowchart showing procedures related to sample analysis.
Reactor
Spectrophotometry
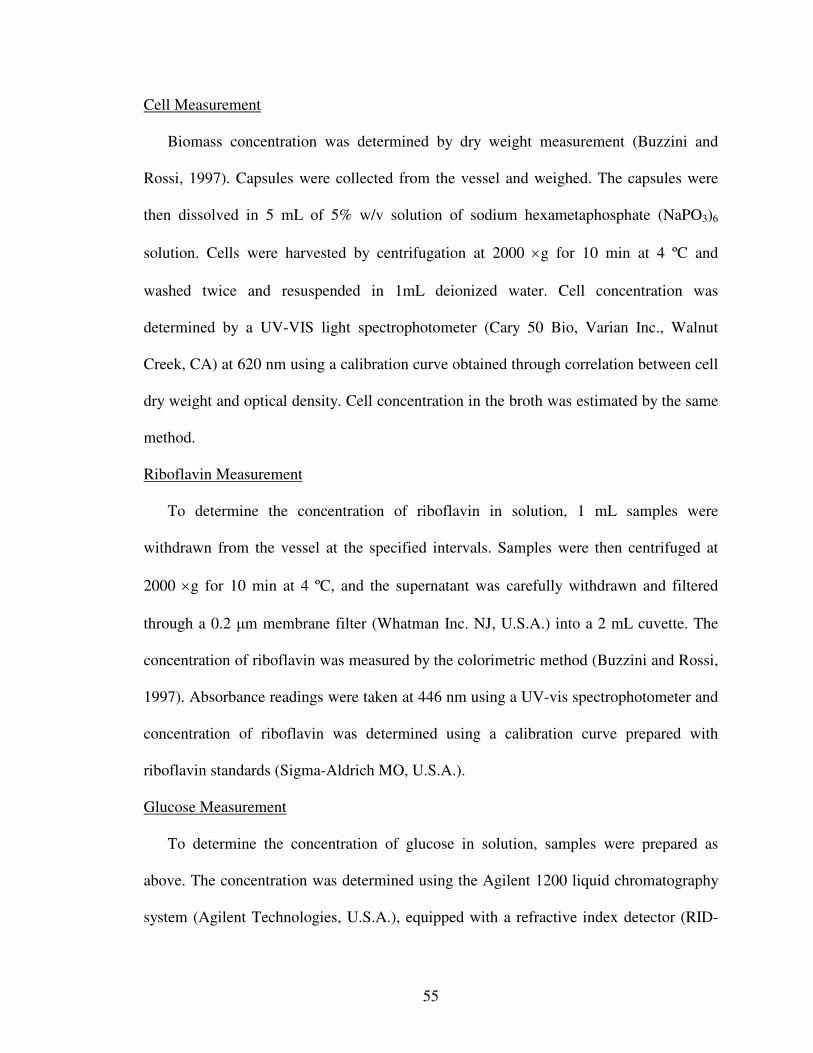
55
Cell Measurement
Biomass concentration was determined by dry weight measurement (Buzzini and
Rossi, 1997). Capsules were collected from the vessel and weighed. The capsules were
then dissolved in 5 mL of 5% w/v solution of sodium hexametaphosphate (NaPO3)6
solution. Cells were harvested by centrifugation at 2000 ×g for 10 min at 4 ºC and
washed twice and resuspended in 1mL deionized water. Cell concentration was
determined by a UV-VIS light spectrophotometer (Cary 50 Bio, Varian Inc., Walnut
Creek, CA) at 620 nm using a calibration curve obtained through correlation between cell
dry weight and optical density. Cell concentration in the broth was estimated by the same
method.
Riboflavin Measurement
To determine the concentration of riboflavin in solution, 1 mL samples were
withdrawn from the vessel at the specified intervals. Samples were then centrifuged at
2000 ×g for 10 min at 4 ºC, and the supernatant was carefully withdrawn and filtered
through a 0.2 µm membrane filter (Whatman Inc. NJ, U.S.A.) into a 2 mL cuvette. The
concentration of riboflavin was measured by the colorimetric method (Buzzini and Rossi,
1997). Absorbance readings were taken at 446 nm using a UV-vis spectrophotometer and
concentration of riboflavin was determined using a calibration curve prepared with
riboflavin standards (Sigma-Aldrich MO, U.S.A.).
Glucose Measurement
To determine the concentration of glucose in solution, samples were prepared as
above. The concentration was determined using the Agilent 1200 liquid chromatography
system (Agilent Technologies, U.S.A.), equipped with a refractive index detector (RID-
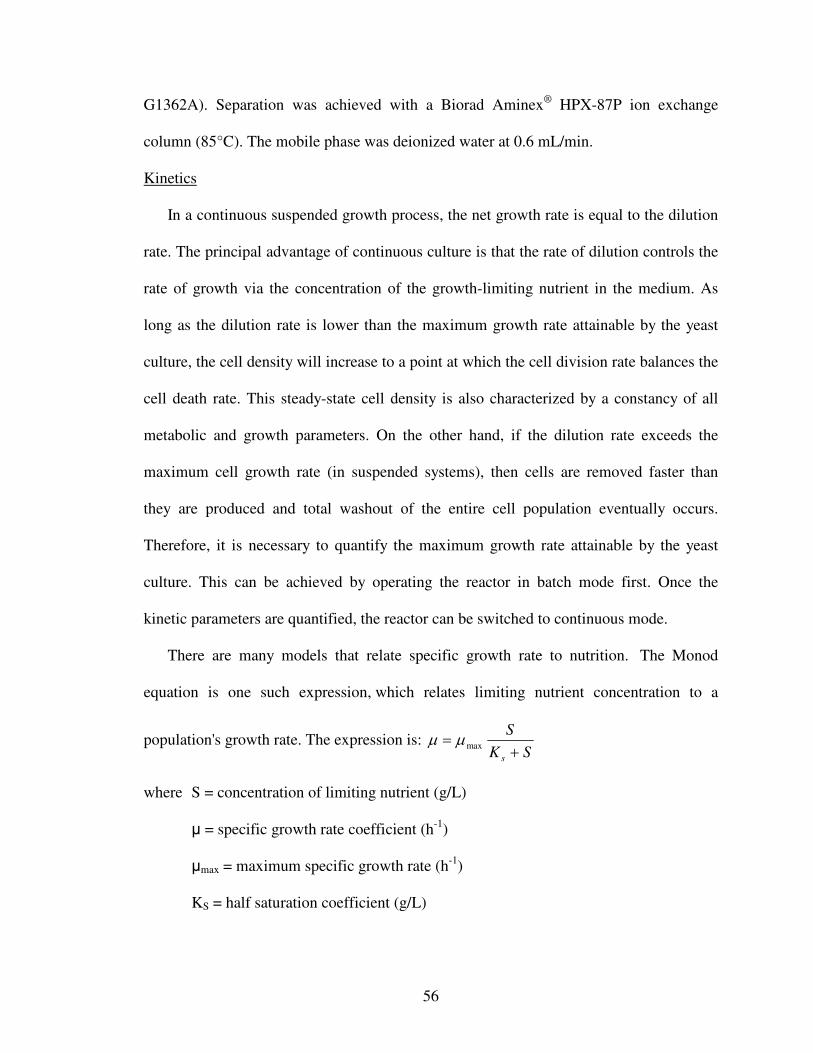
56
G1362A). Separation was achieved with a Biorad Aminex® HPX-87P ion exchange
column (85°C). The mobile phase was deionized water at 0.6 mL/min.
Kinetics
In a continuous suspended growth process, the net growth rate is equal to the dilution
rate. The principal advantage of continuous culture is that the rate of dilution controls the
rate of growth via the concentration of the growth-limiting nutrient in the medium. As
long as the dilution rate is lower than the maximum growth rate attainable by the yeast
culture, the cell density will increase to a point at which the cell division rate balances the
cell death rate. This steady-state cell density is also characterized by a constancy of all
metabolic and growth parameters. On the other hand, if the dilution rate exceeds the
maximum cell growth rate (in suspended systems), then cells are removed faster than
they are produced and total washout of the entire cell population eventually occurs.
Therefore, it is necessary to quantify the maximum growth rate attainable by the yeast
culture. This can be achieved by operating the reactor in batch mode first. Once the
kinetic parameters are quantified, the reactor can be switched to continuous mode.
There are many models that relate specific growth rate to nutrition. The Monod
equation is one such expression, which relates limiting nutrient concentration to a
population's growth rate. The expression is:SK
S
s += maxµµ
where S = concentration of limiting nutrient (g/L)
µ = specific growth rate coefficient (h-1)
µmax = maximum specific growth rate (h-1)
KS = half saturation coefficient (g/L)
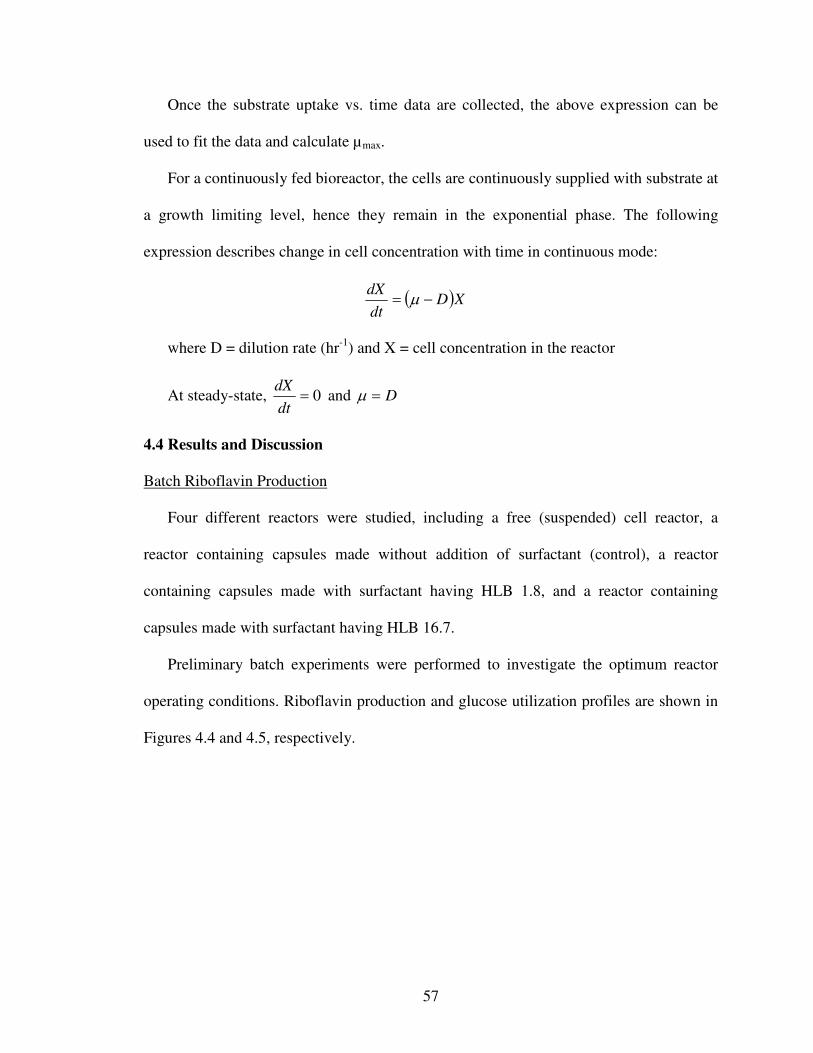
57
Once the substrate uptake vs. time data are collected, the above expression can be
used to fit the data and calculate µmax.
For a continuously fed bioreactor, the cells are continuously supplied with substrate at
a growth limiting level, hence they remain in the exponential phase. The following
expression describes change in cell concentration with time in continuous mode:
( )XDdt
dX−= µ
where D = dilution rate (hr-1) and X = cell concentration in the reactor
At steady-state, 0=dt
dXand D=µ
4.4 Results and Discussion
Batch Riboflavin Production
Four different reactors were studied, including a free (suspended) cell reactor, a
reactor containing capsules made without addition of surfactant (control), a reactor
containing capsules made with surfactant having HLB 1.8, and a reactor containing
capsules made with surfactant having HLB 16.7.
Preliminary batch experiments were performed to investigate the optimum reactor
operating conditions. Riboflavin production and glucose utilization profiles are shown in
Figures 4.4 and 4.5, respectively.
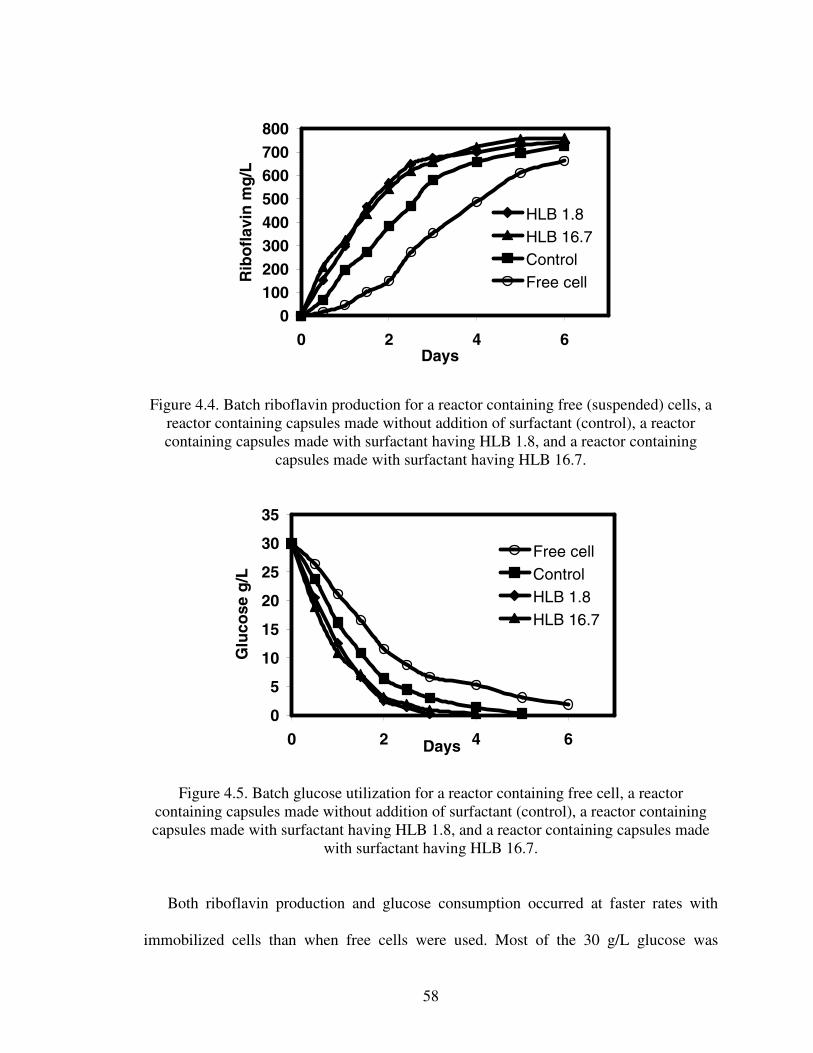
58
0100200300400500600700800
0 2 4 6Days
Rib
ofl
avin
mg
/L
HLB 1.8HLB 16.7ControlFree cell
Figure 4.4. Batch riboflavin production for a reactor containing free (suspended) cells, areactor containing capsules made without addition of surfactant (control), a reactorcontaining capsules made with surfactant having HLB 1.8, and a reactor containing
capsules made with surfactant having HLB 16.7.
0
5
10
15
20
25
30
35
0 2 4 6Days
Glu
cose
g/L
Free cellControlHLB 1.8HLB 16.7
Figure 4.5. Batch glucose utilization for a reactor containing free cell, a reactorcontaining capsules made without addition of surfactant (control), a reactor containingcapsules made with surfactant having HLB 1.8, and a reactor containing capsules made
with surfactant having HLB 16.7.
Both riboflavin production and glucose consumption occurred at faster rates with
immobilized cells than when free cells were used. Most of the 30 g/L glucose was
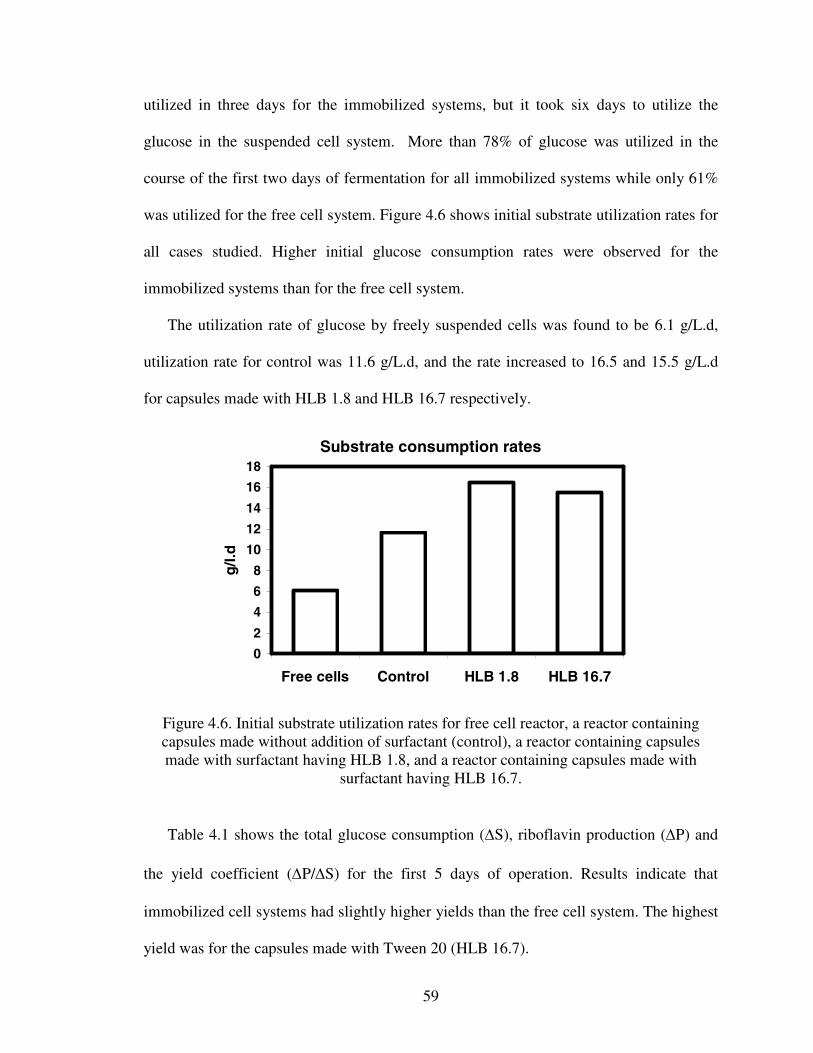
59
utilized in three days for the immobilized systems, but it took six days to utilize the
glucose in the suspended cell system. More than 78% of glucose was utilized in the
course of the first two days of fermentation for all immobilized systems while only 61%
was utilized for the free cell system. Figure 4.6 shows initial substrate utilization rates for
all cases studied. Higher initial glucose consumption rates were observed for the
immobilized systems than for the free cell system.
The utilization rate of glucose by freely suspended cells was found to be 6.1 g/L.d,
utilization rate for control was 11.6 g/L.d, and the rate increased to 16.5 and 15.5 g/L.d
for capsules made with HLB 1.8 and HLB 16.7 respectively.
Substrate consumption rates
0
2
4
6
8
10
12
14
16
18
Free cells Control HLB 1.8 HLB 16.7
g/l.
d
Figure 4.6. Initial substrate utilization rates for free cell reactor, a reactor containingcapsules made without addition of surfactant (control), a reactor containing capsulesmade with surfactant having HLB 1.8, and a reactor containing capsules made with
surfactant having HLB 16.7.
Table 4.1 shows the total glucose consumption (∆S), riboflavin production (∆P) and
the yield coefficient (∆P/∆S) for the first 5 days of operation. Results indicate that
immobilized cell systems had slightly higher yields than the free cell system. The highest
yield was for the capsules made with Tween 20 (HLB 16.7).
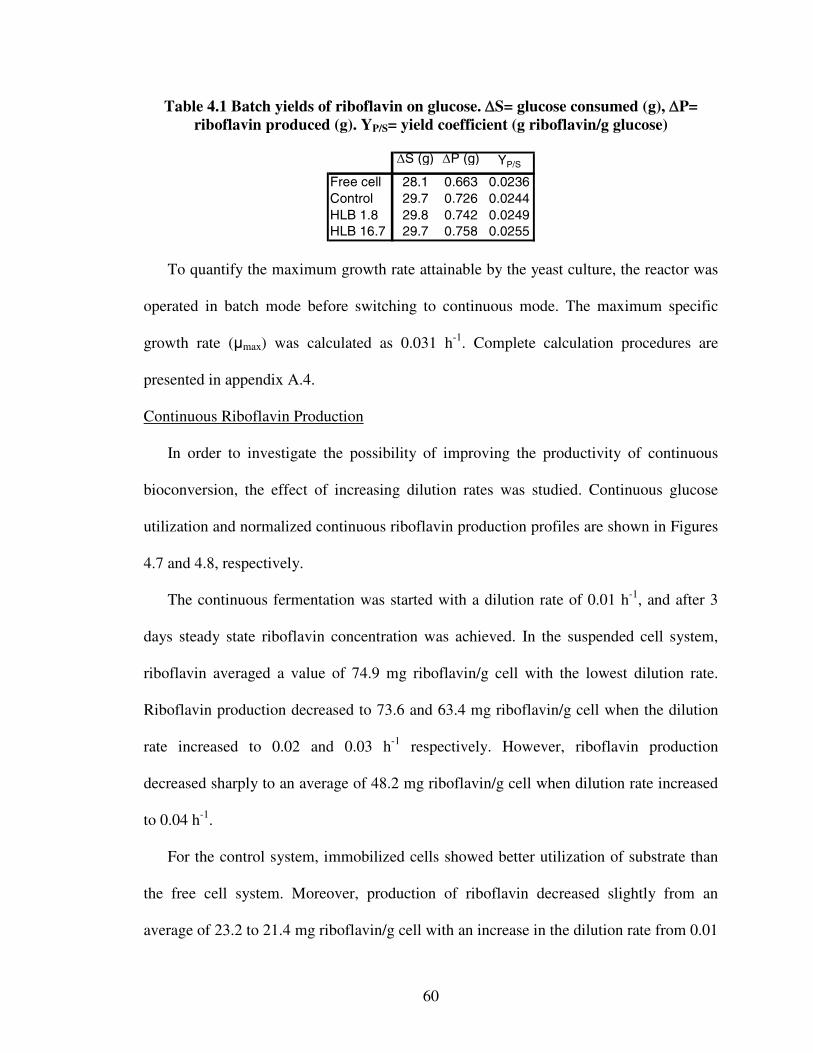
60
Table 4.1 Batch yields of riboflavin on glucose. ∆S= glucose consumed (g), ∆P= riboflavin produced (g). YP/S= yield coefficient (g riboflavin/g glucose)
∆S (g) ∆P (g) YP/S
Free cell 28.1 0.663 0.0236Control 29.7 0.726 0.0244HLB 1.8 29.8 0.742 0.0249HLB 16.7 29.7 0.758 0.0255
To quantify the maximum growth rate attainable by the yeast culture, the reactor was
operated in batch mode before switching to continuous mode. The maximum specific
growth rate (µmax) was calculated as 0.031 h-1. Complete calculation procedures are
presented in appendix A.4.
Continuous Riboflavin Production
In order to investigate the possibility of improving the productivity of continuous
bioconversion, the effect of increasing dilution rates was studied. Continuous glucose
utilization and normalized continuous riboflavin production profiles are shown in Figures
4.7 and 4.8, respectively.
The continuous fermentation was started with a dilution rate of 0.01 h-1, and after 3
days steady state riboflavin concentration was achieved. In the suspended cell system,
riboflavin averaged a value of 74.9 mg riboflavin/g cell with the lowest dilution rate.
Riboflavin production decreased to 73.6 and 63.4 mg riboflavin/g cell when the dilution
rate increased to 0.02 and 0.03 h-1 respectively. However, riboflavin production
decreased sharply to an average of 48.2 mg riboflavin/g cell when dilution rate increased
to 0.04 h-1.
For the control system, immobilized cells showed better utilization of substrate than
the free cell system. Moreover, production of riboflavin decreased slightly from an
average of 23.2 to 21.4 mg riboflavin/g cell with an increase in the dilution rate from 0.01
61
to 0.02h-1. However, no further decrease in riboflavin production and less fluctuation
were observed at higher dilution rates. The systems containing capsules made with
surfactants followed a similar trend as that of the control.
The variation of riboflavin productivity with time at different dilution rates is shown
in Figure 4.9. In the suspended cell system, riboflavin productivity increased with
increasing dilution rates up to 0.02 h-1. However, when dilution rate increased to 0.03h-1
riboflavin productivity began to decrease sharply and a further increase in dilution rate
resulted in a further loss of riboflavin productivity. For systems containing capsules made
with surfactants, productivity was higher than the control system at dilution rates 0.03
and 0.04 h-1. Moreover, these two systems were more stable at higher dilutions than the
control, as loss of productivity at a dilution rate of 0.04h-1 for the control was observed.
Superiority of the immobilized systems containing capsules made with surfactants is
more evident at the higher dilution rates. The decrease in riboflavin productivity by free
cells at higher dilution rates was probably due to cell washout.
Figure 4.10 shows the variation of the relative substrate concentration with dilution
rate. For the free cell system, it was observed that as dilution rate increased, substrate
utilization efficiency increased (noted by increase in relative substrate concentration).
However, as dilution rate increased further than 0.02 h-1 utilization efficiency decreased
sharply. The control system followed a similar trend as that of the free cell system
although higher utilization efficiencies were achieved for the same dilution rates used.
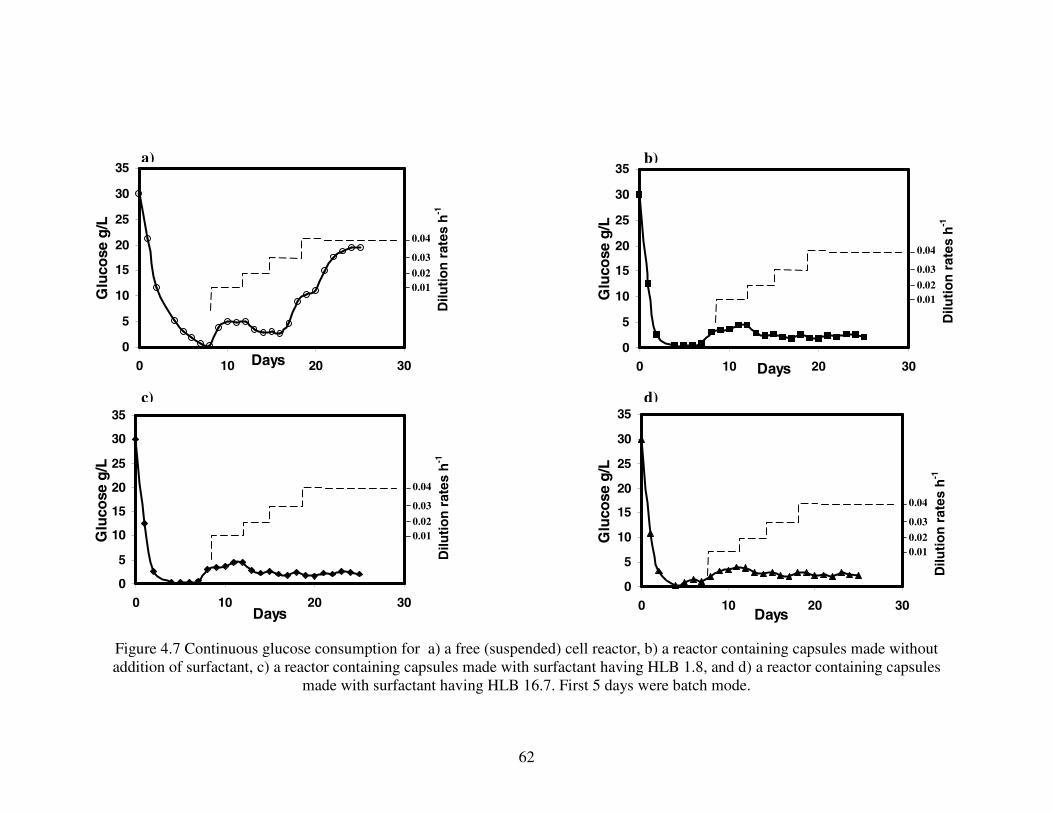
62
Figure 4.7 Continuous glucose consumption for a) a free (suspended) cell reactor, b) a reactor containing capsules made withoutaddition of surfactant, c) a reactor containing capsules made with surfactant having HLB 1.8, and d) a reactor containing capsules
made with surfactant having HLB 16.7. First 5 days were batch mode.
0
5
10
15
20
25
30
35
0 10 20 30Days
Glu
cose
g/L
a)
0.010.02
0.03
0.04
Dilu
tio
nra
tes
h-1
0
5
10
15
20
25
30
35
0 10 20 30Days
Glu
cose
g/L
c)
0.010.02
0.03
0.04
Dilu
tio
nra
tes
h-1
0
5
10
15
20
25
30
35
0 10 20 30Days
Glu
cose
g/L
d)
0.010.02
0.03
0.04
Dilu
tio
nra
tes
h-1
0
5
10
15
20
25
30
35
0 10 20 30Days
Glu
cose
g/L
b)
0.010.02
0.03
0.04
Dilu
tio
nra
tes
h- 1
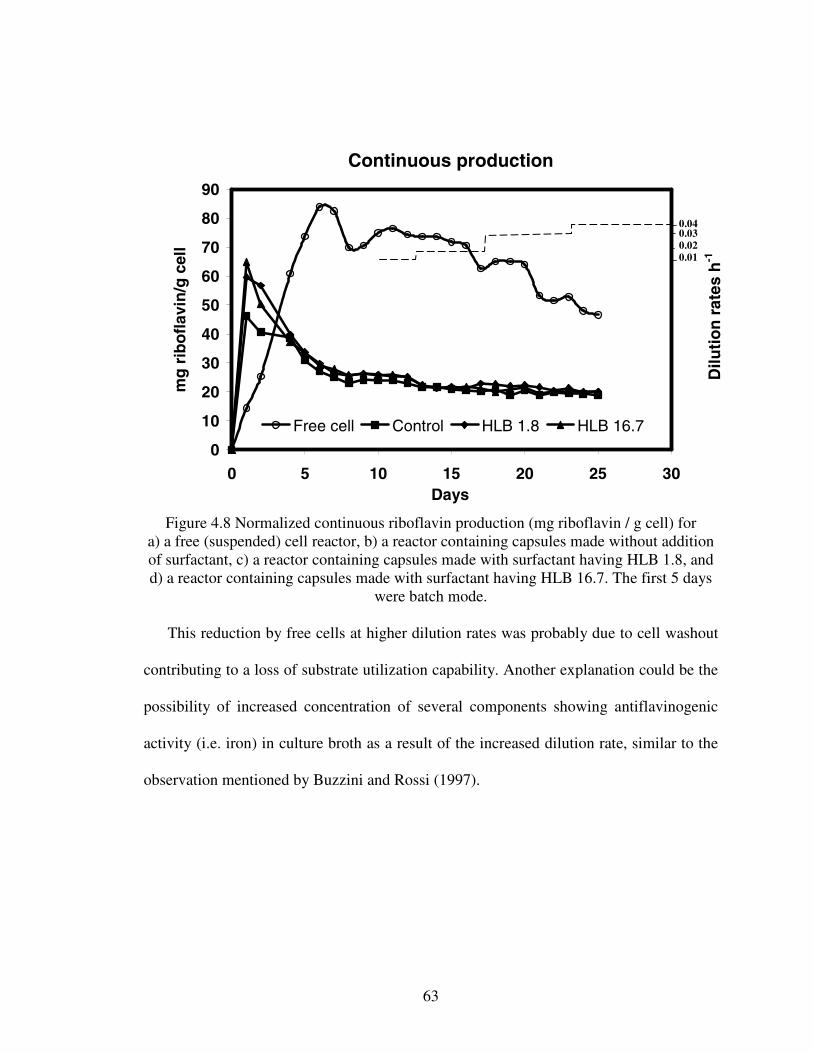
63
Continuous production
0
10
20
30
40
50
60
70
80
90
0 5 10 15 20 25 30Days
mg
rib
ofl
avin
/gce
ll
Free cell Control HLB 1.8 HLB 16.7
Figure 4.8 Normalized continuous riboflavin production (mg riboflavin / g cell) fora) a free (suspended) cell reactor, b) a reactor containing capsules made without additionof surfactant, c) a reactor containing capsules made with surfactant having HLB 1.8, andd) a reactor containing capsules made with surfactant having HLB 16.7. The first 5 days
were batch mode.
This reduction by free cells at higher dilution rates was probably due to cell washout
contributing to a loss of substrate utilization capability. Another explanation could be the
possibility of increased concentration of several components showing antiflavinogenic
activity (i.e. iron) in culture broth as a result of the increased dilution rate, similar to the
observation mentioned by Buzzini and Rossi (1997).
0.010.020.030.04
Dilu
tio
nra
tes
h-1
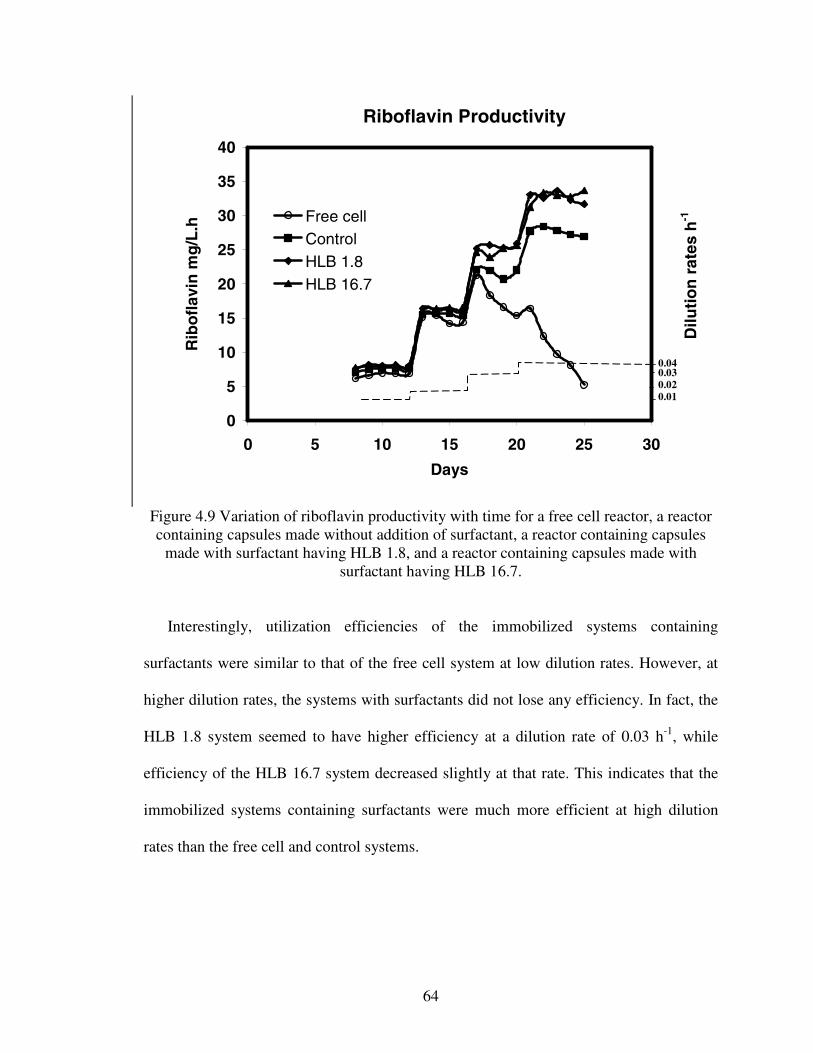
838364 64
Riboflavin Productivity
0
5
10
15
20
25
30
35
40
0 5 10 15 20 25 30
Days
Rib
ofl
avin
mg
/L.h
Free cellControlHLB 1.8HLB 16.7
Figure 4.9 Variation of riboflavin productivity with time for a free cell reactor, a reactorcontaining capsules made without addition of surfactant, a reactor containing capsules
made with surfactant having HLB 1.8, and a reactor containing capsules made withsurfactant having HLB 16.7.
Interestingly, utilization efficiencies of the immobilized systems containing
surfactants were similar to that of the free cell system at low dilution rates. However, at
higher dilution rates, the systems with surfactants did not lose any efficiency. In fact, the
HLB 1.8 system seemed to have higher efficiency at a dilution rate of 0.03 h-1, while
efficiency of the HLB 16.7 system decreased slightly at that rate. This indicates that the
immobilized systems containing surfactants were much more efficient at high dilution
rates than the free cell and control systems.
0.010.020.030.04
Dilu
tio
nra
tes
h-1
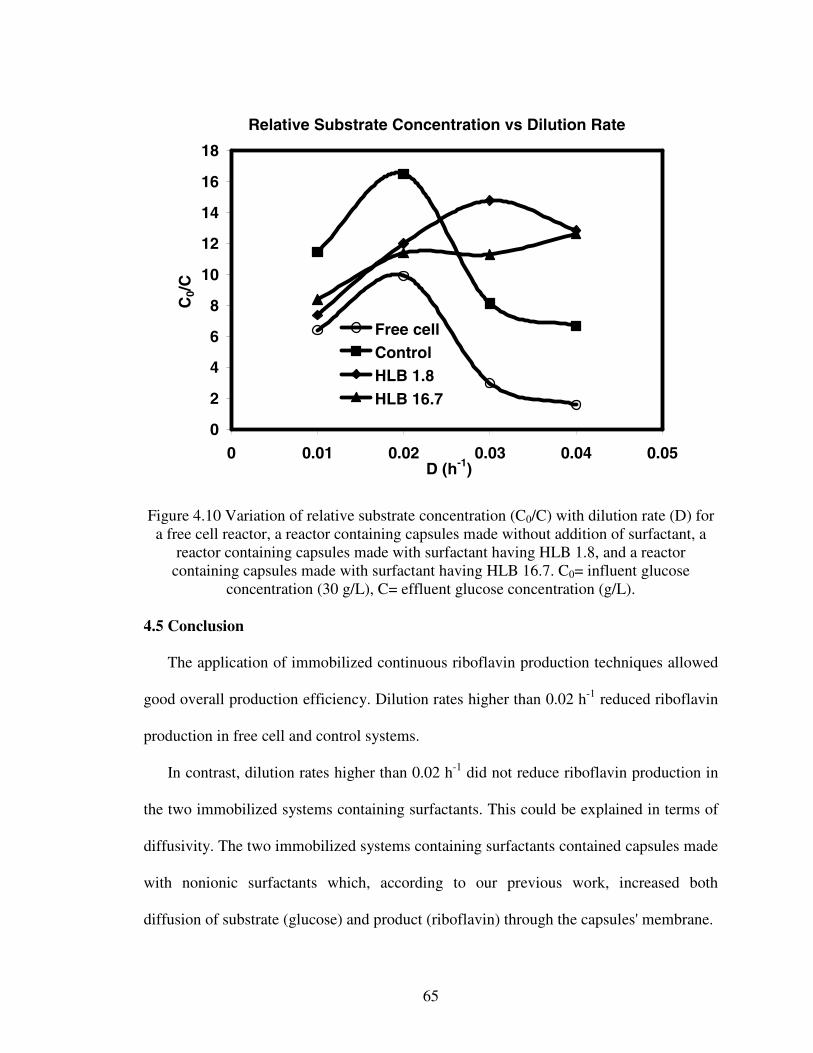
838365 65
Relative Substrate Concentration vs Dilution Rate
0
2
4
6
8
10
12
14
16
18
0 0.01 0.02 0.03 0.04 0.05D (h-1)
C0/
C
Free cellControlHLB 1.8HLB 16.7
Figure 4.10 Variation of relative substrate concentration (C0/C) with dilution rate (D) fora free cell reactor, a reactor containing capsules made without addition of surfactant, a
reactor containing capsules made with surfactant having HLB 1.8, and a reactorcontaining capsules made with surfactant having HLB 16.7. C0= influent glucose
concentration (30 g/L), C= effluent glucose concentration (g/L).
4.5 Conclusion
The application of immobilized continuous riboflavin production techniques allowed
good overall production efficiency. Dilution rates higher than 0.02 h-1 reduced riboflavin
production in free cell and control systems.
In contrast, dilution rates higher than 0.02 h-1 did not reduce riboflavin production in
the two immobilized systems containing surfactants. This could be explained in terms of
diffusivity. The two immobilized systems containing surfactants contained capsules made
with nonionic surfactants which, according to our previous work, increased both
diffusion of substrate (glucose) and product (riboflavin) through the capsules' membrane.
838366 66
Results suggest that the immobilized systems containing surfactant-modified capsules
are superior to the free cell and control systems at higher dilution rates. They exhibit
higher productivity and less fluctuation at higher dilution rates, while the free cell and
control systems suffered significant reduction of substrate utilization capabilities at
higher dilution rates. Results show great promise for the continuous immobilized cell
reactor for riboflavin production using capsules made with nonionic surfactants.
4.6 Literature Cited
Buzzini P, Rossi J. 1997. Riboflavin production by yeasts as an alternative approach forthe utilization of agro-industrial residues. Agro-Food-Ind Hi-Tech 8(5): 30-32.
Cunha MAA, Rodrigues RCB, Santos JC, Converti A, da Silva SS. 2007. Repeated-BatchXylitol Bioproduction Using Yeast Cells Entrapped in Polyvinyl Alcohol-Hydrogel.Curr Microbiol 54(2): 91-96.
Mandavilli SN. 2000. Performance characteristics of an immobilized enzyme reactorproducing ethanol from starch. J Chem Eng Japan 33(6): 886-890.
Najafpour G. 1990. Immobilization of microbial cells for the production of organic acids.J Sc 1(3): 172-176.
Shin HT, Park KM, Kang KH, Oh DJ, Lee SW, Baig SY, Lee JH. 2004. Novel methodfor cell immobilization and its application for production of oligosaccharides fromsucrose. Lett Appl Microbiol 38(2): 176-179.
Takamitsu I, Izumida H, Akagi Y, Sakamoto M. 1993. Continuous ethanol fermentationin molasses medium using Zymomonas mobilis immobilized in photo-cross linkableresin gels. J Ferment Bioeng 75: 32–35.
Yu X, Li Y, Wu D. 2004. Microencapsulation of tannase by chitosan-alginate complexcoacervate membrane: synthesis of antioxidant propyl gallate in biphasic media. JChem Technol Biotechnol 79: 475-479.
838367 67
CHAPTER VSUMMARY AND FUTURE RECOMMENDATIONS
5.1 Summary
Cell immobilization techniques and their applications have been of interest for many
decades. In this work, calcium alginate capsules were used for entrapment of the yeast
Candida flareri (ATCC # 20850) for riboflavin production. There were two goals for this
study. The first goal was to evaluate the effects of nonionic surfactants having various
hydrophile-lipophile balances (HLB) on the diffusion coefficient of glucose and
riboflavin through the hollow capsules. The second goal was to evaluate the performance
of three immobilized yeast bioreactors producing riboflavin using the hollow calcium
alginate capsules developed in the previous part.
The following conclusions can be drawn:
• The addition of surfactants that are more water soluble (high HLB) during capsule
preparation increased the diffusion coefficient of riboflavin away from capsules.
• The addition of surfactants that are more oil soluble (low HLB) increased the
diffusion coefficient of glucose into the capsules.
• The addition of surfactants in general increased the average thickness and average
diameter of capsule membranes.
• The addition of surfactants resulted in capsules that have an irregular porous surface
and less uniform membrane structure.
838368 68
• Higher glucose consumption rates were observed for the immobilized systems than
for the free cell system.
• Dilution rates higher than 0.02 h-1 reduced riboflavin production in the free cell
system.
• Dilution rates higher than 0.02 h-1 did not reduce riboflavin production in the control
system and the reactors having capsules made with Span 85 (HLB 1.8) and Tween 20
(HLB 16.7)
• All three reactors using cells immobilized in capsules exhibited better operational
stability and less fluctuation at higher dilution rates, while the free cell system
suffered reduced substrate utilization rates at higher dilution rates.
It appears that capsules made with the addition of nonionic surfactants exhibit
superior performance in continuous systems at higher dilution rates. These results show
great promise for the continuous immobilized cell reactor for riboflavin production using
capsules made with nonionic surfactants.
5.2 Future Recommendations
Results showed that the addition of nonionic surfactant during the manufacturing of
alginate capsules increased diffusion of glucose in a chemically defined media. However,
no study has been conducted to test the use of a substrate of agro-industrial origin for a
similar study. Buzzini and Rossi (1997) developed a continuous process to produce
riboflavin by Candida tropicalis cells immobilized in calcium alginate using concentrated
rectified grape must as the substrate. Their system was able to produce up to 600 mg/L
riboflavin for more than 1 month. However, reduction of riboflavin production was
observed in culture broth at higher dilution rates. They speculated that these higher
838369 69
dilution rates were too high in comparison to the velocity of vitamin biosynthesis.
Another explanation, which they did not address, is the possibility of diffusion limitation
of substrate and other nutrients through the support matrix. Therefore, it is recommended
that the effects of nonionic surfactants on the diffusional properties of alginate capsules
using raw materials should be investigated.
In addition, results showed that the addition of surfactants resulted in capsules that
have an irregular porous surface and a less uniform membrane. Their addition may have
rendered the membrane more permeable by making the capsules more porous, thus
increasing solute diffusion through it. Accordingly, Zhang et al. (2006) studied the effect
of Span 85 and Tween 60 on the pore size of alginate capsules prepared by the
emulsification method. Their work aimed at experimentally controlling the pore sizes of
alginate capsules. Their work showed that the optimum HLB value which gave the
narrowest pore size distribution was 12.3. However no work exists on the effects of HLB
of surfactants on pore size distribution of calcium alginate capsules made by the
extrusion method. Therefore it is also recommended that the effect of nonionic
surfactants on the porosity of calcium alginate capsules prepared by the extrusion method
should be investigated.
5.3 Literature Cited
Buzzini P, Rossi J. 1997. Riboflavin production by yeasts as an alternative approach forthe utilization of agro-industrial residues. Agro-Food-Ind Hi-Tech 8(5): 30-32.
Zhang FJ, Cheng GX, Gao Z, Li CP. 2006. Preparation of Porous Calcium AlginateMembranes/Microspheres via an Emulsion Templating Method. Macromol Mat andEng. 291(5): 485-492.
838370 70
APPENDICES
A.1 Example of computer code (Mathematica 5.2) used to solve Crank’s diffusionmodel
<< Statistics`NonlinearFit`data = {{0, 1.0076}, {1, 0.8505}, {2.5, 0.8082}, {5, 0.7636}, {7.5, 0.7387}, {10,0.7251}, {15, 0.7091}, {20, 0.7035}, {30, 0.7022}, {40, 0.6953}, {50, 0.6949}, {60,0.6944}};
NonlinearRegress[data, (2.13 / 3.13) (1 + 0.22725 Exp[-476.41 delta x] + 0.08603 Exp[-1662.89 delta x] + 0.04244 Exp[-3624.00 delta x] + 0.02484 Exp[-6366.58 delta x] +0.01620 Exp[-9891.70 delta x] + 0.01137 Exp[-14199.93 delta x] + 0.00846 Exp[-19164.33 delta x] + 0.00652 Exp[-24941.91 delta x] + 0.00518 Exp[-31479.59 delta x] +0.00421 Exp[-38777.36 delta x]), {x}, {delta,0.0000001},
RegressionReport→{BestFitParameters, StartingParameters, ParameterCITable,EstimatedVariance, ANOVATable, AsymptoticCorrelationMatrix, FitCurvatureTable},ShowProgress→True]
A.2 Statistical Analysis, Student t comparison
Statistical comparison was performed using Student's t-test for the comparison of two
means. It is the test of the null hypothesis that the means of two normally distributed
populations are equal. If two data sets are given and each set its mean, standard deviation,
and number of data points. The test can be used to determine whether the means are
distinct according to the following equations:
dM
d
s
Mt = Where dM is the difference between samples means (µ1 - µ2) and
dMs is the
estimated standard error of the difference between means (n
sss
dM
22
21 += ).
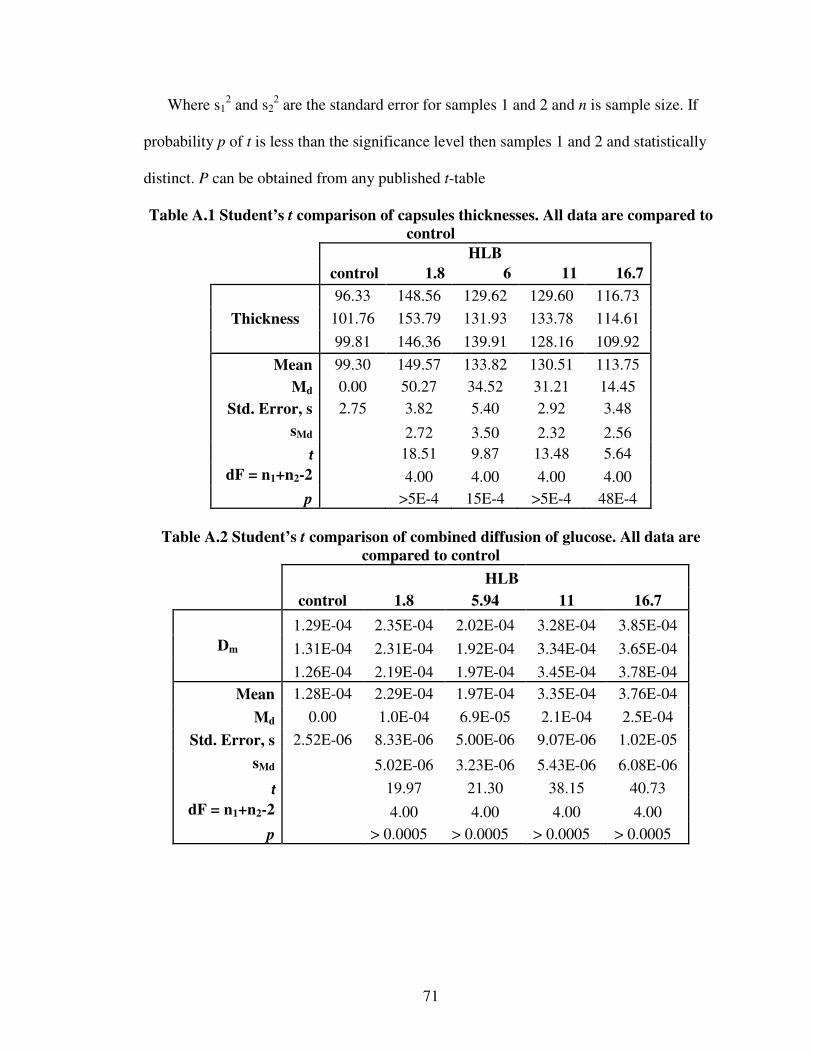
838371 71
Where s12 and s2
2 are the standard error for samples 1 and 2 and n is sample size. If
probability p of t is less than the significance level then samples 1 and 2 and statistically
distinct. P can be obtained from any published t-table
Table A.1 Student’s t comparison of capsules thicknesses. All data are compared tocontrol
HLBcontrol 1.8 6 11 16.796.33 148.56 129.62 129.60 116.73
101.76 153.79 131.93 133.78 114.61Thickness
99.81 146.36 139.91 128.16 109.92
Mean 99.30 149.57 133.82 130.51 113.75
Md 0.00 50.27 34.52 31.21 14.45Std. Error, s 2.75 3.82 5.40 2.92 3.48
sMd 2.72 3.50 2.32 2.56t 18.51 9.87 13.48 5.64
dF = n1+n2-2 4.00 4.00 4.00 4.00p >5E-4 15E-4 >5E-4 48E-4
Table A.2 Student’s t comparison of combined diffusion of glucose. All data arecompared to control
HLBcontrol 1.8 5.94 11 16.7
1.29E-04 2.35E-04 2.02E-04 3.28E-04 3.85E-04
1.31E-04 2.31E-04 1.92E-04 3.34E-04 3.65E-04Dm
1.26E-04 2.19E-04 1.97E-04 3.45E-04 3.78E-04Mean 1.28E-04 2.29E-04 1.97E-04 3.35E-04 3.76E-04
Md 0.00 1.0E-04 6.9E-05 2.1E-04 2.5E-04
Std. Error, s 2.52E-06 8.33E-06 5.00E-06 9.07E-06 1.02E-05
sMd 5.02E-06 3.23E-06 5.43E-06 6.08E-06
t 19.97 21.30 38.15 40.73dF = n1+n2-2 4.00 4.00 4.00 4.00
p > 0.0005 > 0.0005 > 0.0005 > 0.0005
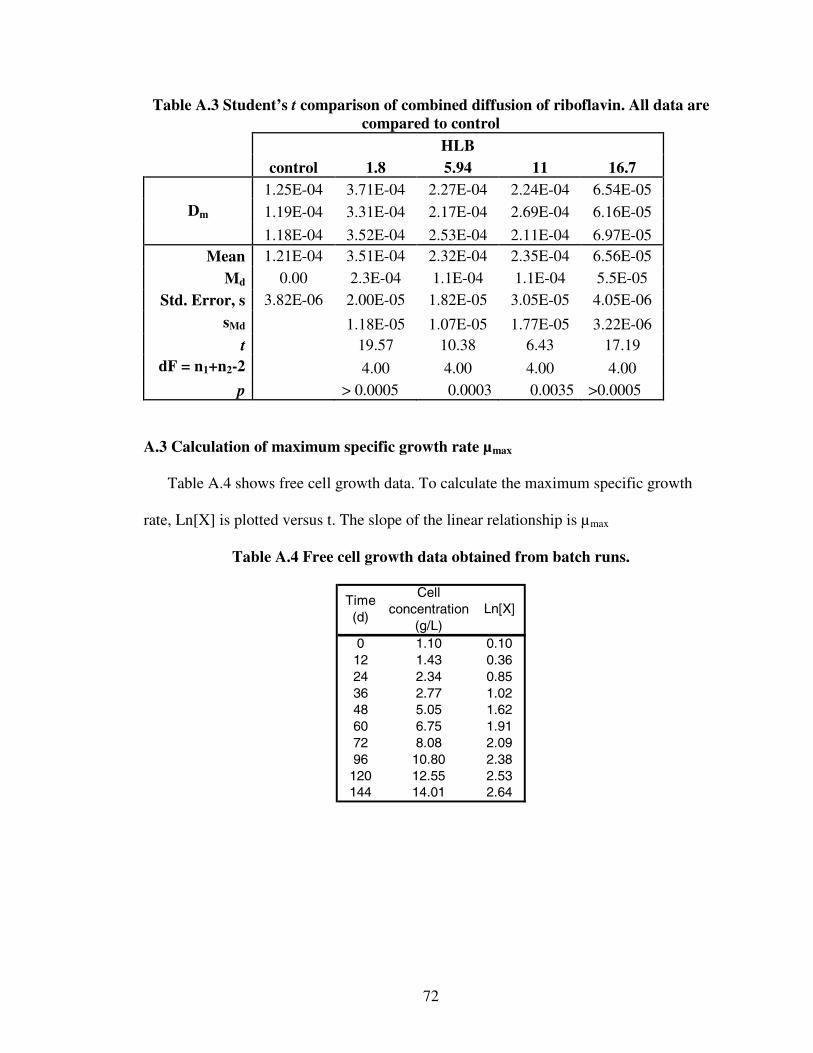
838372 72
Table A.3 Student’s t comparison of combined diffusion of riboflavin. All data arecompared to control
HLBcontrol 1.8 5.94 11 16.7
1.25E-04 3.71E-04 2.27E-04 2.24E-04 6.54E-05
1.19E-04 3.31E-04 2.17E-04 2.69E-04 6.16E-05Dm
1.18E-04 3.52E-04 2.53E-04 2.11E-04 6.97E-05Mean 1.21E-04 3.51E-04 2.32E-04 2.35E-04 6.56E-05
Md 0.00 2.3E-04 1.1E-04 1.1E-04 5.5E-05Std. Error, s 3.82E-06 2.00E-05 1.82E-05 3.05E-05 4.05E-06
sMd 1.18E-05 1.07E-05 1.77E-05 3.22E-06t 19.57 10.38 6.43 17.19
dF = n1+n2-2 4.00 4.00 4.00 4.00p > 0.0005 0.0003 0.0035 >0.0005
A.3 Calculation of maximum specific growth rate µmax
Table A.4 shows free cell growth data. To calculate the maximum specific growth
rate, Ln[X] is plotted versus t. The slope of the linear relationship is µmax
Table A.4 Free cell growth data obtained from batch runs.
0 1.10 0.1012 1.43 0.3624 2.34 0.8536 2.77 1.0248 5.05 1.6260 6.75 1.9172 8.08 2.0996 10.80 2.38
120 12.55 2.53144 14.01 2.64
Ln[X]Cell
concentration(g/L)
Time(d)
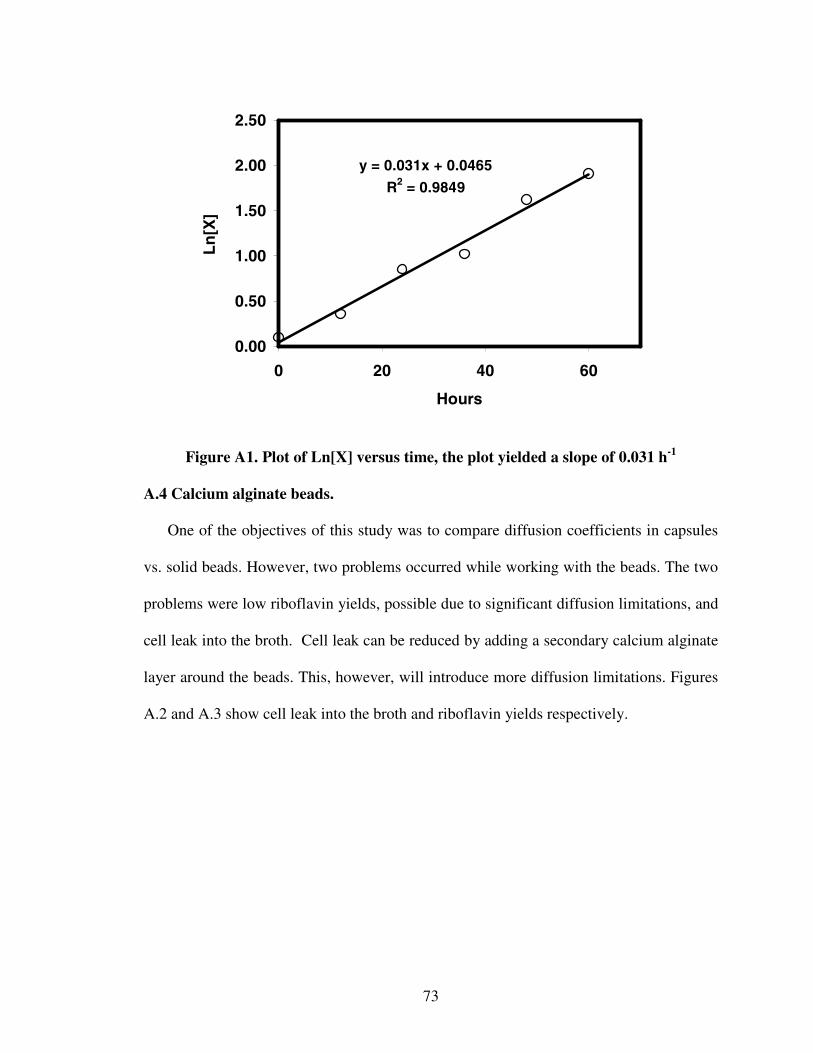
838373 73
y = 0.031x + 0.0465
R2 = 0.9849
0.00
0.50
1.00
1.50
2.00
2.50
0 20 40 60
Hours
Ln
[X]
Figure A1. Plot of Ln[X] versus time, the plot yielded a slope of 0.031 h-1
A.4 Calcium alginate beads.
One of the objectives of this study was to compare diffusion coefficients in capsules
vs. solid beads. However, two problems occurred while working with the beads. The two
problems were low riboflavin yields, possible due to significant diffusion limitations, and
cell leak into the broth. Cell leak can be reduced by adding a secondary calcium alginate
layer around the beads. This, however, will introduce more diffusion limitations. Figures
A.2 and A.3 show cell leak into the broth and riboflavin yields respectively.
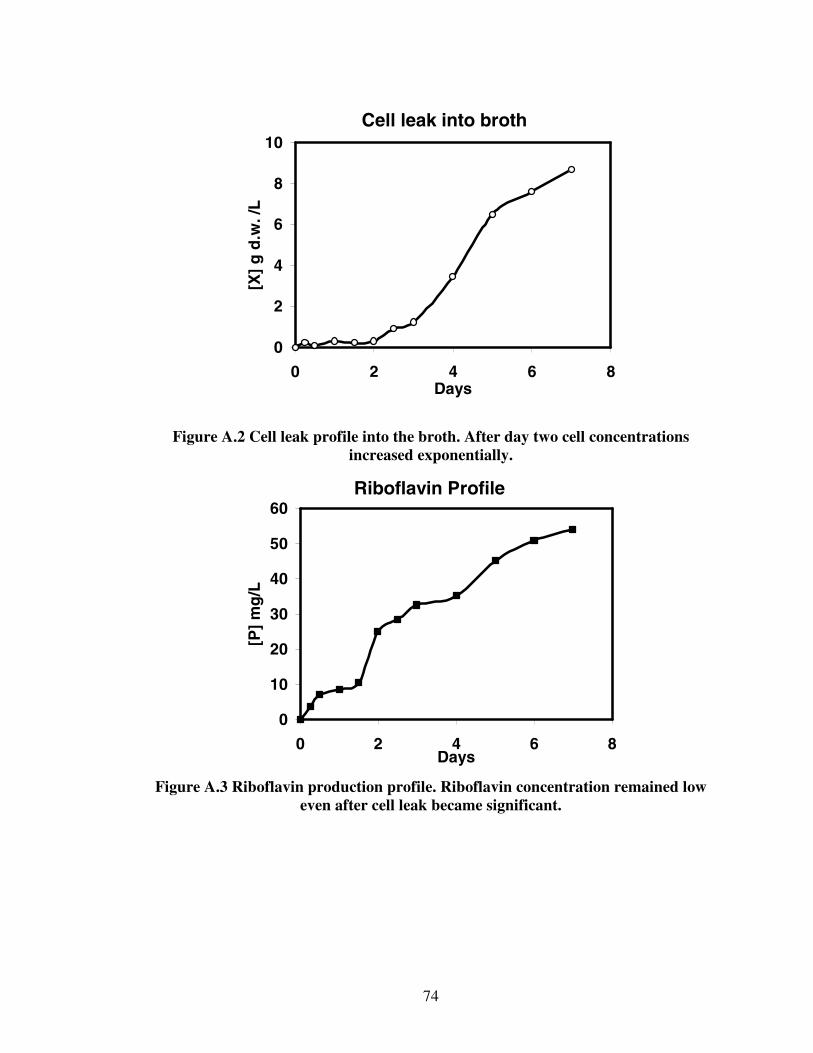
838374 74
Cell leak into broth
0
2
4
6
8
10
0 2 4 6 8Days
[X]
gd
.w./
L
Figure A.2 Cell leak profile into the broth. After day two cell concentrationsincreased exponentially.
Riboflavin Profile
0
10
20
30
40
50
60
0 2 4 6 8Days
[P]
mg
/L
Figure A.3 Riboflavin production profile. Riboflavin concentration remained loweven after cell leak became significant.
VITA
Houssam Aref Alosta
Candidate for the Degree of
Doctor of Philosophy
Thesis: RIBOFLAVIN PRODUCTION BY ENCAPSULATED CANDIDA FLARERI
Major Field: Biosystems Engineering
Biographical:
Education: Received Bachelor of Science degree in Civil Engineering fromBeirut Arab University, Beirut Lebanon in May 1999. Received Masterof Science degree in Biosystems Engineering from Oklahoma StateUniversity, Stillwater, Oklahoma in May 2002. Completed requirementsof the degree of Doctor of Philosophy in Biosystems Engineering fromOklahoma State University, Stillwater Oklahoma in July 2007.
Experience: Employed as a summer intern at Arabian Construction &Consulting, Beirut Lebanon in the summers of 1996, 1997, and 1998.Employed as a graduate research assistant and associate by OklahomaState University, Department of Biosystems Engineering, Stillwater,Oklahoma from 2000 to present.
Professional Memberships: Member of the Lebanese order of Engineers, 1999to present.
Name: Houssam Alosta Date of Degree: July, 2007
Institution: Oklahoma State University Location: Stillwater, Oklahoma
Title of Study: RIBOFLAVIN PRODUCTION BY ENCAPSULATED CANDIDAFLARERI
Pages in Study: 74 Candidate for the Degree of Doctor of Philosophy
Major Field: Biosystems Engineering
Scope and Method of Study: Calcium alginate capsules were used for entrapment of theyeast Candida flareri for riboflavin production. The first goal was to evaluate theaddition of nonionic surfactants to the capsule membrane. The diffusion coefficients ofglucose and riboflavin through the hollow capsules were then evaluated by monitoringthe change in solute concentration in the bulk solution. The second goal was to evaluatethe performance of the immobilized yeast in continuous bioreactors producing riboflavin.Fermentation efficiencies of three immobilized systems and a suspended growth systemwere compared. The immobilized systems included a control (calcium alginate capsulesmade without surfactants), a system with capsules made with the addition of Span 85(HLB 1.8), and a system with capsules made with the addition of Tween 20 (HLB 16.7).
Findings and Conclusions: Results indicate that the addition of surfactants that are moreoil soluble (low hydrophile-lipophile balance, HLB) during capsule preparation increasedthe diffusion coefficient of riboflavin away from capsules, while the addition ofsurfactants that are more water soluble (high HLB) increased the diffusion coefficient ofglucose into the capsules. Their addition may have rendered the membrane morepermeable by making the capsules more porous, thus increasing solute diffusion.The application of immobilized continuous riboflavin production techniques resulted inincreased riboflavin productivity compared to the suspended growth system. Two of theimmobilized systems contained capsules made with nonionic surfactants. Results showedthat immobilized systems containing surfactant-modified capsules resulted in greaterproductivity than the control system (containing capsules made without surfactants).Results show great promise for the continuous immobilized cell reactor for riboflavinproduction using capsules made with nonionic surfactants.
ADVISER’S APPROVAL: