cancer diagnostics with dna microarrays (knudsen/cancer diagnostics with dna microarrays) || lung...
TRANSCRIPT

14Lung Cancer
Air from the trachea is distributed to the bronchi, which divide into the smaller bron-chioles and end in tiny air sacs called alveoli (Figure 14.1). In the alveoli the exchangeof gases with the bloodstream takes place. Most lung cancers start in the epithelial cellsof the bronchi. Lung cancers can also originate in the trachea, bronchioles, and alveoli.
Lung cancers are subdivided into two major groups, small cell lung cancer (SCLC)and non-small cell lung cancer (NSCLC). The non-small cell lung cancers constitute80% of all lung cancers and are subdivided into three groups: squamous cell carcinoma,adenocarcinoma, and large-cell undifferentiated carcinoma. In addition to SCLC andNSCLC there are more rare types like carcinoid tumors. The different subtypes havedifferent prognoses.
X-ray and biopsy are typical methods to diagnose lung cancer, and after the diagnosisthe cancer can be staged according to how much the tumor has spread. This stagingsystem is very similar to that used for breast cancer, following the American JointCommittee on Cancer TNM system. After the staging of the tumor, lymph node, andmetastasis, the information is summarized in stages I to IV (Table 14.1).
Treatment of lung cancer is by surgery, radiation therapy, and chemotherapy, eitheralone or in combination. Stages I and II NSCLC are typically treated by surgeryalone, while stages III and IV NSCLC are typically treated by surgery followed bychemotherapy and radiation therapy. In recent years, chemotherapy has been offeredto stage I and II patients as well. (See Table 14.2.)
14.1 MICROARRAY STUDIES OF LUNG CANCER
14.1.1 The Harvard/Whitehead Group
Bhattacharjee et al., (2001) published a PNAS paper on the study of 186 lung tumorsand 17 normal lung samples using the Affymetrix U95A GeneChip. The tumors
Cancer Diagnostics with DNA Microarrays, By Steen KnudsenCopyright c© 2006 John Wiley & Sons, Inc.
114

MICROARRAY STUDIES OF LUNG CANCER 115
Trachea
Bronchi
Bronchioles
Figure 14.1 Anatomy of the lung. (From Tortora, Principles of Human Anatomy, 10th ed., 2005,p. 741. Used with permission of John Wiley & Sons, Inc.)
TABLE 14.1 Summary Staging of Non-Small Cell LungCancer
Overall Stage T Stage N Stage M Stage
Stage 0 Tis (in situ) N0 M0Stage IA T1 N0 M0Stage IB T2 N0 M0Stage IIA T1 N1 M0Stage IIB T2 N1 M0
T3 N0 M0Stage IIIA T1 N2 M0
T2 N2 M0T3 N1 M0T3 N2 M0
Stage IIIB Any T N3 M0T4 Any N M0
Stage IV Any T Any N M1
included 127 adenocarcinomas, 21 squamous cell carcinomas, 20 pulmonary carci-noids, and 6 SCLCs. Twelve adenocarcinomas were suspected to be extrapulmonarymetastases. Hierarchical clustering revealed subgroups consistent with the known histo-logical divisions. In addition, two new subgroups of adenocarcinomas were discovered,with differences in prognosis. The study also showed that it is possible to identify lungtumors that are metastases of extrapulmonary origin.
In 2002 a group from the same institutions (Gordon et al., 2002) published a studyof 31 malignant pleural mesotheliomas (MPMs) and 150 adenocarcinomas (ADCAs).Thirty-two of the tumor samples were studied using Affymetrix U95A GeneChips.

116 LUNG CANCER
TABLE 14.2 Non-Small CellLung Cancer Survival byStage
Stage Five-Year Survival
I 47 %II 26 %III 8 %IV 2 %
They identified three pairs of genes, the expression ratio of which was a highly accurate(99%) tool for RT-PCR diagnosis of MPM versus ADCA in a test set of the remainingsamples.
14.1.2 The Minnesota Group
A study by Hoang et al. (2004) detailed microarray analysis of 15 non-small cell lungcarcinomas. They selected genes able to discriminate between tumors with metastasisand those without. The resulting clusters showed that the genes selected had predictivevalue on the metastasis of a primary lung carcinoma.
14.1.3 The Vanderbilt Group
Yamagata et al. (2003) published a study of 45 NSCLCs using cDNA microarraysshowing that it was possible to select genes that discriminate between primary lungtumors and normal lung and metastasis.
14.1.4 The Tokyo Group
Kikuchi et al. (2003) studied 37 NSCLCs using a cDNA microarray with 23,040 genes.They selected genes that could predict lymph node metastasis of adenocarcinomas.They also selected genes that could predict the sensitivity of NSCLCs to six anticancerdrugs.
14.1.5 The Michigan Group
Beer et al. (2002) used univariate Cox analysis to identify genes associated with sur-vival in lung adenocarcinomas. The study was based on 91 lung tumors analyzed withAffymetrix HuGeneFL GeneChip. A risk index based on 50 genes related to survivalwas validated on an independent sample of lung adenocarcinomas with known clinicaloutcome. The identification of a set of genes that predict survival in early-stage lungadenocarcinoma allows delineation of a high-risk group that may benefit from adjuvanttherapy.
14.1.6 The Mayo Clinic
Sun et al. (2004) studied 15 stage I squamous cell carcinomas using Affymetrix HG-U133A GeneChips. Genes associated with survival were identified using pathwayanalysis.
META-CLASSIFICATION OF LUNG CANCER 117
14.1.7 The Toronto Group
Wigle et al. (2002) published a study of 39 NSCLCs using a 19,200 cDNA array. TheNSCLCs included squamous cell carcinoma, adenocarcinoma, large-cell undifferenti-ated carcinoma, and carcinoid tumors. Using clustering, they identified clusters withdifferences in outcome.
14.1.8 The NIH Group
Miura et al. (2002) used a cDNA array with 18,432 clones to investigate 19 patientswith adenocarcinoma. The samples were extracted by laser capture microdissection.Forty-five genes were identified that separate smokers from nonsmokers. Twenty-sevengenes were identified that separate survivors from nonsurvivors five years after surgery.
14.1.9 The Stanford Group
Garber et al. (2001) studied 67 lung tumors from 56 patients using a 24,000-featurecDNA array. The samples consisted of 41 ACs, 16 SCCs, 5 LCLCs, and 5 SCLCs.Five normal lung specimens were studied. Clustering resulted in subgroups that were inagreement with the known morphological classification. But there were also subgroupsthat correlated with the survival of the patient.
14.1.10 The Israel Group
Cojocaru et al. (2002) studied 12 NSCLCs and 7 normal lung samples using AffymetrixU95A GeneChips. Clustering revealed a clear separation between the tumors and nor-mal tissue.
14.2 META-CLASSIFICATION OF LUNG CANCER
Four groups have made their raw data available: Whitehead, Vanderbilt, Stanford, andMichigan. The raw intensities from each study were logit normalized and genes werecorrelated with outcome selected using the t-test. The top 100 ranking genes weresubjected to principal component analysis, and the three first principal components foreach sample (patient) were retained.
The principal components from all four datasets were combined as shown inFigure 14.2 and used to develop a classifier to predict outcome of the disease of thepatient. First the arbitrary signs of the principal components from each platform hadto be adjusted. For each principal component we chose the sign that made the sum ofsquared errors over classes and datasets smallest.
Four different classification methods were trained on the principal components: KNearest Neighbor (knn algorithm from www.r-project.org), Nearest Centroid, SupportVector Machine (svm algorithm from e1071 package at www.r-project.org), and NeuralNetwork (nnet algorithm with 6 hidden units from nnet package at www.r-project.org).The classification was decided by voting among the four methods: Unanimous Goodprognosis classification resulted in a Good prognosis prediction. Unanimous Poorprognosis classification resulted in a Poor prognosis prediction. Whenever there wasdisagreement between the methods, the Intermediate prognosis was predicted.

118 LUNG CANCER
10
−10 −5 0 5 10 15
50
−5
PC1
PC
2
2111 2
1
11
1
1
1
1122
2
22
22
2
2 22
2
1
1
1 2
1
1
1
1
21 11
1
1
1
1
11
11
1
1
2
1
1
2
1
1
2
2
2
222
2
2
2
2
2 2
2
2
2
2
2
2
2
2
2
2
2
2
2
2
1
1
1
11
1
1
1
1
2
2 22
1
2
2
1
1
2
1
11
1
21
2
2
11
1
21
11
11
22
1
1
1
1
1
1
1
1
1
2
1
1
2
2
2
1
1
21
21
21
1
1
1
11
1
11
1
2
1
1
2
1
2
1
2
12
12
1
2
2
2
12
1
2
1
2
1
2
2
1
1
11
2
121
1
1
2
2
12
111
1
1
1
1 1
11
2
22
22
22
2
2
2
2
2
2
2
2
2
2
2
2
2
222 2
2
22
2
2
2
2
2
22
2
2
2
2
2
2 2
2
1
1
2
1
2
1
11
1
2
2
1
12
11
1
2
1
11
11
2
2
2
11
1
1
1
1
1
1
1
2
1
2
1
212
2
1
1
2
2
21
2
1 11
1
1
1 1
2
1
2
1
2
2
2
22
2
21
1
1
1
1
1
1
1
1
11
1
1
22
2
22 2 2
1
11
11
1
1
1
11111
1
StanfordMichiganWhiteheadVanderbilt
Figure 14.2 All samples from the four studies are plotted according to their projections on thefirst two principal components after these have been matched in signs across datasets. Plain font:Stanford dataset; bold: Michigan dataset; italics: Whitehead dataset; bold italics: Vanderbilt dataset.The number ‘‘1’’ corresponds to those who survived the disease; the number ‘‘2’’ corresponds tothose who died from the disease. A clear deviation from random is seen for the distribution of the twoclasses. Patients of class ‘‘1’’ tend to group on one side and patients of class ‘‘2’’ tend to group onthe other side. This subtle signal, together with the subtle signals present in the third component, isused by the classifier to predict outcome (see color insert).
Testing of the performance of the classifier was done using leave-one-out cross-validation. One at a time, one patient (test sample) from one platform was left out ofthe gene selection and principal component selection as well as training of the fiveclassifiers. Then the genes selected based on the remaining samples were extractedfrom the test sample and projected onto the principal components calculated based onthe remaining samples. The resulting three principal components were input to fourclassifiers and used to predict the prognosis of the test sample. This entire procedurewas repeated for all samples until a prediction had been obtained for all. The resultingprediction was plotted according to the clinical outcome (death or survival includingcensorship) in a Kaplan–Meier plot (Figure 14.3).
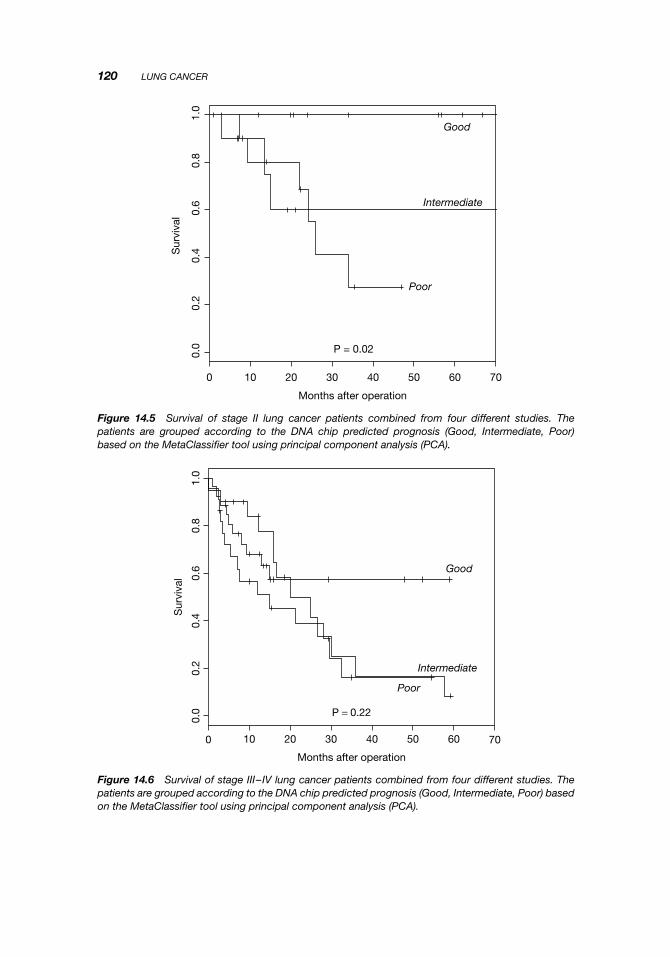
In Figures 14.4, 14.5, and 14.6, the outcomes for the individual stages of lung cancerare shown. It is clear that chip prognosis is independent of clinical staging and can beused to reclassify patients. For example, some stage I patients have a predicted Poorprognosis while some stage II patients have a predicted Good prognosis. This can havean effect on the choice of clinical treatment of the patient.
The leave-one-out cross-validation shown above uses information from all platformsto classify the left out sample. That means that the remaining samples from the platformwhere the left out sample comes from are used for predicting the prognosis. So thismethod does not fully test how well the extracted components can be used to classifyacross platforms. If we instead put three platform datasets in the training set and use

META-CLASSIFICATION OF LUNG CANCER 119
0 20 40 60 80 100
0.0
0.2
0.4
0.6
0.8
1.0
Months after operation
Sur
viva
l
Good
Intermediate
Poor
P = 3e−11
Figure 14.3 Survival of 269 lung cancer patients combined from four different studies. The patientsare grouped according to the DNA chip predicted prognosis (Good, Intermediate, Poor) based on theMetaClassifier tool using principal component analysis (PCA).
0 10 20 30 40 50 60 70
0.0
0.2
0.4
0.6
0.8
1.0
Months after operation
Sur
viva
l
Good
Intermediate
Poor
P = 0.0003
Figure 14.4 Survival of stage I lung cancer patients combined from four different studies. The patientsare grouped according to the DNA chip predicted prognosis (Good, Intermediate, Poor) based on theMetaClassifier tool using principal component analysis (PCA).
120 LUNG CANCER
706050403020100
0.0
0.2
0.4
0.6
0.8
1.0
Months after operation
Sur
viva
l
Good
Intermediate
Poor
P = 0.02
Figure 14.5 Survival of stage II lung cancer patients combined from four different studies. Thepatients are grouped according to the DNA chip predicted prognosis (Good, Intermediate, Poor)based on the MetaClassifier tool using principal component analysis (PCA).
0 10 20 30 40 50 60 70
0.0
0.2
0.4
0.6
0.8
1.0
Months after operation
Sur
viva
l
Good
Intermediate
Poor
P = 0.22
Figure 14.6 Survival of stage III–IV lung cancer patients combined from four different studies. Thepatients are grouped according to the DNA chip predicted prognosis (Good, Intermediate, Poor) basedon the MetaClassifier tool using principal component analysis (PCA).
META-CLASSIFICATION OF LUNG CANCER 121
0 20 40 60 80 100
0.0
0.2
0.4
0.6
0.8
1.0
Months after operation
Sur
viva
lGood
Intermediate
Poor
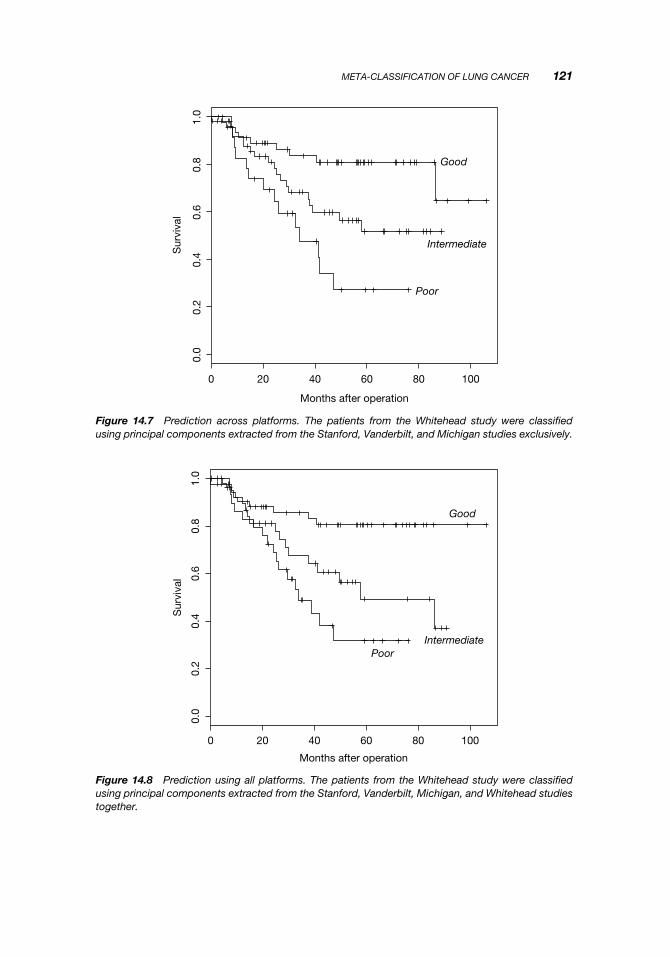
Figure 14.7 Prediction across platforms. The patients from the Whitehead study were classifiedusing principal components extracted from the Stanford, Vanderbilt, and Michigan studies exclusively.
0 20 40 60 80 100
0.0
0.2
0.4
0.6
0.8
1.0
Months after operation
Sur
viva
l
Good
IntermediatePoor
Figure 14.8 Prediction using all platforms. The patients from the Whitehead study were classifiedusing principal components extracted from the Stanford, Vanderbilt, Michigan, and Whitehead studiestogether.

122 LUNG CANCER
them to predict all the samples from the fourth platform dataset (test set), we directlydemonstrate the ability of components to be used for classification across platforms.
We still need to perform a PCA on the test set and to determine the sign of thecomponents between the training set and test set. Because information on the class labelof the test set is used for this matching (and also for the t-test selection preceding PCA),it is necessary to loop over the test set with a leave-one-out prediction so the classlabel of the predicted sample is not used in any way before prediction.
Figure 14.7 shows the results of predicting all the samples from the Whiteheaddataset using a classifier built on the Vanderbilt, Stanford, and Michigan datasets. Forcomparison, Figure 14.8 shows the results of predicting the Whitehead samples using aclassifier built on all four datasets. The performance is virtually the same, underscoringthe ability of principal components to transfer information necessary for classificationacross platforms.
14.3 SUMMARY
The application of DNA microarrays to lung cancer has been highly successful. Notonly have new subgroups with different prognoses been identified, but several studieshave been successful in predicting outcome. At least 575 patients have been includedin the studies so far. DNA microarrays appear ready to be used for the diagnosis oflung cancer.
FURTHER READING
Borczuk, A. C., Shah, L., Pearson, G. D., Walter, K. L., Wang, L., Austin, J. H., Fried-man, R. A., and Powell, C. A. (2004). Molecular signatures in biopsy specimens of lungcancer. Am. J. Respir. Crit. Care Med. 170(2):167–174.
Gordon, G. J., Rockwell, G. N., Godfrey, P. A., Jensen, R. V., Glickman, J. N., Yeap, B. Y.,Richards, W. G., Sugarbaker, D. J., and Bueno, R. (2005). Validation of genomics-basedprognostic tests in malignant pleural mesothelioma. Clin. Cancer Res. 11(12):4406–4414.
Heighway, J., Knapp, T., Boyce, L., Brennand, S., Field, J. K., Betticher, D. C., Ratschiller, D.,Gugger, M., Donovan, M., Lasek, A., and Rickert, P. (2002). Expression profiling of primarynon-small cell lung cancer for target identification. Oncogene 21(50):7749–7763.
Parmigiani, G., Garrett-Mayer, E. S., Anbazhagan, R., and Gabrielson, E. (2004). A cross-studycomparison of gene expression studies for the molecular classification of lung cancer. Clin.Cancer Res. 10(9):2922–2927.
Talbot, S. G., Estilo, C., Maghami, E., Sarkaria, I. S., Pham, D. K., O-charoenrat, P.,Socci, N. D., Ngai, I., Carlson, D., Ghossein, R., Viale, A., Park, B. J., Rusch, V. W.,and Singh, B. (2005). Gene expression profiling allows distinction between primary andmetastatic squamous cell carcinomas in the lung. Cancer Res. 65(8):3063–3071.
Virtanen, C., Ishikawa, Y., Honjoh, D., Kimura, M., Shimane, M., Miyoshi, T., Nomura, H.,and Jones, M. H. (2002). Integrated classification of lung tumors and cell lines by expressionprofiling. Proc. Natl. Acad. Sci. USA 99(19):12357–12362.
Yang, P., Sun, Z., Aubry, M. C., Kosari, F., Bamlet, W., Endo, C., Molina, J. R., and Vas-matzis, G. (2004). Study design considerations in clinical outcome research of lung cancerusing microarray analysis. Lung Cancer 46(2):215–226.