canadian small business exporters - bdc.ca · pdf filecanadian small business exporters...
TRANSCRIPT

Small Business Branch
www.ic.gc.ca/sbstatistics
Canadian Small Business ExportersSpecial Edition: Key Small Business Statistics
June 2011

For additional copies of this publication, please contact:
Publishing and Depository Services Public Works and Government Services Canada Ottawa ON K1A 0S5
Telephone (toll-free): 1-800-635-7943 (Canada and U.S.) Telephone (local): 613-941-5995 TTY: 1-800-465-7735 Fax (toll-free): 1-800-565-7757 (Canada and U.S.) Fax (local): 613-954-5779 Email: [email protected] Website: www.publications.gc.ca
This publication is available upon request in accessible formats. Contact:
Multimedia Services Section Communications and Marketing Branch Industry Canada Room 441E, East Tower 235 Queen Street Ottawa ON K1A 0H5
Telephone: 613-947-5177 Fax: 613-954-6436 Email: [email protected]
This publication is also available online at www.ic.gc.ca/sbstatistics.
Permission to Reproduce Except as otherwise specifically noted, the information in this publication may be reproduced, in part or in whole and by any means, without charge or further permission from Industry Canada, provided that due diligence is exercised in ensuring the accuracy of the information reproduced; that Industry Canada is identified as the source institution; and that the reproduction is not represented as an official version of the information reproduced, nor as having been made in affiliation with, or with the endorsement of, Industry Canada.
For permission to reproduce the information in this publication for commercial redistribution, please email [email protected].
Cat. No. lu186-1/2011-1E-PDF ISSN 1718-3456 60884
Aussi offert en français sous le titre Les petites entreprises exportatrices canadiennes — Édition spéciale : Principales statistiques relatives aux petites entreprises.
Printed on 50 recycled paper

Table of Contents
Foreword ..........................................................................................................................3
Highlights ........................................................................................................................5
Introduction 8
Data Sources and Methodology ........................................................................................8
Part 1: Key Statistics on Small Business Exports 11
1. Exports by Industry ................................................................................................11
2. Exports by Destination ...........................................................................................13
3. Exports by Province ................................................................................................19
4. Exports by Type of Commodity Exported by Small Firms .......................................20
5. Small Business Exporters in Selected Industries, by Destination ..........................22
6. Imports ....................................................................................................................23
Part 2: Financing Profile of Small and Medium-Sized Enterprise Exporters 24
1. SME Export Activity.................................................................................................24
2. ProfileofSMEExporters ........................................................................................29
3. Perceived Obstacles to Growth for SME Exporters ................................................31
4. Financing Activity ....................................................................................................33
5. Request and Approval Rates ..................................................................................34
6. Distribution of Approved Financing .........................................................................37
7. Intended Use of Debt Financing .............................................................................38
Conclusion .......................................................................................................................39
1

2
Part 3: SME Involvement in Global Value Chains 39
1. International Business Activities..............................................................................40
2. Relocation and Outsourcing of Business Activities .................................................41
3. Indirect Exports .......................................................................................................42

Special Edition: Key Small Business Statistics — June 2011
Foreword
Key Small Business Statistics is a semi-annual publication that provides baseline data on the small business sector in Canada. The first issue, usually published in the first half of a year, provides statistics on a special topic while the second issue, published in July, provides general statistics on small business. This special edition is devoted to Canadian small business exporters and includes three new sections.
1. Key Statistics on Small Business Exports presents information on the following:
• Exports by Industry
• Exports by Destination
o Top 20 Destinations
o Exports to BRIC (Brazil, Russian Federation, India and China) Countries
o Exports to the United States
• Exports by Province
• Exports by Type of Commodity Exported by Small Firms
• Small Business Exporters in Selected Industries, by Destination
• Imports
2. Financing Profile of Small and Medium-Sized Enterprise Exporters presents information on the following:
• SME Export Activity
• Profile of SME Exporters
• Perceived Obstacles to Growth for SME Exporters
• Financing Activity
• Request and Approval Rates
• Distribution of Approved Financing
• Intended Use of Debt Financing
3

4Canadian Small Business Exporters
3. SME Involvement in Global Value Chains presents information on the following:
• International Business Activities
• Most Relocated and Outsourced Business Activities
• Indirect Exports
The next edition of Key Small Business Statistics will include updated data on job creation, earnings by business size, numbers of self-employed workers and small business contribution to Canada’s gross domestic product.
This special edition and previous publications are available on the Small Business Research and Statistics website at www.ic.gc.ca/sbresearch.
Special Edition: Key Small Business Statistics — June 2011
Highlights
This special edition of Key Small Business Statistics includes three sections each using a different source of data. In the first section, the Exporter Register, which only includes merchandise exports over $30 000, is the primary source used. The source used in the second section is the Survey on Financing of Small and Medium Enterprises, which measures goods and services exports of any value. Finally, the Survey of Innovation and Business Strategy (SIBS) is the source used in the third section. This survey was conducted to better understand strategic decisions, innovation activities and operational tactics used by Canadian enterprises. For more details on these sources, see the Data Sources and Methodology section.
Key Statistics on Small Business Exports
• Nine percent of Canadian small and medium-sized enterprises (SMEs) export goods and services according to the Survey on Financing of Small and Medium Enterprises, which asks business owners to report their export activities. According to the Exporter Register, which tracks goods, it is estimated that 2 percent of SMEs export only goods.
• In 2009, about 86 percent of Canadian exporters were small businesses compared with 87 percent in 1999. They were responsible for $68 billion (25 percent) of the total value of exported goods, with an average value of $2 million per firm. Medium-sized businesses accounted for $51 billion (18 percent) of the total value of exports, while large businesses accounted for $157 billion (57 percent).
• The proportion of small businesses that export (1.4 percent) is lower than the proportion of small businesses in the overall economy (98 percent). About 31 000 small businesses exported goods in 2009.
• The largest contributions to exports by small businesses were in retail trade (79.1 percent), agriculture, forestry, fishing and hunting (72.3 percent) and other sectors (72 percent).
• In 2009, small businesses exported disproportionally more than medium-sized or large firms to a number of markets. They accounted for 65 percent of the value of Canadian exports to India. Other major export destinations for small firms were Egypt (63.3 percent), Turkey (60.6 percent) and South Korea (52.8 percent).
• The value of small business exports to BRIC (Brazil, Russian Federation, India and China) countries increased from about $1.3 billion in 1999 to $5.5 billion in 2009, representing approximately 2 percent and 7 percent of the total value of small business exports respectively.
5

6Canadian Small Business Exporters
• Small business enterprises accounted for approximately 23 percent of the value of exports to the United States in 2009. The main U.S. market for Canadian small businesses was the Midwest region (32 percent), while they exported the least to the Industrial Heartland (18 percent).
• In 1999, 2004 and 2009, 88 percent or more of the value of small business exports came from Quebec, Ontario, Alberta and British Columbia (including the Territories). Ontario and Alberta had the largest share of the value of exports among small businesses in 2009.
• In 2009, mineral products represented the largest proportion (almost 30 percent) of the value of small business exports, but enterprises exporting those goods accounted for only 1.4 percent of the total number of small business exporters.
• In 2008, the total value of imports to Canada was approximately $380 billion. Eighty-seven percent of importers were small businesses and were responsible for $88 billion (23 percent) of the total value of imports. In 2008, medium-sized businesses accounted for 9 percent of all importers, while large businesses represented about 4 percent of all importers.
Financing Profile of Small and Medium-Sized Enterprise Exporters
• In 2007, the likelihood of exporting increased with business size, both in terms of number of employees and revenue size.
• Among SME exporters, the percentage of revenues derived from exports of goods and services was similar across all size groups (average of 47 percent), suggesting that firm size did not determine export intensity.
• On average, exporters were more innovative (investing more in research and development) and growth oriented, and had been in operation for more years than non-exporters.
• SME exporters were more likely to request external financing than non-exporters (27 percent compared with 17 percent in 2007), but were also more likely to report obtaining external financing as an obstacle to business growth (21 percent compared with 17 percent in 2007).
• In both 2004 and 2007, the average SME exporter requested a higher amount of debt financing than its non-exporter counterpart. Specifically, in 2004 the average loan was $209 000 for SME exporters and $141 000 for non-exporters. In 2007, the average loan was $461 000 for SME exporters and $232 000 for non-exporters.

Special Edition: Key Small Business Statistics — June 2011
• SME exporters had greater difficulty obtaining approval for external financing in 2004 (86 percent approval rate versus 91 percent approval rate for non-exporters), but had a slightly easier time in 2007 (97 percent approval rate versus 96 percent approval rate for non-exporters). Although approval rates decreased in 2009, exporters had less difficulty obtaining external financing than non-exporters (85 percent versus 79 percent).
SME Involvement in Global Value Chains
• Approximately 50 percent of manufacturing enterprises engaged in international business activities between 2007 and 2009.
• Between 2007 and 2009, medium-sized manufacturing enterprises displaced (relocated or outsourced) out of Canada more business activities in the production of goods than small and large manufacturing enterprises. Over the same period, small manufacturing enterprises were more likely to displace their marketing, sales and after sales services than medium-sized and large enterprises.
• Small and medium-sized manufacturing enterprises were more likely than large manufacturing enterprises to fill orders from domestic buyers and then export the goods “as is.” Specifically, 21 percent of small enterprises and 24 percent of medium-sized enterprises were indirect exporters of final goods compared with 17 percent of large enterprises.
Questions and Comments
If you have questions or comments about the content of this publication, please send them to [email protected].
7

8Canadian Small Business Exporters
Introduction
Exporting is vital to Canada’s economy and has accounted for close to 40 percent of Canada’s gross domestic product (GDP) in recent years, with the exception of 2009. In 2009, exports of goods and services accounted for 30 percent of GDP,1 which could be explained by the global recession and the high value of the Canadian dollar. Exports can be a driver of economic growth and are strongly correlated with real GDP growth.2 Furthermore, exporting can provide a strategically important means of growing a firm by expanding its market beyond the confines of Canada’s relatively small domestic market.
Small businesses represent 98 percent of all employer businesses in Canada and employ 48 percent of the total labour force in the private sector.3 Given the importance of small business in the Canadian economy and the significant role of exports within it, it seems appropriate to dedicate this special edition of Key Small Business Statistics to small business exporters.
Data Sources and Methodology
Three different sources have been used to produce this special edition of Key Small Business Statistics:
Exporter Register Database — part 1
Survey on Financing of Small and Medium Enterprises — part 2
Survey of Innovation and Business Strategy (SIBS) — part 3
Exporter Register Database
Statistics Canada’s Business Register is the main repository of information on businesses operating in Canada and is the principal frame for the Exporter Register Database. The main sources on trade data used by Statistics Canada are U.S. Customs and Border Protection and the Canada Border Services Agency.
The Exporter Register Database provides information on exporters by industry, exporter size, province or territory of residence, destination and employment size. Special tabulations from
1 This estimate is based on figures from Statistics Canada’s Canadian International Merchandise Trade data. It should be noted that the total value of exports presented throughout this report comes from the Exporter Register Database, which only includes commodities and therefore differs from figures from Canadian International Merchandise Trade data.
2 Awokuse, Titus O., 2003. “Is the Export-led Growth Hypothesis Valid for Canada?” Canadian Journal of Economics, 36 (1), pp. 126–136.
3 Small and medium-sized enterprises represent 99 percent of employer businesses and employ 64 percent of the labour force in the private sector.

Special Edition: Key Small Business Statistics — June 2011
Statistics Canada have enabled studying most of these aspects by firm size, defined in terms of the number of employees. The years studied in this report are 1999, 2004, 2007, 2008 and 2009.4
The statistical unit of measure in these tabulations is an enterprise. Statistics Canada defines a statistical enterprise as the entity at the top of the hierarchy, which is associated with a complete (consolidated) set of financial statements. It represents the sum of the statistical establishments under its control. In this report, small enterprises are defined as those with 0 to 99 employees, medium enterprises have 100 to 499 employees and large enterprises are those with 500 or more employees. Both employer and non-employer (indeterminate) businesses are included in these observations, while businesses exporting commodities valued at less than $30 000 per year are excluded.
Survey on Financing of Small and Medium Enterprises
The second section of this report uses the comprehensive database of the SME Financing Data Initiative Survey on Financing of Small and Medium Enterprises, which was launched in 2001 by Statistics Canada in partnership with Industry Canada and Finance Canada. The survey, conducted every three years, measures the demand for, and sources of, financing for Canadian small and medium-sized enterprises (SMEs). The database includes information on the financing application process, firm profiles and demographic characteristics of SME ownership.
According to the Survey on Financing of Small and Medium Enterprises, SME exporters are defined as businesses with fewer than 500 employees and less than $50 million in annual revenues that sold any value of goods or services outside of Canada during the survey period (2004 or 2007). The sample excludes non-profit and government organizations, schools, hospitals, subsidiaries, co-operatives, and financing and leasing companies.
Exporter figures from the Survey on Financing of Small and Medium Enterprises may not be comparable with those from Statistics Canada’s Exporter Register. The Survey on Financing of Small and Medium Enterprises captures export sales of both goods and services at any value, whereas the Exporter Register captures only export sales of merchandise (goods) valued at $30 000 or more. Moreover, exporter information from the Exporter Register is taken from U.S. Customs and Border Protection documents and Canada Border Services Agency documents, whereas exporter information from the Survey on Financing of Small and Medium Enterprises is self-reported by the survey respondent. Another reason for possible discrepancies is that data from the Survey on Financing of Small and Medium Enterprises are from a selected sample of the total SME population and exclude non-profit and government organizations, schools, hospitals, subsidiaries, co-operatives, and financing and leasing companies.
4 Exporter Register 2008 is the source for 1999, 2004, 2007 and 2008 and Exporter Register 2009 for 2009.
9

10Canadian Small Business Exporters
Survey of Innovation and Business Strategy
The third section of this report uses the Survey of Innovation and Business Strategy to study the involvement of SMEs in global value chains. SIBS was developed by Statistics Canada in partnership with Industry Canada and Foreign Affairs and International Trade Canada. It was initiated in 2007–2008 to better understand the market and policy factors that encourage or discourage the adoption of entrepreneurial and innovation-oriented business strategies.
The target population was enterprises with at least 20 employees and revenues of at least $250 000 in a set of 67 industries and groupings of industries. According to SIBS, small firms are defined as those with 20 to 99 employees, medium firms are those with 100 to 249 employees and large firms have at least 250 employees.

Special Edition: Key Small Business Statistics — June 2011
Part 1: Key Statistics on Small Business Exports
This section investigates the importance of small business in international markets by examining the number of exporters of merchandise and the value of exports by industry, province, destination and firm size. Furthermore, this study investigates types of commodities exported by small businesses and changes in their exposure to emerging markets.
1. Exports by Industry
Table 1.1 shows the distribution of the value of exports by industry and size of firm in 2009. In 2009, the total value of merchandise exports by Canadian enterprises was approximately $300 billion.5 This represents a decline of about $114 billion (27.5 percent) compared with 2008 and of $94 billion (24 percent) compared with 2007. A reduction in the demand for Canadian goods and other effects of the global recession made 2009 a particularly difficult year for exports.
In 2009, about 86 percent of Canadian exporters were small businesses compared with 85 percent in 2008 and 87 percent in 1999. More importantly, small businesses were responsible for $68 billion (25 percent) of the total value of exports in 2009, with an average value of $2 million per firm. Medium-sized businesses accounted for $51 billion (18 percent) of the total value of exports in 2009, with an average value of $13 million per firm. Large businesses accounted for $157 billion (57 percent) of the total value of exports, with an average value of $139 million per firm.
Small business’ contribution to the total value of exports decreased by 2.5 percentage points in 2009 compared with 1999, while that of medium-sized firms increased by 8.7 percentage points. The contribution of large firms to the total value of exports decreased by 6 percentage points over the same period.
5 The total value of exports in 2009 was about $300 billion. However, once the values are distributed by firm size and industry, about $24 billion of exports are classified as confidential. Therefore, the percentages presented in the text and Table 1.1 are calculated using $276 billion as the total value of exports.
11

12Canadian Small Business Exporters
Table 1.1: Distribution of the Total Value of Exported Merchandise by Industry and Size of Business (Number of Employees), 20091
Industry Grouping (NAICS) Total Value ($ millions)
Size of Business Enterprise - Number of Employees (percent of total)2
Total (all business
sizes) Small (<100)
Medium (100–499)
Large (500+)
Agriculture, Forestry, Fishing and Hunting 3 224 1.2 72.3 9.2 18.5
Mining, Oil and Gas Extraction/Utilities A: 42 671 15.4 13.6 8.6 77.8
B: 44 356
Construction 1 407 0.5 71.3 23.7 5.1
Manufacturing A: 165 032 59.7 12.1 22.3 65.6
B: 169 233
Wholesale Trade 30 793 11.1 70.0 20.9 9.0
Retail Trade 1 753 0.6 79.1 3.9 17.0
Transportation and Warehousing A: 341 0.1 x 100.0 x
B: 18 196
Information and Cultural Industries 498 0.2 52.8 43.1 4.1
Finance and Insurance 9 851 3.6 62.2 6.8 31.0
Business Services 17,504 6.3 41.4 8.0 50.6
Other 3 485 1.3 72.0 19.2 8.8
Industry Aggregate Total A: 275 557 100.0 24.7 18.4 56.9
B: 300 298
Total
Number of Firms
Small (<100)
Medium (100–499)
Large (500+)
All Industry Exports A: 36 154 86.2 10.7 3.1
B: 38 675
Source: Statistics Canada, Exporter Register, 2009.Note 1: Data that are confidential are denoted by X.Note 2: Some values were not classified by firm size due to confidentiality; therefore, the totals are calculated as follows: A: Total value of exports (small, medium and large categories) B: Total value of exports (small, medium, large and confidential categories)

Special Edition: Key Small Business Statistics — June 2011
The proportion of small businesses that export (1.4 percent) is lower than the proportion of small businesses in the overall economy (98 percent). In 2009, 27 percent of medium-sized businesses and 40 percent of large businesses exported. About 2 percent of small and medium-sized enterprises exported goods in 2009.6 They accounted, however, for over 40 percent of the overall export value in 2009.
Small businesses contributed only about 12 percent to total manufacturing exports compared with 66 percent from large firms. In most other industries, however, small businesses made the largest contribution to exports. The largest contributions were in retail trade (79.1 percent), agriculture, forestry, fishing and hunting (72.3 percent) and other sectors (72 percent).
2. Exports by Destination
2.1. Top 20 Destinations
Table 1.2 shows the contribution to the value of exports in 1999 and 2009 for the top 20 export destinations, by firm size. In both years, the top two export destinations for all Canadian exporters were the United States and the European Union (EU). Japan was third in 1999, but was replaced by China in 2009. The percentage of the total value of Canadian exports to the United States has decreased from 87 percent in 1999 to 78 percent in 2008 and 75 percent in 2009. The value of exports to the EU, on the other hand, has increased from 4.6 percent of the total value of exports in 1999 to 8.7 percent in 2009, with the top three EU export destinations in both years being the United Kingdom, Germany and France. The value of exports to Japan has remained the same in both years at 2.5 percent. There has been an important increase in the value of exports to China, representing 0.8 percent of the total value of Canadian exports in 1999 and 3.2 percent in 2009.
6 Indeterminate firms are included in the count of small businesses. See “Data Sources and Methodology” for more details about the differences in figures reported in this and the following section.
13

14Canadian Small Business Exporters
Table 1.2: Top 20 Export Destinations, Value (Percent) of Exports, by Firm Size (Number of Employees), 1999 and 20091
CountrySmall (<100) Medium (100–499) Large (500+) All Firms
1999
1. United States2 19.0 13.7 67.4 87.0
2. European Union 21.8 15.7 62.5 4.6
2.1 United Kingdom 15.7 14.6 69.8 1.3
2.2 Germany 21.8 20.2 57.9 0.7
2.3 France 17.5 11.1 71.4 0.5
3. Japan 32.2 14.9 52.9 2.5
4. China 35.8 14.4 49.8 0.8
5. South Korea 36.7 6.4 56.9 0.6
6. Mexico 15.4 13.4 71.2 0.5
7. Taiwan 36.9 11.3 51.8 0.3
8. Australia 22.0 16.5 61.5 0.3
9. Brazil 24.8 14.5 60.6 0.3
10. Hong Kong 40.8 18.1 41.1 0.3
11. Norway 5.2 5.7 89.1 0.2
12. Indonesia 31.4 14.7 53.9 0.2
13. Iran 10.7 x x 0.2
14. Algeria x 4.2 x 0.1
15. Switzerland 17.6 16.5 65.9 0.1
16. Venezuela 27.7 21.9 50.4 0.1
17. Malaysia 27.4 21.7 50.9 0.1
18. India 54.8 14.1 31.1 0.1
19. Cuba 48.8 14.2 37.0 0.1
20. Chile 40.0 18.1 42.0 0.1
All Other Countries 29.9 19.6 50.5 1.7
Total ($ millions)3 64 185 44 354 211 148 320 539
Source: Statistics Canada, Exporter Register, 2008 and 2009.Note 1: Data that are confidential are denoted by X.Note 2: See Table 1.4 for the breakdown of exports by U.S. region.Note 3: The values for small, medium-sized and large enterprises may not equal the total value of exports in 1999 because some figures were excluded due to confidentiality.
The majority of countries as well as their rankings in the top 10 export destinations are very similar in the two years observed in Table 1.2. India is an exception as it was not among the top 10 export destinations in 1999, but was ranked seventh in 2009. On the other hand, countries

Special Edition: Key Small Business Statistics — June 2011
CountrySmall (<100) Medium (100–499) Large (500+) All Firms
2009
1. United States 22.7 14.6 62.8 74.9
2. European Union 23.4 31.5 45.1 8.7
2.1 United Kingdom x x 32.2 3.7
2.2 Germany 21.6 15.0 63.3 1.0
2.3 France 23.9 9.8 66.3 0.8
3. China 36.8 12.3 50.9 3.2
4. Japan 49.5 15.4 35.1 2.5
5. Mexico 17.7 20.9 61.4 1.1
6. South Korea 52.8 10.4 36.9 1.0
7. India 65.1 15.2 19.7 0.6
8. Australia 24.0 23.5 52.5 0.5
9. Brazil 33.5 18.9 47.6 0.5
10. Hong Kong 43.5 13.0 43.5 0.4
11. Switzerland 16.6 6.1 77.3 0.4
12. Saudi Arabia 40.5 25.0 34.5 0.3
13. Taiwan 45.4 12.1 42.5 0.3
14. United Arab Emirates 47.6 25.4 27.0 0.3
15. Indonesia 44.1 45.7 10.2 0.3
16. Singapore 19.7 14.2 66.1 0.3
17. Turkey 60.6 15.5 24.0 0.3
18. Russian Federation 47.3 27.0 25.7 0.2
19. Egypt 63.3 13.8 22.9 0.2
20. Venezuela 20.3 39.1 40.7 0.2
All Other Countries 38.1 33.5 28.4 3.8
Total ($ millions) 76 770 51 059 172 469 300 298
Table 1.2: Top 20 Export Destinations, Value (Percent) of Exports, by Firm Size (Number of Employees), 1999 and 20091 (continued)
Source: Statistics Canada, Exporter Register, 2008 and 2009.Note 1: Data that are confidential are denoted by X.Note 2: See Table 1.4 for the breakdown of exports by U.S. region.Note 3: The values for small, medium-sized and large enterprises may not equal the total value of exports in 1999 because some figures were excluded due to confidentiality.
ranked from 11th to 20th differ greatly from one year to the other. For example, Saudi Arabia, Singapore, Turkey, the Russian Federation and a few other countries were not included in the top 20 export destinations in 1999, but accounted for relatively significant shares of the total value of exports in 2009. This may be an indication of market diversification among exporters.
15

16Canadian Small Business Exporters
Table 1.3: The Herfindahl-Hirschman Index
Small Medium Large All Firms
1999 0.68 0.74 0.79 0.76
2009 0.46 0.45 0.68 0.57
Source: Industry Canada calculations.
To investigate this matter further, the Herfindahl-Hirschman Index (HHI),7 which measures market concentration and/or diversification, was used (Table 1.3). In general, the export market appears more diversified in 2009 than in 1999 for all firm sizes. In 1999, small firms had the most diversified export market, whereas medium-sized firms had the most diversified export market in 2009 (although small firms followed very closely). In the same year, the HHI for both small and medium-sized firms was lower than that for large firms, indicating more diversification in the export markets of SMEs.
Of exports destined for the United States in 1999, small firms sent almost 20 percent, while large firms sent about 67 percent. These figures changed slightly in 2009, with small and large firms contributing almost 23 percent and 63 percent, respectively, to exports to the United States. While the figures for these two years are fairly similar, it should be noted that there has been an important decrease in exports in 2009 compared with 2008. In fact, small business exports to the United States fell by 30 percent while those of medium-sized firms fell by 25 percent and large firms fell by 31 percent.
Among the top 20 destinations in 1999, the highest share of the value of exports for small firms within each destination was in India (54.8 percent). Other top destinations for small firms included Cuba (48.8 percent), Hong Kong (40.8 percent) and Chile (40 percent). The main export destinations for small businesses were somewhat different in 2009. Small businesses accounted for 65 percent of the value of exports to India. Other countries among the top 10 where the value of exports contributed by small firms was the highest among the three firm-size categories were South Korea (52.8 percent) and Japan (49.5 percent). Other major export destinations for small firms were Egypt (63.3 percent), Turkey (60.6 percent) and United Arab Emirates (47.6 percent).
2.2. Exports to BRIC (Brazil, Russian Federation, India and China) Countries
A recent report on trade and innovation highlighted the rise of BRIC countries as economic superpowers and the importance of recognizing the dynamism and benefits of developing deeper trading relationships with those countries.8
7 The Herfindahl-Hirschman Index is a commonly accepted measure of market concentration. Markets with a high HHI are considered to be highly concentrated. An index of one indicates a fully concentrated market. In this case, the HHI was calculated by squaring each share of the total value of exports, for each firm size, and summing the resulting numbers.
8 Institute for Competitiveness and Prosperity, Trade, Innovation and Prosperity, Working Paper 14, September 2010.

Special Edition: Key Small Business Statistics — June 2011
In 1999, exports to BRIC countries accounted for about 1 percent of the total value of exports, but reached 4.5 percent in 2009.9 The value of small business exports to BRIC countries increased from about $1.3 billion in 1999 to $5.5 billion in 2009, representing approximately 2 percent and 7 percent of the total value of small business exports respectively.10
Figure 1.1 illustrates the percentage of the total value of exports to each of the BRIC countries in 1999, 2004, 2007, 2008 and 2009 (2007, 2008 and 2009 for Russia), by firm size. Of all firms exporting to India, small firms contributed the most in each of the years observed. In 1999, small firms sent 55 percent of Canadian exports to India. This number decreased to about 45 percent in 2004 and reached 65 percent in 2009. Similarly, in the case of Russia, small firms contributed most to the total value of exports, representing 48 percent in 2007, 41 percent in 2008 and 47 percent in 2009.
Figure 1.1: Value of Exports (Percent) to BRIC Countries, by Firm Size, 1999, 2004, 2007, 2008 and 20091
0
10
20
30
40
50
60
70
LargeMediumSmall
20092008200720041999
Brazil
China
Valu
e o
f E
xport
s (p
erc
ent)
0
10
20
30
40
50
60
70
LargeMediumSmall
200920082007
0
10
20
30
40
50
60
70
LargeMediumSmall
20092008200720041999 0
10
20
30
40
50
60
70
LargeMediumSmall
20092008200720041999
Russia
India
25
15
61
36
14
50
27
16
57
35
12
53
34
19
48 48
29
23
42
31 27
47
2726
55
14
31
45
12
43
49
14
36
62
11
27
65
1520
36
50
14
30
9
61
30
11
59
39
10
52
37
12
51
Source: Statistics Canada, Exporter Register, 2008 and 2009.Note 1: Figures for 1999 and 2004 were not available for the Russian Federation.
9 The exact value of exports to Russia in 1999 was not available, but given that a maximum possible value was approximated, this remains a fair estimate.
10 Idem.17

18Canadian Small Business Exporters
Large Canadian businesses were contributing the most to the value of exports to China and Brazil, although this proportion has been decreasing while the value of exports sent by small firms has been fairly stable. For example, large business exports represented about 60 percent of the total value of exports to China in 2004 and 2007, but 50 percent in 2009. In contrast, small firm exports corresponded to 30 percent of all exports to China in 2007, 39 percent in 2008 and 37 percent in 2009. The percentage of medium-sized firms exporting to BRIC countries has been fairly constant over the years observed.
2.3. Exports to the United States
The contribution by small enterprises to exports to the United States has increased slightly from 19 percent in 1999 to 22.7 percent in 2009 (Table 1.4). The opposite has occurred among large enterprises, with the value of exports decreasing from 67.4 percent of total exports in 1999 to 62.8 percent in 2009, possibly due to the crisis in the automotive sector. Medium-sized enterprises contributed the least to exports to the United States, with approximately 14 percent of the total value of exports to the United States in both 1999 and 2009.
Small enterprises contributed most to exports sent to the Midwest, accounting for almost 30 percent of the value of exports to that region in 1999 and 32 percent in 2009. While small enterprises had their lowest contribution in both years to exports sent to the Industrial Heartland, these contributions increased from 11 percent in 1999 to almost 18 percent in 2009.
Large enterprises were the main contributors to exports to all U.S. regions, the largest contribution being sent to the Industrial Heartland (79.2 percent in 1999 and 71.5 percent in 2009).

Special Edition: Key Small Business Statistics — June 2011
Table 1.4: Value of Exports (Percent) to Each Region of the United States, by Size of Business (Number of Employees), 1999 and 2009
Region1Small (<100) Medium (100–499) Large (500+)
1999 2009 1999 2009 1999 2009
Eastern Seaboard 20.3 23.6 17.6 16.7 62.1 59.7
Industrial Heartland 11.4 17.7 9.5 10.9 79.2 71.5
Midwest 29.8 32.0 16.1 16.8 54.0 51.2
Southeast 26.2 19.9 18.8 19.5 55.0 60.6
West 24.2 23.2 12.2 14.2 63.5 62.6
Total U.S. $ million
19.0 52 900
22.7 51 000
13.7 38 100
14.6 33 000
67.4 187 900
62.8 141 000
Source: Statistics Canada, Exporter Register, 2008 and 2009.Note 1: The regions are defined as follows:Eastern Seaboard: Connecticut, Delaware, District of Columbia, Maine, Maryland, Massachusetts, New Hampshire, New Jersey, New York, North Carolina, Pennsylvania, Rhode Island, Vermont, Virginia, West VirginiaIndustrial Heartland: Illinois, Indiana, Kentucky, Michigan, Ohio, WisconsinMidwest: Colorado, Idaho, Iowa, Kansas, Minnesota, Missouri, Montana, Nebraska, New Mexico, North Dakota, Oklahoma, South Dakota, Texas, Utah, WyomingSoutheast: Alabama, Arkansas, Florida, Georgia, Louisiana, Mississippi, Puerto Rico, South Carolina, Tennessee, U.S. Virgin IslandsWest: Alaska, Arizona, California, Hawaii, Nevada, Oregon, Washington
3. Exports by Province
In each of the three years observed, 1999, 2004 and 2009, 88 percent or more of the value of small business exports came from Quebec, Ontario, Alberta and British Columbia (including the Territories) (Table 1.5). In 1999, Ontario had the largest share of the value of exports among small businesses at 34.5 percent. This share decreased to 26.5 percent in 2004 and increased to 28.2 percent in 2009. The opposite occurred among small business exporters in Alberta, who accounted for almost 26 percent of the value of exports in 1999, 43 percent in 2004 and almost 31 percent in 2009. The changes in these two provinces may be attributable to a large decrease in the value of exports in the manufacturing sector (located mainly in Ontario) and the fact that the value of exports in the oil and mining sectors (concentrated mainly in Alberta) had been increasing until 2008. Exports by small businesses have remained fairy stable in all other provinces.
19

20Canadian Small Business Exporters
Table 1.5: Value of Exports (Percent) by Province within Each Firm Size Class (Number of Employees), 1999, 2004 and 20091
ProvinceSmall (<100) Medium (100–499) Large (500+)
1999 2004 2009 1999 2004 2009 1999 2004 2009
Newfoundland and Labrador 0.4 0.3 0.9 0.2 0.2 0.2 0.2 0.3 0.1
Prince Edward Island 0.3 0.2 0.2 x x x x x x
Nova Scotia 2.0 1.8 2.2 1.1 1.1 1.0 0.5 0.4 0.4
New Brunswick 1.0 0.9 0.9 3.0 2.8 2.3 1.4 2.8 3.4
Quebec 16.3 14.2 16.0 20.3 20.1 18.2 17.5 17.6 18.0
Ontario 34.5 26.5 28.2 54.9 51.8 46.7 62.8 54.7 41.8
Manitoba 2.4 1.8 3.7 2.9 1.8 7.1 2.7 2.9 2.6
Saskatchewan 3.2 2.1 4.3 1.8 1.7 2.3 0.9 1.1 2.9
Alberta 25.7 43.1 30.9 6.7 10.8 14.9 6.9 12.8 26.4
British Columbia and Territories 14.1 9.2 12.8 9.1 9.5 7.3 7.2 7.4 4.3
Canada ($ millions) 64 200 89 600 76 800 44 300 51 000 51 000 212 000 226 900 172 500
Source: Statistics Canada, Exporter Register, 2008 and 2009.Note 1: Data that are confidential are denoted by X.
In the case of medium-sized firms, there have not been significant changes in the shares of the values of exports in each province. Similar conclusions can be drawn for large firms in most provinces, with the exception of Ontario and Alberta. For example, while Ontario has accounted for the largest share of exports among large firms, this share has decreased from 62.8 percent in 1999 to 41.8 percent in 2009. On the other hand, the share of exports among large enterprises in Alberta increased from almost 7 percent in 1999 to 26 percent in 2009.
As highlighted at the beginning of this report, the overall value of exports has decreased considerably in 2009 as one of the consequences of the global recession. The value of small business exports decreased by about $21 billion from 2008 to 2009 (not shown in table). Small businesses in Ontario accounted for 16 percent of that loss while those in Alberta accounted for about 60 percent. This loss could be explained by an important decrease in exports in finance and insurance industries, many of which may be facilitating trade of oil and gas, Alberta’s main exports. While the decrease in the value of exports was important, the number of small firms exporting from each of these provinces has not changed significantly.
4. Exports by Type of Commodity Exported by Small Firms
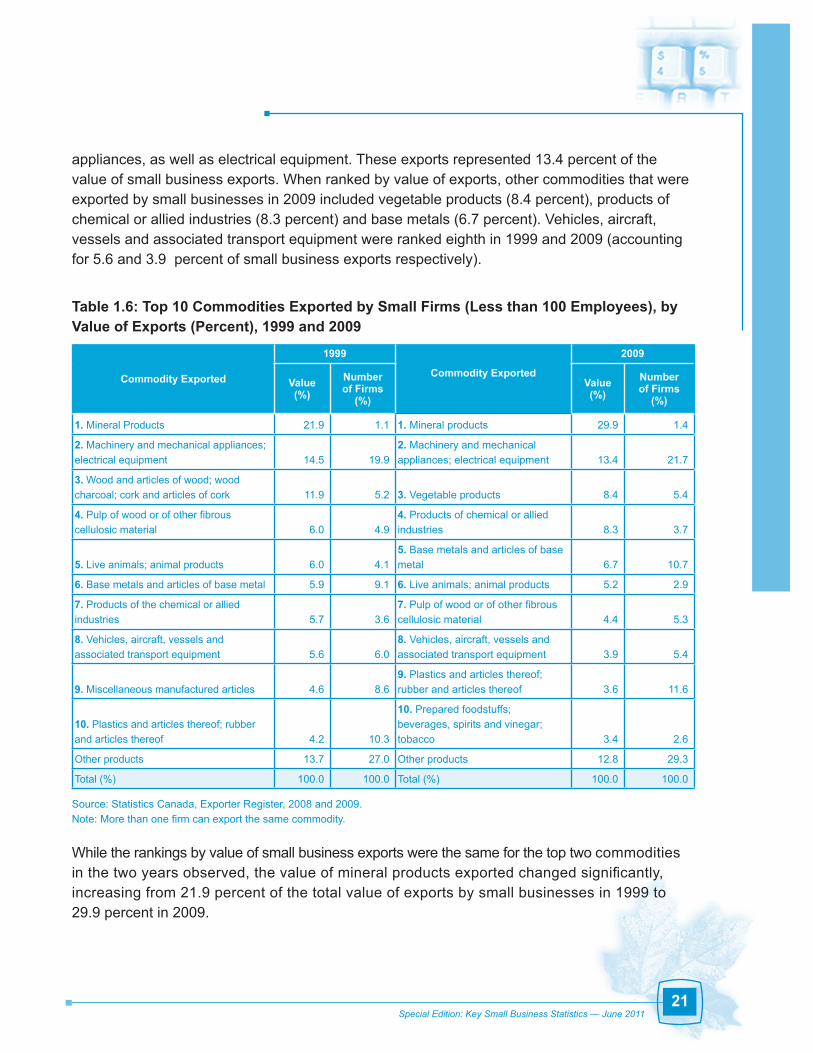
In 2009, mineral products represented the largest proportion (almost 30 percent) of the value of small business exports, but enterprises exporting those goods accounted for only 1.4 percent of the total number of small business exporters (Table 1.6). In the same year, the commodities exported by the largest proportion of small firms (21.7 percent) were machinery and mechanical
Special Edition: Key Small Business Statistics — June 2011
appliances, as well as electrical equipment. These exports represented 13.4 percent of the value of small business exports. When ranked by value of exports, other commodities that were exported by small businesses in 2009 included vegetable products (8.4 percent), products of chemical or allied industries (8.3 percent) and base metals (6.7 percent). Vehicles, aircraft, vessels and associated transport equipment were ranked eighth in 1999 and 2009 (accounting for 5.6 and 3.9 percent of small business exports respectively).
Table 1.6: Top 10 Commodities Exported by Small Firms (Less than 100 Employees), by Value of Exports (Percent), 1999 and 2009
Commodity Exported
1999
Commodity Exported
2009
Value (%)
Number of Firms
(%)Value (%)
Number of Firms
(%)
1. Mineral Products 21.9 1.1 1. Mineral products 29.9 1.4
2. Machinery and mechanical appliances; electrical equipment 14.5 19.9
2. Machinery and mechanical appliances; electrical equipment 13.4 21.7
3. Wood and articles of wood; wood charcoal; cork and articles of cork 11.9 5.2 3. Vegetable products 8.4 5.4
4. Pulp of wood or of other fibrous cellulosic material 6.0 4.9
4. Products of chemical or allied industries 8.3 3.7
5. Live animals; animal products 6.0 4.15. Base metals and articles of base metal 6.7 10.7
6. Base metals and articles of base metal 5.9 9.1 6. Live animals; animal products 5.2 2.9
7. Products of the chemical or allied industries 5.7 3.6
7. Pulp of wood or of other fibrous cellulosic material 4.4 5.3
8. Vehicles, aircraft, vessels and associated transport equipment 5.6 6.0
8. Vehicles, aircraft, vessels and associated transport equipment 3.9 5.4
9. Miscellaneous manufactured articles 4.6 8.69. Plastics and articles thereof; rubber and articles thereof 3.6 11.6
10. Plastics and articles thereof; rubber and articles thereof 4.2 10.3
10. Prepared foodstuffs; beverages, spirits and vinegar; tobacco 3.4 2.6
Other products 13.7 27.0 Other products 12.8 29.3
Total (%) 100.0 100.0 Total (%) 100.0 100.0
Source: Statistics Canada, Exporter Register, 2008 and 2009.Note: More than one firm can export the same commodity.
While the rankings by value of small business exports were the same for the top two commodities in the two years observed, the value of mineral products exported changed significantly, increasing from 21.9 percent of the total value of exports by small businesses in 1999 to 29.9 percent in 2009.
21

22Canadian Small Business Exporters
5. Small Business Exporters in Selected Industries, by Destination
Table 1.7 presents the percentage of small enterprises in selected industries (those with the highest number of small businesses) that exported to the United States, the European Union, Japan, Mexico, South America and other countries in 1999 and 2009. For example, 59.7 percent of small business exporters in the manufacturing sector in 2009 exported to the United States. It should be noted that one firm can export to more than one destination and that not all industries are shown in this table. Therefore, the percentages for each year may not add up to 100 percent.
Table 1.7: Small Business Exporters (Percent) by Selected Industries and Destination, 1999 and 20091
IndustryUnited States
European Union Japan Mexico South
America Other
1999 2009 1999 2009 1999 2009 1999 2009 1999 2009 1999 2009
Construction 76.5 61.6 6.5 11.4 3.1 x 0.2 0.8 1.2 3.2 12.5 23.0
Manufacturing 78.8 59.7 8.4 13.3 2.2 3.0 0.2 2.4 1.2 4.3 8.0 17.4
Wholesale Trade 66.4 46.6 10.3 14.1 4.4 3.7 0.7 2.2 2.2 4.8 16.0 28.5
Retail Trade 78.5 49.7 7.9 16.9 1.9 2.0 0.4 1.1 1.0 1.9 10.3 28.3
Professional Services 77.3 47.8 8.0 15.6 1.8 3.7 0.2 2.5 1.3 4.5 11.2 25.9
Accommodation and Food 72.3 54.0 6.4 16.9 2.8 2.3 x x x 2.1 18.4 24.7
Source: Statistics Canada, Exporter Register, 2008 and 2009.Note 1: Data that are confidential are denoted by X.
The percentage of small enterprises exporting to the United States from each of the selected industries decreased in 2009 compared with 1999. In 2009, the greatest percentages of small business exporters to the United States were in the construction and manufacturing sectors (61.6 percent and 59.7 percent respectively). In comparison, small firms in those industries exported more to the European Union in 2009 than in 1999. In 2009, the greatest percentages of small business exporters to the European Union were in the accommodation and food, and retail trade sectors (almost 17 percent of firms in each of the two industries).
While the proportion of small firms exporting to Mexico from each of the industries was less than 0.8 percent in 1999, the proportions increased in 2009 in each of the industries from 0.8 percent of firms in construction to 2.5 percent of firms in professional services.
In 1999, Japan was the third-ranked export destination for small businesses in the selected industries, after the United States and the European Union. In 2009, small businesses in those industries were exporting more to South America than to Japan.

Special Edition: Key Small Business Statistics — June 2011
6. Imports
In 2008, the total value of imports to Canada was approximately $380 billion. Eighty-seven percent of importers were small businesses and were responsible for $88 billion (23 percent) of the total value of imports. Medium-sized businesses accounted for 9 percent of all importers and were responsible for $68 billion (18 percent) of the total value of imports. Large businesses represented about 4 percent of all importers and accounted for $223 billion (59 percent) of the total value of imports in 2008.
Figure 1.2 shows the top five countries from which imports were obtained for small Canadian enterprises in 2008. Half of the value of small business imports (about $44 billion) came from the United States. The second most important source of imports was China, accounting for 17 percent of the total value of imports. Japan and Germany accounted for 4 percent of the value of imports each, while Italy was fifth at 2.3 percent. Imports from countries such as Mexico, Taiwan, France, the United Kingdom, South Korea, Thailand and India represented between 1 and 2 percent (not shown in figure) of the total value of imports while other countries accounted for less than 1 percent.
Figure 1.2: Top Five Countries Providing Imports for Small Firms, Value (Percent) of Imports, 2008
Other countries
Italy
Germany
Japan
China
United States
50%
17%
4%
4%
2%
23%
Source: Statistics Canada, Importer Register, 2008.
In general, these percentages have not changed significantly compared with 2002, with the exception of China. The value of imports from China has increased from about $8 billion in 2002 to $15 billion in 2008, representing 8 percent and 17 percent of the total value of imports respectively.
23

24Canadian Small Business Exporters
Part 2: Financing Profile of Small and Medium-Sized Enterprise Exporters
This section provides a profile of Canadian small and medium-sized enterprises (SMEs) that exported in 2007. Using data from Statistics Canada’s Survey on Financing of Small and Medium Enterprises (2004 and 2007), the report measures export propensity (percentage of firms that export) and export intensity (percentage of revenues from exports) of SMEs. The report also compares business characteristics, owner characteristics, obstacles to growth, and demand for and access to financing among SME exporters and non-exporters.
1. SME Export Activity
In 2007, only a small portion (9 percent) of Canadian SMEs exported goods and services. As seen in Figure 2.1, the propensity to export increased with the size of the enterprise in terms of the number of employees. Among non-employer businesses (zero employees), 7 percent reported exporting. This figure increased to 9 percent for businesses with 1 to 4 employees, 11 percent for businesses with 5 to19 employees, 23 percent for businesses with 20 to 99 employees and 33 percent for businesses with 100 to 499 employees.
Figure 2.1: Average Export Propensity by Business Size, 2007
0
5
10
15
20
25
30
35
All SMEs100–49920–995–191–40
Number of Employees
Ex
po
rt P
rop
en
sity
(p
erc
en
t)
7
911
23
33
9
Source: SME Financing Data Initiative, Statistics Canada, Survey on Financing of Small and Medium Enterprises, 2007.

Special Edition: Key Small Business Statistics — June 2011
In 2007, export propensity also increased with the size of the enterprise in terms of revenues. As shown in Figure 2.2, of those SMEs with annual revenues of $0 to $99 thousand, 6 percent exported goods and services. This figure increased to 8 percent for SMEs with annual revenues of $100 to $499 thousand, 12 percent for SMEs with annual revenues of $500 thousand to $1.9 million, 20 percent for SMEs with annual revenues of $2 to $9.9 million and 36 percent for SMEs with annual revenues of $10 to $49 million.
Figure 2.2: Average Export Propensity by Revenue Size, 2007
0
5
10
15
20
25
30
35
40
$10–$49million
$2–$9. 9million
$500 thousand–$1.9 million
$100–$499thousand
$0–$99thousand
Revenue
Exp
ort
Pro
pe
nsi
ty (
pe
rce
nt)
68
12
20
36
Source: SME Financing Data Initiative, Statistics Canada, Survey on Financing of Small and Medium Enterprises, 2007.
While the likelihood of exporting increased with business size, export intensity (percentage of revenues from exports) did not. Previous export data identified firms by the size of their exports (in terms of value), not by the number of employees. Thus, the assumption was that small firms were not very active in the export market. Figure 2.3 illustrates that in 2007 a significant portion of exporters total revenues were derived from export sales (average of 47 percent). Moreover, export intensity was relatively similar across all size groups, indicating that SMEs can be actively engaged in exporting activities regardless of business size (in terms of the number of employees).
25

26Canadian Small Business Exporters
Figure 2.3: Average Export Intensity by Business Size, 2007
0
10
20
30
40
50
60
All ExporterSMEs
100-49920-995-191-40
Number of Employees
Exp
ort
Inte
nsi
ty (
pe
rce
nt)
n/a
49
46 46 47 47
Source: SME Financing Data Initiative, Statistics Canada, Survey on Financing of Small and Medium Enterprises, 2007.* Data for non-employer businesses (zero employees) are not available due to the low frequency of response.
In 2007, export intensity was also relatively similar across all revenue sizes. As Figure 2.4 illustrates, the smallest average export intensity was 39 percent for SMEs with annual revenues of $500 thousand to $1.9 million and the largest average export intensity was 53 percent for SMEs with annual revenues of $10 to $49 million. These findings further illustrate that business size does not necessarily determine export intensity.
SME exporters are found across all industries within the Canadian economy, yet it is commonly known that exporting is relatively more prevalent within the manufacturing industry. In 2007, manufacturing had the highest concentration of SME exporters at 28 percent (Figure 2.5). Other prominent export industries in 2007 included knowledge-based industries,11 in which 17 percent of SMEs exported.
11 Knowledge-based industries are a regrouping of Statistics Canada’s standard industry categories and include a number of technology sectors, such as telecommunications carriers, video production and computer services.

Special Edition: Key Small Business Statistics — June 2011
Figure 2.4: Average Export Intensity by Revenue Size, 2007
0
10
20
30
40
50
60
$10–$49million
$2–$9.9million
$500 thousand–$1.9 million
$100–$499thousand
$0–$99thousand
Exp
ort
Inte
nsi
ty (
pe
rce
nt)
4544
39
43
53
Revenue
Source: SME Financing Data Initiative, Statistics Canada, Survey on Financing of Small and Medium Enterprises, 2007.
Figure 2.5: Average Export Propensity by Industry, 2007
0
5
10
15
20
25
30
Other
Industries
Accomm
odations/
Food Services
Knowledge-
Based In
dustries
Professi
onal
Services
Wholesa
le/
Retail
Manufactu
ring
Agricultu
re/
Primary
Exp
ort
Pro
pen
sity
(per
cen
t)
7
28
1312
17
2
5
Source: SME Financing Data Initiative, Statistics Canada, Survey on Financing of Small and Medium Enterprises, 2007.
27

28Canadian Small Business Exporters
In 2007, the majority of Canadian SME export sales were to the United States. As Figure 2.6 illustrates, an average of 34.3 percent of total revenues (73.6 percent of total export revenue) came from exports to the United States. This is not surprising given Canada’s proximity to the United States and the existence of trade agreements (e.g., North American Free Trade Agreement) between Canada and the United States.
Figure 2.6: Average Export Intensity by Destination, 2007
(%)
1
1
34
47
53
4
4
0 5 10 15 20 25 30 35 40 45 50 55 60
Revenue fromDomestic Sales
Revenue fromExport Sales
Other Foreign
Other Asia
China
Europe
Other Americas
USA
2
Export Intensity (percent)
Source: SME Financing Data Initiative, Statistics Canada, Survey on Financing of Small and Medium Enterprises, 2007.
Figure 2.7 compares the distribution of SME exporters by region with the distribution of all SMEs in Canada by region. As seen in Figure 2.7, exporters are distributed across all of Canada, but are mostly concentrated in Ontario (39 percent). In the Atlantic region and in the Territories, the proportion of SME exporters is much higher than their proportion of all SMEs in Canada. Specifically, 12 percent of SME exporters were located in the Atlantic region, whereas only 6 percent of all SMEs in Canada are located in the Atlantic region. Likewise, 1.8 percent of SME exporters were located in the Territories, which has only 0.2 percent of all SMEs in Canada.

Special Edition: Key Small Business Statistics — June 2011
Figure 2.7: Regional Distribution of SME Exporters, 2007
Source: SME Financing Data Initiative, Statistics Canada, Survey on Financing of Small and Medium Enterprises, 2007. *Percentage of total SMEs from Statistics Canada, Business Register, October 2007.Note: Figures may not add up to 100 due to rounding.
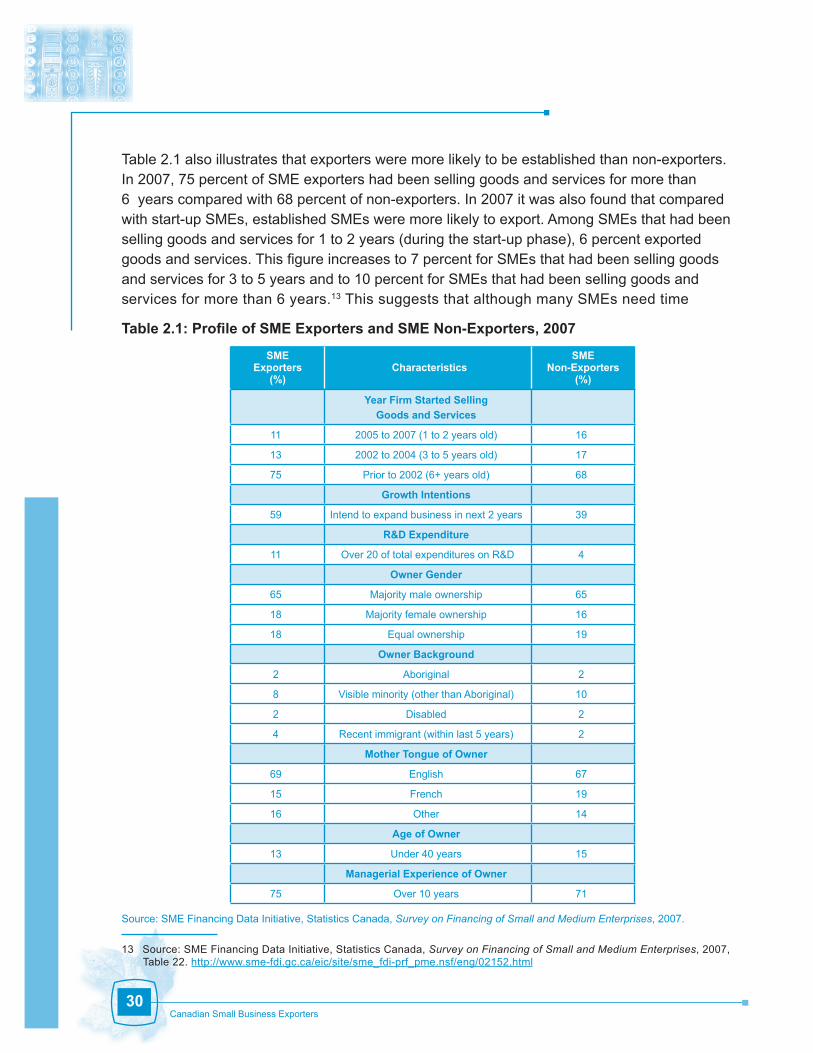
2. Profile of SME Exporters
Table 2.1 presents a comparison of firm and owner attributes between SME exporters and SME non-exporters. As seen in the table, exporters, on average, are more innovative, have greater growth intentions and have been in operation for a longer period of time.
Once an SME decides to export, innovative activity is crucial to its competitiveness and survival in the global market. It is no surprise, therefore, that exporters were more likely to invest in research and development (R&D) and, thereby, be considered innovative. In 2007, the percentage of SME exporters classified as innovative (spending more than 20 percent of total expenditures on R&D)12 was more than double that of SME non-exporters (11 percent versus 4 percent).
In 2007, exporters were also more likely to have intentions to grow their business than non-exporters. More than half (59 percent) of SME exporters had intentions to expand the size or scope of their business in the next 2 years compared with only 39 percent of non-exporters.
12 This definition of innovative is used by Industry Canada.
30 904
222
A
C
D
E
FB
A TerritoriesB British ColumbiaC PrairiesD OntarioE QuebecF Atlantic
SMEExporters
(%)
Percentage of Total SMEs*
1.8
0.2
13
1515
39
19
12
20
22
37
6
29
30Canadian Small Business Exporters
Table 2.1 also illustrates that exporters were more likely to be established than non-exporters. In 2007, 75 percent of SME exporters had been selling goods and services for more than 6 years compared with 68 percent of non-exporters. In 2007 it was also found that compared with start-up SMEs, established SMEs were more likely to export. Among SMEs that had been selling goods and services for 1 to 2 years (during the start-up phase), 6 percent exported goods and services. This figure increases to 7 percent for SMEs that had been selling goods and services for 3 to 5 years and to 10 percent for SMEs that had been selling goods and services for more than 6 years.13 This suggests that although many SMEs need time
Table 2.1: Profile of SME Exporters and SME Non-Exporters, 2007
SME Exporters
(%) Characteristics
SME Non-Exporters
(%)
Year Firm Started Selling
Goods and Services
11 2005 to 2007 (1 to 2 years old) 16
13 2002 to 2004 (3 to 5 years old) 17
75 Prior to 2002 (6+ years old) 68
Growth Intentions
59 Intend to expand business in next 2 years 39
R&D Expenditure
11 Over 20 of total expenditures on R&D 4
Owner Gender
65 Majority male ownership 65
18 Majority female ownership 16
18 Equal ownership 19
Owner Background
2 Aboriginal 2
8 Visible minority (other than Aboriginal) 10
2 Disabled 2
4 Recent immigrant (within last 5 years) 2
Mother Tongue of Owner
69 English 67
15 French 19
16 Other 14
Age of Owner
13 Under 40 years 15
Managerial Experience of Owner
75 Over 10 years 71
Source: SME Financing Data Initiative, Statistics Canada, Survey on Financing of Small and Medium Enterprises, 2007.
13 Source: SME Financing Data Initiative, Statistics Canada, Survey on Financing of Small and Medium Enterprises, 2007, Table 22. http://www.sme-fdi.gc.ca/eic/site/sme_fdi-prf_pme.nsf/eng/02152.html

Special Edition: Key Small Business Statistics — June 2011
to accumulate resources, knowledge and networks before they can penetrate the international market, some SMEs export from the time of their inception.14
3. Perceived Obstacles to Growth for SME Exporters
Given the increased costs, risks and uncertainty associated with export activity, it is common for exporters to encounter many obstacles. In 2007, the most frequently cited obstacle to business growth for SME exporters was the same as that for non-exporters — rising business costs — with 56 percent of owners in both groups identifying this as an obstacle (Table 2.2). However, many other obstacles were identified more frequently by exporters than non-exporters, including finding qualified labour, increasing competition, instability of consumer demand, insurance premiums and obtaining financing. Nevertheless, it is expected that exporters would have greater challenges with increased competition and increased variety in consumer preferences as they are consequences of opening up to international markets.
Table 2.2: Perceived Obstacles to Business Growth, 2007
ObstaclesSME
Exporters (%)
SME Non-Exporters
(%)
External to the Firm
Finding Qualified Labour 50 40
Instability of Consumer Demand 40 32
Government Regulations 28 28
Environmental Regulations/Compliance 9 12
Increasing Competition 47 39
Internal to the Firm
Obtaining Financing 21 17
Management Capacity 13 11
Rising Business Costs 56 56
Insurance Premiums 40 34
Source: SME Financing Data Initiative, Statistics Canada, Survey on Financing of Small and Medium Enterprises, 2007.
Previous studies have shown that among exporters, a lack of financing has been identified as a major challenge.15 In 2007, obtaining financing was cited as an obstacle more frequently among exporters than non-exporters; however, with only 21 percent of exporters expressing this as a challenge, it was not one of the top-ranked obstacles to business growth.
Figure 2.8 presents obstacles for Canadian enterprises when exporting. The data, taken from the Survey of Innovation and Business Strategy (SIBS), 2009, reveal that meeting cost requirements of customers was the most frequently reported obstacle to exporting for firms of all sizes. Access to financing did not rank as one of the most important obstacles to exporting
14 SMEs that operate internationally from or near the time of their inception are also known as “born global” establishments. For more information on the born global phenomenon, see Knight, G.A. and Cavusgil, S.T., 1996. “The Born Global Firm: A Challenge to Traditional Internationalization Theory.” Advances in International Marketing, 8, pp. 11–26, and Orser, B., Spence, M., Riding, A. and Carrington, C., 2008. Canadian SME Exporters. SME Financing Data Initiative. http://www.sme-fdi.gc.ca/eic/site/sme_fdi-prf_pme.nsf/eng/h_02115.html
15 Source: Organisation for Economic Co-operation and Development (OECD), Removing Barriers to SME Access to International Markets, Paris, 2006. 31

32Canadian Small Business Exporters
for Canadian SMEs. This result is consistent with those found in the Survey on Financing of Small and Medium Enterprises, 2007, i.e., both surveys suggest that access to financing may not be a major challenge for exporters compared with other major obstacles. Caution should be used when comparing the results from these two surveys, however, as the survey question, methodology, target population and sample are significantly different.16 Moreover, from these results we cannot conclude whether or not exporters have unique challenges when it comes to access to financing.
Figure 2.8: Obstacles to Exporting, 2007 to 2009*
1510
2214
17
11
2318
0 5 10 15 20 25 30 35 40 45 50 55 60 65 70
Large(250+ employees)
Medium(100–249 employees)
Small(20–99 employees)
Meeting cost requirementsof customers
Border security issues
Distance to customers
Uncertainty ofinternational standards
Foreign tariffs ortrade barriers
Meeting qualityrequirements of customers
Canadian export taxesor trade obstacles
Canadian legal oradministrative obstacles
Access to financing
Linguistic orcultural obstacles
Customer requirementsto usespecific technologies/systems
Concern of violation of patents and/or intellectual property rights
2821
19
13
19
1929
27
2536
2935
46
34
30
3745
40
4038
3743
58
41
57
4759
33
Percentage of Enterprises
Source: Statistics Canada, Survey of Innovation and Business Strategy, 2009.*Exporters rated each obstacle as high importance, medium importance, low importance or not an obstacle to exporting or attempting to export during the three years 2007 to 2009. To determine which obstacles were most important, responses of medium and high importance were combined.
16 See “Data Sources and Methodology” for information on the methodology, target population and sample of the two questions. The Survey on Financing of Small and Medium Enterprises question regarding obstacles was “Which of the following obstacles are serious problems for the growth of your business?” The Survey of Innovation and Business Strategy question regarding obstacles was “Please rate the importance of the following obstacles to your enterprise exporting or attempting to export goods and services to an enterprise outside of Canada during the three years 2007 to 2009.”

Special Edition: Key Small Business Statistics — June 2011
4. Financing Activity
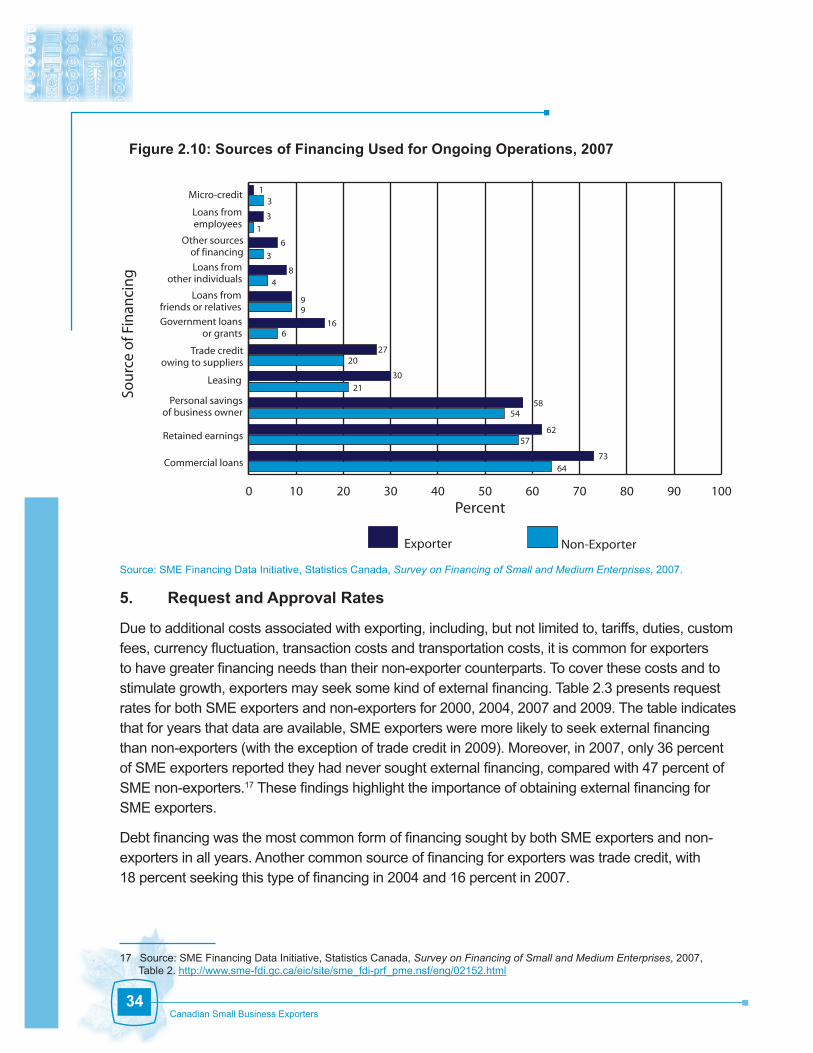
Given the importance of financing to the growth and survival of a business, it is critical to investigate the actual financing activity of SME exporters and non-exporters to determine any unique challenges. Figures 2.9 and 2.10 present important sources of financing for SMEs during the start-up phase of the business and for ongoing operations respectively. For both exporters and non-exporters, the most common type of financing used during business start-up was personal savings of the owner, particularly among exporters (85 percent versus 72 percent) (Figure 2.9). The most common type of financing used by both exporters and non-exporters for ongoing operations was commercial or personal loans (Figure 2.10). It is interesting to note that in 2007, SME exporters were more likely to use each source of financing, except micro-credit, than non-exporters during the start-up phase and for ongoing operations.
Figure 2.9: Sources of Financing Used During Start-Up, 2007
Percent
2
4
1
85
2
4
0 10 20 30 40 50 60 70 80 90 100
Non-ExporterExporter
Personal savingsof business owner
Commercial loans
Leasing
Trade credit owingto suppliers
Loans from friendsor relatives
Government loansor grants
Loans fromother individuals
Other sourcesof financing
Micro-credit
2
7
17
4
9
11
11
50
72
12
21
55
Sou
rce
of F
inan
cin
g
Source: SME Financing Data Initiative, Statistics Canada, Survey on Financing of Small and Medium Enterprises, 2007.
33
34Canadian Small Business Exporters
Figure 2.10: Sources of Financing Used for Ongoing Operations, 2007
Source: SME Financing Data Initiative, Statistics Canada, Survey on Financing of Small and Medium Enterprises, 2007.
5. Request and Approval Rates
Due to additional costs associated with exporting, including, but not limited to, tariffs, duties, custom fees, currency fluctuation, transaction costs and transportation costs, it is common for exporters to have greater financing needs than their non-exporter counterparts. To cover these costs and to stimulate growth, exporters may seek some kind of external financing. Table 2.3 presents request rates for both SME exporters and non-exporters for 2000, 2004, 2007 and 2009. The table indicates that for years that data are available, SME exporters were more likely to seek external financing than non-exporters (with the exception of trade credit in 2009). Moreover, in 2007, only 36 percent of SME exporters reported they had never sought external financing, compared with 47 percent of SME non-exporters.17 These findings highlight the importance of obtaining external financing for SME exporters.
Debt financing was the most common form of financing sought by both SME exporters and non-exporters in all years. Another common source of financing for exporters was trade credit, with 18 percent seeking this type of financing in 2004 and 16 percent in 2007.
17 Source: SME Financing Data Initiative, Statistics Canada, Survey on Financing of Small and Medium Enterprises, 2007, Table 2. http://www.sme-fdi.gc.ca/eic/site/sme_fdi-prf_pme.nsf/eng/02152.html
1
6
31
3
0 10 20 30 40 50 60 70 80 90 100
Non-ExporterExporter
Commercial loans
Retained earnings
Personal savingsof business owner
Leasing
Trade creditowing to suppliers
Government loansor grants
Loans fromfriends or relatives
Loans fromother individuals
Other sourcesof financing
Loans fromemployees
Micro-credit
8
99
4
3
2720
73
30
6
21
16
5458
6257
64
Sou
rce
of F
inan
cin
g
Percent

Special Edition: Key Small Business Statistics — June 2011
Table 2.4 presents, where available, approval rates for both SME exporters and non-exporters for 2000, 2004, 2007 and 2009. In 2004, SME exporters were less likely to be approved for external financing than non-exporters (86 percent versus 91 percent), but in 2007 and 2009 the opposite was true. A similar pattern is observed for debt financing, with SME exporters having lower approval rates in 2000 and 2004 and higher approval rates in 2007 and 2009.
Table 2.3: SME Request Rates (Percent) by Financing Type
Type of Financing
2000 2004 2007 2009*
Exporter Non- Exporter Exporter Non-
Exporter Exporter Non-Exporter Exporter Non-
Exporter
Any External Financing — — 36 23 27 17 20 15
Debt Financing 37 22 28 18 21 12 18 14
Lease Financing — — 5 3 7 5 1.2 1.0
Equity Financing — — 3 1 2 1 1.9 1.2
Government Loan or Grant — — 6 3 6 3 — —
Trade Credit — — 18 11 16 8 0.8 1.2
Source: SME Financing Data Initiative, Statistics Canada, Survey on Financing of Small and Medium Enterprises, 2000, 2004 and 2007.*Based on Industry Canada, Credit Condition Survey, 2009.Note: These rates are Industry Canada calculations based on financing requests made within the last 12 months.
Exporters and non-exporters had similar approval rates for lease financing and trade credit in 2004 and 2007. In 2004, exporters had higher approval rates for equity financing than non-exporters, but the opposite was true in 2007. In both 2004 and 2007, approval rates for government loan or grant financing were lower for SME exporters than for non-exporters.
Table 2.4: SME Approval Rates (Percent) by Financing Type
Type of Financing
2000 2004 2007 2009*
Exporter Non-Exporter Exporter Non-
Exporter Exporter Non-Exporter Exporter Non-
Exporter
Any External Financing — — 86 91 97 96 85 79
Debt Financing 79 82 80 88 95 94 84 78
Lease Financing — — 98 96 92 93 — 72
Equity Financing — — 60 42 68 71 — 86
Government Loan or Grant — — 67 71 75 81 — —
Trade Credit — — 90 90 99 99 — 82
Source: SME Financing Data Initiative, Statistics Canada, Survey on Financing of Small and Medium Enterprises, 2000, 2004 and 2007.*Based on Industry Canada, Credit Condition Survey, 2009.Note: Approval rates for debt financing are Industry Canada calculations that exclude loans that were withdrawn or are still under review.
35

36Canadian Small Business Exporters
It should be noted that these approval rates do not distinguish between full or partial approvals. Moreover, these approval rates do not consider the dollar amount of financing that was approved.
Table 2.5 presents approved debt financing amounts for 2004 and 2007. In both years, the average amount of debt approved was higher for SME exporters than non-exporters. This was true for both long-term and short-term debt financing. To measure access to financing while accounting for scale effects and partial approvals, the ratio of total debt financing approved to total debt financing requested is considered. According to this ratio, SME exporters had slightly more difficulty accessing financing than non-exporters in 2004. In 2007, exporters had slightly less difficulty accessing financing than non-exporters.
Table 2.5: SME Approved Debt Financing Amounts,* 2004 and 2007
2004 2007
ExportersNon-
Exporters ExportersNon-
Exporters
Average Long-Term Amount Approved $224 000 $193 000 $474 000 $246 000
Average Short-Term Amount Approved $190 000 $69 000 $342 000 $158 000
Average Total Amount Approved $210 000** $138 000** $461 000 $232 000
Total Debt Financing Approved/Requested 95 97 93 90
Source: SME Financing Data Initiative, Statistics Canada, Survey on Financing of Small and Medium Enterprises, 2004 and 2007.*Figures are Industry Canada calculations based on responses that contained values for both requested amounts and approved amounts.**Average total amount approved in 2004 excludes “other financial instruments” that were not specified as long-term or short-term debt.
Table 2.6 breaks down the ratio of total amount of financing approved to total amount of financing requested by size of business in terms of number of employees. In both 2004 and 2007, exporters with 1 to 4 employees were less likely to obtain their requested financing than non-exporters. On the other hand, exporters with 20 to 99 employees were more likely to obtain their requested financing than non-exporters. Table 2.6 also shows that the ratios of amount approved to amount requested were highest for medium-sized enterprises (100 to 499 employees). In 2004 and 2007, both exporters and non-exporters in this size group received nearly the full amount they requested.

Special Edition: Key Small Business Statistics — June 2011
Table 2.6: Ratio (Percent) of Total Debt Financing Approved to Total Debt Financing Requested, by Number of Employees
Number of Employees
2004 2007
SME Exporters
SME Non-Exporters
SME Exporters
SME Non-Exporters
0 65 89 98 95
1 to 4 74 88 56 81
5 to 19 91 95 94 95
20 to 99 88 78 97 84
100 to 499 98 99 99 98
Source: SME Financing Data Initiative, Statistics Canada, Survey on Financing of Small and Medium Enterprises, 2004 and 2007.
Table 2.7 presents the ratio of total debt financing approved to total debt financing requested by size of business in terms of revenue. In both 2004 and 2007, this ratio was highest among SMEs with annual revenues of $10 to $49 million for both exporters and non-exporters. These ratios indicate that SMEs with annual revenues higher than $10 million have less difficulty obtaining requested financing than those with revenues less than $10 million.
Table 2.7: Ratio (Percent) of Total Debt Financing Approved to Total Debt Financing Requested, by Revenue Size
Revenue2004 2007
SME Exporters
SME Non-Exporters
SME Exporters
SME Non-Exporters
$0–$99 thousand 70 91 99 95
$100–$499 thousand 62 82 93 78
$500 thousand–$1 million 79 93 62 79
$2–$9.9 million 81 83 97 96
$10–$49 million 92 100 100 99
Source: SME Financing Data Initiative, Statistics Canada, Survey on Financing of Small and Medium Enterprises, 2004 and 2007.
6. Distribution of Approved Financing
The distribution of approved financing in 2007 was similar for SME exporters and non-exporters. As shown in Table 2.8, debt financing was the most common type of external financing obtained in 2007, with slightly more exporters being approved than non-exporters. Table 2.8 also shows that exporters were less likely to obtain lease financing than non-exporters (16 percent versus 20 percent).
37

38Canadian Small Business Exporters
Table 2.8: Distribution (Percent) of Financing Instruments Used (Based on Approved Amounts), 2007
SME Exporters SME Non-Exporters
Debt 73 69
Lease 16 20
Equity 1 1
Government Loan or Grant 8 7
Trade Credit 2 3
Total 100 100
Source: SME Financing Data Initiative, Statistics Canada, Survey on Financing of Small and Medium Enterprises, 2007.
7. Intended Use of Debt Financing
In 2007, SME exporters and non-exporters had varying intended uses for their debt financing. As shown in Figure 2.11, the most common intended use for debt financing for both exporters and non-exporters was to provide working capital, particularly for exporters (55 percent versus 44 percent). SME exporters were more than twice as likely to use their debt financing for research and development (11 percent versus 5 percent). Exporters were also more likely to use debt financing to grow their business than non-exporters (44 percent versus 35 percent) and slightly more likely to use debt financing to purchase computer equipment. These figures reflect the growth-oriented and innovative nature of exporters that was highlighted previously.
Figure 2.11: Intended Use of Debt Financing Requested, 2007
Source: SME Financing Data Initiative, Statistics Canada, Survey on Financing of Small and Medium Enterprises, 2007.
1411
21
33 32
55
14
19
44
55
35
10
25
911
4
8
44
Perc
ent
0
10
20
30
40
50
60
Non-Exporter Exporter
Grow
the busin
ess
Purchase
a business
Intangib
les
Debt
consolid
ation
Research and
development
Work
ing capital
Other m
achinery
and equipm
ent
Compute
r
equipm
ent
Vehicles /
rollin
g stock
Land and
buildings
8
Use of Financing

Special Edition: Key Small Business Statistics — June 2011
Conclusion
In 2007, the likelihood of exporting increased with business size, both in terms of employees and revenues; however, among SME exporters, the percentage of total sales derived from exports was similar across all size groups. These findings suggest that firm size is correlated with export propensity, but does not determine export intensity.
This report also highlighted that SME exporters are marked by different characteristics than their non-exporter counterparts. On average, exporters were more innovative (investing more in R&D), growth oriented and established than non-exporters. Exporter SMEs were more likely to make a request for financing and, on average, requested higher amounts of debt financing than their non-exporter counterparts. Additionally, exporters were more likely to cite obtaining external financing as an obstacle to business growth. When it came to determining whether exporters had unique financing challenges, results were inconclusive. Exporters experienced greater difficulty obtaining approval for external financing in 2004 (measured by approval rates and the ratio of amount of debt financing approved to amount of debt financing requested), but had a slightly easier time in 2007 compared with non-exporters.
Part 3: SME Involvement in Global Value Chains
The first two sections of this report provide a number of basic statistics relative to Canadian exporters, using the value of exports and export propensity as the main measures of trade. However, recent developments in the global economy have changed the reality of many businesses in Canada in that their activities go beyond traditional exports. For example, more and more firms do not export their products and services directly, but participate in global value chains (GVCs).
GVCs include the full range of activities required to bring a product from conception to its end use and beyond (e.g., design, production, distribution). Value chain activities can be contained within a single firm or divided among different firms, and can be contained within a single geographical location or spread over wider areas. For example, firms are increasingly outsourcing business activities to third parties, locating parts of their supply chains outside their home country (offshoring), and partnering with other firms through strategic alliances and joint ventures.
While this is a well-known phenomenon, quantifying it has been a challenge without suitable sources of data. Using new data from the Survey of Innovation and Business Strategy (SIBS) 2009, this section presents a number of figures illustrating the involvement of small and medium-sized manufacturing enterprises with more than 20 employees in GVCs. In particular, this section highlights the types of international activities these enterprises engage in, their most relocated or outsourced business activities and their participation in indirect exports.
39

40Canadian Small Business Exporters
1. International Business Activities
As Figure 3.1 illustrates, approximately 50 percent of manufacturing enterprises engaged in international business activities between 2007 and 2009. Specifically, 54 percent of manufacturing enterprises exported or attempted to export goods and services and 48 percent reported having business activities outside of Canada. Additionally, 10 percent of manufacturing enterprises outsourced (contracted out) their business activities to another country and 5 percent relocated their business activities abroad (still performed within the company).
Figure 3.1: Canadian Manufacturing Enterprise Involvement in International Business Activities, 2007 to 2009
Source: Statistics Canada, Survey of Innovation and Business Strategy, 2009.
Figure 3.1 also shows that some business activities were returned to Canada. Between 2007 and 2009, 5 percent of manufacturing enterprises reported relocating their business activities from another country to Canada.
In general, large manufacturing enterprises were more likely to engage in international business activities than small or medium-sized manufacturing enterprises, with the exception of exporting, in which 71.3 percent of medium-sized enterprises exported goods compared with 69.8 percent of large enterprises.
SMEs were more likely to outsource (contract out) business activities (16 percent for medium-sized and 8 percent for small enterprises) than to relocate business activities to another country
0 10 20 30 40 50 60 70 80
Small Enterprises (20–99 employees)Medium-Sized Enterprises (100–249 employees)
Large Enterprises (250+ employees)All Enterprises
Exported orattempted to export
Have any businessactivities outside
of Canada
Relocate business activities from
Canada to another country
Outsource (contract out)
business activitiesto another country
Relocate businessactivities
from anothercountry to Canada
Percentage of Enterprises

Special Edition: Key Small Business Statistics — June 2011
(9 percent for medium-sized and 3 percent for small enterprises). These findings may suggest that contracting out is a less costly alternative to relocating business activities for SMEs.
2. Relocation and Outsourcing of Business Activities
Figure 3.2 illustrates the most relocated or outsourced business activities in the Canadian manufacturing sector by firm size. Between 2007 and 2009, the business activity most displaced (relocated or outsourced) out of Canada was the production of goods. Other displaced business activities included the provision of services; distribution and logistics; and marketing, sales and after sales services.
Figure 3.2: Most Relocated or Outsourced Business Activities in the Manufacturing Sector, by Firm Size
0 20 40 60 80 100
Marketing, sales and after sales services
Distribution and logistics
Provision of services
Production of goods
0 20 40 60 80 100
Marketing, sales and after sales services
Distribution and logistics
Provision of services
Production of goods
0 20 40 60 80 100
Small Enterprises Medium-Sized Enterprises Large EnterprisesAll Enterprises
Marketing, sales and after sales services
Distribution and logistics
Provision of services
Production of goods
(A) Relocated Outside of Canada
(B) Outsourced Outside of Canada
(C) Relocated from another country to Canada
Percentage of Enterprises
Source: Statistics Canada, Survey of Innovation and Business Strategy, 2009.
41

42Canadian Small Business Exporters
Between 2007 and 2009, medium-sized manufacturing enterprises displaced more business activities in the production of goods than small and large manufacturing enterprises. Over the same period, small manufacturing enterprises were more likely to displace their marketing, sales and after sales services than medium-sized and large enterprises.
Small manufacturing enterprises were more likely than medium-sized and large manufacturing enterprises to relocate their business activities in marketing, sales and after sales services. At the same time, small manufacturing businesses in Canada were more likely than medium-sized and large manufacturing businesses to outsource business activities, such as marketing, sales and after sales services; distribution and logistics; and provision of services, outside of Canada.
Research and development (R&D) is not shown in Figure 3.2 among the top business activities that are relocated as it is ranked eighth out of 15 business activities. However, it is worth mentioning that small manufacturing businesses relocate their R&D activities almost as much as large manufacturing businesses (13 and 14 percent respectively).
3. Indirect Exports
SIBS data indicate that not all manufacturing enterprises exported goods in the traditional way (i.e., selling directly to foreign customers); some manufacturing enterprises engaged in indirect exporting. As illustrated in Figure 3.3, 21 percent of manufacturing enterprises sold their goods to another enterprise in Canada that, in turn, exported the goods. Additionally, 26 percent of manufacturing enterprises sold their goods to another enterprise in Canada that used them as an intermediate input in final goods that were then exported.
Small and medium-sized manufacturing enterprises were more likely than large manufacturing enterprises to fill orders from domestic buyers and then export the goods “as is.” Specifically, 21 percent of small enterprises and 24 percent of medium-sized enterprises were indirect exporters of final goods compared with 17 percent of large enterprises. Conversely, small and

Special Edition: Key Small Business Statistics — June 2011
medium-sized manufacturing enterprises were less likely than large manufacturing enterprises to produce inputs for goods that were then exported by their customers. Specifically, 26 percent of small enterprises and 27 percent of medium-sized enterprises were indirect exporters of intermediate goods compared with 30 percent of large enterprises.
Figure 3.3 also demonstrates that 7 percent of manufacturing enterprises in Canada act as intermediaries by buying and selling goods outside of Canada without them ever entering Canada. Large enterprises were more likely to be intermediaries compared with small and medium-sized enterprises.
In conclusion, these findings reveal that looking only at traditional exports does not capture the full international integration of an enterprise. Enterprises of all sizes are participating in global value chains through outsourcing, relocating business activities and indirect exporting.
Figure 3.3: Indirect Exports in the Manufacturing Industry, 2009
0 5 10 15 20 25 30 35
Small Enterprises (20-99)Medium Enterprises (100-249)
Large Enterprises (250+)All Enterprises
Sell goods to another enterprise in Canadathat in turn exported them as is
Sell goods to another enterprise in Canadathat used them as intermediate input in
�nal goods that were then exported
Buy and subsequently sell any goods outsideof Canada without them entering Canada
Percentage of Enterprises
Source: Statistics Canada, Survey of Innovation and Business Strategy, 2009.
43

Canadian Small Business Exporters
PublicationsAvailable through the Small Business Research and Statistics website (www.ic.gc.ca/sbresearch)
Key Small Business Statistics (KSBS) (www.ic.gc.ca/sbstatistics)The KSBS provides key statistics on small business topics, responding to some of the most commonly asked questions. This publication is produced annually and is released in July. A special edition of the KSBS, which explores a particular issue in detail, is released in January.
Special Edition: Growth Map of Canadian Firms — January 2010
Small Business Quarterly (www.ic.gc.ca/SMEquarterly)The SBQ provides a quick and easy-to-read snapshot of the recent performance of Canada’s small business sector. This publication is produced in February, May, August and November. It is available in printed and electronic versions.
Research Reports (www.ic.gc.ca/sbresearch/sbreports)These reports are prepared or commissioned by the Small Business and Tourism Branch.
Profile of Mid-Career Entrepreneurs: Career trade-offs and income appropriation of high human capital individuals
The Teaching and Practice of Entrepreneurship within Canadian Higher Education Institutions — December 2010 The State of Entrepreneurship in Canada — February 2010 Profile of Growth Firms: A Summary of Industry Canada Research — March 2008
Subscription (http://www.ic.gc.ca/SMEstatistics/subscription)You can subscribe online to receive email notification of online releases of Small Business Research and Policy website publications and reports managed by the Small Business and Tourism Branch (SBTB).
Available through the SME Financing Data Initiative (SME FDI) website (www.sme-fdi.gc.ca)Key Small Business Financing Statistics (KSBFS) (www.sme-fdi.gc.ca/sbfstatistics)The KSBFS provides key statistics on the state of SME financing in Canada. The information provided responds to some of the most commonly asked questions. This publication is available in printed and electronic versions. The most recent KSBFS was published in December 2009.
Venture Capital (VC) Monitor (www.sme-fdi.gc.ca/vcmonitor)This is a quarterly publication on the venture capital (VC) industry in Canada. The goal of this series is to provide current information about this key enabling industry. To this end, the series will track trends in investment activity, report on topical VC-related research and look at key technology clusters where VC investment is taking place. This publication is only available in an electronic version.
Small Business Financing Profiles (www.sme-fdi.gc.ca/sbfprofiles)SmallBusinessFinancingProfiles are short reference documents on a specific segment of the small business marketplace. These papers provide a detailed profile of the financial/ownership structure and types of financing used by the segment targeted. They identify access to financing issues and pose future research questions that need to be addressed. As most of the printed copies of these publications are out of stock, they are mainly available electronically.

Special Edition: Key Small Business Statistics — June 2011
Regions
Rural-Based Entrepreneurs — October 2008 SMEs in Ontario — September 2007 SMEs in the Atlantic Provinces — September 2007 SMEs in the Prairie Provinces — September 2007 SMEs in Quebec — August 2007 SMEs in British Columbia — June 2007
Business Characteristics
Financing Innovative Small and Medium-Sized Enterprises in Canada — March 2009 Borrowers under the Canada Small Business Financing Program — February 2009 Informally Financed SMEs — September 2006 Exporter SMEs — September 2006 High-Growth SMEs — May 2006
Business Owner Characteristics
Women Entrepreneurs — October 2010 Young Entrepreneurs — January 2006 Visible Minority Entrepreneurs — March 2005 Women Entrepreneurs — November 2004
Research Reports (www.sme-fdi.gc.ca/SMEfinreports)In addition to research presented in SmallBusinessFinancingProfiles and Key Small Business Financing Statistics, the SME FDI also commissions research into niche areas of SME financing.
An Interpretation of Discouraged Borrowers Based on Relationship Lending — August 2010 The Economic Impact of the Canada Small Business Financing Program — June 2010 Determinants of Trade Credit Use by Small and Medium-Sized Enterprises in Canada — December 2009 Financing Innovative Small and Medium-Sized Enterprises in Canada — October 2009 Canadian SME Exporters — January 2008 Financing Canadian SME Exporters — June 2007 Financing Global Gazelles — March 2006
Subscription (www.sme-fdi.gc.ca/subscription)
Available through the Paperwork Burden Reduction Initiative website (www.reducingpaperburden.gc.ca)Analysis of Regulatory Compliance Costs (www.reducingpaperburden.gc.ca/Survey)These publications showcase findings from the joint Industry Canada – Statistics Canada Survey of Regulatory Compliance Costs. Publications are available in an electronic version.