canadian land use - agecon searchageconsearch.umn.edu/bitstream/146891/2/faer155.pdf · of...
TRANSCRIPT

P-PS-300 628 FAER i~55i---shy AUG yg-CANADIAN LAND USE
bull I C E BRAY
ECONOMICS STATISTICS AND COOPERATIVES SERVICE WASHINGTON DC
----
IOt~l~ IIIII~ IIIII~ == Bill 1IIIIg I-- ani -- n ~1~
II
Otg 2011 ~t _ shy-shy_shy
25 4 6 111111 111111 1
- -
i
- -~ _-- - - C i
~ 1lliIi~~
]l~1~rgt~~Pi-Tmiddottyen2il~~-i~ -
r ~
us DEPARTMENT OF COMMERCE National Technical Information Service PB-300 628
Canadian Land Use (us) Economics Statistics and Cooperatives Service Washington DC
Aug 79
shy
J
United States Department of Agriculture
PB 30062~ )--1-
CANADIAN
LAND USE
CE Bray
IIEIIIODICpoundD Br
NAnONAL TECHNICAL INFORMAnON SERVice u L DEPARTMENT OF COMMERCE
SPRINGFIELD VA ZZ161
Economics Foreign Statistics and Agricultural Cooperatives Economic Service Report No 155
gt ~--------~--T~T-r~~MI-------~~--_________
I
I
~ADlAN LAND USE ByeE By Eoonom Sttco n CooP tives Service V5 Department of Agriculture Foreign Agricultural Economic Report No 155
ABSTRACT
This study examines the potential of Canadas prime agricultural land the loss of agricultural land through urbanization determinants of farmland prices and iand use and tenure programs in five Provinces Approximately 38 million additional hectares of land could be used for farms in Canada and wheat production under current cropping patterns could increase to 32 million tons a 92-percent increase over the 1969170 to 197879 10-year average of 167 million tons
Key words Canada land use land tenure land prices production potential urbanization
Washington DC 20250 August 1979
u bullbullan2Jlt on Name essInternational Economic DivisionEconomics Statistics and Cooperatives ServiceUS Department of Agriculture~ash ington D C 20250
12 SpoQsoring rganizaClori Name and Address
1S SLippl~ment~Y Notes
16 AOltr3CtSI
IThis study examines the potential of Canadas prime agricultural land the loss of agricultural land through urbanization determinants of farmland prices and land useand tenure programs in five Provinces Approximately 33 mi 11 ion additional hectaresof land could be used for farms in Canada and wheat production under current croppingpatterns could increase to 32 million tons a 92 percent increase over the 196970to 197879 10-year average of 167 million tons
s lnd plOrsAll QC~t i OO Preservi ngCompetition PricesFarms Production capacityIncome Rati ngsLand development Urban i zat ionLand use WheatLossesOi IseedsPatternsPopulation
17b IdentifiersOpen-Ended TermsAgricultural land PerpetuateCanada Urban fringeCanadian Land InventoryCroppingFore i gne rsHectaresNonagricultural uses
17c (ll-ATI Field Group 02-B 05-C18bullvaaiatIlIlIY tlIement e rom INATIONAL TECHNICAL INFORMATION SERVICE ~~~~I5285 Port Roya I RoadSpringfield Virginia 22161 1
-----~
SUMMARY
Although most of Canadas agricultural land-rated as Class 1-4 by the Canadian Land Inventory (CLI)-is already in farms approximately 38 million additional hectares could be used for farms if all six CLI classes are considered This study examines Canadas potential for crop production the loss of production due to urbanization the determinants of farmland prices and Provincial land use and tenure programs dealing with these issues
This study estimates that Canada has the land capability of increasing wheat production under current cropping patterns to 32 million tons-a 92-percent increase over the 196970 to 197879 IO-year average of 167 million tons
Although large agricultural areas within the urban fringe are being affected by urbanization actual long-term losses in production appear to be significant only in Ontario
High land prices caused by the growth of urban centers and land purchases by foreigners may make it uneconomical to use even prime land for agriculshyture in some areas Since 1972 however increases in farmland prices in Canada appear to be the result of rapid increases in fann income rather than the effects of population pressures on farmland values
Five Provinces-Manitoba Saskatchewan Alberta British Columbia and Ontario--have developed land use and tenure programs These programs are designed to preserve agricultural land for future agricultural production maintain the family farm and perpetuate the owner-operator rather than tenam-operator form oftenancy Land tenure patterns in many Provinces are changing as the number of farms operated by full owners declines Provincial legislation can check the reallocation of agricultural land to nonagricultural uses
CONTENTS
PageINTRODUCTIO~J I
AGRICULTURAL LAND PRODUCTION POTENTIAL I Canadian Land Inventory - I Land Capability 2
LAND USE PROGRAMS 9 Federal versus Provincial Jurisdiction 9 Urbanization and Land Use 10
LAND TENURE PROGRAMS 14 Ownership Control 14 Transfer of Ownership 17 Effects of the Land Tenure Programs 19
LAND USE AND TENURE IN PERSPECTIVE 20 Loss of Agricultural Land Through Urbanization 20 Land Tenure 21 Farmland Prices 26
CONCLUSIONS 30
REFERENCES 31
j
ii
shy
f
-~
I
~ )I
~ I
t ~
t ~
CANADIAN LAND USE
CE Bray
) INTRODUCTION
Factors affecting agricultural production in Canada have important implications for the United States because of their potential impact on Canadas competitive exports of grain oil seeds and other selected commodshyities This study examines Canadas agricultural production potential the loss of agricultural land due to urbanization and Provincial land use and tenure programs developed by five Provinces (Manitoba Saskatchewan Alberta Ontario and British Columbia) to deal with these issues
These Provinces were selected for several reasons The Prairie Provinces are Canadas major producers of grain and oilseeds in competition with the United States Ontario which contains one-third of the entire Canadian population produces a wide range of agricultural products which compete with US imports British Columbias comprehensive land use program servCii as an example of land use programs in Canada The Provincial land use proshygrams discussed in this study should be viewed as case studies illustrating the ways in which legislation has dealt with land use and tenure issues in Canada
This analysis will be useful to US policymakers and researchers in understanding the implications of Canadian land use on Canadas agriculshytural production potential and in indicating Canadas competitve position in agricultural trade
i-
AGRICULTURAL LAND PRODUCTION POTENTIAL
gt Two sources of information indicate the productivity of Canadas land - the Canadian Land Inventory (CLI) and the Canadian census The CLI undertaken as a FederalProvincial cooperative program in 1963 to docushyment the land potential of settled areas of Canada provides an extensiv~ picture of the countrys national and regional land base
Canadi~n Land Inventory
The CLI rates soils according to their capability for agriculture wildlife recreation and forestry It covers 1 miUion square miles and encompasses all regions of Canada with agricultural capability Areas outside CLI boundaries are not gtgtnerally considered capable of sustaining agriculture due to climate or topography (10)1
iJaliciled numbers in parlllIh(scs nfr 10 ref(rcnc(s ciled al Ih( (nd of Ihis npor
1
Soils are classified into seven categories according to their capacity for agricultural use (4)
I No significant limitations for crop use 2 Moderate readily correctable limitations which restrict the range of
crops grown and require the use of moderate conservation practices 3 Moderately severe limitations restricting the range of crops planted
and requiring speci conservation practices but still considered moderately high in productivity
4 Severe limitations restricting the range of crops or requiring special conservation practices with low to medium productivity
5 Very severe limitations used for permanent pasture only throughintensive management
6 Capable of producing perennial forage crops but marginal for agricultural use management practices not feasible
7 Not capable of sustaining agriculture or permanent pasture Classes 1-3 are considered capable of producing commonly cultivated
crops Class 4 can be used for crops but has marginal capability Under present economic conditions land with class 4 capability is considered the breakmiddoteven point for commercial agriculture Class 5 is capable of growing improved pasture and hay Class 6 can sustain native pasture (4)
Preliminary CLI data provide information on 172 million hectares or 19 percent of total Canadian land area When data are compiled for British Columbia and Newfoundland the inven~ory is expected to cover 29 percent of tatal Canadian land area According to available CLI data 81 percent of Canadian land cannot sustain any type of agriculture The remaining 11 percent falls within classes 1middot6 and has some agricultural potential Less than 1 percent of CJnada s potential agricultural land is classified as class I and 1 percent is classified as class 6 (table 1)
Ontario accounts for only 12 percent of the countrys total potential agricultural land area (classes 1-6) but comprises 52 percent of its total class I land area or most ofCanadasect prime agricultural land The Prairie Provinces (Manitoba Saskatchewan and Alberta) in comparison make up 73 percent of Canadas potential agricultural land but only 47 percent of Canadas prime (class I) agricultural land The majority of land in the three Prairie Provinces is dth(f class (22 million hectares) or class 3 (18 million hectares) (10)
Land Capability
The CLI also provides an indication of Canadian agricultural land resources listing land by potential for alternative uses It does not however indicate how land of any given potential is presently used This can be estimat~d indirectly by comparing CLI land classes with the Canadian census of agriculture for land in farms Lmsus measurements of present land use are broken down b terms of improved and unimprov~d land rather than eLi class capability It is therefore necessary to assume ti1at land presently used for farms as indicated by the census falls within the 172 million hectares covered by the CLI and that land presently used for crops falls within classes 1-4
2
- - - -
~~~-_~4+- __A~~~~~~~~~
t1
I11
Tabl~ 1-Pot~ntial agricultural land and land in falms 1976 ~middotmiddotmiddot
POIentili~ aJPicultural bnd Land in fanDI 1976 ArQ Prime
IITotalbnd Other landProvince covered b asricultunl ArablearQ Marwinall in tbe CLI Total
tbe CU land land anble land arQI arQ in Improyed Unimprovedcbl c1-sI-t cl-s 5-6 ftfarmland iarmbnd farmland i
1000 hectares t INewfoundland~ 37048
Prince Edward Island - - - - - 30 10 20-vshy 563 563 0 452 76 34 21~ 194 84Nova Scotia 5296 5296~ - 0 1573 I96 3627 400 148 253New Brunswick 7145 7145 0 3346 1712 2087 402 172Quebec 135677 50221 20
231 4795 1670 23756 3654 2245 1409Ontario 89118 27530 2157 9909 I3056 14565 5967 4333Manitoba 163454849 19277 163- 7524 4323 7430 7611 5182 2429 ~
Saskatchewan 57026 34455 I1000 20075 11442 2938 26433Alberta 64438 41894 787 18896 7537 ti 20019 15034 12840 2004G 11791British Columbia 93052 8249 fr- - - - - 2352 736 1615 fJYukon 53183 - - - g
Northwest Territories 324634 - - - shy shy
~I - - shy ffCanadll 922030 172381 4125 H67695 37410 67276 67167 43707 23401 Fl- == not available
I ti
Yukon and Northwest Territories are not covered by the CLI
middotIncludes c1aS$ 7 land organic soils and unclassified land in the CLI area which comprises urban areas Provincial parks national parks and forest reserves
Sources Envilment Canada Lands Directorate Land Capability for Agriculture Canada Land In~gtentoy Prtliminary Rtort April 1976 and Statistics Canacia Cmsus of AgncultuTt 1976 t
H t~P
~t fiJ
~~o~~-----~ccmiddote==~~~
i
The 1976 (ensus of agriculture indicates Ihat 67 million heclans were used for fanns Twomiddotthirds of this amount wen improvld land consisling of 39 million hlctans of crops and summer fallow and 5 million Il(ctares of improved paSIUil Unimproved land consists of 4 million h~ctares of woodshyland and 19 million hectares of brush grazing land marsh or slough (tablc I)
A comparison of census farm area with the quantily of potential agriculshytural land lOvlred by thl eLI indicates that lhe amount of improved and unimpmvld land in farms is about equal to lhe amount of land in the firsl four eLi c1as~cs Most of Canadas be51 agricultural land is already in farms An addiliond 38 million heltares of agricultural land could be incoTporalld illlO farms if all six CLI classes are considc~red
Although most class 1-4 land is in usc lhere is evidence that not all is used fOT crop production Arla in crop and summer fallow combined amounts to 39 million hectares or about 58 percem of land dass(s 1-4
Ontario Manitoba Saskatchewan and Allcrta arc major crop producing Provinces which aCCOUnt for 78 percent of Canadian farm cash receipts What if all aailabl(~ class 1-4 land in these Provinces were allocated to crop production It is assumed that changcs in hc economic environment necesshysary for thl allocation of this land to crop production would occur and that prcsent t(chnology and cropping patterns would be maintained on the (xpilnded area It is also assumed [as in Shields and Ferguson (J)] that production on thc expanded area would reflect a high level of management skill and would therefore provide an estimate of the lands maximum producshytive capacity Sine( the percentage of production of various crops on each class of land is not known it is necessary to convert the total quaiility of land in class($ 1-4 to a class I equivalent (33)
If yields for class I land in the Prairie Provinces arc rated as the high(sl possiblc then classes 2 3 and 4 are 85 70 and 50 percent as productive respectively as class I land (33) For the rest of Canada classes 23 and 4 are 80 64 and 50 percent as productive as class I land (34) The class I equiva lent of the four classes is determined by multiplying the area of each class by its respective performance index Thus the total quantity of class) -4 land in Saskatchewan for example which is 20 million hectares is productively the equivalent of 145 million he(tares of class) land Estimated potential yields for various crops on class I land were applied to the class 1 equivalent totals to deriv( potential production if all class 1-4 land were used (33)
The greatest potential for crop expansion exists in Ontario where produc tion could more than double Currently land used for farms in Ontario is (quivalent to about 60 percent of class 1-4 land for the Province Ontario with a much milder climate than the Prairie Provinces has the greatest number of frost-free days Also since the majority of class I land is located in Ontario the Provinces productive potential is high in terms of yields and range of crops (see tables 2-5)
Potential for increases in crop production arc also quite high in Alberta Although production of wheat oats barley rye flaxseed and rapeseed could more than double (table 5) climatic factors limit the range of producshytion to small grains oilseeds and forage Saskatchwan aCCOUnts for about two-thirds of Canadian wheat production and has the lowest potential for crop expansion of the four Provinces Production of wheat oats and barley
4
--
---
f bull~~tlt~bullbull ~ ~
11
H wj ~f iq
Table 2 - Potential crop production on class 1-4 land Ontario --~ --~~-- -- -~
Crop -Area gtYield Average Class I
gt
- shy~ gt
~- _-POenrial yield --Production ~uivalent Production on on class I
ale~1000 class J Potential productionMeric tons ~uivalent area
hectares I 000 metn-c ~uivalent area increa~ per hectare 1000
--- tons Metne tOilSWheat hectares 1000 metne - 213 per hectare~ Oats 289 616 tons PercentIb8
-~ Barley 202 443 536148 380
Rye 265 391 2374~ 392 34223 285 Com 181 308 133742 432635 252
t1 fame hay 516 48 13313277 3781096 240 1318 3-17 331
~odder com 565 1816192 851 otatoes 2845 2279 112169872 75018 2-12 )ther crops 2149 721 17093
387 4200747 176 37 302823000 207 1555 1110Total 3415 187 -= not applicable 7100
-1976 census area Source Stadstics Canada Censw ofAgneulture 1976 ----~----~
1967middot76 average Source Canada Grains Council Statistkal Iandbook arious issues --~-
1976 census area times 1967middot76 average yield
cropping pallern00 d H Id ~ h p~ d I d 50 ~h d~ =pttdy ppobullbullgtlt]Ilbullbull bullbull 1gt =ltdog lt0 h 76
Society of America August 1975 San Antonio Texas=bullbull) A Shld d 1 L N_Id AddoJ Lafmiddotmiddot Cp bullbull Cdbullbull p~ M h 1 mg h Soil C~~~Class I equivalent area times potential yield on class I equialent area
-~--1)
I Table 3 - Potential crop production on class 1middot4 land Manitoba ii
-------- --~-----~---~-----------r- -----____~____ I Class Itl Crop Area Average Potential yieldYieldl Production onl production equivalent -on class I Potential productionclass Ii areamiddot equivalent area increaseequivalent areaf 1000K Metric tons 1000 metric 1000hectares Metric tons per hectare 1000 metric 1 tons hectares per hectare PercenttonsU Wheat 1541 173 2666)ats 1685494 290176 887-1~ ~arley 666 869 540 320 83
202 17281345gt1ilced grains 728 380 99 202 2766141 106~ tye
70 77 32037- iI 142 24653 74luckwheat 18 40 250--~~J 81 15 100 87~orn 20 1007 341 2024 33-arne hay 567 8 380- H 410 302325 25en odder corn 620 67013 1592 4154i 207 79laxseed 212 14 224067 314142 52unflowel 20 232 15089 34818 145 apeseed 22 U)O93 101 2294 22[ustard reed 7 102 15088 1536 63ther crops 8 12084 - - 10 67Immel fallow 91926 shy- - 1 nTO - --
Total 4755 5200
- not applicable
1976 census area Source Statistics Canada Census ojAgriculture 1976 rt
1967middot76 average Source Canada Grains Council Statistical Handbook various issues 1976 census area times 17middot76 average yield
Manitoba class 1middot4 land times the performance index of I bull8570 and 50 for each class respectively proportionately allocated to crops according to the 1976cropping pattern
Source J A Shields and J L Nowland Additional LandJor Crop Production Canada Proceedings of the 30th annual meeting of the Soil Conservation Society of America August 1975 San Antonio Texas Class 1 equivalent area times potential yield on class 1 equivalent area
1-t-Z~rLmiddot~middot~Js~-14~~~~ ~ _i)ok-
CJ- _bullbull MJgt-Mr~ltYlsc~tgtt7~~~bullr-~~~~
11
I t1 vi
11 Table 4-Potential crop production on class 1-4 land Saskatchewan l~1
Areal Average Class 1 ~Crop t
Yield Potential yield Production onproduction equivalent on class 1 I class 1 Potential production Narea~ equivalent area1000 equivalent area increaseMetric tons 1000 metric hectares 1000per hectare Metric tons tons 1000 metric hectaresWheat per hectare7159 tons PercentI J Oats 161 11526 I637 5843 ~181 290Barley 1153 16945 [1201 520 47208 320 11 Mixed grains 2498 980 1664
48 44199 380Rye 96 3724 ~ 110 39 49123 320Tame hay 135 125 II871 90 30~ ~ 336 250 Fodder com 2927 2257112 746 67 - -I 670 ~ J Flaxseed 15 476483 2 6387 2240 ~-~- Sunflower 72 452 68 200 f72 150Rapeseed I 102292 100 2 100 42 M
Mustard seed 292 219 238 100 ~ 96 150Other crops 18 357165 16 22- 120Summer fallow - 197177 134 6-- 585~ shy~I shy- - ITotal shy17766 - ~~ - - 14500
- = not applicable - - i-1976 census area Source Statistics Canada Census ofAgriculture 1976 M
~ 1967middot76 average Source Canada Grains Council Statistical Handbook various issues 1976 census area times 1967middot76 average yield tj
~ 1976 cropping patternSaskatchewan class 1middot4 land times the performance index of I 85 70 and 50 for each class respectively Proportionately allocated to crops according to the M
m Source J A Shields and J L Nowland Addz~ional Landfor Crop Production Canada Proceedings of the 30th annual meeting of the Soil Conservation Society of America August 1975 San Antonio Texas Class I equivalent area times potential yield on class 1 equivalent area
f ~ ~
B ~---- ~
---- --~--- I-~-~~
~
Table 5 - Potential -rop production on class 1-4 land Alberta
Crop Average Class I Potential yield Production ltIn ~~Area Yield equivalent on class 1 Potential production production class 1 area equivalent area equivalent area increaseI
i
1000 Metric tons 1 000 metric 1000 Metric tons 1000 metrichectares per hectare tons hectares per hectare tons Percent ----rshy Whelt2t 2243 180~ 4087 2852- Oats 290 8271 105724 199 1441 920A-- 320Barley 29442276 216 lOt4916 2894 380~- Mixed grains 108 10997 124222 240 137 320Rye 438 8373 150 110
Tame hay 1541 365 93 250 233 1125625 1959 67000 Flaxseed 30 92 13125 133 t
28 ~ Rapeseed 299 94
38 150 57 104 281 380 150Mustard seed 9 570 103 ~89 8 11 120Other crops 311 13 63- - 396Summer fallow - shy2611 - shy- 3320 - - -
Total 10225 shy - 13000 - - -- = not applicable
1976 census area Source Statistics Canada Census of Agriculture 1976 1967 -76 average Source Canada Grains Council Statistical Handbook various issues t1976 census area times 1967middot76 average yield ii
tltAlberta class 1middot4 land times the performance index of 1 85 70 and 50 for each class respectively proportionately allocated to crops according to the 1976 Ii
cropping pattern i
Source J A Shields and J L Nowland A dditional Land for Crop Production Canada Proceedings of the 30th annual mel mg of the Soil Conservation Society of America August 1975 San Antonio Texas
1 [~middotClass 1 equivalent area times potential yield on class 1 equivalent area
~
-- qJ ~middot1
T
middot-~~~~W~~~~~scrr~~~l1l~~~~~~~-C~Jr~middota~middotE~x~rjc~r~i~L~~-middot~ n- J -) -~ ~ gt~~J ~A i u~
for example could increase only by about half indicating that a large Proportion of the available agricultural land in the Province is already beingused for crops (table 4)
If all class 1-4 land were allocated to crop production under existing cropping patterns total Canadian wheat production could expand to 32 million tons (a 92-percent increase over the 196970 to 197879 lOyear average production level) oat production could increase to 77 million tons or 78 percen~ and barley to 188 million tons or 63 percent These rates could change if cropping patterns are altered In addition a change in technology resulting in a decline in the use of summer fallow iTt the Prairie Provinces for example would mean a much larger increase in wheat production (33)
LAND USE PROGRAMS
Five Provinces-Manitoba Saskatchewan Alberta British Columbia and Ontario-have developed agricultural land use and tenure programs The issues that these programs deal with are interrelated and complex Land tenure programs concern owner versus tenant farming and family versus corporation farming These programs seek to maintain the family farm in a rural social infrastructure and perpetuate owner-operated rather than tenant-operated farming
Land use programs deal with the allocation of land between compe~ing uses urban versus agricultural Land use priorities are largely determined by a combination of the economic resource base and the philosophical oriemtation of the political party in power in the Province
Federal versus Provincial Jurisdiction
Both land use and tenure programs in Canada fall under the jurisdiction of the Provincial governments The Provinces maintain extensive powers for implementing land control measures under the British North America Act (BNA Act)2 As the Act is generally interpreted the Provinces are constitushytionally empowered to (1) develop laws concerning the purchase or exproprishyation of land for public recreational use (2) implement differential tax structures so that local landowners using land for specific purposes such as agriculture do not bear the burden of increased property assessments resulting from nonresident purchases (3) establish land use and zoning controls and (4) require disclosure of the place of residence citizenship and other pertishynent information concerning persons owning or purchasing land in the Province
It is unclear under the BNA Act whether Provinces were empowered to directly restrict land sales to aliens since exclusive legislative jurisdiction in
The BNA Act is a component of the Canadian constitution It created the Canadian Federal union and delineates the distrivution of powers between the Federal and Provincial Governshyments The Parliament of Canada was granted legislative jurisdiction over subjects of common interest while Provincial legislatures were given jurisdiciion over maccers of local interest
9
matters relating to aliens was relegated to the Federal Government Section 33 of the Canadian Citizenship Act granted aliens equai rights as citizens in acquiring property in Canada (12) Effective February 15 1977 however the Federal Government amended Section 33 of the act allowing a Province to pass regulations controlling land sales to aliens To date Alberta is the only Province which has done so under Section 33 of the Citizenship Act Under the amended law Provinces cannot restrict ownership in such a way that will conflict with Canadas international legal obligations discriminate between aliens on the basis of nationality restrict acquisitions by pemanent residents hind~r foreign states in acquiring property for diplomatic and consular purposes or restrict the acquiition of land approved nnder the ForeignInvestment Review Act (FIRA) (40)
Urbanization and Land Use
Canadas best agricultural land borders the countrys rapidly growing urban centers These urban centers figure significantly in determining land use Cleared farmland is preferred for urban building for example because development costs are relatively cheap (4)
Urbanization influences agricultural land use (1) directly through the actual incorporation of former agricultural land into expanding urban centers and (2) indirectly through changes in the economic environment of urban fringe areas which result in a transition from agricultural to urbanshyoriented land uses Urban commutersheds and their concomitant highways housing developments and recreational facilities for example exert influ ence on land use patterns some distance from the boundaries of the urban center The growing demand for land puts pressure on land prices to reflect urban values instead of the value derived from agricultural capability When the return from other uses exceeds that derived from farming the agriculshytural use of the land is no longer considered justified on economic grounds and the land is allocated temporarily or permanently to alternate uses This phenomenon often means abandoned farms land left idle under speculation or serious financial difficulties for those who continue to farm (21)
Areas vith moderate climate and level terrain conducive to both agriculture and human habitation are limited They are located in a long narrow strip along the U_S-Canadian border with particularly heavy concentrations along the lower Great Lakes and the St Lawrence River in Ontario and Quebec Provinces and along the coast and intermontane valleys of British Columbia This congruity in area for agriculture and population results in a direct competition for use of land much of which is classified as Canadas best for agricultural production This competition is perceived to be affecting the allocation of agricultural land to nonagricultural uses British Columbia and Ontario have developed agricultural land use programs to deal with these issues
Under the FIRA the Faelgn Investment Review Agency established Dec 12 1973 assesses any benefit accruing to Canada when non-Canadians acquire control of Canadian business enterprises or establish new businesses in Canada The agency is responsible to the Minister of Industry Tr2de and Commerce Some land acquisitions would come under FIRA review if they involved a business with gross assets of at least Sl50000 or gross annual revenue of S3 million
10
l
I
I British Columbia
The British Columbia agricultural land use program implemented by the Land Commission Act was one of the first comprehensive attempts on the part of a Province to redirect the process of agricultural land allocation to nonagricultural uses British Columbia consists of a series of north-south mountain ranges with 90 percent of the land mountainous and nonarable Agriculture is limitd to the narrow fertile valleys between the mountains The af~roclimatic characteristics of the valleys however are conducive to producing such spedalty crops as soft fruits grapes and tobacco (20) Becallse crops are produced in the intermontane valleys to which access is restricted by mountains or sea British Columbia farms are relatively small highly specialized and faced with major transportation constraints (16) The average farm size is 126 hectares compared to an average of 201 hectares for total Canada and 374 hectares for Saskatchewan Rapid population growth has led to competition for use of the same topographically limited land this competition has resulted in land prices rising higher than is warranted by the lands agricultural productive potential (16)
The Provincial Government became increasingly concerned about the Provinces ability to produce food on a very narrow land resource base that was being affected by urban development during the early seventies British Columbia is highly dependent on imported food to meet local demand The Government recognizing the Provinces high dependency on outside supply became more sensitive to keeping future land use options open It soon sought a way to plan urban land uses in a more orderly way while preserving remainshying farmland (41)
In December 1972 the Provincial Government placed a moratorium on all future use of certain agricultural land for purposes other than farming Two Orders-In-Council one in December 1972 and one in January 1973 proshyhibited changes in use of land over 081 hectare classified as farmland for taxation zoned for agriculture or designated as having CLI capability of 1-4 (20) Land did nut have to be in actual agricultural production to be affected by the moratorium only to fit into one of the categories (41) Bill 42 the Provincial Land Commission Act as introduced in February 1973 aimed to preserve agriculturallrlrd for farm use and establish and maintain the family farm bull Farm use was defined as the occupation or use of agricultural land for genuine farm purposes as well as certain other uses compatible with the preservation of land for farm use (26)
Section 2 of the Land Commission Act created the Land Commission a five-member board which would establish agricultural land reserves (ALR) in tle 28 regional districts of the Province The land reserves were to include all land capable of sustaining agriculture-that is all CLI class 1-4 land which had not been irreversibly developed If nonagricultural land was not immedishyately available for urban expansion land sufficient for 5 years of urban growth was excluded from the reserve Lower capability land was included in the reserve where there was evidence that it could be used successfully in conjunction with class 1-4 land Class 7 land was included in those instances
41n September 1977 the Land Commission Act was amended the Land Commission title changed to the Agricultural land Commission and its agricultural orientation strengthened
11
f ~
f J
~~r~~~~-~-~~1lmIf
gtI
where excluding it would result in nonagricultural use of an otherwise agricultural area (20) Land was also exempt from the reserve if it had been continuously used for a nonagricultural purpose 6 months prior to December 21 1972 (4)
The Provincial Government maintained review and veto power over the ALRs developed by the regional districts As the Provincially approved ALR plans came into effect they replaced the previous moratorium on land use (20) Land designated as part of an AJR cOllld not be used for any purpose other than farming except as permitted by the Land Commission Act or by order of the Commissiun (6) Proredures were established for appealing an ALR d1signation All ALR plans were completed by 1975 and as ofJanuary I 1978 the total area within the ALRs was 47 million hectares (20)
The Provincial Government recognized that by limiting the use of land to agricultural purposes it was denying farmers the opportunity to cash in on the increased value of their land (16) Land sales often served as a form of farm retirement pension On the other hand it was argued that farmers should make a living from farming not land speculation and that proceeds from that living should permit them to retire on a decent income (4)
The British Columbia Farm Income Assurance Program (FlAP) was introduced in November 1973 as a corollary to the Land Commission Act It provides income protection for farmers operating under an ALR plan with producers contributing one-third and the Provincial Government two-thirds of the premiums to an assurance fund Indemnities are paid out of the fund when market returns fall to a specified percentage of the basic cost of producshytion which is calculated to include labor management depreciation interest on investment and cash operating costs (16) The programs which are effective for 5 years have operated for fruit trees beef dairy hogs field tomatoes greenhouse vegetables table eggs broiler hatching eggs sheep blueberries and potatoes (J 7) As of September 1977 $89 million had been paid under the program to about 5000 producers representing average payments of $17800 per producer
The British Columbia land use program has been in effect long enough to make an assessment of its impact on land allocation to urban and agricultural uses Manning md Eddy (20) found that the British Columbia ALR did bring about a major shift in the location of new residential and commercial development The ALR also prevented much change in land use within its boundaries The rate of subdivision within the ALR for example was considerably lower than in undesignated areas
The designation of land as agricultural within an ALR plan however was not enough to assure that the land was actually used for agricultural producshytion In the short-term period of the study much middothe ALR land was left idle because returns from farming were insignificc 11 in elation to the costs of capital investment on land purchased at prices refle~i 1emand for the land for urban subdIljsions (20) If economic conditi - ~ not conducive to allocating land to agricultural production opportunity costs are incurred by keeping land in agriculture and even more by leaving it idle Both the British Columbia and Ontario agricultural land use programs incorporate farm income stabilization programs which in effect represent a sociol payment to farmers for not reallocating their land to alternative uses The British
12
l
Columbia program has apparently been successful in keeping land In agriculture although at a relatively high social cost
Ontario
Ontario is the home of a major part of the Canadian population and is the countrys industrial center It is similar to British Columbia in its agloclimatic capability of producing a wide range of specialty crops including corn soybeans soft fruit and tobacco which cannot be produced dsewhere domestically as efficiently Ontarilt however does not face the oilstraints imposed on British Columbia by its rugged topography Most of Canadas prime agricultural land is located in Ontario and transportation to markets and Sources of inputs is not a major cost of production as in British Columbia The Province does experience intense competition for use of prime agriculshytural land Speculation and nonfarm investment stemming from urbanshyoriented population pressures are identified as major factors driving up the price of land making it difficult for farmers in the Province (21)
rhe Ontario Government has not placed a moratorium on use of farmland as in British Columbia (42) Like the latter however one of the motives for Ontarios developing a land use program to preserve agricultural land was to reduce future dependence on other nations for those commodities which can be produced within the Province (22)
Ontario agricultural land use programs were developed on the premise that (1) land use will be determined by the operation of the market place to the greatest extent possible (2) that tradeoffs will be made between economic growth and desired land use patterns (3) that land use programs be conshyducted and enforced at the local municipal level and (4) that the Provincial Planning Act would be the main vehicle used to achieve ProvinLial land usepolicy objectives
Under the Provincial Planning ACl a designated planning area (which may be a single municipality groups of municipalities or a region) may draw up an official land use plan a statement of the development policies of the region It may include a map and text showing land use allocations The plan by itself does not indicate how any piece of property may be used Zoning and other bylaws however which state lpecifically what mayor may not be done on individual parcels of property must conform to an Official Plan The Province maintains ultimate review and veto authority over the regionalOfficial Plans (24)
An Official Plan is expected to remain flexible and is therefore subject to review and OImendment An amendment may represent an actual change in policy or a refinement of existing policy In e former instance the Official Plan would have to be changed before zonirigbylaws could be implemented to permit the new use In the latter instance the change would merely be added to the plan (24)
The Ontario Planning Act administered by the Ontario Ministry of Housing was originally devised to solve urban problems The Ontario Ministry of Agriculture however provides agricultural expertise as part of the development plan review process Although Official Plans have not been developed for all regions the ultimate goal is to have all settled areas of theProvince under a plan
13
The Ontario Ministry of Agriculture has been working to develop a more comprehensive agricultural land use program and guidelines under which agricultural considerations can be incorporated into local plans under the Planning Act The Ministry released a policy statement (21) in March 1976 specifying the governments commitment to preserve better agricultural land and to maintain the economic feasibility of using such land for agricultural purposes (42) These policy objectives could be achieved through Provincial commodity stabilization programs production expansion programs agricuhural economics research and development of a market value tax assessment to relieve the burden of real estate taxes on farmland
The preservation of better agricultural land would also be achieved through programs to encourage municipal developm~nt on poorer soils and to channel recreational and industrial development to lands less suited for agriculture The O~Hario Ministry of Agriculture is also committed to developing guidelines that apply agricultural interests to Official Regional Plans (21)
The guidelines presented in 1977 (22) specify that the CLI could be used to identify prime agricultural land Once the land capabilities are identitled the allocation of land among land uses should be evaluated This distribution of land should reflect the priority of agriculture however if agricultural capabilities exist If land is designated as agricultural it should be incorposhyrated into the Official Plan of the region and its supporting land use map High capability lands should be given the greatest protection and uses compatible to its long-term retention for agriculture should be specified Once agricultural land is incorporated into the Official Plan it can be used only for agricultural or agriculturally compatible purposes The agricultural use spedfication can be changed only if the Official Plan is amended Thus it is the ease or difficulty with which the Official Plan can be altered which detennines whether or not land remains agricultural
LAND TENURE PROGRAMS
Land tenure is an issue closely related to land use because land use combines human and land resource inputs The owner most frequently detershymines how the land will be utilized If ownership of a certain quality land is restricted to farmers the land will likely be used for agricultural production
Ownership Control
The owner-operated family farm is a concept traditional to North Amershyican agriculture Although the feudal land system did exist in Quebec during 1626-1854 immigrants left Europe for Canada to get away from the restricshytive feudal land tenure system A land system allowing maximum individual control evolved in Canada as a result (11)
Canadian settlement policies established the owner-operated family farm as the predominant form of agricultural production unit (25) Technological changes in agriculture resulted in an increase in the scale of farming and a shift from single proprietorship to partnerships or family corporations ~ These
Family corporations are farm corporatiuns in which the immediate family holds a majority of the shares resides on the farm and provides most of the labor
]4
changes have caused Concern about the economic survival of family farms their ability to compete with commercial corporations or communes and the effect of their decline on the rural community (3)
Boylan argues that there are three traditional forms of tenancy full owner part owner and tenant (5) The full owner has the most security and freedom for decisionmaking of the three tenure forms Full ownership facilitates the adoption of improved farming practices and effective longshyrange farm plans necessary for efficient usc of farm resources
Part owners and tenants rent or work on shares for others This type of tenure involves a lease in which the landlord conveys rights of use and possession of a given property for a deiiniw period of time in return for payme1t Rental contracts are based on Custom and tend to be fairly rigid Insecurity in rental tenure which results in the movement of operators from farm to farm often affects the efficiency of farm resource use Rental tenants typically do not make the long-term decisions necessary for continued effishycient agriculture such as those decisions relating to soil maintenance Consequently rental tenancy conflicts with social goals concerning the long-term existence of agriculture (5)
When nonresidents foreigners or commercial corporations own the land they often act as absentee landlords renting the land to farmers Foreign nonresident and commercial corporate ownership of agricultural land has thus been a focus of land tenure programs in Canada Foreign investors and commercial corporations with access to capital not available to Canadian family farmers are investing in land as a hedge against inflation Since they can use their capital resources to buy land at prices unrelated to the return from agricultural production they are perceived to be driving up the price of agricultural land (7) Family farmers with a smaller capital base thus find it increasingly difficult to compete for land resources needed for efficient agriculture Or to transfer land to the next generation of young farmers Sas katchewan Manitoba and Alberta hav( devdoped legislation to control foreign nonresident and commercial corporation ownership of land
Saskatchewan
The Saskatchewan Farm Ownership Act of 1974 as amended was developed on the premise that Provincial residents who were involved in day-to-day agricultural operations and who spend a major part of their time and agricultural income in the Province should control agricultural resources In addition they should be protected to some extent from capital resources accumulated in other industries or countries (29)
Under the Farm Ownership Act implemented by the Farm Ownership Board nonresidents and nonagricultural corporations7 are prohibited from owning more t~m 65 hectares or a quarter section Nonresidents need not dispose ofand held prior to 1974 or of holdings acquired between March 31
A resident is defined 15 one who lives in Saskatchewan for 18~ days or more a year or within 20 miles of the Saskatchewan border This includes US citizens who may own land on both sides of the border
An agricultural corporation is defined as a corporation primarily engaged in farming where at lea~t 60 percent of both the voting and nonvoting stock is owned by resident farmers (27)
1974 and September 15 1977 if the assessed value of the holdings for taxation is not greater than $15000 (27)
A nonresident holding land in excess of the amount stipulated in the Act has 5 years from the date of becoming a nonresident to dispose of the excess land unless he or she is a former farmer8 in which case the land may continue to be held regardless of residence status Former farmers may also transfer their land to direct relatives -- spouse child grandchild brother sister nephew niece or spouse thereof regardless of their residence status (27) Nonrsidents intending to become a resident within 3 years may with the permission of the Farm Ownership Board acquire more than 65 hectares during the 3-year period (27)
Nonagricultural corporations with holdings in excess of 65 hectares prior to March 31 1974 must dispose of the excess land by January 1 1994 and submit a land holding disclosure statement to the Farm Ownership Board
once a year (27) The Act is enforced by the Farm Ownership Board which may conduct
investigations into land ownership Anyone who does not comply with or impedes an investigation is subject to a maximum fine of $1000 Anyone found guilty of contravening the Act is liable for a $10000 fine a 6-month imprisonment or both A corporation violating the law IS subject to a maximum fine of $100000 every corporation officer involved is liable for a maximum fine of SI0000 a 6-month imprisonment or both The Board may also order nonresidents or nonagricultural corporations to divest of any land over that amount permitted (27)
A computer land registry system based on a survey of all rural municipalshyities providing information on 5000 nonresidents and 1000 corporations is used to enforce the Act The survey forms the basis of a continuing registry used to monitor land transfers (29) Legislation is being formulated requir ing residence to be declared as part of a land transfer
Manitoba Under the Manitoba Agricultural Lands Protection Act of June 1977 as
amended and administered by the Agricultural Lands Protection Board nonresidents9 may own no more than 8 hectares of land A nonresident can own land in excess of 8 hectares if it was owned prior to April 1 1977 or if right to the title for the land arose prior to that date (18)
If a corporation becomes a nonresident through the sale of shares or if a nonresident corporation acquires land in excess of 8 hectares through a legal settlement it has 2 years to dispose of the excess land The Board may take legal action to dispose of land acquired by a nonresident in excess of the amount stipulated if the nonresident has not done so within 2 years of
notification (J8) Investigations may be conducted to implement the Act Any person who
does not supply information requested is liable for a maximum fine of $500
A former farmer is defined as someone who at some time in the past lived in Saskatchewan and farmed the land for years
A Canadian resident is defined as a Canadian citizen or landed immigrant actually living in Canada or a corporation the majority of whose issued voting and nonvoting shares is owned by Canadian citizens permanently residing in Canada
16
Any individual or corporation contravening the law is liable for a maximum fine of $15000 In addition any corporaton officer responsible for contrashyvention of the law is liable for a maximum fine of $15000 Enforcement is ensured through Sworn declarations on citizenship attached to the land transfer (8)
Alberta
1 Foreigq ownership of land in Alberta is controlled by the Foreign Ownershyship of Land (temporary) Regulations established by an Order-in-Council under Section 33 of the Citizlnship Act on April 26 1977 These temporary regulations will eventually be supplanted by the Foreign Ownership of Land Regulations passed under the dual authorily of the Agricultural and Recreashytional Land Ownership Act and Section 33 of the Citizenship Act 10 (J)
Hnder the regulations ineligible persons-non-Canadians and temporary reSIdents-and corporations with 50 percent or more of their shares or memberships held by ineligible pernons cannot own more than 8 hecares of controlled land Controlled lapd is defined as any land oUfside the boundaries of a city town new inwn Village or summcmiddot village Controlled land however may be acquired by a foreign state for diplomatic or counsul purshyposes The area limitation does not apply to controlled land transferred through inheritance There are no restrictions on urban property (1)
Enforcement of the regulation is ensured by sworn declaration attached to land transfers and by investigative procedures carried out by the Foreign Ownership of Land Administration with use of information supplied by Land Titles Branch (1) Contravention of the law is subject to a maximum fine of $10000 imprisonment of up to 1 year or both Land that is acquired in contravention of the law may be sold by judicial sale Proceeds from the sale are used to cover sale expenses and any remaining funds up to the amount originally paid for the land are returned to the individual Any proceeds exceeding the amount originally paid for the land are put into the General Revenue Fund of Alberta l)
Transfer of Ownership
The transfer of agricultural land from One generation to the next is an integral part of maintaining the owner-operated family farm ensuring that future farmers are available to utilize the land preserved for agriculture (32) A start in farming however requires substantial capital resources As land prices continue to increase the need for capital for young farmers entering the industry becomes increasingly acute
Sallkatchewan
The Saskatchewan Land Bank established in 1972 by the Land Bank Act and administered by the Land Bank Commission was developed to alleviate some of the problems associated with the generational transfer of land Its objectives were to develop a viable agricultural industry in Saskatchewan and
IOAs of OCllb~r 1978 Bill 40 was not yet in effecl Regulations under Bill 40 however will not differ in intem fTOm the temporary regulations but will be more detailed
17
provide for a transfer of farms from generation to generation rather than have family farms absorbed by large farm units The Land Commission a government agency purchases land thereby absorbing the capital costs associated with land transfer It then rents the land to applicant farmers The land bank program provides continuous sales opportunities to Saskatchewan farmers and enables individuals to begin farming independently of substan tial fa~i1y assistance It also encourages the perpetuation of viable family farm units through the transfer of land to direct descendants (30)
Although the land bank program involves the transfer of land through rental tenancy efforts have been made to eliminate this type of transfers detrimental effects on efficient resource utilization Land Bank leases for example are long term and the Commission reimburses the lessee for capital improvements made during tenure which (it is expected) would provide the security necessary to make long term investment decisions to use resources efficiently
Under the program the Land Bank Commission may purchase land from anyone wishing to sell In instances where the Commission must allocate available funds among several offers for sale it will purchase by order of priority from farmers who (1) want to retire and transfer their land to a direct descendant (2) are selIing land that can be used to establish a viable farm unit (3) have large tracts of land on which two or more operators can be supported (4) have palcels of land constituting full units or (5) have no other sale alternative (3l)
The Commission purchases land at market value This is determined through an appraisal process in which the productive value of the cuhivated portion of the sale property is correlated with the productive value and sale price of cultivated properties of similar soil quality in the samt area The productive value is determined through lax assessment data Thus the Commission price is essentially determined by the relationship between prices of recent land sales in the area and the assessed value of the land for taxation purposes A similar process is used to determine the market value of grazing land Assessments are also made of the value of buildings and other improve ments on the property (31)
Land purchastd by the Commission is allocated to lessees on the basis of a point competitj~e system if there is more than one applicant for a given piece of land Applicants are scored on their income potential skill age vendors preference and potential disruption of existing farming enterprises The applicant must declare an intention to make farming the principal occupa tion and be of legal age a resident at the time of leasing and during tenure and a Canadian citizen or immigrant The applicants and spouses combined average annual income for the preceding 3 years must not exceed an amount annually determined by the Commission II The applicants and spouses net worth may not exceed $21000 in 1979 Applicants gain or lose points if their projected net income projected land base in work units or age is outnide the optimal range established by the Commission Points are gained for educa tion experience and for an indication from the vendor that the applicant is the preferred recipient of the land Points are lost for the average distance in
JJBa~d on (h~ composit ind~x of wag~ for Saska(ch~wan in 1977178 this amount was 520000 in 1979
18
II
miles ~-(iat the piece of land applied for is from other land units the applicant is farming (JJ)
Applicants scoring highest arc then intervilwld 10 assess their motivation management ability and other characteristic all of which arc also numershyically scored The applicant with the highest cumulative point score unless otherwise determined by the Commission is awarded the lease (31)
The llase remains in effect until the lessee reaches the age of 65 or dies The lessee may stipulate in writing if the least is to be passed on 10 a direct dlscendant After the age of 65 short-term leases may be granltd under certain circumstances
Since June 1 1978 rent is based on the production value of the land whierl is calculated from th( prices of oilseetis wheat and barley and thtlong-term yield of equal quality land in th area Prior to that time rent was based on a percentage of the lands market value The lessee is responsible for the payment of taxes (J])
Lessees have the option to purchase land after leasing from tht Commission for 5 years The land is sold to lessees at its market value at the time of sale Llssees purchasing land are entiLied to an earned homestead quarter refund made by the Commission on the purchase price of a quarter ~ection of land If the lessee lives on the rented land the inhabited quarter section is the section on which the refund is paid If the lessee does not live on the rented land a quarter section is designated as the humestead quarter on which the refund is paid The refund is 20 percent of the price paid by the purchaser for the qultrter section to a maximum of $5000 paid over a period of 5 years following the land transfer In order to receive the refund the purchaser must be actively engaged in farming and remain a bull esident of Saskatchewan during the 5 years or the balance Q1f the refund is forfeited (J1)
Buildings and improvements on the property are sold under a long-term agreement to the lessee When the lease expires the Commission purchases tht lessees earned equity based on the market value of the improvements thus ensuring that lessees receive the benefits of their investment decisions This combined with the homestead refund means that the lessee builds equity while renting from the Commission (31)
Effects of the Land Tenure Programs
During 1972-77 the Land Bank Commission acquired 354000 hectares of land for a total cost of S8l million This land as of December 31 1977 was being leased to 1912 ksse(s through 2009 leases (30)
In Saskatchewan nonresidents purchased a total of 59877 hectares in 1976 compared to 56769 hectares in 1977 (28)
Compiled data on foreign land transactions in Manitoba is unavailable (19)
In Alberta the amount of land purchases by non-Canadians and foreign corporations during 1976-77 as monitored under the Foreign Ownership of Land Regulations declined 60 percent DuringJanuarY-August 1978 foreign purchases were running 89 percent behind purchases for the same period in 1977 In 977 foreign purchases accounted for 2 percent of total area of rural sales compared to 5 percent of total rural sailS in 1976 (2)
19
LAND USE AND TENURE IN PERSPECTIVE
The dominant themes that emerge from the hind use and tenure programs are that Canadian farmland prices have been increasing and that these increases affect land allocation to agriculture and land tenure patterrs In order to fully assess these themes it is necessary to know (1) how much agricuturalland is actually being lost due to nonagricultural use (in this case urbanhiation) (2) what changes have occurred in land tenure patterns and (3) what factors influence farmland prices in Canada
Loss of Agricultural Land Through Urbanization
D M Gierman (15) has determined that during 1966-71 12801 hectares of class 1-4 agricultural land were irretrievably ca~yerted to urban use annually in Canada The highest rates of conversion Occurred in Ontario and Alberta where an average of 6199 and 2046 hectares respectively of class 1-4 agricultural land were annually converted (table 6) Over 80 percent of the land converted was formerly classified class 1-4 for agriculture The converted land however represents less than 1 percent of total class 1-4 landin those two Provinces
The annual loss of production due to the permanent reallocation of land to urban uses can be estimated by converting the amount of class 1-4 agriculshytural land annually incorporated into cities to a class 1 equivalent proporshytionately allocating the class 1 equivalent land to crops according to the 1976 cropping pattern and multiplying the area allocated to each crop by the potential yield for that crop on class 1 equivalent land (tables 7-10) Accordshying to these calculations losses of potential production due to the direct incorporation of land into cities in the short term (1 year) anc n the long run (20 years) assuming constant 1966-71 rates are relatively small in the three Prairie Provinces Loss of potential production due to land use changes in Ontario however is fairly substantial particularly in the long term DecHnes in production of the major crops in Ontario by 1996 could range from almost 4 percent of average production of tame hay to over 6 percent of rye (tables 7-10)
Manning and MCCuaig (21) quantified the amount of CLI class 1-4 agricultural land likely to be affected by urbanization by looking at CLI class 1-4 land within a 50-mile radius of 19 of Canadas major Census Metropolitan a Areas Fifty-four percent of Canadas class 1 land and 21 percent of Canadas class 1-4 land is within 50 miles of the specified areas Approxishymately 45 million hectares of class 1-4 land is located within the fringe areas of urban centers in Ontario Applying the same methodology used to detershymine the productive capacity of agricultural land directly incorporated into urban centers it is evident that the productive capacity of the urban fringe area in Ontario (table 7) exceeds present production levels for the Province
Census Metropolitan Areas as desirnated by Statistics Canada are urban areas with Over 100000 inhabitants The 19 areas are Edmonton Calgary Saskatoon Regina Winnipeg Thunder Bay Sudbury Windsor Toronto Kitchner St Catherines Hamilton LondonOttawa Montreal Quebec Chicoutini St John and Halifax
20
-------___I~
Table 6-Average annual conversion rates of rural land of vanous
agricultural capabilities to urban uses 1966-71
Province Total class
5-6
HectaresOntario 2496 1789 1503 41I 6199Manitoba 293 219 512538 409 5 952Saskatchewan 28 60 88127 63 29 219 8Alberta 4 12564 747 471 264 2046 165 186Other Provinces 35176 1285 827 1197 3385 498Total Canada 3136 4486 70 3263273 1906 12801 992 539 1531 - = not applicable
Source D M Gierman Rural to Urban Land Conversion Fisheries and Environment Canada Lands Directorate Occasional Paper No 16 Sept 1977
and is over 50 percent of the total production potential on all CLI class 1-4 land in the Province (table 2)
This means that a substantial quantity of agricultural land in Ontario is subject to change from agricultural to urban-oriented use The exact proporshytion of land that may actually change however cannot be determined from available information Although the potential for increased crop production in Ontario is substantial due to the combination of good land and favorable climate this potential is affected by competition between agriculture and urban development
The situation in the Prairie Provinces is considerably different The amount of land located in the fringe area of cities in Manitoba Saskatcheshywan and Alberta equals 14 30 and 27 miI1ion hectares respectively (21) The productive potential of this land is equal to about one-fourth to one-half of present production in Manitoba one-fourth in Saskatchewan and one-third in Alberta
Land Tenure
Total Canadian farm area has been declining-down about 14 million hectares or 2 percent during 1961-76 A 25-percent decrease in eastern Canada was partially offset by a 5-percent increase in western Canada Farmland declined about 13 million hectares in Ontario and increased 11 million hectares in Alberta Thus the amount of farmland is declining in eastern Canada which has the best agroc~imatic potential for food producshytion and increases in farmland are occurring in western Canada which has considerably less agroclimatic potential Land which can grow fruit vegeshytables and corn in eastern Canada is being replaced by land suitable for barley and hay in western Canada
Average farm size in Canada continued to increase during 1971-76 from 187 hectares to 201 hectares The largest increases in size occurred in Manitoba and Saskatchewan where farms increased 9 percent from 220 to 240 hectares and 342 to 374 hectares respectively
During 1971-76 the total number of farms declined about 18 percent (table 11) The percentage of farms fully operator owned in Canada declined
21
I
I
- - - -
- ~~ - ~~~
~
~ A_shy
f
Table 7-Ontario Estimated loss in crop production on class I equivalent land due to conversion to urban uses ~ rIClass 1 Productive capacity of converted agricultural land
~uivalent area ~ I yearCrop in cropo 20 yean Productive capacity of urban fringe ff
Iconverted annually Production on1Percentage of Production on IPercentage ofconvertwto urban wes average Class 1 ~uivalnt
areal converted average I Production on 1Percentage of H area in urbanproduction l area urban fringe 1~productionmiddot averagefringe ~Hectares areaSMetric tons Percent productionMetnc tons fiPercentWheat 1000 hectares 318 1000 metric tons 1704 Percent ~ Oats 028 t280 34080 55 ~958 229Barley 25 1227221 19160 50 199955 202Rye 24 691 ~ 34 19100 18249Com 947 31 2580 61
159 687 115 H129 8059 25 ~~Tame hay 1635 25 161180 49 95 22612263 682Fodder com 20518 245260 39 5804 11721756 1177Potatoes 22 882827 435120 14344Nl 810Other 21 373
Nl 1114 16200 41 15666 159- 19- 570- - 147Total 5094
802 - shy- -3668 - = not applicable
Class I equivalent area in crops converted annually to urban USe times potential yield on class I equivalent land (from table 2)
(1976 ara ti~es 1967middot76 yield) times 100 (Annual production on converted area)
Annual production on convened area times 20
(1976area times 1961middot76 yield) times 100 (Annual production on area converted oVer 20 years)
Area in urban fringe times potential yield on class I equivalent land (from table 2)
bull (1976 area ~imes 196776 v~eld) times 100 (Annual prodUcuon On urban fnnge area)
Sources D M Gierman Rural to Urban Land Conversion Fisheries and Environment Canada lands Directorate Occasional Paper No 16 September 1917 and E W Manning and j D McCuaig Agncultural Land and Urban Centres an Overview ofthe Significance ofUrban Centres to Canadas Quality Agricultural Land Fisheries and EnvironmentCanada lands Directorate july 1917
Table 8- Manitoba Estimated loss in crop production on class I equivalent land due to conversion to urban uses
CIa I Productive capacity of converted agricultural land equivalent area I year Productive capacity of urban fringeCrop 20 yranin crops
converted annually Production on Percentage of conv~rled CI I equivalentProduction on 1Percentage of
to urban uses average productiorn Percentage ofconverted averageareal production area in urban urban fringearca production averagefringe areaHeclares producrion1Melnc Ions Percenl Meine Ions Percent 1000 heclares Wheat 1000 melnc Ions 242 Percent702 ~~Oats 14040 05377 350246 03 1015 38Barley 4920104 57 113395 362~3 42Mixed grains 7900 59O 15232 578Rye 6
~ 640 45 16 43
15 51Buckwheat ~3 300 57 363 83 02 20 38Com 60 40I 44 ~ 4 27Tame hay 80 3389 2596 OS 8 33Fodder com 11920 51 2 45 ~2 129 864 3iFlaxSttd 900 43 - 33~ lt 50 3 67M Sunnower 1000 70 32 -shy Nl 3 3 02 48 72
Ra~d 60 33 51tJO 15 523 ~ 5~ Mustard seltd 460 49 28I 1
Other crops 15 I ~2 20 33 2
32 34 a--bullbullbull- 2 67Summer fallow 145 19
211 Total 746
~ 1083
- = not applicable
Class I equivalent area in crops converted annually to urban use times potential yield on class I equivalent land (from table 3)
(1976 area ti~es 1967middot76 yield) times 100 (Annual production on converted area)
Annual production on converted area times 20
(1976 area times 1967middot76 yield) 100 (Annual production on area converted over 20 years) times
Area in urban fringe times potential yield on class I equivalent Idnd (from table 3)
(1976 area ~imes 1967middot76 y~e1d) times 100 (Annual production on urban frmge area)
Sources D M Gierman RU1a110 Urban Land Conversion Fisheries and Environmem Canad Lands Directorate Oteasiona Paper No 16 September 1977 and E W Manning and J D McCuaig Agricullural Land and Urban Cenlres an Overview of Ihe Significance of Urban Cenlres 10 Canada S Qualily Agneullural Land Fisheries and EnvironmentCanada Lands Directorate July 1977
~
0
Table -Saltkatchewan timated I m nop pmduction on cia I luilent land due to conenio to uban u CI I n
Productive capacify of conerted agricuhural landequivalen areaCrop I year
20 yea in cropo
converted annually Productive capacity of urban fringeProduction on 1 Percentage of 10 urban ilia convrrtrd avrrage Productio on I Pecenage of
CI I equivllen area I production convltnrd avrragr Production on I ~
area in urban Percenage ofHectares arra Production urban fringe Meine Ions fringe avrrage Wheal Percent Meine Ions I aira l
67 Percent productionOars 194 JOoo heClares000Barley 6 19 3880 JOOO melne Ions
003 PercentII 00Rye 380 88442 I 00 03 2564
Tame hay 3 840 79 22 00 03 253
Rapeseed 8 54 60 148 22
~- 3 00 04 562Other crops 5 1080 14 22
~shy 4 00 04 35Nl 26Summer fallow 100 108 ~ ~ 67 -
03 72436 25 - 54
~ 39 12 Total area 167 887 - v_~middotmiddotshy bull- = not applicable - 2195
Class I equivalem area in crops converted annually to urban Use times potemial yielel on class I cquivalem land (from table 4) (1976 area ti~es 1967middot76 yield) times 100
(Annual produlttlon on converted area)
Annual production on convened area limes 20
(l976aa times 1967middot76 yield) times 100 (Annual production on area converted over 20 years) I
Area in urban fringe times potential yield on class I equivalem land (from table 4)
(1976 area ~imes 1967middot76 yeld) times 100 (Annual production on urban frmge area)
j D M G~bull tlt Ubo Lo Cmbull yh ~_ Co t n~ Ocroo P N p nood E W M
Canada Lands Directorate July 1977 J D Mabullbull _ Uoo C_ M C Qoooo1 Lo ood bullbullbull0 I ~ of U COO
I--------~~-==o~~~~~~~~
f shy
~~~tmiddotmiddot ~ -
~ Table lO-Alberta Estimated loss in crop production on class 1 equivalent land due to conversion to urban uses lt
I
CI I Productive capadly of coverred agriculrural land equivalent area
Crop I yenin cropo 20 yean Productive capacity of urban frin~ converled annually Production on JPercenta~ of
to urban IUeI onyerred ayeta~ Producrion on - Percenta~ of CI I equiyalentconverted avera~ Production onarea I production t I Percenta~ ofarea in urban arr~J production urban fringr
Hectares fringr averageMelnc Ions arealPercent Melnc Ions I produclionWheat Percent364 1000 hecla resOats 1056 003 JOOO melric Ions Percent118 21120Barley 378 05203 451370 7560 1308Mixed grains 1406 03 52 146 32
18 28120 467Rye 58 57 3202 45712 1160 1737Tame hay 30 03 48 3522250 600 70Flaxseed 1675 55 2903 155 33500 38Rapeseed 8 60 3503 31049 160 2077Mustard d 74 03 57 6 37NI I 1480 tJ1 Other crops I 01 53 9 326049 20 90Summer fallow - 2 32-- 424
25 2- - - 61 25
~ - -Total 1660 - ~- - not applicable 2055----- -
525
lt-Class I equivalent area in crops converted annualy 0 urban u limes potential yield on class I equivalent land (from table 5)
(1976 area ti~es 1967-76 yield) times 100 (Annual producuon on converted area)
-1
Annual production on convened area times 20
(1976 area times 1967-76 yield) 100 (Annual production On area convened over 20 years) Urnes bull
Area in urban fringe times potential yield on class I equivalent land (from table 5)
bull (1976 area ~imes 1967-76 veld) times 100 (Annual produclJon on urban frmge area) j
Sources D M Giennan Rural 10 Urban Land Conversion Fisheries and Environment Canada Lands Directorate Occasional Paper No 16 September 1977 and E W_ Manning and Canada Lands Directorate July 1977 J D McCuaig Agnculural Land and Urban Centres an Qnew of Ihe Significance of Urban Cenlregt 10 Canada Qualily AgrIcultural Land Fisheries and EnvironmentI
I ----~~~i~~
I
Table II - Number and proportion of census farms by tenure of operator 1971 and 1976
OwnerProince Part Owner1971 1 1976 1 1971 1 1976 1 1
1971 1 1976 1 1971 1 1976 Number Percentage of
total Number Percentage of Ontario 691162 total501165 i4Manitoba 66 1987721608 2171517238 2162 28Saskatchewan 58 1118441499 1073436612 54 32 36Alberta 53 3009737193 2739833584 3959 39Canada 59 21284251066 20206189063 3469 63 35---------------- 95862 93757 26 31Tenant
-I97I-=C-imi-J 1971 1 Total-shy
1976J J 1971 1 1976 Number Percentage of
Ontario total Number49113 4403 5Manitoba 62189 947221991 76983Saskatchewan 6 75374 349815568 29963Alberta 7 84225 769703520 69578Canada 7 619200 6270217298 573105 6 366128 300118
Source R Davianlt Selected Agricultural Statistics for Canada Agriculture Canada Ottawa1977
from 69 percent of the total number of farms in 1971 to 63 percent of the total in 1976 and the number of farms partly owned or fully rented by the operator increased from 26 to 31 percent and 5 to 6 percent of the total number of farms respectively The percentage of owner-operated farms in Alberta and Saskatchewan remained about the same during 1971-76 although the total number of owner-operated farms in Canada declined The largest decreases in the percentage of owner-operated farms oCcurred in Manitoba and Ontario where the percentage of owner-operated farms declined from 62 to 58 percent and 74 to 66 percent respectively during 1971-76 (table II)
Farmland Prices
Canadian farmland prices increased 121 percent in nominal terms during 1971-76 from an average of $24631 per hectare to an average of $54372 per hectare The largest increases in farmland price occurred in Ontario where farm prices increased 150 percent from an average of $80240 per hectare in 1971 to an average of $2007_01 in 1976 The smallest increases Occurred in Manitoba where farm price increased 94 percent from an average of $17865 per hectare in 1971 to $34638 in 1976
Price reflects the intersection of demand for and supply of land Thus the allocation of land between divergent uses relates to the cumulative effect of the demand for those uses upon its price Farmland price is affected by the interaction of farm and nonfarm demand Farm purchasers are defined as those individuals for whom the price of land is determined by past and expected returns from the land for agricultural production Nonfarm purshychasers are individuals for whom the price of land is determined by past and
26
expected returns from the land for other than agricultural purposes (13) Foreign purchasers of land are considered nonfarm buyers when the price at which they are willing to buy land is determined by economic conditions in their domestic economy rather than returns from Canadian agriculture even if the land they purchase remains in agriculture through tenant farming
The determinants of farmland price relating to nonfarm demand include the presence of minerals for extraction forests population pressure on use of the land which is manifest in urbanization construction of transportation systems speculation and recreational or residential construction Those relating to farm demand for land include farm income pressures to enlarge farm holdings and advances in agricultur~1 technology (13)
Land prkes are an underlying focus of Canadian agricultural land programs particularly since the impact of nonagriculturally oriented demand on land prices influences the allocation of land away from agriculshyture and affects preferred land tenure patterns The land use and tenure programs therefore deal with the effects of urban-oriented and foreign or nonresident nonfarm purchasers on land prices use allocation and tenure ptterns
Since farmland prices are determined by a combination of farm and nonfarm demand the question arises as to their relative effects on Canadian farmland prices (table 12) The effects of farm and nonfarm demand on farmland prices were estimated by means of an econometric model Because Canadian programs focus on the effect of urban oriented nonfarm buyers on land price the number of urban and rural nonfarm residents in each of the Provinces (Ontario Manitoba Saskatchewan and Alberta) was used as a proxy for nonfarm demand (table 13) It was assumed that each additional urban and nonfarm rural resident represents potential demand for residences transportation or other nonagricultural uses Net farm income was used as a measurement of the effect of farm demand on land prices (table 14) It was assumed that the supply of land is constant and that the impact of a change in farm income on land prices is distributed over a 2-year period following the year of the change T~e analysis is for the period 1960-76
The following equation was used
Yil = a j + t3 iX 1iI-1 + YiX 1iI-2 + OiX2il + Ei
where Y farmland price in real terms = total Canada (C) Alberta (A) Manitoba (M) Ontario (0)
and Saskatchewan (S) X I net farm income in real terms
urban and nonfarm rural populationX2
The parameters of the above equation were estimated by ordinary least squares regression for each of the four Provinces and total Canada with the following results
ii DW CV
YC = 1
-20126 + 17024 XI CI-I (431)
+ 21009 XI CI-2 + 17765 X ZC1(477) (1067)
097 156 3
YA1 = -11673 + 05628 XI AI-I + 2174 XI AI-Z + 29117 X ZA1(210) (376) (080) 094 170 4
27
~ ~~ 1
l~
YM I = - 95S11 + 0917S XI M I_I + 12098 XI M 1-2 + 28765 X M 077 188 7(175) bull (l7S)middot (159)z 1
YObullI = -10214 + 45268 XI 01-1 + 30839 XI 01-2 + 17994 X 0 I z 096 207 6(395) (242) (754) bull
Y51 = -9501 + 11926 Xl 51-I + 16129X _ + 19218XI5I Z(351) bull (406) bull (507)ZS1 089 167 6
IIe elasticities of the two explanatory variables for each of the four Provinces and total Canada are as follows
Province XI XI Ontario 70 161Manitoba 29 117Saskatchewan 39 220Alberta 28 74Total Canada 44 135
Results of the analysis indicate that the two variables were significant and accOunted for most of the variation in land prices during 1960-76 The
Table 12 - Value of farmland deflated by CPI
Year c Ontario ManitobaI Saskatchewan Total Canada
Million dollars 1960 4172 1312 30481961 2748 148474415 1350 31021962 5238 1444
2177 1527438881963 3570 175725244 1546 43921964 5551 1735
3847 184604952 4240 19960
1965 5782 1967 56941966 6153 2100 4785 21858
62421967 6824 5109 234482250 66611968 7554 2305 5520 25II8
65541969 8398 5756 262272046 5539 5395 25466 1970 7667 2129 59671971 7718 2046
54II 2564057591972 5256 251817688 1952 54961973 8671 2076
5071 247045917 53141974 10173 267832387 6675 6152 30914
1975 II586 2456 78311976 12567 6780 345362666 8742 6950 37204 Sources Statistics Canada Quarterly Bulletin ofAgncultura Statistics Ottawa various issues
28
-----shy~
Table 13-Urban and rural nonfarm population 1960-76 1
OntarioYear Manitoba Saskatchewan Alb~~-Id~t-~-ana a
~ -~~ -bull----Thousands
1960 5590 739 ~~ 10201961 5730
610 15801 1962 5873
750 620 1046 16165760 6311963 6020 1072 16537771 1964 617]
1J41 1099 16917782 652 ] 126 17306 1965 6325 793 6631966 1154 177046479 803
10 1967 6654 818 675 1185 181016821968 6833 834
1230 18535 ]969 7018
689 1277 IS9S0 849 696 1325 19435 1970 7207 865 1971 7404
703 1376 19902880 7101972 7515 888 1427 20406
7131973 7627 1469 20712896 717 15111974 7742 904 720 21022
1555 21338 1975 7858 9]2 7241976 7985 1600 21658920 728 1648 21958
The data for intercensual years is determined from the average annual rate of increase in population extrapolated between the census years 1961 1966 1971 1976
Sources Statistics Canada Canada Year Book Ottawa various issues Canada 1971 Censwof Canada Population Urban Rural Distnmiddotbutions Ottawa
elasticities for the number of nonfarm population are greater (ranging from 74 to 220) than the elasticities for farm income (ranging from 28 to 70) indicating that the percentage change in farmland prices related to the percentage change in the number of nonfarm population is greater than that relative to the percentage change in farm income The rate of change in the number of nonfarm population in any time period however is rele~ively small in comparison to the rate of change that can Occur in farm income during specified periods During 1972-75 for example the rate of increase in nonfarm population was 05 percent in Saskatchewan while the rate of increase in farm income during that period was 40 percent Thus given the specified elasticities for the two variables for Saskatchewan farm income accounts for 94 percent of the increase in farmland prices while the number of nonfarm purchasers accounts for 6 percent of the increase assuming no further increases in farm income in the next 2 years In addition the total cumulative effect of the increases in net farm income on land prices would not occur until 2 years after the final increase The annual percentage increase in land prices (1972-75) are attributed to
29
Jbull I
Province Net farm income Nonfarm purchasers of land
Ontario 85 15Manitoba 86 14Saskatchewan 94Alberta 6
75 25Total Canada 77 23
Thus during 1972middot 75 net farm income had a greater impact on land prices than the number of nonfarm purchasers of land
Table 14 Net farm income deflated by CPI
Year Oodo IMOOb] Skhewo IAlb ~[~~ Total
Canada Million dollars
1960 1961 1962 1963 1964
586 609 673 593 550
216 105 322 215 306
667 199 914
1062 643
399 400 549 564 456
2396 1838 2990 2924 2427
1965 1966 1967 1968 1969
620 833 647 689 710
31~ 258 284 296 212
885 1009
620 802 714
558 653 494 615 459
2893 3416 2584 2999 2690
1970 ]971 1972 1973 1974
1975 1971j
681 545 703 947
1046
1074 813
146 254 266 494 405
464 359
370 710 590
1191 1357
1616 1423
379 410 520 886 941
960 722
2156 2405 2662 4339 4568
4886 4040
CONCLUSIONS
Although potential for major losses in Canadian agricultural production exists particularly in Ontario this docs not necessarily mean that this land will be lost to production Measurable losses due to urban pressures appear to be small losses in the urban fringe may be larger but cannot be pinpointed If current rates of changtmiddot do not ac-dclatc precipitously pOFulation pressures
30
probably will not be a major factor affecting Canadas competitive position in world wheat trade Evidence indicates that Canada does have the capability to increase wheat production under current cropping patterns to 32 million tons The continued attrition of farmland in Ontario however could be reflected in increased US exports of those products formerly produced in Ontario such as fruit
The rapid increase in farmland prices per se may not necessarily mean that agriculture is facing difficulty in competing with urban development for use of the land Evidence indicates that high product prices are capitalized into land accounting for its increase in price The changes in tenure patterns that have occurred between the 1971 and 1976 Census of Agriculture may also be a reflection of increased returns from agriculture as farmers move to increase their land base quickly by renting in order to take advantage of high productprices
Land use-programs such as the one implemented by the British Columbia Land Commission Act apparently can stop the reallocation of agricultural land to urban uses If the general economic environment is not conducive to the allocation of agricultural land to production however maintaining that land for future agricultural use may require a substantial social investment
REFERENCES
(1) Alberta Department of Energy and Natural Resources The Agricultural and Recreational Land Ownership Act Explanatory bulletin undated
(2)
Foreign Ownership of Land Administration Unpublished data
(3) Alberta Land Use Forum Report and Recommendatio7lS Jan 1976
(4) Beaubien Charles and Ruth Tabacnik
People and Agricultural Land Science Council of Canada Ottawa June 1977
(5) Boylen Diana M
Rural Land Tenure Alberta Land Use Forum Ttchnical ReportNo 6B 1975
(6) British Columbia Government of Land Commission Act
(7) Brown Jacob
Our Home and Native Land Extent and Implications of Foreign Land Ownership The IlgrgISt Vol 711 winter 1978
31
~
l 11 l
(8) Canada Grains Council
Statistical Handbook Various issues
(9) Davianlt R
Selected Agricultural Statistics for Canada Agriculture CanadaOttawa 1977
(10) Environment Canada Lands Directorate
Land Capabilz~y for Agriculture Canada Land Inventory Prelim inary Report Apr 1976
(II) Esau Alvin A J
Land Ownership Rights Law and Land an Overview Alberta Land Use Forum Summary Report 9 Edmonton 1974
(12) FederalProvincial Committee on Foreign Ownership of Land Report to the First Minirters Conference Canadian Intergovernmental Conference Secretariat Aug 1974
(13) Gale John E
What Makes Farm Real Estate Prices Agricultural Finance Review Vol 24 June 1963
(14) G(no BarbaraJ and Larry M
Food Production in the Canadian Environment Science Council ofCanada Ottawa Dec 1976
(15) Gierman D M
Rural and Urban Land Converslon Occasional paper no 16 Fisheries and Environment Canada Ottawa Sept 1977
(16) Hudson S C
A Review of Farm Income Stabilization in British Columbia A Report to the Minister of Agriculture Oct ]977
(17) Jean Clancy V
Land Use Income Assurance Linked in British ColumbiaForeign Agriculture March 22 1976
(18) Manitoba Governmltgtnt of
Agricultural Lands Protection Act Winnipeg
(19) Manitoba Agricuitur Lands Protection Board Unpublished material Winnipeg
(20) Manning E W and S Eddy
The Agricultural Land Reserves of British Columbta an Impact Analysis Fisheries and Environment Canada forthcoming publication
32
(21) Manning E W and J D McCuaig Agricultural Land and Urban Centres an Overview of the Signifimiddot cance of Urban Centres to Canadas Quality Agricultural Land Fisheries and Environment Canada Lands Directorate July 1977
(22) Ontario Ministry of Agriculture and Food Green Paper on Planning for Agriculture Food Land Guidelines Ontario 1977
(23) _____
A Strategy for Ortario Farmland March 1976
(24) Ontario Ministry of Housing A Guide to the Planning Act Ontario
(2gt Parlby G B The Family Farm i71 Alberta its Origins Development Future Alberta Land Use Forum Summary Report 1 Edmonton 1974
(26) Rees W E The Canadian Land Inventory in Perspective Fisheries and Envimiddot ronment Canada Ottawa March 1977
(27) Saskatchewan Government of Farm Own~~rs7ttp -Jt~~-middotRgina
(28) Saskatchewan Farm Ownership Board Unpublished data Saskatoon
(29) _____
First Annual Report Saskatoon 1975
(30) Saskatchewan Land Bank Commission Annual Reports Various issues Regina
(31) ____
Saskatchewan Land Bank Regulatiolls Regina June 1978
(32) Saskatchewan Land Use Policy Committee Land Use In Saskatchewan Agricultural Land Fact Sheet No7 Regina
(33) Shields J A and W S Ferguson Land Resources Production Possibilities and Limitations for Crop Production in tht Prairie Provinces Oz1seed and Pulse Crops in Western Canada Westtrn Cooperativts Ftrtilizers Limited Calgary 1975
33
bull
(34) Shields J A and J L Nowland
Additional Landfor Crop Production Canada Proceedings of the 30th Annual Meeting of the Soil Conservation Society of America San Antonio Aug 1975
(35) Statistics Canada Canada Year Book Ottawa various issues
(36) _____
Census of Agriculture Ottawa various years
(37) _____ loy
Census of Population and Urban Rural Distribution Ottawa
various years
(38) _____
Net Farm Income Ottawa various issues
(39) _____
Quarterly Bulletin of Agricultural Statistics Ottawa various issues
(40) US Department of State Various reports from US Embassy Ottawa
(41) Ward Neville E
Land Use Programs in Canada British Columbia Fisheries and Environment Canada Ottawa July 1976
(42) _____
Land Use Programs in Canada Ontario Fisheries and Environshyment Canada Ottawa September 1977
US GOVERNMENi PRINTING OFFICE 19790_ 630-3902563 REGION 31
34

- - - -
~~~-_~4+- __A~~~~~~~~~
t1
I11
Tabl~ 1-Pot~ntial agricultural land and land in falms 1976 ~middotmiddotmiddot
POIentili~ aJPicultural bnd Land in fanDI 1976 ArQ Prime
IITotalbnd Other landProvince covered b asricultunl ArablearQ Marwinall in tbe CLI Total
tbe CU land land anble land arQI arQ in Improyed Unimprovedcbl c1-sI-t cl-s 5-6 ftfarmland iarmbnd farmland i
1000 hectares t INewfoundland~ 37048
Prince Edward Island - - - - - 30 10 20-vshy 563 563 0 452 76 34 21~ 194 84Nova Scotia 5296 5296~ - 0 1573 I96 3627 400 148 253New Brunswick 7145 7145 0 3346 1712 2087 402 172Quebec 135677 50221 20
231 4795 1670 23756 3654 2245 1409Ontario 89118 27530 2157 9909 I3056 14565 5967 4333Manitoba 163454849 19277 163- 7524 4323 7430 7611 5182 2429 ~
Saskatchewan 57026 34455 I1000 20075 11442 2938 26433Alberta 64438 41894 787 18896 7537 ti 20019 15034 12840 2004G 11791British Columbia 93052 8249 fr- - - - - 2352 736 1615 fJYukon 53183 - - - g
Northwest Territories 324634 - - - shy shy
~I - - shy ffCanadll 922030 172381 4125 H67695 37410 67276 67167 43707 23401 Fl- == not available
I ti
Yukon and Northwest Territories are not covered by the CLI
middotIncludes c1aS$ 7 land organic soils and unclassified land in the CLI area which comprises urban areas Provincial parks national parks and forest reserves
Sources Envilment Canada Lands Directorate Land Capability for Agriculture Canada Land In~gtentoy Prtliminary Rtort April 1976 and Statistics Canacia Cmsus of AgncultuTt 1976 t
H t~P
~t fiJ
~~o~~-----~ccmiddote==~~~
i
The 1976 (ensus of agriculture indicates Ihat 67 million heclans were used for fanns Twomiddotthirds of this amount wen improvld land consisling of 39 million hlctans of crops and summer fallow and 5 million Il(ctares of improved paSIUil Unimproved land consists of 4 million h~ctares of woodshyland and 19 million hectares of brush grazing land marsh or slough (tablc I)
A comparison of census farm area with the quantily of potential agriculshytural land lOvlred by thl eLI indicates that lhe amount of improved and unimpmvld land in farms is about equal to lhe amount of land in the firsl four eLi c1as~cs Most of Canadas be51 agricultural land is already in farms An addiliond 38 million heltares of agricultural land could be incoTporalld illlO farms if all six CLI classes are considc~red
Although most class 1-4 land is in usc lhere is evidence that not all is used fOT crop production Arla in crop and summer fallow combined amounts to 39 million hectares or about 58 percem of land dass(s 1-4
Ontario Manitoba Saskatchewan and Allcrta arc major crop producing Provinces which aCCOUnt for 78 percent of Canadian farm cash receipts What if all aailabl(~ class 1-4 land in these Provinces were allocated to crop production It is assumed that changcs in hc economic environment necesshysary for thl allocation of this land to crop production would occur and that prcsent t(chnology and cropping patterns would be maintained on the (xpilnded area It is also assumed [as in Shields and Ferguson (J)] that production on thc expanded area would reflect a high level of management skill and would therefore provide an estimate of the lands maximum producshytive capacity Sine( the percentage of production of various crops on each class of land is not known it is necessary to convert the total quaiility of land in class($ 1-4 to a class I equivalent (33)
If yields for class I land in the Prairie Provinces arc rated as the high(sl possiblc then classes 2 3 and 4 are 85 70 and 50 percent as productive respectively as class I land (33) For the rest of Canada classes 23 and 4 are 80 64 and 50 percent as productive as class I land (34) The class I equiva lent of the four classes is determined by multiplying the area of each class by its respective performance index Thus the total quantity of class) -4 land in Saskatchewan for example which is 20 million hectares is productively the equivalent of 145 million he(tares of class) land Estimated potential yields for various crops on class I land were applied to the class 1 equivalent totals to deriv( potential production if all class 1-4 land were used (33)
The greatest potential for crop expansion exists in Ontario where produc tion could more than double Currently land used for farms in Ontario is (quivalent to about 60 percent of class 1-4 land for the Province Ontario with a much milder climate than the Prairie Provinces has the greatest number of frost-free days Also since the majority of class I land is located in Ontario the Provinces productive potential is high in terms of yields and range of crops (see tables 2-5)
Potential for increases in crop production arc also quite high in Alberta Although production of wheat oats barley rye flaxseed and rapeseed could more than double (table 5) climatic factors limit the range of producshytion to small grains oilseeds and forage Saskatchwan aCCOUnts for about two-thirds of Canadian wheat production and has the lowest potential for crop expansion of the four Provinces Production of wheat oats and barley
4
--
---
f bull~~tlt~bullbull ~ ~
11
H wj ~f iq
Table 2 - Potential crop production on class 1-4 land Ontario --~ --~~-- -- -~
Crop -Area gtYield Average Class I
gt
- shy~ gt
~- _-POenrial yield --Production ~uivalent Production on on class I
ale~1000 class J Potential productionMeric tons ~uivalent area
hectares I 000 metn-c ~uivalent area increa~ per hectare 1000
--- tons Metne tOilSWheat hectares 1000 metne - 213 per hectare~ Oats 289 616 tons PercentIb8
-~ Barley 202 443 536148 380
Rye 265 391 2374~ 392 34223 285 Com 181 308 133742 432635 252
t1 fame hay 516 48 13313277 3781096 240 1318 3-17 331
~odder com 565 1816192 851 otatoes 2845 2279 112169872 75018 2-12 )ther crops 2149 721 17093
387 4200747 176 37 302823000 207 1555 1110Total 3415 187 -= not applicable 7100
-1976 census area Source Stadstics Canada Censw ofAgneulture 1976 ----~----~
1967middot76 average Source Canada Grains Council Statistkal Iandbook arious issues --~-
1976 census area times 1967middot76 average yield
cropping pallern00 d H Id ~ h p~ d I d 50 ~h d~ =pttdy ppobullbullgtlt]Ilbullbull bullbull 1gt =ltdog lt0 h 76
Society of America August 1975 San Antonio Texas=bullbull) A Shld d 1 L N_Id AddoJ Lafmiddotmiddot Cp bullbull Cdbullbull p~ M h 1 mg h Soil C~~~Class I equivalent area times potential yield on class I equialent area
-~--1)
I Table 3 - Potential crop production on class 1middot4 land Manitoba ii
-------- --~-----~---~-----------r- -----____~____ I Class Itl Crop Area Average Potential yieldYieldl Production onl production equivalent -on class I Potential productionclass Ii areamiddot equivalent area increaseequivalent areaf 1000K Metric tons 1000 metric 1000hectares Metric tons per hectare 1000 metric 1 tons hectares per hectare PercenttonsU Wheat 1541 173 2666)ats 1685494 290176 887-1~ ~arley 666 869 540 320 83
202 17281345gt1ilced grains 728 380 99 202 2766141 106~ tye
70 77 32037- iI 142 24653 74luckwheat 18 40 250--~~J 81 15 100 87~orn 20 1007 341 2024 33-arne hay 567 8 380- H 410 302325 25en odder corn 620 67013 1592 4154i 207 79laxseed 212 14 224067 314142 52unflowel 20 232 15089 34818 145 apeseed 22 U)O93 101 2294 22[ustard reed 7 102 15088 1536 63ther crops 8 12084 - - 10 67Immel fallow 91926 shy- - 1 nTO - --
Total 4755 5200
- not applicable
1976 census area Source Statistics Canada Census ojAgriculture 1976 rt
1967middot76 average Source Canada Grains Council Statistical Handbook various issues 1976 census area times 17middot76 average yield
Manitoba class 1middot4 land times the performance index of I bull8570 and 50 for each class respectively proportionately allocated to crops according to the 1976cropping pattern
Source J A Shields and J L Nowland Additional LandJor Crop Production Canada Proceedings of the 30th annual meeting of the Soil Conservation Society of America August 1975 San Antonio Texas Class 1 equivalent area times potential yield on class 1 equivalent area
1-t-Z~rLmiddot~middot~Js~-14~~~~ ~ _i)ok-
CJ- _bullbull MJgt-Mr~ltYlsc~tgtt7~~~bullr-~~~~
11
I t1 vi
11 Table 4-Potential crop production on class 1-4 land Saskatchewan l~1
Areal Average Class 1 ~Crop t
Yield Potential yield Production onproduction equivalent on class 1 I class 1 Potential production Narea~ equivalent area1000 equivalent area increaseMetric tons 1000 metric hectares 1000per hectare Metric tons tons 1000 metric hectaresWheat per hectare7159 tons PercentI J Oats 161 11526 I637 5843 ~181 290Barley 1153 16945 [1201 520 47208 320 11 Mixed grains 2498 980 1664
48 44199 380Rye 96 3724 ~ 110 39 49123 320Tame hay 135 125 II871 90 30~ ~ 336 250 Fodder com 2927 2257112 746 67 - -I 670 ~ J Flaxseed 15 476483 2 6387 2240 ~-~- Sunflower 72 452 68 200 f72 150Rapeseed I 102292 100 2 100 42 M
Mustard seed 292 219 238 100 ~ 96 150Other crops 18 357165 16 22- 120Summer fallow - 197177 134 6-- 585~ shy~I shy- - ITotal shy17766 - ~~ - - 14500
- = not applicable - - i-1976 census area Source Statistics Canada Census ofAgriculture 1976 M
~ 1967middot76 average Source Canada Grains Council Statistical Handbook various issues 1976 census area times 1967middot76 average yield tj
~ 1976 cropping patternSaskatchewan class 1middot4 land times the performance index of I 85 70 and 50 for each class respectively Proportionately allocated to crops according to the M
m Source J A Shields and J L Nowland Addz~ional Landfor Crop Production Canada Proceedings of the 30th annual meeting of the Soil Conservation Society of America August 1975 San Antonio Texas Class I equivalent area times potential yield on class 1 equivalent area
f ~ ~
B ~---- ~
---- --~--- I-~-~~
~
Table 5 - Potential -rop production on class 1-4 land Alberta
Crop Average Class I Potential yield Production ltIn ~~Area Yield equivalent on class 1 Potential production production class 1 area equivalent area equivalent area increaseI
i
1000 Metric tons 1 000 metric 1000 Metric tons 1000 metrichectares per hectare tons hectares per hectare tons Percent ----rshy Whelt2t 2243 180~ 4087 2852- Oats 290 8271 105724 199 1441 920A-- 320Barley 29442276 216 lOt4916 2894 380~- Mixed grains 108 10997 124222 240 137 320Rye 438 8373 150 110
Tame hay 1541 365 93 250 233 1125625 1959 67000 Flaxseed 30 92 13125 133 t
28 ~ Rapeseed 299 94
38 150 57 104 281 380 150Mustard seed 9 570 103 ~89 8 11 120Other crops 311 13 63- - 396Summer fallow - shy2611 - shy- 3320 - - -
Total 10225 shy - 13000 - - -- = not applicable
1976 census area Source Statistics Canada Census of Agriculture 1976 1967 -76 average Source Canada Grains Council Statistical Handbook various issues t1976 census area times 1967middot76 average yield ii
tltAlberta class 1middot4 land times the performance index of 1 85 70 and 50 for each class respectively proportionately allocated to crops according to the 1976 Ii
cropping pattern i
Source J A Shields and J L Nowland A dditional Land for Crop Production Canada Proceedings of the 30th annual mel mg of the Soil Conservation Society of America August 1975 San Antonio Texas
1 [~middotClass 1 equivalent area times potential yield on class 1 equivalent area
~
-- qJ ~middot1
T
middot-~~~~W~~~~~scrr~~~l1l~~~~~~~-C~Jr~middota~middotE~x~rjc~r~i~L~~-middot~ n- J -) -~ ~ gt~~J ~A i u~
for example could increase only by about half indicating that a large Proportion of the available agricultural land in the Province is already beingused for crops (table 4)
If all class 1-4 land were allocated to crop production under existing cropping patterns total Canadian wheat production could expand to 32 million tons (a 92-percent increase over the 196970 to 197879 lOyear average production level) oat production could increase to 77 million tons or 78 percen~ and barley to 188 million tons or 63 percent These rates could change if cropping patterns are altered In addition a change in technology resulting in a decline in the use of summer fallow iTt the Prairie Provinces for example would mean a much larger increase in wheat production (33)
LAND USE PROGRAMS
Five Provinces-Manitoba Saskatchewan Alberta British Columbia and Ontario-have developed agricultural land use and tenure programs The issues that these programs deal with are interrelated and complex Land tenure programs concern owner versus tenant farming and family versus corporation farming These programs seek to maintain the family farm in a rural social infrastructure and perpetuate owner-operated rather than tenant-operated farming
Land use programs deal with the allocation of land between compe~ing uses urban versus agricultural Land use priorities are largely determined by a combination of the economic resource base and the philosophical oriemtation of the political party in power in the Province
Federal versus Provincial Jurisdiction
Both land use and tenure programs in Canada fall under the jurisdiction of the Provincial governments The Provinces maintain extensive powers for implementing land control measures under the British North America Act (BNA Act)2 As the Act is generally interpreted the Provinces are constitushytionally empowered to (1) develop laws concerning the purchase or exproprishyation of land for public recreational use (2) implement differential tax structures so that local landowners using land for specific purposes such as agriculture do not bear the burden of increased property assessments resulting from nonresident purchases (3) establish land use and zoning controls and (4) require disclosure of the place of residence citizenship and other pertishynent information concerning persons owning or purchasing land in the Province
It is unclear under the BNA Act whether Provinces were empowered to directly restrict land sales to aliens since exclusive legislative jurisdiction in
The BNA Act is a component of the Canadian constitution It created the Canadian Federal union and delineates the distrivution of powers between the Federal and Provincial Governshyments The Parliament of Canada was granted legislative jurisdiction over subjects of common interest while Provincial legislatures were given jurisdiciion over maccers of local interest
9
matters relating to aliens was relegated to the Federal Government Section 33 of the Canadian Citizenship Act granted aliens equai rights as citizens in acquiring property in Canada (12) Effective February 15 1977 however the Federal Government amended Section 33 of the act allowing a Province to pass regulations controlling land sales to aliens To date Alberta is the only Province which has done so under Section 33 of the Citizenship Act Under the amended law Provinces cannot restrict ownership in such a way that will conflict with Canadas international legal obligations discriminate between aliens on the basis of nationality restrict acquisitions by pemanent residents hind~r foreign states in acquiring property for diplomatic and consular purposes or restrict the acquiition of land approved nnder the ForeignInvestment Review Act (FIRA) (40)
Urbanization and Land Use
Canadas best agricultural land borders the countrys rapidly growing urban centers These urban centers figure significantly in determining land use Cleared farmland is preferred for urban building for example because development costs are relatively cheap (4)
Urbanization influences agricultural land use (1) directly through the actual incorporation of former agricultural land into expanding urban centers and (2) indirectly through changes in the economic environment of urban fringe areas which result in a transition from agricultural to urbanshyoriented land uses Urban commutersheds and their concomitant highways housing developments and recreational facilities for example exert influ ence on land use patterns some distance from the boundaries of the urban center The growing demand for land puts pressure on land prices to reflect urban values instead of the value derived from agricultural capability When the return from other uses exceeds that derived from farming the agriculshytural use of the land is no longer considered justified on economic grounds and the land is allocated temporarily or permanently to alternate uses This phenomenon often means abandoned farms land left idle under speculation or serious financial difficulties for those who continue to farm (21)
Areas vith moderate climate and level terrain conducive to both agriculture and human habitation are limited They are located in a long narrow strip along the U_S-Canadian border with particularly heavy concentrations along the lower Great Lakes and the St Lawrence River in Ontario and Quebec Provinces and along the coast and intermontane valleys of British Columbia This congruity in area for agriculture and population results in a direct competition for use of land much of which is classified as Canadas best for agricultural production This competition is perceived to be affecting the allocation of agricultural land to nonagricultural uses British Columbia and Ontario have developed agricultural land use programs to deal with these issues
Under the FIRA the Faelgn Investment Review Agency established Dec 12 1973 assesses any benefit accruing to Canada when non-Canadians acquire control of Canadian business enterprises or establish new businesses in Canada The agency is responsible to the Minister of Industry Tr2de and Commerce Some land acquisitions would come under FIRA review if they involved a business with gross assets of at least Sl50000 or gross annual revenue of S3 million
10
l
I
I British Columbia
The British Columbia agricultural land use program implemented by the Land Commission Act was one of the first comprehensive attempts on the part of a Province to redirect the process of agricultural land allocation to nonagricultural uses British Columbia consists of a series of north-south mountain ranges with 90 percent of the land mountainous and nonarable Agriculture is limitd to the narrow fertile valleys between the mountains The af~roclimatic characteristics of the valleys however are conducive to producing such spedalty crops as soft fruits grapes and tobacco (20) Becallse crops are produced in the intermontane valleys to which access is restricted by mountains or sea British Columbia farms are relatively small highly specialized and faced with major transportation constraints (16) The average farm size is 126 hectares compared to an average of 201 hectares for total Canada and 374 hectares for Saskatchewan Rapid population growth has led to competition for use of the same topographically limited land this competition has resulted in land prices rising higher than is warranted by the lands agricultural productive potential (16)
The Provincial Government became increasingly concerned about the Provinces ability to produce food on a very narrow land resource base that was being affected by urban development during the early seventies British Columbia is highly dependent on imported food to meet local demand The Government recognizing the Provinces high dependency on outside supply became more sensitive to keeping future land use options open It soon sought a way to plan urban land uses in a more orderly way while preserving remainshying farmland (41)
In December 1972 the Provincial Government placed a moratorium on all future use of certain agricultural land for purposes other than farming Two Orders-In-Council one in December 1972 and one in January 1973 proshyhibited changes in use of land over 081 hectare classified as farmland for taxation zoned for agriculture or designated as having CLI capability of 1-4 (20) Land did nut have to be in actual agricultural production to be affected by the moratorium only to fit into one of the categories (41) Bill 42 the Provincial Land Commission Act as introduced in February 1973 aimed to preserve agriculturallrlrd for farm use and establish and maintain the family farm bull Farm use was defined as the occupation or use of agricultural land for genuine farm purposes as well as certain other uses compatible with the preservation of land for farm use (26)
Section 2 of the Land Commission Act created the Land Commission a five-member board which would establish agricultural land reserves (ALR) in tle 28 regional districts of the Province The land reserves were to include all land capable of sustaining agriculture-that is all CLI class 1-4 land which had not been irreversibly developed If nonagricultural land was not immedishyately available for urban expansion land sufficient for 5 years of urban growth was excluded from the reserve Lower capability land was included in the reserve where there was evidence that it could be used successfully in conjunction with class 1-4 land Class 7 land was included in those instances
41n September 1977 the Land Commission Act was amended the Land Commission title changed to the Agricultural land Commission and its agricultural orientation strengthened
11
f ~
f J
~~r~~~~-~-~~1lmIf
gtI
where excluding it would result in nonagricultural use of an otherwise agricultural area (20) Land was also exempt from the reserve if it had been continuously used for a nonagricultural purpose 6 months prior to December 21 1972 (4)
The Provincial Government maintained review and veto power over the ALRs developed by the regional districts As the Provincially approved ALR plans came into effect they replaced the previous moratorium on land use (20) Land designated as part of an AJR cOllld not be used for any purpose other than farming except as permitted by the Land Commission Act or by order of the Commissiun (6) Proredures were established for appealing an ALR d1signation All ALR plans were completed by 1975 and as ofJanuary I 1978 the total area within the ALRs was 47 million hectares (20)
The Provincial Government recognized that by limiting the use of land to agricultural purposes it was denying farmers the opportunity to cash in on the increased value of their land (16) Land sales often served as a form of farm retirement pension On the other hand it was argued that farmers should make a living from farming not land speculation and that proceeds from that living should permit them to retire on a decent income (4)
The British Columbia Farm Income Assurance Program (FlAP) was introduced in November 1973 as a corollary to the Land Commission Act It provides income protection for farmers operating under an ALR plan with producers contributing one-third and the Provincial Government two-thirds of the premiums to an assurance fund Indemnities are paid out of the fund when market returns fall to a specified percentage of the basic cost of producshytion which is calculated to include labor management depreciation interest on investment and cash operating costs (16) The programs which are effective for 5 years have operated for fruit trees beef dairy hogs field tomatoes greenhouse vegetables table eggs broiler hatching eggs sheep blueberries and potatoes (J 7) As of September 1977 $89 million had been paid under the program to about 5000 producers representing average payments of $17800 per producer
The British Columbia land use program has been in effect long enough to make an assessment of its impact on land allocation to urban and agricultural uses Manning md Eddy (20) found that the British Columbia ALR did bring about a major shift in the location of new residential and commercial development The ALR also prevented much change in land use within its boundaries The rate of subdivision within the ALR for example was considerably lower than in undesignated areas
The designation of land as agricultural within an ALR plan however was not enough to assure that the land was actually used for agricultural producshytion In the short-term period of the study much middothe ALR land was left idle because returns from farming were insignificc 11 in elation to the costs of capital investment on land purchased at prices refle~i 1emand for the land for urban subdIljsions (20) If economic conditi - ~ not conducive to allocating land to agricultural production opportunity costs are incurred by keeping land in agriculture and even more by leaving it idle Both the British Columbia and Ontario agricultural land use programs incorporate farm income stabilization programs which in effect represent a sociol payment to farmers for not reallocating their land to alternative uses The British
12
l
Columbia program has apparently been successful in keeping land In agriculture although at a relatively high social cost
Ontario
Ontario is the home of a major part of the Canadian population and is the countrys industrial center It is similar to British Columbia in its agloclimatic capability of producing a wide range of specialty crops including corn soybeans soft fruit and tobacco which cannot be produced dsewhere domestically as efficiently Ontarilt however does not face the oilstraints imposed on British Columbia by its rugged topography Most of Canadas prime agricultural land is located in Ontario and transportation to markets and Sources of inputs is not a major cost of production as in British Columbia The Province does experience intense competition for use of prime agriculshytural land Speculation and nonfarm investment stemming from urbanshyoriented population pressures are identified as major factors driving up the price of land making it difficult for farmers in the Province (21)
rhe Ontario Government has not placed a moratorium on use of farmland as in British Columbia (42) Like the latter however one of the motives for Ontarios developing a land use program to preserve agricultural land was to reduce future dependence on other nations for those commodities which can be produced within the Province (22)
Ontario agricultural land use programs were developed on the premise that (1) land use will be determined by the operation of the market place to the greatest extent possible (2) that tradeoffs will be made between economic growth and desired land use patterns (3) that land use programs be conshyducted and enforced at the local municipal level and (4) that the Provincial Planning Act would be the main vehicle used to achieve ProvinLial land usepolicy objectives
Under the Provincial Planning ACl a designated planning area (which may be a single municipality groups of municipalities or a region) may draw up an official land use plan a statement of the development policies of the region It may include a map and text showing land use allocations The plan by itself does not indicate how any piece of property may be used Zoning and other bylaws however which state lpecifically what mayor may not be done on individual parcels of property must conform to an Official Plan The Province maintains ultimate review and veto authority over the regionalOfficial Plans (24)
An Official Plan is expected to remain flexible and is therefore subject to review and OImendment An amendment may represent an actual change in policy or a refinement of existing policy In e former instance the Official Plan would have to be changed before zonirigbylaws could be implemented to permit the new use In the latter instance the change would merely be added to the plan (24)
The Ontario Planning Act administered by the Ontario Ministry of Housing was originally devised to solve urban problems The Ontario Ministry of Agriculture however provides agricultural expertise as part of the development plan review process Although Official Plans have not been developed for all regions the ultimate goal is to have all settled areas of theProvince under a plan
13
The Ontario Ministry of Agriculture has been working to develop a more comprehensive agricultural land use program and guidelines under which agricultural considerations can be incorporated into local plans under the Planning Act The Ministry released a policy statement (21) in March 1976 specifying the governments commitment to preserve better agricultural land and to maintain the economic feasibility of using such land for agricultural purposes (42) These policy objectives could be achieved through Provincial commodity stabilization programs production expansion programs agricuhural economics research and development of a market value tax assessment to relieve the burden of real estate taxes on farmland
The preservation of better agricultural land would also be achieved through programs to encourage municipal developm~nt on poorer soils and to channel recreational and industrial development to lands less suited for agriculture The O~Hario Ministry of Agriculture is also committed to developing guidelines that apply agricultural interests to Official Regional Plans (21)
The guidelines presented in 1977 (22) specify that the CLI could be used to identify prime agricultural land Once the land capabilities are identitled the allocation of land among land uses should be evaluated This distribution of land should reflect the priority of agriculture however if agricultural capabilities exist If land is designated as agricultural it should be incorposhyrated into the Official Plan of the region and its supporting land use map High capability lands should be given the greatest protection and uses compatible to its long-term retention for agriculture should be specified Once agricultural land is incorporated into the Official Plan it can be used only for agricultural or agriculturally compatible purposes The agricultural use spedfication can be changed only if the Official Plan is amended Thus it is the ease or difficulty with which the Official Plan can be altered which detennines whether or not land remains agricultural
LAND TENURE PROGRAMS
Land tenure is an issue closely related to land use because land use combines human and land resource inputs The owner most frequently detershymines how the land will be utilized If ownership of a certain quality land is restricted to farmers the land will likely be used for agricultural production
Ownership Control
The owner-operated family farm is a concept traditional to North Amershyican agriculture Although the feudal land system did exist in Quebec during 1626-1854 immigrants left Europe for Canada to get away from the restricshytive feudal land tenure system A land system allowing maximum individual control evolved in Canada as a result (11)
Canadian settlement policies established the owner-operated family farm as the predominant form of agricultural production unit (25) Technological changes in agriculture resulted in an increase in the scale of farming and a shift from single proprietorship to partnerships or family corporations ~ These
Family corporations are farm corporatiuns in which the immediate family holds a majority of the shares resides on the farm and provides most of the labor
]4
changes have caused Concern about the economic survival of family farms their ability to compete with commercial corporations or communes and the effect of their decline on the rural community (3)
Boylan argues that there are three traditional forms of tenancy full owner part owner and tenant (5) The full owner has the most security and freedom for decisionmaking of the three tenure forms Full ownership facilitates the adoption of improved farming practices and effective longshyrange farm plans necessary for efficient usc of farm resources
Part owners and tenants rent or work on shares for others This type of tenure involves a lease in which the landlord conveys rights of use and possession of a given property for a deiiniw period of time in return for payme1t Rental contracts are based on Custom and tend to be fairly rigid Insecurity in rental tenure which results in the movement of operators from farm to farm often affects the efficiency of farm resource use Rental tenants typically do not make the long-term decisions necessary for continued effishycient agriculture such as those decisions relating to soil maintenance Consequently rental tenancy conflicts with social goals concerning the long-term existence of agriculture (5)
When nonresidents foreigners or commercial corporations own the land they often act as absentee landlords renting the land to farmers Foreign nonresident and commercial corporate ownership of agricultural land has thus been a focus of land tenure programs in Canada Foreign investors and commercial corporations with access to capital not available to Canadian family farmers are investing in land as a hedge against inflation Since they can use their capital resources to buy land at prices unrelated to the return from agricultural production they are perceived to be driving up the price of agricultural land (7) Family farmers with a smaller capital base thus find it increasingly difficult to compete for land resources needed for efficient agriculture Or to transfer land to the next generation of young farmers Sas katchewan Manitoba and Alberta hav( devdoped legislation to control foreign nonresident and commercial corporation ownership of land
Saskatchewan
The Saskatchewan Farm Ownership Act of 1974 as amended was developed on the premise that Provincial residents who were involved in day-to-day agricultural operations and who spend a major part of their time and agricultural income in the Province should control agricultural resources In addition they should be protected to some extent from capital resources accumulated in other industries or countries (29)
Under the Farm Ownership Act implemented by the Farm Ownership Board nonresidents and nonagricultural corporations7 are prohibited from owning more t~m 65 hectares or a quarter section Nonresidents need not dispose ofand held prior to 1974 or of holdings acquired between March 31
A resident is defined 15 one who lives in Saskatchewan for 18~ days or more a year or within 20 miles of the Saskatchewan border This includes US citizens who may own land on both sides of the border
An agricultural corporation is defined as a corporation primarily engaged in farming where at lea~t 60 percent of both the voting and nonvoting stock is owned by resident farmers (27)
1974 and September 15 1977 if the assessed value of the holdings for taxation is not greater than $15000 (27)
A nonresident holding land in excess of the amount stipulated in the Act has 5 years from the date of becoming a nonresident to dispose of the excess land unless he or she is a former farmer8 in which case the land may continue to be held regardless of residence status Former farmers may also transfer their land to direct relatives -- spouse child grandchild brother sister nephew niece or spouse thereof regardless of their residence status (27) Nonrsidents intending to become a resident within 3 years may with the permission of the Farm Ownership Board acquire more than 65 hectares during the 3-year period (27)
Nonagricultural corporations with holdings in excess of 65 hectares prior to March 31 1974 must dispose of the excess land by January 1 1994 and submit a land holding disclosure statement to the Farm Ownership Board
once a year (27) The Act is enforced by the Farm Ownership Board which may conduct
investigations into land ownership Anyone who does not comply with or impedes an investigation is subject to a maximum fine of $1000 Anyone found guilty of contravening the Act is liable for a $10000 fine a 6-month imprisonment or both A corporation violating the law IS subject to a maximum fine of $100000 every corporation officer involved is liable for a maximum fine of SI0000 a 6-month imprisonment or both The Board may also order nonresidents or nonagricultural corporations to divest of any land over that amount permitted (27)
A computer land registry system based on a survey of all rural municipalshyities providing information on 5000 nonresidents and 1000 corporations is used to enforce the Act The survey forms the basis of a continuing registry used to monitor land transfers (29) Legislation is being formulated requir ing residence to be declared as part of a land transfer
Manitoba Under the Manitoba Agricultural Lands Protection Act of June 1977 as
amended and administered by the Agricultural Lands Protection Board nonresidents9 may own no more than 8 hectares of land A nonresident can own land in excess of 8 hectares if it was owned prior to April 1 1977 or if right to the title for the land arose prior to that date (18)
If a corporation becomes a nonresident through the sale of shares or if a nonresident corporation acquires land in excess of 8 hectares through a legal settlement it has 2 years to dispose of the excess land The Board may take legal action to dispose of land acquired by a nonresident in excess of the amount stipulated if the nonresident has not done so within 2 years of
notification (J8) Investigations may be conducted to implement the Act Any person who
does not supply information requested is liable for a maximum fine of $500
A former farmer is defined as someone who at some time in the past lived in Saskatchewan and farmed the land for years
A Canadian resident is defined as a Canadian citizen or landed immigrant actually living in Canada or a corporation the majority of whose issued voting and nonvoting shares is owned by Canadian citizens permanently residing in Canada
16
Any individual or corporation contravening the law is liable for a maximum fine of $15000 In addition any corporaton officer responsible for contrashyvention of the law is liable for a maximum fine of $15000 Enforcement is ensured through Sworn declarations on citizenship attached to the land transfer (8)
Alberta
1 Foreigq ownership of land in Alberta is controlled by the Foreign Ownershyship of Land (temporary) Regulations established by an Order-in-Council under Section 33 of the Citizlnship Act on April 26 1977 These temporary regulations will eventually be supplanted by the Foreign Ownership of Land Regulations passed under the dual authorily of the Agricultural and Recreashytional Land Ownership Act and Section 33 of the Citizenship Act 10 (J)
Hnder the regulations ineligible persons-non-Canadians and temporary reSIdents-and corporations with 50 percent or more of their shares or memberships held by ineligible pernons cannot own more than 8 hecares of controlled land Controlled lapd is defined as any land oUfside the boundaries of a city town new inwn Village or summcmiddot village Controlled land however may be acquired by a foreign state for diplomatic or counsul purshyposes The area limitation does not apply to controlled land transferred through inheritance There are no restrictions on urban property (1)
Enforcement of the regulation is ensured by sworn declaration attached to land transfers and by investigative procedures carried out by the Foreign Ownership of Land Administration with use of information supplied by Land Titles Branch (1) Contravention of the law is subject to a maximum fine of $10000 imprisonment of up to 1 year or both Land that is acquired in contravention of the law may be sold by judicial sale Proceeds from the sale are used to cover sale expenses and any remaining funds up to the amount originally paid for the land are returned to the individual Any proceeds exceeding the amount originally paid for the land are put into the General Revenue Fund of Alberta l)
Transfer of Ownership
The transfer of agricultural land from One generation to the next is an integral part of maintaining the owner-operated family farm ensuring that future farmers are available to utilize the land preserved for agriculture (32) A start in farming however requires substantial capital resources As land prices continue to increase the need for capital for young farmers entering the industry becomes increasingly acute
Sallkatchewan
The Saskatchewan Land Bank established in 1972 by the Land Bank Act and administered by the Land Bank Commission was developed to alleviate some of the problems associated with the generational transfer of land Its objectives were to develop a viable agricultural industry in Saskatchewan and
IOAs of OCllb~r 1978 Bill 40 was not yet in effecl Regulations under Bill 40 however will not differ in intem fTOm the temporary regulations but will be more detailed
17
provide for a transfer of farms from generation to generation rather than have family farms absorbed by large farm units The Land Commission a government agency purchases land thereby absorbing the capital costs associated with land transfer It then rents the land to applicant farmers The land bank program provides continuous sales opportunities to Saskatchewan farmers and enables individuals to begin farming independently of substan tial fa~i1y assistance It also encourages the perpetuation of viable family farm units through the transfer of land to direct descendants (30)
Although the land bank program involves the transfer of land through rental tenancy efforts have been made to eliminate this type of transfers detrimental effects on efficient resource utilization Land Bank leases for example are long term and the Commission reimburses the lessee for capital improvements made during tenure which (it is expected) would provide the security necessary to make long term investment decisions to use resources efficiently
Under the program the Land Bank Commission may purchase land from anyone wishing to sell In instances where the Commission must allocate available funds among several offers for sale it will purchase by order of priority from farmers who (1) want to retire and transfer their land to a direct descendant (2) are selIing land that can be used to establish a viable farm unit (3) have large tracts of land on which two or more operators can be supported (4) have palcels of land constituting full units or (5) have no other sale alternative (3l)
The Commission purchases land at market value This is determined through an appraisal process in which the productive value of the cuhivated portion of the sale property is correlated with the productive value and sale price of cultivated properties of similar soil quality in the samt area The productive value is determined through lax assessment data Thus the Commission price is essentially determined by the relationship between prices of recent land sales in the area and the assessed value of the land for taxation purposes A similar process is used to determine the market value of grazing land Assessments are also made of the value of buildings and other improve ments on the property (31)
Land purchastd by the Commission is allocated to lessees on the basis of a point competitj~e system if there is more than one applicant for a given piece of land Applicants are scored on their income potential skill age vendors preference and potential disruption of existing farming enterprises The applicant must declare an intention to make farming the principal occupa tion and be of legal age a resident at the time of leasing and during tenure and a Canadian citizen or immigrant The applicants and spouses combined average annual income for the preceding 3 years must not exceed an amount annually determined by the Commission II The applicants and spouses net worth may not exceed $21000 in 1979 Applicants gain or lose points if their projected net income projected land base in work units or age is outnide the optimal range established by the Commission Points are gained for educa tion experience and for an indication from the vendor that the applicant is the preferred recipient of the land Points are lost for the average distance in
JJBa~d on (h~ composit ind~x of wag~ for Saska(ch~wan in 1977178 this amount was 520000 in 1979
18
II
miles ~-(iat the piece of land applied for is from other land units the applicant is farming (JJ)
Applicants scoring highest arc then intervilwld 10 assess their motivation management ability and other characteristic all of which arc also numershyically scored The applicant with the highest cumulative point score unless otherwise determined by the Commission is awarded the lease (31)
The llase remains in effect until the lessee reaches the age of 65 or dies The lessee may stipulate in writing if the least is to be passed on 10 a direct dlscendant After the age of 65 short-term leases may be granltd under certain circumstances
Since June 1 1978 rent is based on the production value of the land whierl is calculated from th( prices of oilseetis wheat and barley and thtlong-term yield of equal quality land in th area Prior to that time rent was based on a percentage of the lands market value The lessee is responsible for the payment of taxes (J])
Lessees have the option to purchase land after leasing from tht Commission for 5 years The land is sold to lessees at its market value at the time of sale Llssees purchasing land are entiLied to an earned homestead quarter refund made by the Commission on the purchase price of a quarter ~ection of land If the lessee lives on the rented land the inhabited quarter section is the section on which the refund is paid If the lessee does not live on the rented land a quarter section is designated as the humestead quarter on which the refund is paid The refund is 20 percent of the price paid by the purchaser for the qultrter section to a maximum of $5000 paid over a period of 5 years following the land transfer In order to receive the refund the purchaser must be actively engaged in farming and remain a bull esident of Saskatchewan during the 5 years or the balance Q1f the refund is forfeited (J1)
Buildings and improvements on the property are sold under a long-term agreement to the lessee When the lease expires the Commission purchases tht lessees earned equity based on the market value of the improvements thus ensuring that lessees receive the benefits of their investment decisions This combined with the homestead refund means that the lessee builds equity while renting from the Commission (31)
Effects of the Land Tenure Programs
During 1972-77 the Land Bank Commission acquired 354000 hectares of land for a total cost of S8l million This land as of December 31 1977 was being leased to 1912 ksse(s through 2009 leases (30)
In Saskatchewan nonresidents purchased a total of 59877 hectares in 1976 compared to 56769 hectares in 1977 (28)
Compiled data on foreign land transactions in Manitoba is unavailable (19)
In Alberta the amount of land purchases by non-Canadians and foreign corporations during 1976-77 as monitored under the Foreign Ownership of Land Regulations declined 60 percent DuringJanuarY-August 1978 foreign purchases were running 89 percent behind purchases for the same period in 1977 In 977 foreign purchases accounted for 2 percent of total area of rural sales compared to 5 percent of total rural sailS in 1976 (2)
19
LAND USE AND TENURE IN PERSPECTIVE
The dominant themes that emerge from the hind use and tenure programs are that Canadian farmland prices have been increasing and that these increases affect land allocation to agriculture and land tenure patterrs In order to fully assess these themes it is necessary to know (1) how much agricuturalland is actually being lost due to nonagricultural use (in this case urbanhiation) (2) what changes have occurred in land tenure patterns and (3) what factors influence farmland prices in Canada
Loss of Agricultural Land Through Urbanization
D M Gierman (15) has determined that during 1966-71 12801 hectares of class 1-4 agricultural land were irretrievably ca~yerted to urban use annually in Canada The highest rates of conversion Occurred in Ontario and Alberta where an average of 6199 and 2046 hectares respectively of class 1-4 agricultural land were annually converted (table 6) Over 80 percent of the land converted was formerly classified class 1-4 for agriculture The converted land however represents less than 1 percent of total class 1-4 landin those two Provinces
The annual loss of production due to the permanent reallocation of land to urban uses can be estimated by converting the amount of class 1-4 agriculshytural land annually incorporated into cities to a class 1 equivalent proporshytionately allocating the class 1 equivalent land to crops according to the 1976 cropping pattern and multiplying the area allocated to each crop by the potential yield for that crop on class 1 equivalent land (tables 7-10) Accordshying to these calculations losses of potential production due to the direct incorporation of land into cities in the short term (1 year) anc n the long run (20 years) assuming constant 1966-71 rates are relatively small in the three Prairie Provinces Loss of potential production due to land use changes in Ontario however is fairly substantial particularly in the long term DecHnes in production of the major crops in Ontario by 1996 could range from almost 4 percent of average production of tame hay to over 6 percent of rye (tables 7-10)
Manning and MCCuaig (21) quantified the amount of CLI class 1-4 agricultural land likely to be affected by urbanization by looking at CLI class 1-4 land within a 50-mile radius of 19 of Canadas major Census Metropolitan a Areas Fifty-four percent of Canadas class 1 land and 21 percent of Canadas class 1-4 land is within 50 miles of the specified areas Approxishymately 45 million hectares of class 1-4 land is located within the fringe areas of urban centers in Ontario Applying the same methodology used to detershymine the productive capacity of agricultural land directly incorporated into urban centers it is evident that the productive capacity of the urban fringe area in Ontario (table 7) exceeds present production levels for the Province
Census Metropolitan Areas as desirnated by Statistics Canada are urban areas with Over 100000 inhabitants The 19 areas are Edmonton Calgary Saskatoon Regina Winnipeg Thunder Bay Sudbury Windsor Toronto Kitchner St Catherines Hamilton LondonOttawa Montreal Quebec Chicoutini St John and Halifax
20
-------___I~
Table 6-Average annual conversion rates of rural land of vanous
agricultural capabilities to urban uses 1966-71
Province Total class
5-6
HectaresOntario 2496 1789 1503 41I 6199Manitoba 293 219 512538 409 5 952Saskatchewan 28 60 88127 63 29 219 8Alberta 4 12564 747 471 264 2046 165 186Other Provinces 35176 1285 827 1197 3385 498Total Canada 3136 4486 70 3263273 1906 12801 992 539 1531 - = not applicable
Source D M Gierman Rural to Urban Land Conversion Fisheries and Environment Canada Lands Directorate Occasional Paper No 16 Sept 1977
and is over 50 percent of the total production potential on all CLI class 1-4 land in the Province (table 2)
This means that a substantial quantity of agricultural land in Ontario is subject to change from agricultural to urban-oriented use The exact proporshytion of land that may actually change however cannot be determined from available information Although the potential for increased crop production in Ontario is substantial due to the combination of good land and favorable climate this potential is affected by competition between agriculture and urban development
The situation in the Prairie Provinces is considerably different The amount of land located in the fringe area of cities in Manitoba Saskatcheshywan and Alberta equals 14 30 and 27 miI1ion hectares respectively (21) The productive potential of this land is equal to about one-fourth to one-half of present production in Manitoba one-fourth in Saskatchewan and one-third in Alberta
Land Tenure
Total Canadian farm area has been declining-down about 14 million hectares or 2 percent during 1961-76 A 25-percent decrease in eastern Canada was partially offset by a 5-percent increase in western Canada Farmland declined about 13 million hectares in Ontario and increased 11 million hectares in Alberta Thus the amount of farmland is declining in eastern Canada which has the best agroc~imatic potential for food producshytion and increases in farmland are occurring in western Canada which has considerably less agroclimatic potential Land which can grow fruit vegeshytables and corn in eastern Canada is being replaced by land suitable for barley and hay in western Canada
Average farm size in Canada continued to increase during 1971-76 from 187 hectares to 201 hectares The largest increases in size occurred in Manitoba and Saskatchewan where farms increased 9 percent from 220 to 240 hectares and 342 to 374 hectares respectively
During 1971-76 the total number of farms declined about 18 percent (table 11) The percentage of farms fully operator owned in Canada declined
21
I
I
- - - -
- ~~ - ~~~
~
~ A_shy
f
Table 7-Ontario Estimated loss in crop production on class I equivalent land due to conversion to urban uses ~ rIClass 1 Productive capacity of converted agricultural land
~uivalent area ~ I yearCrop in cropo 20 yean Productive capacity of urban fringe ff
Iconverted annually Production on1Percentage of Production on IPercentage ofconvertwto urban wes average Class 1 ~uivalnt
areal converted average I Production on 1Percentage of H area in urbanproduction l area urban fringe 1~productionmiddot averagefringe ~Hectares areaSMetric tons Percent productionMetnc tons fiPercentWheat 1000 hectares 318 1000 metric tons 1704 Percent ~ Oats 028 t280 34080 55 ~958 229Barley 25 1227221 19160 50 199955 202Rye 24 691 ~ 34 19100 18249Com 947 31 2580 61
159 687 115 H129 8059 25 ~~Tame hay 1635 25 161180 49 95 22612263 682Fodder com 20518 245260 39 5804 11721756 1177Potatoes 22 882827 435120 14344Nl 810Other 21 373
Nl 1114 16200 41 15666 159- 19- 570- - 147Total 5094
802 - shy- -3668 - = not applicable
Class I equivalent area in crops converted annually to urban USe times potential yield on class I equivalent land (from table 2)
(1976 ara ti~es 1967middot76 yield) times 100 (Annual production on converted area)
Annual production on convened area times 20
(1976area times 1961middot76 yield) times 100 (Annual production on area converted oVer 20 years)
Area in urban fringe times potential yield on class I equivalent land (from table 2)
bull (1976 area ~imes 196776 v~eld) times 100 (Annual prodUcuon On urban fnnge area)
Sources D M Gierman Rural to Urban Land Conversion Fisheries and Environment Canada lands Directorate Occasional Paper No 16 September 1917 and E W Manning and j D McCuaig Agncultural Land and Urban Centres an Overview ofthe Significance ofUrban Centres to Canadas Quality Agricultural Land Fisheries and EnvironmentCanada lands Directorate july 1917
Table 8- Manitoba Estimated loss in crop production on class I equivalent land due to conversion to urban uses
CIa I Productive capacity of converted agricultural land equivalent area I year Productive capacity of urban fringeCrop 20 yranin crops
converted annually Production on Percentage of conv~rled CI I equivalentProduction on 1Percentage of
to urban uses average productiorn Percentage ofconverted averageareal production area in urban urban fringearca production averagefringe areaHeclares producrion1Melnc Ions Percenl Meine Ions Percent 1000 heclares Wheat 1000 melnc Ions 242 Percent702 ~~Oats 14040 05377 350246 03 1015 38Barley 4920104 57 113395 362~3 42Mixed grains 7900 59O 15232 578Rye 6
~ 640 45 16 43
15 51Buckwheat ~3 300 57 363 83 02 20 38Com 60 40I 44 ~ 4 27Tame hay 80 3389 2596 OS 8 33Fodder com 11920 51 2 45 ~2 129 864 3iFlaxSttd 900 43 - 33~ lt 50 3 67M Sunnower 1000 70 32 -shy Nl 3 3 02 48 72
Ra~d 60 33 51tJO 15 523 ~ 5~ Mustard seltd 460 49 28I 1
Other crops 15 I ~2 20 33 2
32 34 a--bullbullbull- 2 67Summer fallow 145 19
211 Total 746
~ 1083
- = not applicable
Class I equivalent area in crops converted annually to urban use times potential yield on class I equivalent land (from table 3)
(1976 area ti~es 1967middot76 yield) times 100 (Annual production on converted area)
Annual production on converted area times 20
(1976 area times 1967middot76 yield) 100 (Annual production on area converted over 20 years) times
Area in urban fringe times potential yield on class I equivalent Idnd (from table 3)
(1976 area ~imes 1967middot76 y~e1d) times 100 (Annual production on urban frmge area)
Sources D M Gierman RU1a110 Urban Land Conversion Fisheries and Environmem Canad Lands Directorate Oteasiona Paper No 16 September 1977 and E W Manning and J D McCuaig Agricullural Land and Urban Cenlres an Overview of Ihe Significance of Urban Cenlres 10 Canada S Qualily Agneullural Land Fisheries and EnvironmentCanada Lands Directorate July 1977
~
0
Table -Saltkatchewan timated I m nop pmduction on cia I luilent land due to conenio to uban u CI I n
Productive capacify of conerted agricuhural landequivalen areaCrop I year
20 yea in cropo
converted annually Productive capacity of urban fringeProduction on 1 Percentage of 10 urban ilia convrrtrd avrrage Productio on I Pecenage of
CI I equivllen area I production convltnrd avrragr Production on I ~
area in urban Percenage ofHectares arra Production urban fringe Meine Ions fringe avrrage Wheal Percent Meine Ions I aira l
67 Percent productionOars 194 JOoo heClares000Barley 6 19 3880 JOOO melne Ions
003 PercentII 00Rye 380 88442 I 00 03 2564
Tame hay 3 840 79 22 00 03 253
Rapeseed 8 54 60 148 22
~- 3 00 04 562Other crops 5 1080 14 22
~shy 4 00 04 35Nl 26Summer fallow 100 108 ~ ~ 67 -
03 72436 25 - 54
~ 39 12 Total area 167 887 - v_~middotmiddotshy bull- = not applicable - 2195
Class I equivalem area in crops converted annually to urban Use times potemial yielel on class I cquivalem land (from table 4) (1976 area ti~es 1967middot76 yield) times 100
(Annual produlttlon on converted area)
Annual production on convened area limes 20
(l976aa times 1967middot76 yield) times 100 (Annual production on area converted over 20 years) I
Area in urban fringe times potential yield on class I equivalem land (from table 4)
(1976 area ~imes 1967middot76 yeld) times 100 (Annual production on urban frmge area)
j D M G~bull tlt Ubo Lo Cmbull yh ~_ Co t n~ Ocroo P N p nood E W M
Canada Lands Directorate July 1977 J D Mabullbull _ Uoo C_ M C Qoooo1 Lo ood bullbullbull0 I ~ of U COO
I--------~~-==o~~~~~~~~
f shy
~~~tmiddotmiddot ~ -
~ Table lO-Alberta Estimated loss in crop production on class 1 equivalent land due to conversion to urban uses lt
I
CI I Productive capadly of coverred agriculrural land equivalent area
Crop I yenin cropo 20 yean Productive capacity of urban frin~ converled annually Production on JPercenta~ of
to urban IUeI onyerred ayeta~ Producrion on - Percenta~ of CI I equiyalentconverted avera~ Production onarea I production t I Percenta~ ofarea in urban arr~J production urban fringr
Hectares fringr averageMelnc Ions arealPercent Melnc Ions I produclionWheat Percent364 1000 hecla resOats 1056 003 JOOO melric Ions Percent118 21120Barley 378 05203 451370 7560 1308Mixed grains 1406 03 52 146 32
18 28120 467Rye 58 57 3202 45712 1160 1737Tame hay 30 03 48 3522250 600 70Flaxseed 1675 55 2903 155 33500 38Rapeseed 8 60 3503 31049 160 2077Mustard d 74 03 57 6 37NI I 1480 tJ1 Other crops I 01 53 9 326049 20 90Summer fallow - 2 32-- 424
25 2- - - 61 25
~ - -Total 1660 - ~- - not applicable 2055----- -
525
lt-Class I equivalent area in crops converted annualy 0 urban u limes potential yield on class I equivalent land (from table 5)
(1976 area ti~es 1967-76 yield) times 100 (Annual producuon on converted area)
-1
Annual production on convened area times 20
(1976 area times 1967-76 yield) 100 (Annual production On area convened over 20 years) Urnes bull
Area in urban fringe times potential yield on class I equivalent land (from table 5)
bull (1976 area ~imes 1967-76 veld) times 100 (Annual produclJon on urban frmge area) j
Sources D M Giennan Rural 10 Urban Land Conversion Fisheries and Environment Canada Lands Directorate Occasional Paper No 16 September 1977 and E W_ Manning and Canada Lands Directorate July 1977 J D McCuaig Agnculural Land and Urban Centres an Qnew of Ihe Significance of Urban Cenlregt 10 Canada Qualily AgrIcultural Land Fisheries and EnvironmentI
I ----~~~i~~
I
Table II - Number and proportion of census farms by tenure of operator 1971 and 1976
OwnerProince Part Owner1971 1 1976 1 1971 1 1976 1 1
1971 1 1976 1 1971 1 1976 Number Percentage of
total Number Percentage of Ontario 691162 total501165 i4Manitoba 66 1987721608 2171517238 2162 28Saskatchewan 58 1118441499 1073436612 54 32 36Alberta 53 3009737193 2739833584 3959 39Canada 59 21284251066 20206189063 3469 63 35---------------- 95862 93757 26 31Tenant
-I97I-=C-imi-J 1971 1 Total-shy
1976J J 1971 1 1976 Number Percentage of
Ontario total Number49113 4403 5Manitoba 62189 947221991 76983Saskatchewan 6 75374 349815568 29963Alberta 7 84225 769703520 69578Canada 7 619200 6270217298 573105 6 366128 300118
Source R Davianlt Selected Agricultural Statistics for Canada Agriculture Canada Ottawa1977
from 69 percent of the total number of farms in 1971 to 63 percent of the total in 1976 and the number of farms partly owned or fully rented by the operator increased from 26 to 31 percent and 5 to 6 percent of the total number of farms respectively The percentage of owner-operated farms in Alberta and Saskatchewan remained about the same during 1971-76 although the total number of owner-operated farms in Canada declined The largest decreases in the percentage of owner-operated farms oCcurred in Manitoba and Ontario where the percentage of owner-operated farms declined from 62 to 58 percent and 74 to 66 percent respectively during 1971-76 (table II)
Farmland Prices
Canadian farmland prices increased 121 percent in nominal terms during 1971-76 from an average of $24631 per hectare to an average of $54372 per hectare The largest increases in farmland price occurred in Ontario where farm prices increased 150 percent from an average of $80240 per hectare in 1971 to an average of $2007_01 in 1976 The smallest increases Occurred in Manitoba where farm price increased 94 percent from an average of $17865 per hectare in 1971 to $34638 in 1976
Price reflects the intersection of demand for and supply of land Thus the allocation of land between divergent uses relates to the cumulative effect of the demand for those uses upon its price Farmland price is affected by the interaction of farm and nonfarm demand Farm purchasers are defined as those individuals for whom the price of land is determined by past and expected returns from the land for agricultural production Nonfarm purshychasers are individuals for whom the price of land is determined by past and
26
expected returns from the land for other than agricultural purposes (13) Foreign purchasers of land are considered nonfarm buyers when the price at which they are willing to buy land is determined by economic conditions in their domestic economy rather than returns from Canadian agriculture even if the land they purchase remains in agriculture through tenant farming
The determinants of farmland price relating to nonfarm demand include the presence of minerals for extraction forests population pressure on use of the land which is manifest in urbanization construction of transportation systems speculation and recreational or residential construction Those relating to farm demand for land include farm income pressures to enlarge farm holdings and advances in agricultur~1 technology (13)
Land prkes are an underlying focus of Canadian agricultural land programs particularly since the impact of nonagriculturally oriented demand on land prices influences the allocation of land away from agriculshyture and affects preferred land tenure patterns The land use and tenure programs therefore deal with the effects of urban-oriented and foreign or nonresident nonfarm purchasers on land prices use allocation and tenure ptterns
Since farmland prices are determined by a combination of farm and nonfarm demand the question arises as to their relative effects on Canadian farmland prices (table 12) The effects of farm and nonfarm demand on farmland prices were estimated by means of an econometric model Because Canadian programs focus on the effect of urban oriented nonfarm buyers on land price the number of urban and rural nonfarm residents in each of the Provinces (Ontario Manitoba Saskatchewan and Alberta) was used as a proxy for nonfarm demand (table 13) It was assumed that each additional urban and nonfarm rural resident represents potential demand for residences transportation or other nonagricultural uses Net farm income was used as a measurement of the effect of farm demand on land prices (table 14) It was assumed that the supply of land is constant and that the impact of a change in farm income on land prices is distributed over a 2-year period following the year of the change T~e analysis is for the period 1960-76
The following equation was used
Yil = a j + t3 iX 1iI-1 + YiX 1iI-2 + OiX2il + Ei
where Y farmland price in real terms = total Canada (C) Alberta (A) Manitoba (M) Ontario (0)
and Saskatchewan (S) X I net farm income in real terms
urban and nonfarm rural populationX2
The parameters of the above equation were estimated by ordinary least squares regression for each of the four Provinces and total Canada with the following results
ii DW CV
YC = 1
-20126 + 17024 XI CI-I (431)
+ 21009 XI CI-2 + 17765 X ZC1(477) (1067)
097 156 3
YA1 = -11673 + 05628 XI AI-I + 2174 XI AI-Z + 29117 X ZA1(210) (376) (080) 094 170 4
27
~ ~~ 1
l~
YM I = - 95S11 + 0917S XI M I_I + 12098 XI M 1-2 + 28765 X M 077 188 7(175) bull (l7S)middot (159)z 1
YObullI = -10214 + 45268 XI 01-1 + 30839 XI 01-2 + 17994 X 0 I z 096 207 6(395) (242) (754) bull
Y51 = -9501 + 11926 Xl 51-I + 16129X _ + 19218XI5I Z(351) bull (406) bull (507)ZS1 089 167 6
IIe elasticities of the two explanatory variables for each of the four Provinces and total Canada are as follows
Province XI XI Ontario 70 161Manitoba 29 117Saskatchewan 39 220Alberta 28 74Total Canada 44 135
Results of the analysis indicate that the two variables were significant and accOunted for most of the variation in land prices during 1960-76 The
Table 12 - Value of farmland deflated by CPI
Year c Ontario ManitobaI Saskatchewan Total Canada
Million dollars 1960 4172 1312 30481961 2748 148474415 1350 31021962 5238 1444
2177 1527438881963 3570 175725244 1546 43921964 5551 1735
3847 184604952 4240 19960
1965 5782 1967 56941966 6153 2100 4785 21858
62421967 6824 5109 234482250 66611968 7554 2305 5520 25II8
65541969 8398 5756 262272046 5539 5395 25466 1970 7667 2129 59671971 7718 2046
54II 2564057591972 5256 251817688 1952 54961973 8671 2076
5071 247045917 53141974 10173 267832387 6675 6152 30914
1975 II586 2456 78311976 12567 6780 345362666 8742 6950 37204 Sources Statistics Canada Quarterly Bulletin ofAgncultura Statistics Ottawa various issues
28
-----shy~
Table 13-Urban and rural nonfarm population 1960-76 1
OntarioYear Manitoba Saskatchewan Alb~~-Id~t-~-ana a
~ -~~ -bull----Thousands
1960 5590 739 ~~ 10201961 5730
610 15801 1962 5873
750 620 1046 16165760 6311963 6020 1072 16537771 1964 617]
1J41 1099 16917782 652 ] 126 17306 1965 6325 793 6631966 1154 177046479 803
10 1967 6654 818 675 1185 181016821968 6833 834
1230 18535 ]969 7018
689 1277 IS9S0 849 696 1325 19435 1970 7207 865 1971 7404
703 1376 19902880 7101972 7515 888 1427 20406
7131973 7627 1469 20712896 717 15111974 7742 904 720 21022
1555 21338 1975 7858 9]2 7241976 7985 1600 21658920 728 1648 21958
The data for intercensual years is determined from the average annual rate of increase in population extrapolated between the census years 1961 1966 1971 1976
Sources Statistics Canada Canada Year Book Ottawa various issues Canada 1971 Censwof Canada Population Urban Rural Distnmiddotbutions Ottawa
elasticities for the number of nonfarm population are greater (ranging from 74 to 220) than the elasticities for farm income (ranging from 28 to 70) indicating that the percentage change in farmland prices related to the percentage change in the number of nonfarm population is greater than that relative to the percentage change in farm income The rate of change in the number of nonfarm population in any time period however is rele~ively small in comparison to the rate of change that can Occur in farm income during specified periods During 1972-75 for example the rate of increase in nonfarm population was 05 percent in Saskatchewan while the rate of increase in farm income during that period was 40 percent Thus given the specified elasticities for the two variables for Saskatchewan farm income accounts for 94 percent of the increase in farmland prices while the number of nonfarm purchasers accounts for 6 percent of the increase assuming no further increases in farm income in the next 2 years In addition the total cumulative effect of the increases in net farm income on land prices would not occur until 2 years after the final increase The annual percentage increase in land prices (1972-75) are attributed to
29
Jbull I
Province Net farm income Nonfarm purchasers of land
Ontario 85 15Manitoba 86 14Saskatchewan 94Alberta 6
75 25Total Canada 77 23
Thus during 1972middot 75 net farm income had a greater impact on land prices than the number of nonfarm purchasers of land
Table 14 Net farm income deflated by CPI
Year Oodo IMOOb] Skhewo IAlb ~[~~ Total
Canada Million dollars
1960 1961 1962 1963 1964
586 609 673 593 550
216 105 322 215 306
667 199 914
1062 643
399 400 549 564 456
2396 1838 2990 2924 2427
1965 1966 1967 1968 1969
620 833 647 689 710
31~ 258 284 296 212
885 1009
620 802 714
558 653 494 615 459
2893 3416 2584 2999 2690
1970 ]971 1972 1973 1974
1975 1971j
681 545 703 947
1046
1074 813
146 254 266 494 405
464 359
370 710 590
1191 1357
1616 1423
379 410 520 886 941
960 722
2156 2405 2662 4339 4568
4886 4040
CONCLUSIONS
Although potential for major losses in Canadian agricultural production exists particularly in Ontario this docs not necessarily mean that this land will be lost to production Measurable losses due to urban pressures appear to be small losses in the urban fringe may be larger but cannot be pinpointed If current rates of changtmiddot do not ac-dclatc precipitously pOFulation pressures
30
probably will not be a major factor affecting Canadas competitive position in world wheat trade Evidence indicates that Canada does have the capability to increase wheat production under current cropping patterns to 32 million tons The continued attrition of farmland in Ontario however could be reflected in increased US exports of those products formerly produced in Ontario such as fruit
The rapid increase in farmland prices per se may not necessarily mean that agriculture is facing difficulty in competing with urban development for use of the land Evidence indicates that high product prices are capitalized into land accounting for its increase in price The changes in tenure patterns that have occurred between the 1971 and 1976 Census of Agriculture may also be a reflection of increased returns from agriculture as farmers move to increase their land base quickly by renting in order to take advantage of high productprices
Land use-programs such as the one implemented by the British Columbia Land Commission Act apparently can stop the reallocation of agricultural land to urban uses If the general economic environment is not conducive to the allocation of agricultural land to production however maintaining that land for future agricultural use may require a substantial social investment
REFERENCES
(1) Alberta Department of Energy and Natural Resources The Agricultural and Recreational Land Ownership Act Explanatory bulletin undated
(2)
Foreign Ownership of Land Administration Unpublished data
(3) Alberta Land Use Forum Report and Recommendatio7lS Jan 1976
(4) Beaubien Charles and Ruth Tabacnik
People and Agricultural Land Science Council of Canada Ottawa June 1977
(5) Boylen Diana M
Rural Land Tenure Alberta Land Use Forum Ttchnical ReportNo 6B 1975
(6) British Columbia Government of Land Commission Act
(7) Brown Jacob
Our Home and Native Land Extent and Implications of Foreign Land Ownership The IlgrgISt Vol 711 winter 1978
31
~
l 11 l
(8) Canada Grains Council
Statistical Handbook Various issues
(9) Davianlt R
Selected Agricultural Statistics for Canada Agriculture CanadaOttawa 1977
(10) Environment Canada Lands Directorate
Land Capabilz~y for Agriculture Canada Land Inventory Prelim inary Report Apr 1976
(II) Esau Alvin A J
Land Ownership Rights Law and Land an Overview Alberta Land Use Forum Summary Report 9 Edmonton 1974
(12) FederalProvincial Committee on Foreign Ownership of Land Report to the First Minirters Conference Canadian Intergovernmental Conference Secretariat Aug 1974
(13) Gale John E
What Makes Farm Real Estate Prices Agricultural Finance Review Vol 24 June 1963
(14) G(no BarbaraJ and Larry M
Food Production in the Canadian Environment Science Council ofCanada Ottawa Dec 1976
(15) Gierman D M
Rural and Urban Land Converslon Occasional paper no 16 Fisheries and Environment Canada Ottawa Sept 1977
(16) Hudson S C
A Review of Farm Income Stabilization in British Columbia A Report to the Minister of Agriculture Oct ]977
(17) Jean Clancy V
Land Use Income Assurance Linked in British ColumbiaForeign Agriculture March 22 1976
(18) Manitoba Governmltgtnt of
Agricultural Lands Protection Act Winnipeg
(19) Manitoba Agricuitur Lands Protection Board Unpublished material Winnipeg
(20) Manning E W and S Eddy
The Agricultural Land Reserves of British Columbta an Impact Analysis Fisheries and Environment Canada forthcoming publication
32
(21) Manning E W and J D McCuaig Agricultural Land and Urban Centres an Overview of the Signifimiddot cance of Urban Centres to Canadas Quality Agricultural Land Fisheries and Environment Canada Lands Directorate July 1977
(22) Ontario Ministry of Agriculture and Food Green Paper on Planning for Agriculture Food Land Guidelines Ontario 1977
(23) _____
A Strategy for Ortario Farmland March 1976
(24) Ontario Ministry of Housing A Guide to the Planning Act Ontario
(2gt Parlby G B The Family Farm i71 Alberta its Origins Development Future Alberta Land Use Forum Summary Report 1 Edmonton 1974
(26) Rees W E The Canadian Land Inventory in Perspective Fisheries and Envimiddot ronment Canada Ottawa March 1977
(27) Saskatchewan Government of Farm Own~~rs7ttp -Jt~~-middotRgina
(28) Saskatchewan Farm Ownership Board Unpublished data Saskatoon
(29) _____
First Annual Report Saskatoon 1975
(30) Saskatchewan Land Bank Commission Annual Reports Various issues Regina
(31) ____
Saskatchewan Land Bank Regulatiolls Regina June 1978
(32) Saskatchewan Land Use Policy Committee Land Use In Saskatchewan Agricultural Land Fact Sheet No7 Regina
(33) Shields J A and W S Ferguson Land Resources Production Possibilities and Limitations for Crop Production in tht Prairie Provinces Oz1seed and Pulse Crops in Western Canada Westtrn Cooperativts Ftrtilizers Limited Calgary 1975
33
bull
(34) Shields J A and J L Nowland
Additional Landfor Crop Production Canada Proceedings of the 30th Annual Meeting of the Soil Conservation Society of America San Antonio Aug 1975
(35) Statistics Canada Canada Year Book Ottawa various issues
(36) _____
Census of Agriculture Ottawa various years
(37) _____ loy
Census of Population and Urban Rural Distribution Ottawa
various years
(38) _____
Net Farm Income Ottawa various issues
(39) _____
Quarterly Bulletin of Agricultural Statistics Ottawa various issues
(40) US Department of State Various reports from US Embassy Ottawa
(41) Ward Neville E
Land Use Programs in Canada British Columbia Fisheries and Environment Canada Ottawa July 1976
(42) _____
Land Use Programs in Canada Ontario Fisheries and Environshyment Canada Ottawa September 1977
US GOVERNMENi PRINTING OFFICE 19790_ 630-3902563 REGION 31
34

i
The 1976 (ensus of agriculture indicates Ihat 67 million heclans were used for fanns Twomiddotthirds of this amount wen improvld land consisling of 39 million hlctans of crops and summer fallow and 5 million Il(ctares of improved paSIUil Unimproved land consists of 4 million h~ctares of woodshyland and 19 million hectares of brush grazing land marsh or slough (tablc I)
A comparison of census farm area with the quantily of potential agriculshytural land lOvlred by thl eLI indicates that lhe amount of improved and unimpmvld land in farms is about equal to lhe amount of land in the firsl four eLi c1as~cs Most of Canadas be51 agricultural land is already in farms An addiliond 38 million heltares of agricultural land could be incoTporalld illlO farms if all six CLI classes are considc~red
Although most class 1-4 land is in usc lhere is evidence that not all is used fOT crop production Arla in crop and summer fallow combined amounts to 39 million hectares or about 58 percem of land dass(s 1-4
Ontario Manitoba Saskatchewan and Allcrta arc major crop producing Provinces which aCCOUnt for 78 percent of Canadian farm cash receipts What if all aailabl(~ class 1-4 land in these Provinces were allocated to crop production It is assumed that changcs in hc economic environment necesshysary for thl allocation of this land to crop production would occur and that prcsent t(chnology and cropping patterns would be maintained on the (xpilnded area It is also assumed [as in Shields and Ferguson (J)] that production on thc expanded area would reflect a high level of management skill and would therefore provide an estimate of the lands maximum producshytive capacity Sine( the percentage of production of various crops on each class of land is not known it is necessary to convert the total quaiility of land in class($ 1-4 to a class I equivalent (33)
If yields for class I land in the Prairie Provinces arc rated as the high(sl possiblc then classes 2 3 and 4 are 85 70 and 50 percent as productive respectively as class I land (33) For the rest of Canada classes 23 and 4 are 80 64 and 50 percent as productive as class I land (34) The class I equiva lent of the four classes is determined by multiplying the area of each class by its respective performance index Thus the total quantity of class) -4 land in Saskatchewan for example which is 20 million hectares is productively the equivalent of 145 million he(tares of class) land Estimated potential yields for various crops on class I land were applied to the class 1 equivalent totals to deriv( potential production if all class 1-4 land were used (33)
The greatest potential for crop expansion exists in Ontario where produc tion could more than double Currently land used for farms in Ontario is (quivalent to about 60 percent of class 1-4 land for the Province Ontario with a much milder climate than the Prairie Provinces has the greatest number of frost-free days Also since the majority of class I land is located in Ontario the Provinces productive potential is high in terms of yields and range of crops (see tables 2-5)
Potential for increases in crop production arc also quite high in Alberta Although production of wheat oats barley rye flaxseed and rapeseed could more than double (table 5) climatic factors limit the range of producshytion to small grains oilseeds and forage Saskatchwan aCCOUnts for about two-thirds of Canadian wheat production and has the lowest potential for crop expansion of the four Provinces Production of wheat oats and barley
4
--
---
f bull~~tlt~bullbull ~ ~
11
H wj ~f iq
Table 2 - Potential crop production on class 1-4 land Ontario --~ --~~-- -- -~
Crop -Area gtYield Average Class I
gt
- shy~ gt
~- _-POenrial yield --Production ~uivalent Production on on class I
ale~1000 class J Potential productionMeric tons ~uivalent area
hectares I 000 metn-c ~uivalent area increa~ per hectare 1000
--- tons Metne tOilSWheat hectares 1000 metne - 213 per hectare~ Oats 289 616 tons PercentIb8
-~ Barley 202 443 536148 380
Rye 265 391 2374~ 392 34223 285 Com 181 308 133742 432635 252
t1 fame hay 516 48 13313277 3781096 240 1318 3-17 331
~odder com 565 1816192 851 otatoes 2845 2279 112169872 75018 2-12 )ther crops 2149 721 17093
387 4200747 176 37 302823000 207 1555 1110Total 3415 187 -= not applicable 7100
-1976 census area Source Stadstics Canada Censw ofAgneulture 1976 ----~----~
1967middot76 average Source Canada Grains Council Statistkal Iandbook arious issues --~-
1976 census area times 1967middot76 average yield
cropping pallern00 d H Id ~ h p~ d I d 50 ~h d~ =pttdy ppobullbullgtlt]Ilbullbull bullbull 1gt =ltdog lt0 h 76
Society of America August 1975 San Antonio Texas=bullbull) A Shld d 1 L N_Id AddoJ Lafmiddotmiddot Cp bullbull Cdbullbull p~ M h 1 mg h Soil C~~~Class I equivalent area times potential yield on class I equialent area
-~--1)
I Table 3 - Potential crop production on class 1middot4 land Manitoba ii
-------- --~-----~---~-----------r- -----____~____ I Class Itl Crop Area Average Potential yieldYieldl Production onl production equivalent -on class I Potential productionclass Ii areamiddot equivalent area increaseequivalent areaf 1000K Metric tons 1000 metric 1000hectares Metric tons per hectare 1000 metric 1 tons hectares per hectare PercenttonsU Wheat 1541 173 2666)ats 1685494 290176 887-1~ ~arley 666 869 540 320 83
202 17281345gt1ilced grains 728 380 99 202 2766141 106~ tye
70 77 32037- iI 142 24653 74luckwheat 18 40 250--~~J 81 15 100 87~orn 20 1007 341 2024 33-arne hay 567 8 380- H 410 302325 25en odder corn 620 67013 1592 4154i 207 79laxseed 212 14 224067 314142 52unflowel 20 232 15089 34818 145 apeseed 22 U)O93 101 2294 22[ustard reed 7 102 15088 1536 63ther crops 8 12084 - - 10 67Immel fallow 91926 shy- - 1 nTO - --
Total 4755 5200
- not applicable
1976 census area Source Statistics Canada Census ojAgriculture 1976 rt
1967middot76 average Source Canada Grains Council Statistical Handbook various issues 1976 census area times 17middot76 average yield
Manitoba class 1middot4 land times the performance index of I bull8570 and 50 for each class respectively proportionately allocated to crops according to the 1976cropping pattern
Source J A Shields and J L Nowland Additional LandJor Crop Production Canada Proceedings of the 30th annual meeting of the Soil Conservation Society of America August 1975 San Antonio Texas Class 1 equivalent area times potential yield on class 1 equivalent area
1-t-Z~rLmiddot~middot~Js~-14~~~~ ~ _i)ok-
CJ- _bullbull MJgt-Mr~ltYlsc~tgtt7~~~bullr-~~~~
11
I t1 vi
11 Table 4-Potential crop production on class 1-4 land Saskatchewan l~1
Areal Average Class 1 ~Crop t
Yield Potential yield Production onproduction equivalent on class 1 I class 1 Potential production Narea~ equivalent area1000 equivalent area increaseMetric tons 1000 metric hectares 1000per hectare Metric tons tons 1000 metric hectaresWheat per hectare7159 tons PercentI J Oats 161 11526 I637 5843 ~181 290Barley 1153 16945 [1201 520 47208 320 11 Mixed grains 2498 980 1664
48 44199 380Rye 96 3724 ~ 110 39 49123 320Tame hay 135 125 II871 90 30~ ~ 336 250 Fodder com 2927 2257112 746 67 - -I 670 ~ J Flaxseed 15 476483 2 6387 2240 ~-~- Sunflower 72 452 68 200 f72 150Rapeseed I 102292 100 2 100 42 M
Mustard seed 292 219 238 100 ~ 96 150Other crops 18 357165 16 22- 120Summer fallow - 197177 134 6-- 585~ shy~I shy- - ITotal shy17766 - ~~ - - 14500
- = not applicable - - i-1976 census area Source Statistics Canada Census ofAgriculture 1976 M
~ 1967middot76 average Source Canada Grains Council Statistical Handbook various issues 1976 census area times 1967middot76 average yield tj
~ 1976 cropping patternSaskatchewan class 1middot4 land times the performance index of I 85 70 and 50 for each class respectively Proportionately allocated to crops according to the M
m Source J A Shields and J L Nowland Addz~ional Landfor Crop Production Canada Proceedings of the 30th annual meeting of the Soil Conservation Society of America August 1975 San Antonio Texas Class I equivalent area times potential yield on class 1 equivalent area
f ~ ~
B ~---- ~
---- --~--- I-~-~~
~
Table 5 - Potential -rop production on class 1-4 land Alberta
Crop Average Class I Potential yield Production ltIn ~~Area Yield equivalent on class 1 Potential production production class 1 area equivalent area equivalent area increaseI
i
1000 Metric tons 1 000 metric 1000 Metric tons 1000 metrichectares per hectare tons hectares per hectare tons Percent ----rshy Whelt2t 2243 180~ 4087 2852- Oats 290 8271 105724 199 1441 920A-- 320Barley 29442276 216 lOt4916 2894 380~- Mixed grains 108 10997 124222 240 137 320Rye 438 8373 150 110
Tame hay 1541 365 93 250 233 1125625 1959 67000 Flaxseed 30 92 13125 133 t
28 ~ Rapeseed 299 94
38 150 57 104 281 380 150Mustard seed 9 570 103 ~89 8 11 120Other crops 311 13 63- - 396Summer fallow - shy2611 - shy- 3320 - - -
Total 10225 shy - 13000 - - -- = not applicable
1976 census area Source Statistics Canada Census of Agriculture 1976 1967 -76 average Source Canada Grains Council Statistical Handbook various issues t1976 census area times 1967middot76 average yield ii
tltAlberta class 1middot4 land times the performance index of 1 85 70 and 50 for each class respectively proportionately allocated to crops according to the 1976 Ii
cropping pattern i
Source J A Shields and J L Nowland A dditional Land for Crop Production Canada Proceedings of the 30th annual mel mg of the Soil Conservation Society of America August 1975 San Antonio Texas
1 [~middotClass 1 equivalent area times potential yield on class 1 equivalent area
~
-- qJ ~middot1
T
middot-~~~~W~~~~~scrr~~~l1l~~~~~~~-C~Jr~middota~middotE~x~rjc~r~i~L~~-middot~ n- J -) -~ ~ gt~~J ~A i u~
for example could increase only by about half indicating that a large Proportion of the available agricultural land in the Province is already beingused for crops (table 4)
If all class 1-4 land were allocated to crop production under existing cropping patterns total Canadian wheat production could expand to 32 million tons (a 92-percent increase over the 196970 to 197879 lOyear average production level) oat production could increase to 77 million tons or 78 percen~ and barley to 188 million tons or 63 percent These rates could change if cropping patterns are altered In addition a change in technology resulting in a decline in the use of summer fallow iTt the Prairie Provinces for example would mean a much larger increase in wheat production (33)
LAND USE PROGRAMS
Five Provinces-Manitoba Saskatchewan Alberta British Columbia and Ontario-have developed agricultural land use and tenure programs The issues that these programs deal with are interrelated and complex Land tenure programs concern owner versus tenant farming and family versus corporation farming These programs seek to maintain the family farm in a rural social infrastructure and perpetuate owner-operated rather than tenant-operated farming
Land use programs deal with the allocation of land between compe~ing uses urban versus agricultural Land use priorities are largely determined by a combination of the economic resource base and the philosophical oriemtation of the political party in power in the Province
Federal versus Provincial Jurisdiction
Both land use and tenure programs in Canada fall under the jurisdiction of the Provincial governments The Provinces maintain extensive powers for implementing land control measures under the British North America Act (BNA Act)2 As the Act is generally interpreted the Provinces are constitushytionally empowered to (1) develop laws concerning the purchase or exproprishyation of land for public recreational use (2) implement differential tax structures so that local landowners using land for specific purposes such as agriculture do not bear the burden of increased property assessments resulting from nonresident purchases (3) establish land use and zoning controls and (4) require disclosure of the place of residence citizenship and other pertishynent information concerning persons owning or purchasing land in the Province
It is unclear under the BNA Act whether Provinces were empowered to directly restrict land sales to aliens since exclusive legislative jurisdiction in
The BNA Act is a component of the Canadian constitution It created the Canadian Federal union and delineates the distrivution of powers between the Federal and Provincial Governshyments The Parliament of Canada was granted legislative jurisdiction over subjects of common interest while Provincial legislatures were given jurisdiciion over maccers of local interest
9
matters relating to aliens was relegated to the Federal Government Section 33 of the Canadian Citizenship Act granted aliens equai rights as citizens in acquiring property in Canada (12) Effective February 15 1977 however the Federal Government amended Section 33 of the act allowing a Province to pass regulations controlling land sales to aliens To date Alberta is the only Province which has done so under Section 33 of the Citizenship Act Under the amended law Provinces cannot restrict ownership in such a way that will conflict with Canadas international legal obligations discriminate between aliens on the basis of nationality restrict acquisitions by pemanent residents hind~r foreign states in acquiring property for diplomatic and consular purposes or restrict the acquiition of land approved nnder the ForeignInvestment Review Act (FIRA) (40)
Urbanization and Land Use
Canadas best agricultural land borders the countrys rapidly growing urban centers These urban centers figure significantly in determining land use Cleared farmland is preferred for urban building for example because development costs are relatively cheap (4)
Urbanization influences agricultural land use (1) directly through the actual incorporation of former agricultural land into expanding urban centers and (2) indirectly through changes in the economic environment of urban fringe areas which result in a transition from agricultural to urbanshyoriented land uses Urban commutersheds and their concomitant highways housing developments and recreational facilities for example exert influ ence on land use patterns some distance from the boundaries of the urban center The growing demand for land puts pressure on land prices to reflect urban values instead of the value derived from agricultural capability When the return from other uses exceeds that derived from farming the agriculshytural use of the land is no longer considered justified on economic grounds and the land is allocated temporarily or permanently to alternate uses This phenomenon often means abandoned farms land left idle under speculation or serious financial difficulties for those who continue to farm (21)
Areas vith moderate climate and level terrain conducive to both agriculture and human habitation are limited They are located in a long narrow strip along the U_S-Canadian border with particularly heavy concentrations along the lower Great Lakes and the St Lawrence River in Ontario and Quebec Provinces and along the coast and intermontane valleys of British Columbia This congruity in area for agriculture and population results in a direct competition for use of land much of which is classified as Canadas best for agricultural production This competition is perceived to be affecting the allocation of agricultural land to nonagricultural uses British Columbia and Ontario have developed agricultural land use programs to deal with these issues
Under the FIRA the Faelgn Investment Review Agency established Dec 12 1973 assesses any benefit accruing to Canada when non-Canadians acquire control of Canadian business enterprises or establish new businesses in Canada The agency is responsible to the Minister of Industry Tr2de and Commerce Some land acquisitions would come under FIRA review if they involved a business with gross assets of at least Sl50000 or gross annual revenue of S3 million
10
l
I
I British Columbia
The British Columbia agricultural land use program implemented by the Land Commission Act was one of the first comprehensive attempts on the part of a Province to redirect the process of agricultural land allocation to nonagricultural uses British Columbia consists of a series of north-south mountain ranges with 90 percent of the land mountainous and nonarable Agriculture is limitd to the narrow fertile valleys between the mountains The af~roclimatic characteristics of the valleys however are conducive to producing such spedalty crops as soft fruits grapes and tobacco (20) Becallse crops are produced in the intermontane valleys to which access is restricted by mountains or sea British Columbia farms are relatively small highly specialized and faced with major transportation constraints (16) The average farm size is 126 hectares compared to an average of 201 hectares for total Canada and 374 hectares for Saskatchewan Rapid population growth has led to competition for use of the same topographically limited land this competition has resulted in land prices rising higher than is warranted by the lands agricultural productive potential (16)
The Provincial Government became increasingly concerned about the Provinces ability to produce food on a very narrow land resource base that was being affected by urban development during the early seventies British Columbia is highly dependent on imported food to meet local demand The Government recognizing the Provinces high dependency on outside supply became more sensitive to keeping future land use options open It soon sought a way to plan urban land uses in a more orderly way while preserving remainshying farmland (41)
In December 1972 the Provincial Government placed a moratorium on all future use of certain agricultural land for purposes other than farming Two Orders-In-Council one in December 1972 and one in January 1973 proshyhibited changes in use of land over 081 hectare classified as farmland for taxation zoned for agriculture or designated as having CLI capability of 1-4 (20) Land did nut have to be in actual agricultural production to be affected by the moratorium only to fit into one of the categories (41) Bill 42 the Provincial Land Commission Act as introduced in February 1973 aimed to preserve agriculturallrlrd for farm use and establish and maintain the family farm bull Farm use was defined as the occupation or use of agricultural land for genuine farm purposes as well as certain other uses compatible with the preservation of land for farm use (26)
Section 2 of the Land Commission Act created the Land Commission a five-member board which would establish agricultural land reserves (ALR) in tle 28 regional districts of the Province The land reserves were to include all land capable of sustaining agriculture-that is all CLI class 1-4 land which had not been irreversibly developed If nonagricultural land was not immedishyately available for urban expansion land sufficient for 5 years of urban growth was excluded from the reserve Lower capability land was included in the reserve where there was evidence that it could be used successfully in conjunction with class 1-4 land Class 7 land was included in those instances
41n September 1977 the Land Commission Act was amended the Land Commission title changed to the Agricultural land Commission and its agricultural orientation strengthened
11
f ~
f J
~~r~~~~-~-~~1lmIf
gtI
where excluding it would result in nonagricultural use of an otherwise agricultural area (20) Land was also exempt from the reserve if it had been continuously used for a nonagricultural purpose 6 months prior to December 21 1972 (4)
The Provincial Government maintained review and veto power over the ALRs developed by the regional districts As the Provincially approved ALR plans came into effect they replaced the previous moratorium on land use (20) Land designated as part of an AJR cOllld not be used for any purpose other than farming except as permitted by the Land Commission Act or by order of the Commissiun (6) Proredures were established for appealing an ALR d1signation All ALR plans were completed by 1975 and as ofJanuary I 1978 the total area within the ALRs was 47 million hectares (20)
The Provincial Government recognized that by limiting the use of land to agricultural purposes it was denying farmers the opportunity to cash in on the increased value of their land (16) Land sales often served as a form of farm retirement pension On the other hand it was argued that farmers should make a living from farming not land speculation and that proceeds from that living should permit them to retire on a decent income (4)
The British Columbia Farm Income Assurance Program (FlAP) was introduced in November 1973 as a corollary to the Land Commission Act It provides income protection for farmers operating under an ALR plan with producers contributing one-third and the Provincial Government two-thirds of the premiums to an assurance fund Indemnities are paid out of the fund when market returns fall to a specified percentage of the basic cost of producshytion which is calculated to include labor management depreciation interest on investment and cash operating costs (16) The programs which are effective for 5 years have operated for fruit trees beef dairy hogs field tomatoes greenhouse vegetables table eggs broiler hatching eggs sheep blueberries and potatoes (J 7) As of September 1977 $89 million had been paid under the program to about 5000 producers representing average payments of $17800 per producer
The British Columbia land use program has been in effect long enough to make an assessment of its impact on land allocation to urban and agricultural uses Manning md Eddy (20) found that the British Columbia ALR did bring about a major shift in the location of new residential and commercial development The ALR also prevented much change in land use within its boundaries The rate of subdivision within the ALR for example was considerably lower than in undesignated areas
The designation of land as agricultural within an ALR plan however was not enough to assure that the land was actually used for agricultural producshytion In the short-term period of the study much middothe ALR land was left idle because returns from farming were insignificc 11 in elation to the costs of capital investment on land purchased at prices refle~i 1emand for the land for urban subdIljsions (20) If economic conditi - ~ not conducive to allocating land to agricultural production opportunity costs are incurred by keeping land in agriculture and even more by leaving it idle Both the British Columbia and Ontario agricultural land use programs incorporate farm income stabilization programs which in effect represent a sociol payment to farmers for not reallocating their land to alternative uses The British
12
l
Columbia program has apparently been successful in keeping land In agriculture although at a relatively high social cost
Ontario
Ontario is the home of a major part of the Canadian population and is the countrys industrial center It is similar to British Columbia in its agloclimatic capability of producing a wide range of specialty crops including corn soybeans soft fruit and tobacco which cannot be produced dsewhere domestically as efficiently Ontarilt however does not face the oilstraints imposed on British Columbia by its rugged topography Most of Canadas prime agricultural land is located in Ontario and transportation to markets and Sources of inputs is not a major cost of production as in British Columbia The Province does experience intense competition for use of prime agriculshytural land Speculation and nonfarm investment stemming from urbanshyoriented population pressures are identified as major factors driving up the price of land making it difficult for farmers in the Province (21)
rhe Ontario Government has not placed a moratorium on use of farmland as in British Columbia (42) Like the latter however one of the motives for Ontarios developing a land use program to preserve agricultural land was to reduce future dependence on other nations for those commodities which can be produced within the Province (22)
Ontario agricultural land use programs were developed on the premise that (1) land use will be determined by the operation of the market place to the greatest extent possible (2) that tradeoffs will be made between economic growth and desired land use patterns (3) that land use programs be conshyducted and enforced at the local municipal level and (4) that the Provincial Planning Act would be the main vehicle used to achieve ProvinLial land usepolicy objectives
Under the Provincial Planning ACl a designated planning area (which may be a single municipality groups of municipalities or a region) may draw up an official land use plan a statement of the development policies of the region It may include a map and text showing land use allocations The plan by itself does not indicate how any piece of property may be used Zoning and other bylaws however which state lpecifically what mayor may not be done on individual parcels of property must conform to an Official Plan The Province maintains ultimate review and veto authority over the regionalOfficial Plans (24)
An Official Plan is expected to remain flexible and is therefore subject to review and OImendment An amendment may represent an actual change in policy or a refinement of existing policy In e former instance the Official Plan would have to be changed before zonirigbylaws could be implemented to permit the new use In the latter instance the change would merely be added to the plan (24)
The Ontario Planning Act administered by the Ontario Ministry of Housing was originally devised to solve urban problems The Ontario Ministry of Agriculture however provides agricultural expertise as part of the development plan review process Although Official Plans have not been developed for all regions the ultimate goal is to have all settled areas of theProvince under a plan
13
The Ontario Ministry of Agriculture has been working to develop a more comprehensive agricultural land use program and guidelines under which agricultural considerations can be incorporated into local plans under the Planning Act The Ministry released a policy statement (21) in March 1976 specifying the governments commitment to preserve better agricultural land and to maintain the economic feasibility of using such land for agricultural purposes (42) These policy objectives could be achieved through Provincial commodity stabilization programs production expansion programs agricuhural economics research and development of a market value tax assessment to relieve the burden of real estate taxes on farmland
The preservation of better agricultural land would also be achieved through programs to encourage municipal developm~nt on poorer soils and to channel recreational and industrial development to lands less suited for agriculture The O~Hario Ministry of Agriculture is also committed to developing guidelines that apply agricultural interests to Official Regional Plans (21)
The guidelines presented in 1977 (22) specify that the CLI could be used to identify prime agricultural land Once the land capabilities are identitled the allocation of land among land uses should be evaluated This distribution of land should reflect the priority of agriculture however if agricultural capabilities exist If land is designated as agricultural it should be incorposhyrated into the Official Plan of the region and its supporting land use map High capability lands should be given the greatest protection and uses compatible to its long-term retention for agriculture should be specified Once agricultural land is incorporated into the Official Plan it can be used only for agricultural or agriculturally compatible purposes The agricultural use spedfication can be changed only if the Official Plan is amended Thus it is the ease or difficulty with which the Official Plan can be altered which detennines whether or not land remains agricultural
LAND TENURE PROGRAMS
Land tenure is an issue closely related to land use because land use combines human and land resource inputs The owner most frequently detershymines how the land will be utilized If ownership of a certain quality land is restricted to farmers the land will likely be used for agricultural production
Ownership Control
The owner-operated family farm is a concept traditional to North Amershyican agriculture Although the feudal land system did exist in Quebec during 1626-1854 immigrants left Europe for Canada to get away from the restricshytive feudal land tenure system A land system allowing maximum individual control evolved in Canada as a result (11)
Canadian settlement policies established the owner-operated family farm as the predominant form of agricultural production unit (25) Technological changes in agriculture resulted in an increase in the scale of farming and a shift from single proprietorship to partnerships or family corporations ~ These
Family corporations are farm corporatiuns in which the immediate family holds a majority of the shares resides on the farm and provides most of the labor
]4
changes have caused Concern about the economic survival of family farms their ability to compete with commercial corporations or communes and the effect of their decline on the rural community (3)
Boylan argues that there are three traditional forms of tenancy full owner part owner and tenant (5) The full owner has the most security and freedom for decisionmaking of the three tenure forms Full ownership facilitates the adoption of improved farming practices and effective longshyrange farm plans necessary for efficient usc of farm resources
Part owners and tenants rent or work on shares for others This type of tenure involves a lease in which the landlord conveys rights of use and possession of a given property for a deiiniw period of time in return for payme1t Rental contracts are based on Custom and tend to be fairly rigid Insecurity in rental tenure which results in the movement of operators from farm to farm often affects the efficiency of farm resource use Rental tenants typically do not make the long-term decisions necessary for continued effishycient agriculture such as those decisions relating to soil maintenance Consequently rental tenancy conflicts with social goals concerning the long-term existence of agriculture (5)
When nonresidents foreigners or commercial corporations own the land they often act as absentee landlords renting the land to farmers Foreign nonresident and commercial corporate ownership of agricultural land has thus been a focus of land tenure programs in Canada Foreign investors and commercial corporations with access to capital not available to Canadian family farmers are investing in land as a hedge against inflation Since they can use their capital resources to buy land at prices unrelated to the return from agricultural production they are perceived to be driving up the price of agricultural land (7) Family farmers with a smaller capital base thus find it increasingly difficult to compete for land resources needed for efficient agriculture Or to transfer land to the next generation of young farmers Sas katchewan Manitoba and Alberta hav( devdoped legislation to control foreign nonresident and commercial corporation ownership of land
Saskatchewan
The Saskatchewan Farm Ownership Act of 1974 as amended was developed on the premise that Provincial residents who were involved in day-to-day agricultural operations and who spend a major part of their time and agricultural income in the Province should control agricultural resources In addition they should be protected to some extent from capital resources accumulated in other industries or countries (29)
Under the Farm Ownership Act implemented by the Farm Ownership Board nonresidents and nonagricultural corporations7 are prohibited from owning more t~m 65 hectares or a quarter section Nonresidents need not dispose ofand held prior to 1974 or of holdings acquired between March 31
A resident is defined 15 one who lives in Saskatchewan for 18~ days or more a year or within 20 miles of the Saskatchewan border This includes US citizens who may own land on both sides of the border
An agricultural corporation is defined as a corporation primarily engaged in farming where at lea~t 60 percent of both the voting and nonvoting stock is owned by resident farmers (27)
1974 and September 15 1977 if the assessed value of the holdings for taxation is not greater than $15000 (27)
A nonresident holding land in excess of the amount stipulated in the Act has 5 years from the date of becoming a nonresident to dispose of the excess land unless he or she is a former farmer8 in which case the land may continue to be held regardless of residence status Former farmers may also transfer their land to direct relatives -- spouse child grandchild brother sister nephew niece or spouse thereof regardless of their residence status (27) Nonrsidents intending to become a resident within 3 years may with the permission of the Farm Ownership Board acquire more than 65 hectares during the 3-year period (27)
Nonagricultural corporations with holdings in excess of 65 hectares prior to March 31 1974 must dispose of the excess land by January 1 1994 and submit a land holding disclosure statement to the Farm Ownership Board
once a year (27) The Act is enforced by the Farm Ownership Board which may conduct
investigations into land ownership Anyone who does not comply with or impedes an investigation is subject to a maximum fine of $1000 Anyone found guilty of contravening the Act is liable for a $10000 fine a 6-month imprisonment or both A corporation violating the law IS subject to a maximum fine of $100000 every corporation officer involved is liable for a maximum fine of SI0000 a 6-month imprisonment or both The Board may also order nonresidents or nonagricultural corporations to divest of any land over that amount permitted (27)
A computer land registry system based on a survey of all rural municipalshyities providing information on 5000 nonresidents and 1000 corporations is used to enforce the Act The survey forms the basis of a continuing registry used to monitor land transfers (29) Legislation is being formulated requir ing residence to be declared as part of a land transfer
Manitoba Under the Manitoba Agricultural Lands Protection Act of June 1977 as
amended and administered by the Agricultural Lands Protection Board nonresidents9 may own no more than 8 hectares of land A nonresident can own land in excess of 8 hectares if it was owned prior to April 1 1977 or if right to the title for the land arose prior to that date (18)
If a corporation becomes a nonresident through the sale of shares or if a nonresident corporation acquires land in excess of 8 hectares through a legal settlement it has 2 years to dispose of the excess land The Board may take legal action to dispose of land acquired by a nonresident in excess of the amount stipulated if the nonresident has not done so within 2 years of
notification (J8) Investigations may be conducted to implement the Act Any person who
does not supply information requested is liable for a maximum fine of $500
A former farmer is defined as someone who at some time in the past lived in Saskatchewan and farmed the land for years
A Canadian resident is defined as a Canadian citizen or landed immigrant actually living in Canada or a corporation the majority of whose issued voting and nonvoting shares is owned by Canadian citizens permanently residing in Canada
16
Any individual or corporation contravening the law is liable for a maximum fine of $15000 In addition any corporaton officer responsible for contrashyvention of the law is liable for a maximum fine of $15000 Enforcement is ensured through Sworn declarations on citizenship attached to the land transfer (8)
Alberta
1 Foreigq ownership of land in Alberta is controlled by the Foreign Ownershyship of Land (temporary) Regulations established by an Order-in-Council under Section 33 of the Citizlnship Act on April 26 1977 These temporary regulations will eventually be supplanted by the Foreign Ownership of Land Regulations passed under the dual authorily of the Agricultural and Recreashytional Land Ownership Act and Section 33 of the Citizenship Act 10 (J)
Hnder the regulations ineligible persons-non-Canadians and temporary reSIdents-and corporations with 50 percent or more of their shares or memberships held by ineligible pernons cannot own more than 8 hecares of controlled land Controlled lapd is defined as any land oUfside the boundaries of a city town new inwn Village or summcmiddot village Controlled land however may be acquired by a foreign state for diplomatic or counsul purshyposes The area limitation does not apply to controlled land transferred through inheritance There are no restrictions on urban property (1)
Enforcement of the regulation is ensured by sworn declaration attached to land transfers and by investigative procedures carried out by the Foreign Ownership of Land Administration with use of information supplied by Land Titles Branch (1) Contravention of the law is subject to a maximum fine of $10000 imprisonment of up to 1 year or both Land that is acquired in contravention of the law may be sold by judicial sale Proceeds from the sale are used to cover sale expenses and any remaining funds up to the amount originally paid for the land are returned to the individual Any proceeds exceeding the amount originally paid for the land are put into the General Revenue Fund of Alberta l)
Transfer of Ownership
The transfer of agricultural land from One generation to the next is an integral part of maintaining the owner-operated family farm ensuring that future farmers are available to utilize the land preserved for agriculture (32) A start in farming however requires substantial capital resources As land prices continue to increase the need for capital for young farmers entering the industry becomes increasingly acute
Sallkatchewan
The Saskatchewan Land Bank established in 1972 by the Land Bank Act and administered by the Land Bank Commission was developed to alleviate some of the problems associated with the generational transfer of land Its objectives were to develop a viable agricultural industry in Saskatchewan and
IOAs of OCllb~r 1978 Bill 40 was not yet in effecl Regulations under Bill 40 however will not differ in intem fTOm the temporary regulations but will be more detailed
17
provide for a transfer of farms from generation to generation rather than have family farms absorbed by large farm units The Land Commission a government agency purchases land thereby absorbing the capital costs associated with land transfer It then rents the land to applicant farmers The land bank program provides continuous sales opportunities to Saskatchewan farmers and enables individuals to begin farming independently of substan tial fa~i1y assistance It also encourages the perpetuation of viable family farm units through the transfer of land to direct descendants (30)
Although the land bank program involves the transfer of land through rental tenancy efforts have been made to eliminate this type of transfers detrimental effects on efficient resource utilization Land Bank leases for example are long term and the Commission reimburses the lessee for capital improvements made during tenure which (it is expected) would provide the security necessary to make long term investment decisions to use resources efficiently
Under the program the Land Bank Commission may purchase land from anyone wishing to sell In instances where the Commission must allocate available funds among several offers for sale it will purchase by order of priority from farmers who (1) want to retire and transfer their land to a direct descendant (2) are selIing land that can be used to establish a viable farm unit (3) have large tracts of land on which two or more operators can be supported (4) have palcels of land constituting full units or (5) have no other sale alternative (3l)
The Commission purchases land at market value This is determined through an appraisal process in which the productive value of the cuhivated portion of the sale property is correlated with the productive value and sale price of cultivated properties of similar soil quality in the samt area The productive value is determined through lax assessment data Thus the Commission price is essentially determined by the relationship between prices of recent land sales in the area and the assessed value of the land for taxation purposes A similar process is used to determine the market value of grazing land Assessments are also made of the value of buildings and other improve ments on the property (31)
Land purchastd by the Commission is allocated to lessees on the basis of a point competitj~e system if there is more than one applicant for a given piece of land Applicants are scored on their income potential skill age vendors preference and potential disruption of existing farming enterprises The applicant must declare an intention to make farming the principal occupa tion and be of legal age a resident at the time of leasing and during tenure and a Canadian citizen or immigrant The applicants and spouses combined average annual income for the preceding 3 years must not exceed an amount annually determined by the Commission II The applicants and spouses net worth may not exceed $21000 in 1979 Applicants gain or lose points if their projected net income projected land base in work units or age is outnide the optimal range established by the Commission Points are gained for educa tion experience and for an indication from the vendor that the applicant is the preferred recipient of the land Points are lost for the average distance in
JJBa~d on (h~ composit ind~x of wag~ for Saska(ch~wan in 1977178 this amount was 520000 in 1979
18
II
miles ~-(iat the piece of land applied for is from other land units the applicant is farming (JJ)
Applicants scoring highest arc then intervilwld 10 assess their motivation management ability and other characteristic all of which arc also numershyically scored The applicant with the highest cumulative point score unless otherwise determined by the Commission is awarded the lease (31)
The llase remains in effect until the lessee reaches the age of 65 or dies The lessee may stipulate in writing if the least is to be passed on 10 a direct dlscendant After the age of 65 short-term leases may be granltd under certain circumstances
Since June 1 1978 rent is based on the production value of the land whierl is calculated from th( prices of oilseetis wheat and barley and thtlong-term yield of equal quality land in th area Prior to that time rent was based on a percentage of the lands market value The lessee is responsible for the payment of taxes (J])
Lessees have the option to purchase land after leasing from tht Commission for 5 years The land is sold to lessees at its market value at the time of sale Llssees purchasing land are entiLied to an earned homestead quarter refund made by the Commission on the purchase price of a quarter ~ection of land If the lessee lives on the rented land the inhabited quarter section is the section on which the refund is paid If the lessee does not live on the rented land a quarter section is designated as the humestead quarter on which the refund is paid The refund is 20 percent of the price paid by the purchaser for the qultrter section to a maximum of $5000 paid over a period of 5 years following the land transfer In order to receive the refund the purchaser must be actively engaged in farming and remain a bull esident of Saskatchewan during the 5 years or the balance Q1f the refund is forfeited (J1)
Buildings and improvements on the property are sold under a long-term agreement to the lessee When the lease expires the Commission purchases tht lessees earned equity based on the market value of the improvements thus ensuring that lessees receive the benefits of their investment decisions This combined with the homestead refund means that the lessee builds equity while renting from the Commission (31)
Effects of the Land Tenure Programs
During 1972-77 the Land Bank Commission acquired 354000 hectares of land for a total cost of S8l million This land as of December 31 1977 was being leased to 1912 ksse(s through 2009 leases (30)
In Saskatchewan nonresidents purchased a total of 59877 hectares in 1976 compared to 56769 hectares in 1977 (28)
Compiled data on foreign land transactions in Manitoba is unavailable (19)
In Alberta the amount of land purchases by non-Canadians and foreign corporations during 1976-77 as monitored under the Foreign Ownership of Land Regulations declined 60 percent DuringJanuarY-August 1978 foreign purchases were running 89 percent behind purchases for the same period in 1977 In 977 foreign purchases accounted for 2 percent of total area of rural sales compared to 5 percent of total rural sailS in 1976 (2)
19
LAND USE AND TENURE IN PERSPECTIVE
The dominant themes that emerge from the hind use and tenure programs are that Canadian farmland prices have been increasing and that these increases affect land allocation to agriculture and land tenure patterrs In order to fully assess these themes it is necessary to know (1) how much agricuturalland is actually being lost due to nonagricultural use (in this case urbanhiation) (2) what changes have occurred in land tenure patterns and (3) what factors influence farmland prices in Canada
Loss of Agricultural Land Through Urbanization
D M Gierman (15) has determined that during 1966-71 12801 hectares of class 1-4 agricultural land were irretrievably ca~yerted to urban use annually in Canada The highest rates of conversion Occurred in Ontario and Alberta where an average of 6199 and 2046 hectares respectively of class 1-4 agricultural land were annually converted (table 6) Over 80 percent of the land converted was formerly classified class 1-4 for agriculture The converted land however represents less than 1 percent of total class 1-4 landin those two Provinces
The annual loss of production due to the permanent reallocation of land to urban uses can be estimated by converting the amount of class 1-4 agriculshytural land annually incorporated into cities to a class 1 equivalent proporshytionately allocating the class 1 equivalent land to crops according to the 1976 cropping pattern and multiplying the area allocated to each crop by the potential yield for that crop on class 1 equivalent land (tables 7-10) Accordshying to these calculations losses of potential production due to the direct incorporation of land into cities in the short term (1 year) anc n the long run (20 years) assuming constant 1966-71 rates are relatively small in the three Prairie Provinces Loss of potential production due to land use changes in Ontario however is fairly substantial particularly in the long term DecHnes in production of the major crops in Ontario by 1996 could range from almost 4 percent of average production of tame hay to over 6 percent of rye (tables 7-10)
Manning and MCCuaig (21) quantified the amount of CLI class 1-4 agricultural land likely to be affected by urbanization by looking at CLI class 1-4 land within a 50-mile radius of 19 of Canadas major Census Metropolitan a Areas Fifty-four percent of Canadas class 1 land and 21 percent of Canadas class 1-4 land is within 50 miles of the specified areas Approxishymately 45 million hectares of class 1-4 land is located within the fringe areas of urban centers in Ontario Applying the same methodology used to detershymine the productive capacity of agricultural land directly incorporated into urban centers it is evident that the productive capacity of the urban fringe area in Ontario (table 7) exceeds present production levels for the Province
Census Metropolitan Areas as desirnated by Statistics Canada are urban areas with Over 100000 inhabitants The 19 areas are Edmonton Calgary Saskatoon Regina Winnipeg Thunder Bay Sudbury Windsor Toronto Kitchner St Catherines Hamilton LondonOttawa Montreal Quebec Chicoutini St John and Halifax
20
-------___I~
Table 6-Average annual conversion rates of rural land of vanous
agricultural capabilities to urban uses 1966-71
Province Total class
5-6
HectaresOntario 2496 1789 1503 41I 6199Manitoba 293 219 512538 409 5 952Saskatchewan 28 60 88127 63 29 219 8Alberta 4 12564 747 471 264 2046 165 186Other Provinces 35176 1285 827 1197 3385 498Total Canada 3136 4486 70 3263273 1906 12801 992 539 1531 - = not applicable
Source D M Gierman Rural to Urban Land Conversion Fisheries and Environment Canada Lands Directorate Occasional Paper No 16 Sept 1977
and is over 50 percent of the total production potential on all CLI class 1-4 land in the Province (table 2)
This means that a substantial quantity of agricultural land in Ontario is subject to change from agricultural to urban-oriented use The exact proporshytion of land that may actually change however cannot be determined from available information Although the potential for increased crop production in Ontario is substantial due to the combination of good land and favorable climate this potential is affected by competition between agriculture and urban development
The situation in the Prairie Provinces is considerably different The amount of land located in the fringe area of cities in Manitoba Saskatcheshywan and Alberta equals 14 30 and 27 miI1ion hectares respectively (21) The productive potential of this land is equal to about one-fourth to one-half of present production in Manitoba one-fourth in Saskatchewan and one-third in Alberta
Land Tenure
Total Canadian farm area has been declining-down about 14 million hectares or 2 percent during 1961-76 A 25-percent decrease in eastern Canada was partially offset by a 5-percent increase in western Canada Farmland declined about 13 million hectares in Ontario and increased 11 million hectares in Alberta Thus the amount of farmland is declining in eastern Canada which has the best agroc~imatic potential for food producshytion and increases in farmland are occurring in western Canada which has considerably less agroclimatic potential Land which can grow fruit vegeshytables and corn in eastern Canada is being replaced by land suitable for barley and hay in western Canada
Average farm size in Canada continued to increase during 1971-76 from 187 hectares to 201 hectares The largest increases in size occurred in Manitoba and Saskatchewan where farms increased 9 percent from 220 to 240 hectares and 342 to 374 hectares respectively
During 1971-76 the total number of farms declined about 18 percent (table 11) The percentage of farms fully operator owned in Canada declined
21
I
I
- - - -
- ~~ - ~~~
~
~ A_shy
f
Table 7-Ontario Estimated loss in crop production on class I equivalent land due to conversion to urban uses ~ rIClass 1 Productive capacity of converted agricultural land
~uivalent area ~ I yearCrop in cropo 20 yean Productive capacity of urban fringe ff
Iconverted annually Production on1Percentage of Production on IPercentage ofconvertwto urban wes average Class 1 ~uivalnt
areal converted average I Production on 1Percentage of H area in urbanproduction l area urban fringe 1~productionmiddot averagefringe ~Hectares areaSMetric tons Percent productionMetnc tons fiPercentWheat 1000 hectares 318 1000 metric tons 1704 Percent ~ Oats 028 t280 34080 55 ~958 229Barley 25 1227221 19160 50 199955 202Rye 24 691 ~ 34 19100 18249Com 947 31 2580 61
159 687 115 H129 8059 25 ~~Tame hay 1635 25 161180 49 95 22612263 682Fodder com 20518 245260 39 5804 11721756 1177Potatoes 22 882827 435120 14344Nl 810Other 21 373
Nl 1114 16200 41 15666 159- 19- 570- - 147Total 5094
802 - shy- -3668 - = not applicable
Class I equivalent area in crops converted annually to urban USe times potential yield on class I equivalent land (from table 2)
(1976 ara ti~es 1967middot76 yield) times 100 (Annual production on converted area)
Annual production on convened area times 20
(1976area times 1961middot76 yield) times 100 (Annual production on area converted oVer 20 years)
Area in urban fringe times potential yield on class I equivalent land (from table 2)
bull (1976 area ~imes 196776 v~eld) times 100 (Annual prodUcuon On urban fnnge area)
Sources D M Gierman Rural to Urban Land Conversion Fisheries and Environment Canada lands Directorate Occasional Paper No 16 September 1917 and E W Manning and j D McCuaig Agncultural Land and Urban Centres an Overview ofthe Significance ofUrban Centres to Canadas Quality Agricultural Land Fisheries and EnvironmentCanada lands Directorate july 1917
Table 8- Manitoba Estimated loss in crop production on class I equivalent land due to conversion to urban uses
CIa I Productive capacity of converted agricultural land equivalent area I year Productive capacity of urban fringeCrop 20 yranin crops
converted annually Production on Percentage of conv~rled CI I equivalentProduction on 1Percentage of
to urban uses average productiorn Percentage ofconverted averageareal production area in urban urban fringearca production averagefringe areaHeclares producrion1Melnc Ions Percenl Meine Ions Percent 1000 heclares Wheat 1000 melnc Ions 242 Percent702 ~~Oats 14040 05377 350246 03 1015 38Barley 4920104 57 113395 362~3 42Mixed grains 7900 59O 15232 578Rye 6
~ 640 45 16 43
15 51Buckwheat ~3 300 57 363 83 02 20 38Com 60 40I 44 ~ 4 27Tame hay 80 3389 2596 OS 8 33Fodder com 11920 51 2 45 ~2 129 864 3iFlaxSttd 900 43 - 33~ lt 50 3 67M Sunnower 1000 70 32 -shy Nl 3 3 02 48 72
Ra~d 60 33 51tJO 15 523 ~ 5~ Mustard seltd 460 49 28I 1
Other crops 15 I ~2 20 33 2
32 34 a--bullbullbull- 2 67Summer fallow 145 19
211 Total 746
~ 1083
- = not applicable
Class I equivalent area in crops converted annually to urban use times potential yield on class I equivalent land (from table 3)
(1976 area ti~es 1967middot76 yield) times 100 (Annual production on converted area)
Annual production on converted area times 20
(1976 area times 1967middot76 yield) 100 (Annual production on area converted over 20 years) times
Area in urban fringe times potential yield on class I equivalent Idnd (from table 3)
(1976 area ~imes 1967middot76 y~e1d) times 100 (Annual production on urban frmge area)
Sources D M Gierman RU1a110 Urban Land Conversion Fisheries and Environmem Canad Lands Directorate Oteasiona Paper No 16 September 1977 and E W Manning and J D McCuaig Agricullural Land and Urban Cenlres an Overview of Ihe Significance of Urban Cenlres 10 Canada S Qualily Agneullural Land Fisheries and EnvironmentCanada Lands Directorate July 1977
~
0
Table -Saltkatchewan timated I m nop pmduction on cia I luilent land due to conenio to uban u CI I n
Productive capacify of conerted agricuhural landequivalen areaCrop I year
20 yea in cropo
converted annually Productive capacity of urban fringeProduction on 1 Percentage of 10 urban ilia convrrtrd avrrage Productio on I Pecenage of
CI I equivllen area I production convltnrd avrragr Production on I ~
area in urban Percenage ofHectares arra Production urban fringe Meine Ions fringe avrrage Wheal Percent Meine Ions I aira l
67 Percent productionOars 194 JOoo heClares000Barley 6 19 3880 JOOO melne Ions
003 PercentII 00Rye 380 88442 I 00 03 2564
Tame hay 3 840 79 22 00 03 253
Rapeseed 8 54 60 148 22
~- 3 00 04 562Other crops 5 1080 14 22
~shy 4 00 04 35Nl 26Summer fallow 100 108 ~ ~ 67 -
03 72436 25 - 54
~ 39 12 Total area 167 887 - v_~middotmiddotshy bull- = not applicable - 2195
Class I equivalem area in crops converted annually to urban Use times potemial yielel on class I cquivalem land (from table 4) (1976 area ti~es 1967middot76 yield) times 100
(Annual produlttlon on converted area)
Annual production on convened area limes 20
(l976aa times 1967middot76 yield) times 100 (Annual production on area converted over 20 years) I
Area in urban fringe times potential yield on class I equivalem land (from table 4)
(1976 area ~imes 1967middot76 yeld) times 100 (Annual production on urban frmge area)
j D M G~bull tlt Ubo Lo Cmbull yh ~_ Co t n~ Ocroo P N p nood E W M
Canada Lands Directorate July 1977 J D Mabullbull _ Uoo C_ M C Qoooo1 Lo ood bullbullbull0 I ~ of U COO
I--------~~-==o~~~~~~~~
f shy
~~~tmiddotmiddot ~ -
~ Table lO-Alberta Estimated loss in crop production on class 1 equivalent land due to conversion to urban uses lt
I
CI I Productive capadly of coverred agriculrural land equivalent area
Crop I yenin cropo 20 yean Productive capacity of urban frin~ converled annually Production on JPercenta~ of
to urban IUeI onyerred ayeta~ Producrion on - Percenta~ of CI I equiyalentconverted avera~ Production onarea I production t I Percenta~ ofarea in urban arr~J production urban fringr
Hectares fringr averageMelnc Ions arealPercent Melnc Ions I produclionWheat Percent364 1000 hecla resOats 1056 003 JOOO melric Ions Percent118 21120Barley 378 05203 451370 7560 1308Mixed grains 1406 03 52 146 32
18 28120 467Rye 58 57 3202 45712 1160 1737Tame hay 30 03 48 3522250 600 70Flaxseed 1675 55 2903 155 33500 38Rapeseed 8 60 3503 31049 160 2077Mustard d 74 03 57 6 37NI I 1480 tJ1 Other crops I 01 53 9 326049 20 90Summer fallow - 2 32-- 424
25 2- - - 61 25
~ - -Total 1660 - ~- - not applicable 2055----- -
525
lt-Class I equivalent area in crops converted annualy 0 urban u limes potential yield on class I equivalent land (from table 5)
(1976 area ti~es 1967-76 yield) times 100 (Annual producuon on converted area)
-1
Annual production on convened area times 20
(1976 area times 1967-76 yield) 100 (Annual production On area convened over 20 years) Urnes bull
Area in urban fringe times potential yield on class I equivalent land (from table 5)
bull (1976 area ~imes 1967-76 veld) times 100 (Annual produclJon on urban frmge area) j
Sources D M Giennan Rural 10 Urban Land Conversion Fisheries and Environment Canada Lands Directorate Occasional Paper No 16 September 1977 and E W_ Manning and Canada Lands Directorate July 1977 J D McCuaig Agnculural Land and Urban Centres an Qnew of Ihe Significance of Urban Cenlregt 10 Canada Qualily AgrIcultural Land Fisheries and EnvironmentI
I ----~~~i~~
I
Table II - Number and proportion of census farms by tenure of operator 1971 and 1976
OwnerProince Part Owner1971 1 1976 1 1971 1 1976 1 1
1971 1 1976 1 1971 1 1976 Number Percentage of
total Number Percentage of Ontario 691162 total501165 i4Manitoba 66 1987721608 2171517238 2162 28Saskatchewan 58 1118441499 1073436612 54 32 36Alberta 53 3009737193 2739833584 3959 39Canada 59 21284251066 20206189063 3469 63 35---------------- 95862 93757 26 31Tenant
-I97I-=C-imi-J 1971 1 Total-shy
1976J J 1971 1 1976 Number Percentage of
Ontario total Number49113 4403 5Manitoba 62189 947221991 76983Saskatchewan 6 75374 349815568 29963Alberta 7 84225 769703520 69578Canada 7 619200 6270217298 573105 6 366128 300118
Source R Davianlt Selected Agricultural Statistics for Canada Agriculture Canada Ottawa1977
from 69 percent of the total number of farms in 1971 to 63 percent of the total in 1976 and the number of farms partly owned or fully rented by the operator increased from 26 to 31 percent and 5 to 6 percent of the total number of farms respectively The percentage of owner-operated farms in Alberta and Saskatchewan remained about the same during 1971-76 although the total number of owner-operated farms in Canada declined The largest decreases in the percentage of owner-operated farms oCcurred in Manitoba and Ontario where the percentage of owner-operated farms declined from 62 to 58 percent and 74 to 66 percent respectively during 1971-76 (table II)
Farmland Prices
Canadian farmland prices increased 121 percent in nominal terms during 1971-76 from an average of $24631 per hectare to an average of $54372 per hectare The largest increases in farmland price occurred in Ontario where farm prices increased 150 percent from an average of $80240 per hectare in 1971 to an average of $2007_01 in 1976 The smallest increases Occurred in Manitoba where farm price increased 94 percent from an average of $17865 per hectare in 1971 to $34638 in 1976
Price reflects the intersection of demand for and supply of land Thus the allocation of land between divergent uses relates to the cumulative effect of the demand for those uses upon its price Farmland price is affected by the interaction of farm and nonfarm demand Farm purchasers are defined as those individuals for whom the price of land is determined by past and expected returns from the land for agricultural production Nonfarm purshychasers are individuals for whom the price of land is determined by past and
26
expected returns from the land for other than agricultural purposes (13) Foreign purchasers of land are considered nonfarm buyers when the price at which they are willing to buy land is determined by economic conditions in their domestic economy rather than returns from Canadian agriculture even if the land they purchase remains in agriculture through tenant farming
The determinants of farmland price relating to nonfarm demand include the presence of minerals for extraction forests population pressure on use of the land which is manifest in urbanization construction of transportation systems speculation and recreational or residential construction Those relating to farm demand for land include farm income pressures to enlarge farm holdings and advances in agricultur~1 technology (13)
Land prkes are an underlying focus of Canadian agricultural land programs particularly since the impact of nonagriculturally oriented demand on land prices influences the allocation of land away from agriculshyture and affects preferred land tenure patterns The land use and tenure programs therefore deal with the effects of urban-oriented and foreign or nonresident nonfarm purchasers on land prices use allocation and tenure ptterns
Since farmland prices are determined by a combination of farm and nonfarm demand the question arises as to their relative effects on Canadian farmland prices (table 12) The effects of farm and nonfarm demand on farmland prices were estimated by means of an econometric model Because Canadian programs focus on the effect of urban oriented nonfarm buyers on land price the number of urban and rural nonfarm residents in each of the Provinces (Ontario Manitoba Saskatchewan and Alberta) was used as a proxy for nonfarm demand (table 13) It was assumed that each additional urban and nonfarm rural resident represents potential demand for residences transportation or other nonagricultural uses Net farm income was used as a measurement of the effect of farm demand on land prices (table 14) It was assumed that the supply of land is constant and that the impact of a change in farm income on land prices is distributed over a 2-year period following the year of the change T~e analysis is for the period 1960-76
The following equation was used
Yil = a j + t3 iX 1iI-1 + YiX 1iI-2 + OiX2il + Ei
where Y farmland price in real terms = total Canada (C) Alberta (A) Manitoba (M) Ontario (0)
and Saskatchewan (S) X I net farm income in real terms
urban and nonfarm rural populationX2
The parameters of the above equation were estimated by ordinary least squares regression for each of the four Provinces and total Canada with the following results
ii DW CV
YC = 1
-20126 + 17024 XI CI-I (431)
+ 21009 XI CI-2 + 17765 X ZC1(477) (1067)
097 156 3
YA1 = -11673 + 05628 XI AI-I + 2174 XI AI-Z + 29117 X ZA1(210) (376) (080) 094 170 4
27
~ ~~ 1
l~
YM I = - 95S11 + 0917S XI M I_I + 12098 XI M 1-2 + 28765 X M 077 188 7(175) bull (l7S)middot (159)z 1
YObullI = -10214 + 45268 XI 01-1 + 30839 XI 01-2 + 17994 X 0 I z 096 207 6(395) (242) (754) bull
Y51 = -9501 + 11926 Xl 51-I + 16129X _ + 19218XI5I Z(351) bull (406) bull (507)ZS1 089 167 6
IIe elasticities of the two explanatory variables for each of the four Provinces and total Canada are as follows
Province XI XI Ontario 70 161Manitoba 29 117Saskatchewan 39 220Alberta 28 74Total Canada 44 135
Results of the analysis indicate that the two variables were significant and accOunted for most of the variation in land prices during 1960-76 The
Table 12 - Value of farmland deflated by CPI
Year c Ontario ManitobaI Saskatchewan Total Canada
Million dollars 1960 4172 1312 30481961 2748 148474415 1350 31021962 5238 1444
2177 1527438881963 3570 175725244 1546 43921964 5551 1735
3847 184604952 4240 19960
1965 5782 1967 56941966 6153 2100 4785 21858
62421967 6824 5109 234482250 66611968 7554 2305 5520 25II8
65541969 8398 5756 262272046 5539 5395 25466 1970 7667 2129 59671971 7718 2046
54II 2564057591972 5256 251817688 1952 54961973 8671 2076
5071 247045917 53141974 10173 267832387 6675 6152 30914
1975 II586 2456 78311976 12567 6780 345362666 8742 6950 37204 Sources Statistics Canada Quarterly Bulletin ofAgncultura Statistics Ottawa various issues
28
-----shy~
Table 13-Urban and rural nonfarm population 1960-76 1
OntarioYear Manitoba Saskatchewan Alb~~-Id~t-~-ana a
~ -~~ -bull----Thousands
1960 5590 739 ~~ 10201961 5730
610 15801 1962 5873
750 620 1046 16165760 6311963 6020 1072 16537771 1964 617]
1J41 1099 16917782 652 ] 126 17306 1965 6325 793 6631966 1154 177046479 803
10 1967 6654 818 675 1185 181016821968 6833 834
1230 18535 ]969 7018
689 1277 IS9S0 849 696 1325 19435 1970 7207 865 1971 7404
703 1376 19902880 7101972 7515 888 1427 20406
7131973 7627 1469 20712896 717 15111974 7742 904 720 21022
1555 21338 1975 7858 9]2 7241976 7985 1600 21658920 728 1648 21958
The data for intercensual years is determined from the average annual rate of increase in population extrapolated between the census years 1961 1966 1971 1976
Sources Statistics Canada Canada Year Book Ottawa various issues Canada 1971 Censwof Canada Population Urban Rural Distnmiddotbutions Ottawa
elasticities for the number of nonfarm population are greater (ranging from 74 to 220) than the elasticities for farm income (ranging from 28 to 70) indicating that the percentage change in farmland prices related to the percentage change in the number of nonfarm population is greater than that relative to the percentage change in farm income The rate of change in the number of nonfarm population in any time period however is rele~ively small in comparison to the rate of change that can Occur in farm income during specified periods During 1972-75 for example the rate of increase in nonfarm population was 05 percent in Saskatchewan while the rate of increase in farm income during that period was 40 percent Thus given the specified elasticities for the two variables for Saskatchewan farm income accounts for 94 percent of the increase in farmland prices while the number of nonfarm purchasers accounts for 6 percent of the increase assuming no further increases in farm income in the next 2 years In addition the total cumulative effect of the increases in net farm income on land prices would not occur until 2 years after the final increase The annual percentage increase in land prices (1972-75) are attributed to
29
Jbull I
Province Net farm income Nonfarm purchasers of land
Ontario 85 15Manitoba 86 14Saskatchewan 94Alberta 6
75 25Total Canada 77 23
Thus during 1972middot 75 net farm income had a greater impact on land prices than the number of nonfarm purchasers of land
Table 14 Net farm income deflated by CPI
Year Oodo IMOOb] Skhewo IAlb ~[~~ Total
Canada Million dollars
1960 1961 1962 1963 1964
586 609 673 593 550
216 105 322 215 306
667 199 914
1062 643
399 400 549 564 456
2396 1838 2990 2924 2427
1965 1966 1967 1968 1969
620 833 647 689 710
31~ 258 284 296 212
885 1009
620 802 714
558 653 494 615 459
2893 3416 2584 2999 2690
1970 ]971 1972 1973 1974
1975 1971j
681 545 703 947
1046
1074 813
146 254 266 494 405
464 359
370 710 590
1191 1357
1616 1423
379 410 520 886 941
960 722
2156 2405 2662 4339 4568
4886 4040
CONCLUSIONS
Although potential for major losses in Canadian agricultural production exists particularly in Ontario this docs not necessarily mean that this land will be lost to production Measurable losses due to urban pressures appear to be small losses in the urban fringe may be larger but cannot be pinpointed If current rates of changtmiddot do not ac-dclatc precipitously pOFulation pressures
30
probably will not be a major factor affecting Canadas competitive position in world wheat trade Evidence indicates that Canada does have the capability to increase wheat production under current cropping patterns to 32 million tons The continued attrition of farmland in Ontario however could be reflected in increased US exports of those products formerly produced in Ontario such as fruit
The rapid increase in farmland prices per se may not necessarily mean that agriculture is facing difficulty in competing with urban development for use of the land Evidence indicates that high product prices are capitalized into land accounting for its increase in price The changes in tenure patterns that have occurred between the 1971 and 1976 Census of Agriculture may also be a reflection of increased returns from agriculture as farmers move to increase their land base quickly by renting in order to take advantage of high productprices
Land use-programs such as the one implemented by the British Columbia Land Commission Act apparently can stop the reallocation of agricultural land to urban uses If the general economic environment is not conducive to the allocation of agricultural land to production however maintaining that land for future agricultural use may require a substantial social investment
REFERENCES
(1) Alberta Department of Energy and Natural Resources The Agricultural and Recreational Land Ownership Act Explanatory bulletin undated
(2)
Foreign Ownership of Land Administration Unpublished data
(3) Alberta Land Use Forum Report and Recommendatio7lS Jan 1976
(4) Beaubien Charles and Ruth Tabacnik
People and Agricultural Land Science Council of Canada Ottawa June 1977
(5) Boylen Diana M
Rural Land Tenure Alberta Land Use Forum Ttchnical ReportNo 6B 1975
(6) British Columbia Government of Land Commission Act
(7) Brown Jacob
Our Home and Native Land Extent and Implications of Foreign Land Ownership The IlgrgISt Vol 711 winter 1978
31
~
l 11 l
(8) Canada Grains Council
Statistical Handbook Various issues
(9) Davianlt R
Selected Agricultural Statistics for Canada Agriculture CanadaOttawa 1977
(10) Environment Canada Lands Directorate
Land Capabilz~y for Agriculture Canada Land Inventory Prelim inary Report Apr 1976
(II) Esau Alvin A J
Land Ownership Rights Law and Land an Overview Alberta Land Use Forum Summary Report 9 Edmonton 1974
(12) FederalProvincial Committee on Foreign Ownership of Land Report to the First Minirters Conference Canadian Intergovernmental Conference Secretariat Aug 1974
(13) Gale John E
What Makes Farm Real Estate Prices Agricultural Finance Review Vol 24 June 1963
(14) G(no BarbaraJ and Larry M
Food Production in the Canadian Environment Science Council ofCanada Ottawa Dec 1976
(15) Gierman D M
Rural and Urban Land Converslon Occasional paper no 16 Fisheries and Environment Canada Ottawa Sept 1977
(16) Hudson S C
A Review of Farm Income Stabilization in British Columbia A Report to the Minister of Agriculture Oct ]977
(17) Jean Clancy V
Land Use Income Assurance Linked in British ColumbiaForeign Agriculture March 22 1976
(18) Manitoba Governmltgtnt of
Agricultural Lands Protection Act Winnipeg
(19) Manitoba Agricuitur Lands Protection Board Unpublished material Winnipeg
(20) Manning E W and S Eddy
The Agricultural Land Reserves of British Columbta an Impact Analysis Fisheries and Environment Canada forthcoming publication
32
(21) Manning E W and J D McCuaig Agricultural Land and Urban Centres an Overview of the Signifimiddot cance of Urban Centres to Canadas Quality Agricultural Land Fisheries and Environment Canada Lands Directorate July 1977
(22) Ontario Ministry of Agriculture and Food Green Paper on Planning for Agriculture Food Land Guidelines Ontario 1977
(23) _____
A Strategy for Ortario Farmland March 1976
(24) Ontario Ministry of Housing A Guide to the Planning Act Ontario
(2gt Parlby G B The Family Farm i71 Alberta its Origins Development Future Alberta Land Use Forum Summary Report 1 Edmonton 1974
(26) Rees W E The Canadian Land Inventory in Perspective Fisheries and Envimiddot ronment Canada Ottawa March 1977
(27) Saskatchewan Government of Farm Own~~rs7ttp -Jt~~-middotRgina
(28) Saskatchewan Farm Ownership Board Unpublished data Saskatoon
(29) _____
First Annual Report Saskatoon 1975
(30) Saskatchewan Land Bank Commission Annual Reports Various issues Regina
(31) ____
Saskatchewan Land Bank Regulatiolls Regina June 1978
(32) Saskatchewan Land Use Policy Committee Land Use In Saskatchewan Agricultural Land Fact Sheet No7 Regina
(33) Shields J A and W S Ferguson Land Resources Production Possibilities and Limitations for Crop Production in tht Prairie Provinces Oz1seed and Pulse Crops in Western Canada Westtrn Cooperativts Ftrtilizers Limited Calgary 1975
33
bull
(34) Shields J A and J L Nowland
Additional Landfor Crop Production Canada Proceedings of the 30th Annual Meeting of the Soil Conservation Society of America San Antonio Aug 1975
(35) Statistics Canada Canada Year Book Ottawa various issues
(36) _____
Census of Agriculture Ottawa various years
(37) _____ loy
Census of Population and Urban Rural Distribution Ottawa
various years
(38) _____
Net Farm Income Ottawa various issues
(39) _____
Quarterly Bulletin of Agricultural Statistics Ottawa various issues
(40) US Department of State Various reports from US Embassy Ottawa
(41) Ward Neville E
Land Use Programs in Canada British Columbia Fisheries and Environment Canada Ottawa July 1976
(42) _____
Land Use Programs in Canada Ontario Fisheries and Environshyment Canada Ottawa September 1977
US GOVERNMENi PRINTING OFFICE 19790_ 630-3902563 REGION 31
34
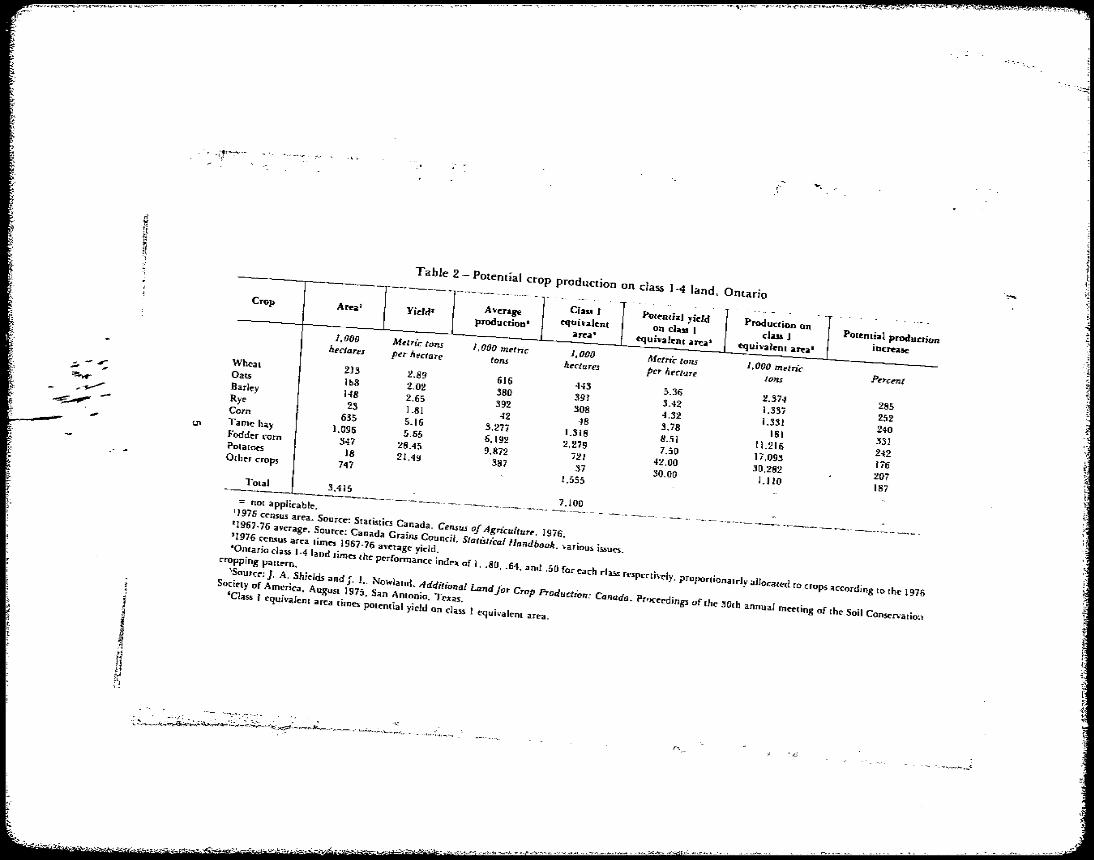

~
Table 5 - Potential -rop production on class 1-4 land Alberta
Crop Average Class I Potential yield Production ltIn ~~Area Yield equivalent on class 1 Potential production production class 1 area equivalent area equivalent area increaseI
i
1000 Metric tons 1 000 metric 1000 Metric tons 1000 metrichectares per hectare tons hectares per hectare tons Percent ----rshy Whelt2t 2243 180~ 4087 2852- Oats 290 8271 105724 199 1441 920A-- 320Barley 29442276 216 lOt4916 2894 380~- Mixed grains 108 10997 124222 240 137 320Rye 438 8373 150 110
Tame hay 1541 365 93 250 233 1125625 1959 67000 Flaxseed 30 92 13125 133 t
28 ~ Rapeseed 299 94
38 150 57 104 281 380 150Mustard seed 9 570 103 ~89 8 11 120Other crops 311 13 63- - 396Summer fallow - shy2611 - shy- 3320 - - -
Total 10225 shy - 13000 - - -- = not applicable
1976 census area Source Statistics Canada Census of Agriculture 1976 1967 -76 average Source Canada Grains Council Statistical Handbook various issues t1976 census area times 1967middot76 average yield ii
tltAlberta class 1middot4 land times the performance index of 1 85 70 and 50 for each class respectively proportionately allocated to crops according to the 1976 Ii
cropping pattern i
Source J A Shields and J L Nowland A dditional Land for Crop Production Canada Proceedings of the 30th annual mel mg of the Soil Conservation Society of America August 1975 San Antonio Texas
1 [~middotClass 1 equivalent area times potential yield on class 1 equivalent area
~
-- qJ ~middot1
T
middot-~~~~W~~~~~scrr~~~l1l~~~~~~~-C~Jr~middota~middotE~x~rjc~r~i~L~~-middot~ n- J -) -~ ~ gt~~J ~A i u~
for example could increase only by about half indicating that a large Proportion of the available agricultural land in the Province is already beingused for crops (table 4)
If all class 1-4 land were allocated to crop production under existing cropping patterns total Canadian wheat production could expand to 32 million tons (a 92-percent increase over the 196970 to 197879 lOyear average production level) oat production could increase to 77 million tons or 78 percen~ and barley to 188 million tons or 63 percent These rates could change if cropping patterns are altered In addition a change in technology resulting in a decline in the use of summer fallow iTt the Prairie Provinces for example would mean a much larger increase in wheat production (33)
LAND USE PROGRAMS
Five Provinces-Manitoba Saskatchewan Alberta British Columbia and Ontario-have developed agricultural land use and tenure programs The issues that these programs deal with are interrelated and complex Land tenure programs concern owner versus tenant farming and family versus corporation farming These programs seek to maintain the family farm in a rural social infrastructure and perpetuate owner-operated rather than tenant-operated farming
Land use programs deal with the allocation of land between compe~ing uses urban versus agricultural Land use priorities are largely determined by a combination of the economic resource base and the philosophical oriemtation of the political party in power in the Province
Federal versus Provincial Jurisdiction
Both land use and tenure programs in Canada fall under the jurisdiction of the Provincial governments The Provinces maintain extensive powers for implementing land control measures under the British North America Act (BNA Act)2 As the Act is generally interpreted the Provinces are constitushytionally empowered to (1) develop laws concerning the purchase or exproprishyation of land for public recreational use (2) implement differential tax structures so that local landowners using land for specific purposes such as agriculture do not bear the burden of increased property assessments resulting from nonresident purchases (3) establish land use and zoning controls and (4) require disclosure of the place of residence citizenship and other pertishynent information concerning persons owning or purchasing land in the Province
It is unclear under the BNA Act whether Provinces were empowered to directly restrict land sales to aliens since exclusive legislative jurisdiction in
The BNA Act is a component of the Canadian constitution It created the Canadian Federal union and delineates the distrivution of powers between the Federal and Provincial Governshyments The Parliament of Canada was granted legislative jurisdiction over subjects of common interest while Provincial legislatures were given jurisdiciion over maccers of local interest
9
matters relating to aliens was relegated to the Federal Government Section 33 of the Canadian Citizenship Act granted aliens equai rights as citizens in acquiring property in Canada (12) Effective February 15 1977 however the Federal Government amended Section 33 of the act allowing a Province to pass regulations controlling land sales to aliens To date Alberta is the only Province which has done so under Section 33 of the Citizenship Act Under the amended law Provinces cannot restrict ownership in such a way that will conflict with Canadas international legal obligations discriminate between aliens on the basis of nationality restrict acquisitions by pemanent residents hind~r foreign states in acquiring property for diplomatic and consular purposes or restrict the acquiition of land approved nnder the ForeignInvestment Review Act (FIRA) (40)
Urbanization and Land Use
Canadas best agricultural land borders the countrys rapidly growing urban centers These urban centers figure significantly in determining land use Cleared farmland is preferred for urban building for example because development costs are relatively cheap (4)
Urbanization influences agricultural land use (1) directly through the actual incorporation of former agricultural land into expanding urban centers and (2) indirectly through changes in the economic environment of urban fringe areas which result in a transition from agricultural to urbanshyoriented land uses Urban commutersheds and their concomitant highways housing developments and recreational facilities for example exert influ ence on land use patterns some distance from the boundaries of the urban center The growing demand for land puts pressure on land prices to reflect urban values instead of the value derived from agricultural capability When the return from other uses exceeds that derived from farming the agriculshytural use of the land is no longer considered justified on economic grounds and the land is allocated temporarily or permanently to alternate uses This phenomenon often means abandoned farms land left idle under speculation or serious financial difficulties for those who continue to farm (21)
Areas vith moderate climate and level terrain conducive to both agriculture and human habitation are limited They are located in a long narrow strip along the U_S-Canadian border with particularly heavy concentrations along the lower Great Lakes and the St Lawrence River in Ontario and Quebec Provinces and along the coast and intermontane valleys of British Columbia This congruity in area for agriculture and population results in a direct competition for use of land much of which is classified as Canadas best for agricultural production This competition is perceived to be affecting the allocation of agricultural land to nonagricultural uses British Columbia and Ontario have developed agricultural land use programs to deal with these issues
Under the FIRA the Faelgn Investment Review Agency established Dec 12 1973 assesses any benefit accruing to Canada when non-Canadians acquire control of Canadian business enterprises or establish new businesses in Canada The agency is responsible to the Minister of Industry Tr2de and Commerce Some land acquisitions would come under FIRA review if they involved a business with gross assets of at least Sl50000 or gross annual revenue of S3 million
10
l
I
I British Columbia
The British Columbia agricultural land use program implemented by the Land Commission Act was one of the first comprehensive attempts on the part of a Province to redirect the process of agricultural land allocation to nonagricultural uses British Columbia consists of a series of north-south mountain ranges with 90 percent of the land mountainous and nonarable Agriculture is limitd to the narrow fertile valleys between the mountains The af~roclimatic characteristics of the valleys however are conducive to producing such spedalty crops as soft fruits grapes and tobacco (20) Becallse crops are produced in the intermontane valleys to which access is restricted by mountains or sea British Columbia farms are relatively small highly specialized and faced with major transportation constraints (16) The average farm size is 126 hectares compared to an average of 201 hectares for total Canada and 374 hectares for Saskatchewan Rapid population growth has led to competition for use of the same topographically limited land this competition has resulted in land prices rising higher than is warranted by the lands agricultural productive potential (16)
The Provincial Government became increasingly concerned about the Provinces ability to produce food on a very narrow land resource base that was being affected by urban development during the early seventies British Columbia is highly dependent on imported food to meet local demand The Government recognizing the Provinces high dependency on outside supply became more sensitive to keeping future land use options open It soon sought a way to plan urban land uses in a more orderly way while preserving remainshying farmland (41)
In December 1972 the Provincial Government placed a moratorium on all future use of certain agricultural land for purposes other than farming Two Orders-In-Council one in December 1972 and one in January 1973 proshyhibited changes in use of land over 081 hectare classified as farmland for taxation zoned for agriculture or designated as having CLI capability of 1-4 (20) Land did nut have to be in actual agricultural production to be affected by the moratorium only to fit into one of the categories (41) Bill 42 the Provincial Land Commission Act as introduced in February 1973 aimed to preserve agriculturallrlrd for farm use and establish and maintain the family farm bull Farm use was defined as the occupation or use of agricultural land for genuine farm purposes as well as certain other uses compatible with the preservation of land for farm use (26)
Section 2 of the Land Commission Act created the Land Commission a five-member board which would establish agricultural land reserves (ALR) in tle 28 regional districts of the Province The land reserves were to include all land capable of sustaining agriculture-that is all CLI class 1-4 land which had not been irreversibly developed If nonagricultural land was not immedishyately available for urban expansion land sufficient for 5 years of urban growth was excluded from the reserve Lower capability land was included in the reserve where there was evidence that it could be used successfully in conjunction with class 1-4 land Class 7 land was included in those instances
41n September 1977 the Land Commission Act was amended the Land Commission title changed to the Agricultural land Commission and its agricultural orientation strengthened
11
f ~
f J
~~r~~~~-~-~~1lmIf
gtI
where excluding it would result in nonagricultural use of an otherwise agricultural area (20) Land was also exempt from the reserve if it had been continuously used for a nonagricultural purpose 6 months prior to December 21 1972 (4)
The Provincial Government maintained review and veto power over the ALRs developed by the regional districts As the Provincially approved ALR plans came into effect they replaced the previous moratorium on land use (20) Land designated as part of an AJR cOllld not be used for any purpose other than farming except as permitted by the Land Commission Act or by order of the Commissiun (6) Proredures were established for appealing an ALR d1signation All ALR plans were completed by 1975 and as ofJanuary I 1978 the total area within the ALRs was 47 million hectares (20)
The Provincial Government recognized that by limiting the use of land to agricultural purposes it was denying farmers the opportunity to cash in on the increased value of their land (16) Land sales often served as a form of farm retirement pension On the other hand it was argued that farmers should make a living from farming not land speculation and that proceeds from that living should permit them to retire on a decent income (4)
The British Columbia Farm Income Assurance Program (FlAP) was introduced in November 1973 as a corollary to the Land Commission Act It provides income protection for farmers operating under an ALR plan with producers contributing one-third and the Provincial Government two-thirds of the premiums to an assurance fund Indemnities are paid out of the fund when market returns fall to a specified percentage of the basic cost of producshytion which is calculated to include labor management depreciation interest on investment and cash operating costs (16) The programs which are effective for 5 years have operated for fruit trees beef dairy hogs field tomatoes greenhouse vegetables table eggs broiler hatching eggs sheep blueberries and potatoes (J 7) As of September 1977 $89 million had been paid under the program to about 5000 producers representing average payments of $17800 per producer
The British Columbia land use program has been in effect long enough to make an assessment of its impact on land allocation to urban and agricultural uses Manning md Eddy (20) found that the British Columbia ALR did bring about a major shift in the location of new residential and commercial development The ALR also prevented much change in land use within its boundaries The rate of subdivision within the ALR for example was considerably lower than in undesignated areas
The designation of land as agricultural within an ALR plan however was not enough to assure that the land was actually used for agricultural producshytion In the short-term period of the study much middothe ALR land was left idle because returns from farming were insignificc 11 in elation to the costs of capital investment on land purchased at prices refle~i 1emand for the land for urban subdIljsions (20) If economic conditi - ~ not conducive to allocating land to agricultural production opportunity costs are incurred by keeping land in agriculture and even more by leaving it idle Both the British Columbia and Ontario agricultural land use programs incorporate farm income stabilization programs which in effect represent a sociol payment to farmers for not reallocating their land to alternative uses The British
12
l
Columbia program has apparently been successful in keeping land In agriculture although at a relatively high social cost
Ontario
Ontario is the home of a major part of the Canadian population and is the countrys industrial center It is similar to British Columbia in its agloclimatic capability of producing a wide range of specialty crops including corn soybeans soft fruit and tobacco which cannot be produced dsewhere domestically as efficiently Ontarilt however does not face the oilstraints imposed on British Columbia by its rugged topography Most of Canadas prime agricultural land is located in Ontario and transportation to markets and Sources of inputs is not a major cost of production as in British Columbia The Province does experience intense competition for use of prime agriculshytural land Speculation and nonfarm investment stemming from urbanshyoriented population pressures are identified as major factors driving up the price of land making it difficult for farmers in the Province (21)
rhe Ontario Government has not placed a moratorium on use of farmland as in British Columbia (42) Like the latter however one of the motives for Ontarios developing a land use program to preserve agricultural land was to reduce future dependence on other nations for those commodities which can be produced within the Province (22)
Ontario agricultural land use programs were developed on the premise that (1) land use will be determined by the operation of the market place to the greatest extent possible (2) that tradeoffs will be made between economic growth and desired land use patterns (3) that land use programs be conshyducted and enforced at the local municipal level and (4) that the Provincial Planning Act would be the main vehicle used to achieve ProvinLial land usepolicy objectives
Under the Provincial Planning ACl a designated planning area (which may be a single municipality groups of municipalities or a region) may draw up an official land use plan a statement of the development policies of the region It may include a map and text showing land use allocations The plan by itself does not indicate how any piece of property may be used Zoning and other bylaws however which state lpecifically what mayor may not be done on individual parcels of property must conform to an Official Plan The Province maintains ultimate review and veto authority over the regionalOfficial Plans (24)
An Official Plan is expected to remain flexible and is therefore subject to review and OImendment An amendment may represent an actual change in policy or a refinement of existing policy In e former instance the Official Plan would have to be changed before zonirigbylaws could be implemented to permit the new use In the latter instance the change would merely be added to the plan (24)
The Ontario Planning Act administered by the Ontario Ministry of Housing was originally devised to solve urban problems The Ontario Ministry of Agriculture however provides agricultural expertise as part of the development plan review process Although Official Plans have not been developed for all regions the ultimate goal is to have all settled areas of theProvince under a plan
13
The Ontario Ministry of Agriculture has been working to develop a more comprehensive agricultural land use program and guidelines under which agricultural considerations can be incorporated into local plans under the Planning Act The Ministry released a policy statement (21) in March 1976 specifying the governments commitment to preserve better agricultural land and to maintain the economic feasibility of using such land for agricultural purposes (42) These policy objectives could be achieved through Provincial commodity stabilization programs production expansion programs agricuhural economics research and development of a market value tax assessment to relieve the burden of real estate taxes on farmland
The preservation of better agricultural land would also be achieved through programs to encourage municipal developm~nt on poorer soils and to channel recreational and industrial development to lands less suited for agriculture The O~Hario Ministry of Agriculture is also committed to developing guidelines that apply agricultural interests to Official Regional Plans (21)
The guidelines presented in 1977 (22) specify that the CLI could be used to identify prime agricultural land Once the land capabilities are identitled the allocation of land among land uses should be evaluated This distribution of land should reflect the priority of agriculture however if agricultural capabilities exist If land is designated as agricultural it should be incorposhyrated into the Official Plan of the region and its supporting land use map High capability lands should be given the greatest protection and uses compatible to its long-term retention for agriculture should be specified Once agricultural land is incorporated into the Official Plan it can be used only for agricultural or agriculturally compatible purposes The agricultural use spedfication can be changed only if the Official Plan is amended Thus it is the ease or difficulty with which the Official Plan can be altered which detennines whether or not land remains agricultural
LAND TENURE PROGRAMS
Land tenure is an issue closely related to land use because land use combines human and land resource inputs The owner most frequently detershymines how the land will be utilized If ownership of a certain quality land is restricted to farmers the land will likely be used for agricultural production
Ownership Control
The owner-operated family farm is a concept traditional to North Amershyican agriculture Although the feudal land system did exist in Quebec during 1626-1854 immigrants left Europe for Canada to get away from the restricshytive feudal land tenure system A land system allowing maximum individual control evolved in Canada as a result (11)
Canadian settlement policies established the owner-operated family farm as the predominant form of agricultural production unit (25) Technological changes in agriculture resulted in an increase in the scale of farming and a shift from single proprietorship to partnerships or family corporations ~ These
Family corporations are farm corporatiuns in which the immediate family holds a majority of the shares resides on the farm and provides most of the labor
]4
changes have caused Concern about the economic survival of family farms their ability to compete with commercial corporations or communes and the effect of their decline on the rural community (3)
Boylan argues that there are three traditional forms of tenancy full owner part owner and tenant (5) The full owner has the most security and freedom for decisionmaking of the three tenure forms Full ownership facilitates the adoption of improved farming practices and effective longshyrange farm plans necessary for efficient usc of farm resources
Part owners and tenants rent or work on shares for others This type of tenure involves a lease in which the landlord conveys rights of use and possession of a given property for a deiiniw period of time in return for payme1t Rental contracts are based on Custom and tend to be fairly rigid Insecurity in rental tenure which results in the movement of operators from farm to farm often affects the efficiency of farm resource use Rental tenants typically do not make the long-term decisions necessary for continued effishycient agriculture such as those decisions relating to soil maintenance Consequently rental tenancy conflicts with social goals concerning the long-term existence of agriculture (5)
When nonresidents foreigners or commercial corporations own the land they often act as absentee landlords renting the land to farmers Foreign nonresident and commercial corporate ownership of agricultural land has thus been a focus of land tenure programs in Canada Foreign investors and commercial corporations with access to capital not available to Canadian family farmers are investing in land as a hedge against inflation Since they can use their capital resources to buy land at prices unrelated to the return from agricultural production they are perceived to be driving up the price of agricultural land (7) Family farmers with a smaller capital base thus find it increasingly difficult to compete for land resources needed for efficient agriculture Or to transfer land to the next generation of young farmers Sas katchewan Manitoba and Alberta hav( devdoped legislation to control foreign nonresident and commercial corporation ownership of land
Saskatchewan
The Saskatchewan Farm Ownership Act of 1974 as amended was developed on the premise that Provincial residents who were involved in day-to-day agricultural operations and who spend a major part of their time and agricultural income in the Province should control agricultural resources In addition they should be protected to some extent from capital resources accumulated in other industries or countries (29)
Under the Farm Ownership Act implemented by the Farm Ownership Board nonresidents and nonagricultural corporations7 are prohibited from owning more t~m 65 hectares or a quarter section Nonresidents need not dispose ofand held prior to 1974 or of holdings acquired between March 31
A resident is defined 15 one who lives in Saskatchewan for 18~ days or more a year or within 20 miles of the Saskatchewan border This includes US citizens who may own land on both sides of the border
An agricultural corporation is defined as a corporation primarily engaged in farming where at lea~t 60 percent of both the voting and nonvoting stock is owned by resident farmers (27)
1974 and September 15 1977 if the assessed value of the holdings for taxation is not greater than $15000 (27)
A nonresident holding land in excess of the amount stipulated in the Act has 5 years from the date of becoming a nonresident to dispose of the excess land unless he or she is a former farmer8 in which case the land may continue to be held regardless of residence status Former farmers may also transfer their land to direct relatives -- spouse child grandchild brother sister nephew niece or spouse thereof regardless of their residence status (27) Nonrsidents intending to become a resident within 3 years may with the permission of the Farm Ownership Board acquire more than 65 hectares during the 3-year period (27)
Nonagricultural corporations with holdings in excess of 65 hectares prior to March 31 1974 must dispose of the excess land by January 1 1994 and submit a land holding disclosure statement to the Farm Ownership Board
once a year (27) The Act is enforced by the Farm Ownership Board which may conduct
investigations into land ownership Anyone who does not comply with or impedes an investigation is subject to a maximum fine of $1000 Anyone found guilty of contravening the Act is liable for a $10000 fine a 6-month imprisonment or both A corporation violating the law IS subject to a maximum fine of $100000 every corporation officer involved is liable for a maximum fine of SI0000 a 6-month imprisonment or both The Board may also order nonresidents or nonagricultural corporations to divest of any land over that amount permitted (27)
A computer land registry system based on a survey of all rural municipalshyities providing information on 5000 nonresidents and 1000 corporations is used to enforce the Act The survey forms the basis of a continuing registry used to monitor land transfers (29) Legislation is being formulated requir ing residence to be declared as part of a land transfer
Manitoba Under the Manitoba Agricultural Lands Protection Act of June 1977 as
amended and administered by the Agricultural Lands Protection Board nonresidents9 may own no more than 8 hectares of land A nonresident can own land in excess of 8 hectares if it was owned prior to April 1 1977 or if right to the title for the land arose prior to that date (18)
If a corporation becomes a nonresident through the sale of shares or if a nonresident corporation acquires land in excess of 8 hectares through a legal settlement it has 2 years to dispose of the excess land The Board may take legal action to dispose of land acquired by a nonresident in excess of the amount stipulated if the nonresident has not done so within 2 years of
notification (J8) Investigations may be conducted to implement the Act Any person who
does not supply information requested is liable for a maximum fine of $500
A former farmer is defined as someone who at some time in the past lived in Saskatchewan and farmed the land for years
A Canadian resident is defined as a Canadian citizen or landed immigrant actually living in Canada or a corporation the majority of whose issued voting and nonvoting shares is owned by Canadian citizens permanently residing in Canada
16
Any individual or corporation contravening the law is liable for a maximum fine of $15000 In addition any corporaton officer responsible for contrashyvention of the law is liable for a maximum fine of $15000 Enforcement is ensured through Sworn declarations on citizenship attached to the land transfer (8)
Alberta
1 Foreigq ownership of land in Alberta is controlled by the Foreign Ownershyship of Land (temporary) Regulations established by an Order-in-Council under Section 33 of the Citizlnship Act on April 26 1977 These temporary regulations will eventually be supplanted by the Foreign Ownership of Land Regulations passed under the dual authorily of the Agricultural and Recreashytional Land Ownership Act and Section 33 of the Citizenship Act 10 (J)
Hnder the regulations ineligible persons-non-Canadians and temporary reSIdents-and corporations with 50 percent or more of their shares or memberships held by ineligible pernons cannot own more than 8 hecares of controlled land Controlled lapd is defined as any land oUfside the boundaries of a city town new inwn Village or summcmiddot village Controlled land however may be acquired by a foreign state for diplomatic or counsul purshyposes The area limitation does not apply to controlled land transferred through inheritance There are no restrictions on urban property (1)
Enforcement of the regulation is ensured by sworn declaration attached to land transfers and by investigative procedures carried out by the Foreign Ownership of Land Administration with use of information supplied by Land Titles Branch (1) Contravention of the law is subject to a maximum fine of $10000 imprisonment of up to 1 year or both Land that is acquired in contravention of the law may be sold by judicial sale Proceeds from the sale are used to cover sale expenses and any remaining funds up to the amount originally paid for the land are returned to the individual Any proceeds exceeding the amount originally paid for the land are put into the General Revenue Fund of Alberta l)
Transfer of Ownership
The transfer of agricultural land from One generation to the next is an integral part of maintaining the owner-operated family farm ensuring that future farmers are available to utilize the land preserved for agriculture (32) A start in farming however requires substantial capital resources As land prices continue to increase the need for capital for young farmers entering the industry becomes increasingly acute
Sallkatchewan
The Saskatchewan Land Bank established in 1972 by the Land Bank Act and administered by the Land Bank Commission was developed to alleviate some of the problems associated with the generational transfer of land Its objectives were to develop a viable agricultural industry in Saskatchewan and
IOAs of OCllb~r 1978 Bill 40 was not yet in effecl Regulations under Bill 40 however will not differ in intem fTOm the temporary regulations but will be more detailed
17
provide for a transfer of farms from generation to generation rather than have family farms absorbed by large farm units The Land Commission a government agency purchases land thereby absorbing the capital costs associated with land transfer It then rents the land to applicant farmers The land bank program provides continuous sales opportunities to Saskatchewan farmers and enables individuals to begin farming independently of substan tial fa~i1y assistance It also encourages the perpetuation of viable family farm units through the transfer of land to direct descendants (30)
Although the land bank program involves the transfer of land through rental tenancy efforts have been made to eliminate this type of transfers detrimental effects on efficient resource utilization Land Bank leases for example are long term and the Commission reimburses the lessee for capital improvements made during tenure which (it is expected) would provide the security necessary to make long term investment decisions to use resources efficiently
Under the program the Land Bank Commission may purchase land from anyone wishing to sell In instances where the Commission must allocate available funds among several offers for sale it will purchase by order of priority from farmers who (1) want to retire and transfer their land to a direct descendant (2) are selIing land that can be used to establish a viable farm unit (3) have large tracts of land on which two or more operators can be supported (4) have palcels of land constituting full units or (5) have no other sale alternative (3l)
The Commission purchases land at market value This is determined through an appraisal process in which the productive value of the cuhivated portion of the sale property is correlated with the productive value and sale price of cultivated properties of similar soil quality in the samt area The productive value is determined through lax assessment data Thus the Commission price is essentially determined by the relationship between prices of recent land sales in the area and the assessed value of the land for taxation purposes A similar process is used to determine the market value of grazing land Assessments are also made of the value of buildings and other improve ments on the property (31)
Land purchastd by the Commission is allocated to lessees on the basis of a point competitj~e system if there is more than one applicant for a given piece of land Applicants are scored on their income potential skill age vendors preference and potential disruption of existing farming enterprises The applicant must declare an intention to make farming the principal occupa tion and be of legal age a resident at the time of leasing and during tenure and a Canadian citizen or immigrant The applicants and spouses combined average annual income for the preceding 3 years must not exceed an amount annually determined by the Commission II The applicants and spouses net worth may not exceed $21000 in 1979 Applicants gain or lose points if their projected net income projected land base in work units or age is outnide the optimal range established by the Commission Points are gained for educa tion experience and for an indication from the vendor that the applicant is the preferred recipient of the land Points are lost for the average distance in
JJBa~d on (h~ composit ind~x of wag~ for Saska(ch~wan in 1977178 this amount was 520000 in 1979
18
II
miles ~-(iat the piece of land applied for is from other land units the applicant is farming (JJ)
Applicants scoring highest arc then intervilwld 10 assess their motivation management ability and other characteristic all of which arc also numershyically scored The applicant with the highest cumulative point score unless otherwise determined by the Commission is awarded the lease (31)
The llase remains in effect until the lessee reaches the age of 65 or dies The lessee may stipulate in writing if the least is to be passed on 10 a direct dlscendant After the age of 65 short-term leases may be granltd under certain circumstances
Since June 1 1978 rent is based on the production value of the land whierl is calculated from th( prices of oilseetis wheat and barley and thtlong-term yield of equal quality land in th area Prior to that time rent was based on a percentage of the lands market value The lessee is responsible for the payment of taxes (J])
Lessees have the option to purchase land after leasing from tht Commission for 5 years The land is sold to lessees at its market value at the time of sale Llssees purchasing land are entiLied to an earned homestead quarter refund made by the Commission on the purchase price of a quarter ~ection of land If the lessee lives on the rented land the inhabited quarter section is the section on which the refund is paid If the lessee does not live on the rented land a quarter section is designated as the humestead quarter on which the refund is paid The refund is 20 percent of the price paid by the purchaser for the qultrter section to a maximum of $5000 paid over a period of 5 years following the land transfer In order to receive the refund the purchaser must be actively engaged in farming and remain a bull esident of Saskatchewan during the 5 years or the balance Q1f the refund is forfeited (J1)
Buildings and improvements on the property are sold under a long-term agreement to the lessee When the lease expires the Commission purchases tht lessees earned equity based on the market value of the improvements thus ensuring that lessees receive the benefits of their investment decisions This combined with the homestead refund means that the lessee builds equity while renting from the Commission (31)
Effects of the Land Tenure Programs
During 1972-77 the Land Bank Commission acquired 354000 hectares of land for a total cost of S8l million This land as of December 31 1977 was being leased to 1912 ksse(s through 2009 leases (30)
In Saskatchewan nonresidents purchased a total of 59877 hectares in 1976 compared to 56769 hectares in 1977 (28)
Compiled data on foreign land transactions in Manitoba is unavailable (19)
In Alberta the amount of land purchases by non-Canadians and foreign corporations during 1976-77 as monitored under the Foreign Ownership of Land Regulations declined 60 percent DuringJanuarY-August 1978 foreign purchases were running 89 percent behind purchases for the same period in 1977 In 977 foreign purchases accounted for 2 percent of total area of rural sales compared to 5 percent of total rural sailS in 1976 (2)
19
LAND USE AND TENURE IN PERSPECTIVE
The dominant themes that emerge from the hind use and tenure programs are that Canadian farmland prices have been increasing and that these increases affect land allocation to agriculture and land tenure patterrs In order to fully assess these themes it is necessary to know (1) how much agricuturalland is actually being lost due to nonagricultural use (in this case urbanhiation) (2) what changes have occurred in land tenure patterns and (3) what factors influence farmland prices in Canada
Loss of Agricultural Land Through Urbanization
D M Gierman (15) has determined that during 1966-71 12801 hectares of class 1-4 agricultural land were irretrievably ca~yerted to urban use annually in Canada The highest rates of conversion Occurred in Ontario and Alberta where an average of 6199 and 2046 hectares respectively of class 1-4 agricultural land were annually converted (table 6) Over 80 percent of the land converted was formerly classified class 1-4 for agriculture The converted land however represents less than 1 percent of total class 1-4 landin those two Provinces
The annual loss of production due to the permanent reallocation of land to urban uses can be estimated by converting the amount of class 1-4 agriculshytural land annually incorporated into cities to a class 1 equivalent proporshytionately allocating the class 1 equivalent land to crops according to the 1976 cropping pattern and multiplying the area allocated to each crop by the potential yield for that crop on class 1 equivalent land (tables 7-10) Accordshying to these calculations losses of potential production due to the direct incorporation of land into cities in the short term (1 year) anc n the long run (20 years) assuming constant 1966-71 rates are relatively small in the three Prairie Provinces Loss of potential production due to land use changes in Ontario however is fairly substantial particularly in the long term DecHnes in production of the major crops in Ontario by 1996 could range from almost 4 percent of average production of tame hay to over 6 percent of rye (tables 7-10)
Manning and MCCuaig (21) quantified the amount of CLI class 1-4 agricultural land likely to be affected by urbanization by looking at CLI class 1-4 land within a 50-mile radius of 19 of Canadas major Census Metropolitan a Areas Fifty-four percent of Canadas class 1 land and 21 percent of Canadas class 1-4 land is within 50 miles of the specified areas Approxishymately 45 million hectares of class 1-4 land is located within the fringe areas of urban centers in Ontario Applying the same methodology used to detershymine the productive capacity of agricultural land directly incorporated into urban centers it is evident that the productive capacity of the urban fringe area in Ontario (table 7) exceeds present production levels for the Province
Census Metropolitan Areas as desirnated by Statistics Canada are urban areas with Over 100000 inhabitants The 19 areas are Edmonton Calgary Saskatoon Regina Winnipeg Thunder Bay Sudbury Windsor Toronto Kitchner St Catherines Hamilton LondonOttawa Montreal Quebec Chicoutini St John and Halifax
20
-------___I~
Table 6-Average annual conversion rates of rural land of vanous
agricultural capabilities to urban uses 1966-71
Province Total class
5-6
HectaresOntario 2496 1789 1503 41I 6199Manitoba 293 219 512538 409 5 952Saskatchewan 28 60 88127 63 29 219 8Alberta 4 12564 747 471 264 2046 165 186Other Provinces 35176 1285 827 1197 3385 498Total Canada 3136 4486 70 3263273 1906 12801 992 539 1531 - = not applicable
Source D M Gierman Rural to Urban Land Conversion Fisheries and Environment Canada Lands Directorate Occasional Paper No 16 Sept 1977
and is over 50 percent of the total production potential on all CLI class 1-4 land in the Province (table 2)
This means that a substantial quantity of agricultural land in Ontario is subject to change from agricultural to urban-oriented use The exact proporshytion of land that may actually change however cannot be determined from available information Although the potential for increased crop production in Ontario is substantial due to the combination of good land and favorable climate this potential is affected by competition between agriculture and urban development
The situation in the Prairie Provinces is considerably different The amount of land located in the fringe area of cities in Manitoba Saskatcheshywan and Alberta equals 14 30 and 27 miI1ion hectares respectively (21) The productive potential of this land is equal to about one-fourth to one-half of present production in Manitoba one-fourth in Saskatchewan and one-third in Alberta
Land Tenure
Total Canadian farm area has been declining-down about 14 million hectares or 2 percent during 1961-76 A 25-percent decrease in eastern Canada was partially offset by a 5-percent increase in western Canada Farmland declined about 13 million hectares in Ontario and increased 11 million hectares in Alberta Thus the amount of farmland is declining in eastern Canada which has the best agroc~imatic potential for food producshytion and increases in farmland are occurring in western Canada which has considerably less agroclimatic potential Land which can grow fruit vegeshytables and corn in eastern Canada is being replaced by land suitable for barley and hay in western Canada
Average farm size in Canada continued to increase during 1971-76 from 187 hectares to 201 hectares The largest increases in size occurred in Manitoba and Saskatchewan where farms increased 9 percent from 220 to 240 hectares and 342 to 374 hectares respectively
During 1971-76 the total number of farms declined about 18 percent (table 11) The percentage of farms fully operator owned in Canada declined
21
I
I
- - - -
- ~~ - ~~~
~
~ A_shy
f
Table 7-Ontario Estimated loss in crop production on class I equivalent land due to conversion to urban uses ~ rIClass 1 Productive capacity of converted agricultural land
~uivalent area ~ I yearCrop in cropo 20 yean Productive capacity of urban fringe ff
Iconverted annually Production on1Percentage of Production on IPercentage ofconvertwto urban wes average Class 1 ~uivalnt
areal converted average I Production on 1Percentage of H area in urbanproduction l area urban fringe 1~productionmiddot averagefringe ~Hectares areaSMetric tons Percent productionMetnc tons fiPercentWheat 1000 hectares 318 1000 metric tons 1704 Percent ~ Oats 028 t280 34080 55 ~958 229Barley 25 1227221 19160 50 199955 202Rye 24 691 ~ 34 19100 18249Com 947 31 2580 61
159 687 115 H129 8059 25 ~~Tame hay 1635 25 161180 49 95 22612263 682Fodder com 20518 245260 39 5804 11721756 1177Potatoes 22 882827 435120 14344Nl 810Other 21 373
Nl 1114 16200 41 15666 159- 19- 570- - 147Total 5094
802 - shy- -3668 - = not applicable
Class I equivalent area in crops converted annually to urban USe times potential yield on class I equivalent land (from table 2)
(1976 ara ti~es 1967middot76 yield) times 100 (Annual production on converted area)
Annual production on convened area times 20
(1976area times 1961middot76 yield) times 100 (Annual production on area converted oVer 20 years)
Area in urban fringe times potential yield on class I equivalent land (from table 2)
bull (1976 area ~imes 196776 v~eld) times 100 (Annual prodUcuon On urban fnnge area)
Sources D M Gierman Rural to Urban Land Conversion Fisheries and Environment Canada lands Directorate Occasional Paper No 16 September 1917 and E W Manning and j D McCuaig Agncultural Land and Urban Centres an Overview ofthe Significance ofUrban Centres to Canadas Quality Agricultural Land Fisheries and EnvironmentCanada lands Directorate july 1917
Table 8- Manitoba Estimated loss in crop production on class I equivalent land due to conversion to urban uses
CIa I Productive capacity of converted agricultural land equivalent area I year Productive capacity of urban fringeCrop 20 yranin crops
converted annually Production on Percentage of conv~rled CI I equivalentProduction on 1Percentage of
to urban uses average productiorn Percentage ofconverted averageareal production area in urban urban fringearca production averagefringe areaHeclares producrion1Melnc Ions Percenl Meine Ions Percent 1000 heclares Wheat 1000 melnc Ions 242 Percent702 ~~Oats 14040 05377 350246 03 1015 38Barley 4920104 57 113395 362~3 42Mixed grains 7900 59O 15232 578Rye 6
~ 640 45 16 43
15 51Buckwheat ~3 300 57 363 83 02 20 38Com 60 40I 44 ~ 4 27Tame hay 80 3389 2596 OS 8 33Fodder com 11920 51 2 45 ~2 129 864 3iFlaxSttd 900 43 - 33~ lt 50 3 67M Sunnower 1000 70 32 -shy Nl 3 3 02 48 72
Ra~d 60 33 51tJO 15 523 ~ 5~ Mustard seltd 460 49 28I 1
Other crops 15 I ~2 20 33 2
32 34 a--bullbullbull- 2 67Summer fallow 145 19
211 Total 746
~ 1083
- = not applicable
Class I equivalent area in crops converted annually to urban use times potential yield on class I equivalent land (from table 3)
(1976 area ti~es 1967middot76 yield) times 100 (Annual production on converted area)
Annual production on converted area times 20
(1976 area times 1967middot76 yield) 100 (Annual production on area converted over 20 years) times
Area in urban fringe times potential yield on class I equivalent Idnd (from table 3)
(1976 area ~imes 1967middot76 y~e1d) times 100 (Annual production on urban frmge area)
Sources D M Gierman RU1a110 Urban Land Conversion Fisheries and Environmem Canad Lands Directorate Oteasiona Paper No 16 September 1977 and E W Manning and J D McCuaig Agricullural Land and Urban Cenlres an Overview of Ihe Significance of Urban Cenlres 10 Canada S Qualily Agneullural Land Fisheries and EnvironmentCanada Lands Directorate July 1977
~
0
Table -Saltkatchewan timated I m nop pmduction on cia I luilent land due to conenio to uban u CI I n
Productive capacify of conerted agricuhural landequivalen areaCrop I year
20 yea in cropo
converted annually Productive capacity of urban fringeProduction on 1 Percentage of 10 urban ilia convrrtrd avrrage Productio on I Pecenage of
CI I equivllen area I production convltnrd avrragr Production on I ~
area in urban Percenage ofHectares arra Production urban fringe Meine Ions fringe avrrage Wheal Percent Meine Ions I aira l
67 Percent productionOars 194 JOoo heClares000Barley 6 19 3880 JOOO melne Ions
003 PercentII 00Rye 380 88442 I 00 03 2564
Tame hay 3 840 79 22 00 03 253
Rapeseed 8 54 60 148 22
~- 3 00 04 562Other crops 5 1080 14 22
~shy 4 00 04 35Nl 26Summer fallow 100 108 ~ ~ 67 -
03 72436 25 - 54
~ 39 12 Total area 167 887 - v_~middotmiddotshy bull- = not applicable - 2195
Class I equivalem area in crops converted annually to urban Use times potemial yielel on class I cquivalem land (from table 4) (1976 area ti~es 1967middot76 yield) times 100
(Annual produlttlon on converted area)
Annual production on convened area limes 20
(l976aa times 1967middot76 yield) times 100 (Annual production on area converted over 20 years) I
Area in urban fringe times potential yield on class I equivalem land (from table 4)
(1976 area ~imes 1967middot76 yeld) times 100 (Annual production on urban frmge area)
j D M G~bull tlt Ubo Lo Cmbull yh ~_ Co t n~ Ocroo P N p nood E W M
Canada Lands Directorate July 1977 J D Mabullbull _ Uoo C_ M C Qoooo1 Lo ood bullbullbull0 I ~ of U COO
I--------~~-==o~~~~~~~~
f shy
~~~tmiddotmiddot ~ -
~ Table lO-Alberta Estimated loss in crop production on class 1 equivalent land due to conversion to urban uses lt
I
CI I Productive capadly of coverred agriculrural land equivalent area
Crop I yenin cropo 20 yean Productive capacity of urban frin~ converled annually Production on JPercenta~ of
to urban IUeI onyerred ayeta~ Producrion on - Percenta~ of CI I equiyalentconverted avera~ Production onarea I production t I Percenta~ ofarea in urban arr~J production urban fringr
Hectares fringr averageMelnc Ions arealPercent Melnc Ions I produclionWheat Percent364 1000 hecla resOats 1056 003 JOOO melric Ions Percent118 21120Barley 378 05203 451370 7560 1308Mixed grains 1406 03 52 146 32
18 28120 467Rye 58 57 3202 45712 1160 1737Tame hay 30 03 48 3522250 600 70Flaxseed 1675 55 2903 155 33500 38Rapeseed 8 60 3503 31049 160 2077Mustard d 74 03 57 6 37NI I 1480 tJ1 Other crops I 01 53 9 326049 20 90Summer fallow - 2 32-- 424
25 2- - - 61 25
~ - -Total 1660 - ~- - not applicable 2055----- -
525
lt-Class I equivalent area in crops converted annualy 0 urban u limes potential yield on class I equivalent land (from table 5)
(1976 area ti~es 1967-76 yield) times 100 (Annual producuon on converted area)
-1
Annual production on convened area times 20
(1976 area times 1967-76 yield) 100 (Annual production On area convened over 20 years) Urnes bull
Area in urban fringe times potential yield on class I equivalent land (from table 5)
bull (1976 area ~imes 1967-76 veld) times 100 (Annual produclJon on urban frmge area) j
Sources D M Giennan Rural 10 Urban Land Conversion Fisheries and Environment Canada Lands Directorate Occasional Paper No 16 September 1977 and E W_ Manning and Canada Lands Directorate July 1977 J D McCuaig Agnculural Land and Urban Centres an Qnew of Ihe Significance of Urban Cenlregt 10 Canada Qualily AgrIcultural Land Fisheries and EnvironmentI
I ----~~~i~~
I
Table II - Number and proportion of census farms by tenure of operator 1971 and 1976
OwnerProince Part Owner1971 1 1976 1 1971 1 1976 1 1
1971 1 1976 1 1971 1 1976 Number Percentage of
total Number Percentage of Ontario 691162 total501165 i4Manitoba 66 1987721608 2171517238 2162 28Saskatchewan 58 1118441499 1073436612 54 32 36Alberta 53 3009737193 2739833584 3959 39Canada 59 21284251066 20206189063 3469 63 35---------------- 95862 93757 26 31Tenant
-I97I-=C-imi-J 1971 1 Total-shy
1976J J 1971 1 1976 Number Percentage of
Ontario total Number49113 4403 5Manitoba 62189 947221991 76983Saskatchewan 6 75374 349815568 29963Alberta 7 84225 769703520 69578Canada 7 619200 6270217298 573105 6 366128 300118
Source R Davianlt Selected Agricultural Statistics for Canada Agriculture Canada Ottawa1977
from 69 percent of the total number of farms in 1971 to 63 percent of the total in 1976 and the number of farms partly owned or fully rented by the operator increased from 26 to 31 percent and 5 to 6 percent of the total number of farms respectively The percentage of owner-operated farms in Alberta and Saskatchewan remained about the same during 1971-76 although the total number of owner-operated farms in Canada declined The largest decreases in the percentage of owner-operated farms oCcurred in Manitoba and Ontario where the percentage of owner-operated farms declined from 62 to 58 percent and 74 to 66 percent respectively during 1971-76 (table II)
Farmland Prices
Canadian farmland prices increased 121 percent in nominal terms during 1971-76 from an average of $24631 per hectare to an average of $54372 per hectare The largest increases in farmland price occurred in Ontario where farm prices increased 150 percent from an average of $80240 per hectare in 1971 to an average of $2007_01 in 1976 The smallest increases Occurred in Manitoba where farm price increased 94 percent from an average of $17865 per hectare in 1971 to $34638 in 1976
Price reflects the intersection of demand for and supply of land Thus the allocation of land between divergent uses relates to the cumulative effect of the demand for those uses upon its price Farmland price is affected by the interaction of farm and nonfarm demand Farm purchasers are defined as those individuals for whom the price of land is determined by past and expected returns from the land for agricultural production Nonfarm purshychasers are individuals for whom the price of land is determined by past and
26
expected returns from the land for other than agricultural purposes (13) Foreign purchasers of land are considered nonfarm buyers when the price at which they are willing to buy land is determined by economic conditions in their domestic economy rather than returns from Canadian agriculture even if the land they purchase remains in agriculture through tenant farming
The determinants of farmland price relating to nonfarm demand include the presence of minerals for extraction forests population pressure on use of the land which is manifest in urbanization construction of transportation systems speculation and recreational or residential construction Those relating to farm demand for land include farm income pressures to enlarge farm holdings and advances in agricultur~1 technology (13)
Land prkes are an underlying focus of Canadian agricultural land programs particularly since the impact of nonagriculturally oriented demand on land prices influences the allocation of land away from agriculshyture and affects preferred land tenure patterns The land use and tenure programs therefore deal with the effects of urban-oriented and foreign or nonresident nonfarm purchasers on land prices use allocation and tenure ptterns
Since farmland prices are determined by a combination of farm and nonfarm demand the question arises as to their relative effects on Canadian farmland prices (table 12) The effects of farm and nonfarm demand on farmland prices were estimated by means of an econometric model Because Canadian programs focus on the effect of urban oriented nonfarm buyers on land price the number of urban and rural nonfarm residents in each of the Provinces (Ontario Manitoba Saskatchewan and Alberta) was used as a proxy for nonfarm demand (table 13) It was assumed that each additional urban and nonfarm rural resident represents potential demand for residences transportation or other nonagricultural uses Net farm income was used as a measurement of the effect of farm demand on land prices (table 14) It was assumed that the supply of land is constant and that the impact of a change in farm income on land prices is distributed over a 2-year period following the year of the change T~e analysis is for the period 1960-76
The following equation was used
Yil = a j + t3 iX 1iI-1 + YiX 1iI-2 + OiX2il + Ei
where Y farmland price in real terms = total Canada (C) Alberta (A) Manitoba (M) Ontario (0)
and Saskatchewan (S) X I net farm income in real terms
urban and nonfarm rural populationX2
The parameters of the above equation were estimated by ordinary least squares regression for each of the four Provinces and total Canada with the following results
ii DW CV
YC = 1
-20126 + 17024 XI CI-I (431)
+ 21009 XI CI-2 + 17765 X ZC1(477) (1067)
097 156 3
YA1 = -11673 + 05628 XI AI-I + 2174 XI AI-Z + 29117 X ZA1(210) (376) (080) 094 170 4
27
~ ~~ 1
l~
YM I = - 95S11 + 0917S XI M I_I + 12098 XI M 1-2 + 28765 X M 077 188 7(175) bull (l7S)middot (159)z 1
YObullI = -10214 + 45268 XI 01-1 + 30839 XI 01-2 + 17994 X 0 I z 096 207 6(395) (242) (754) bull
Y51 = -9501 + 11926 Xl 51-I + 16129X _ + 19218XI5I Z(351) bull (406) bull (507)ZS1 089 167 6
IIe elasticities of the two explanatory variables for each of the four Provinces and total Canada are as follows
Province XI XI Ontario 70 161Manitoba 29 117Saskatchewan 39 220Alberta 28 74Total Canada 44 135
Results of the analysis indicate that the two variables were significant and accOunted for most of the variation in land prices during 1960-76 The
Table 12 - Value of farmland deflated by CPI
Year c Ontario ManitobaI Saskatchewan Total Canada
Million dollars 1960 4172 1312 30481961 2748 148474415 1350 31021962 5238 1444
2177 1527438881963 3570 175725244 1546 43921964 5551 1735
3847 184604952 4240 19960
1965 5782 1967 56941966 6153 2100 4785 21858
62421967 6824 5109 234482250 66611968 7554 2305 5520 25II8
65541969 8398 5756 262272046 5539 5395 25466 1970 7667 2129 59671971 7718 2046
54II 2564057591972 5256 251817688 1952 54961973 8671 2076
5071 247045917 53141974 10173 267832387 6675 6152 30914
1975 II586 2456 78311976 12567 6780 345362666 8742 6950 37204 Sources Statistics Canada Quarterly Bulletin ofAgncultura Statistics Ottawa various issues
28
-----shy~
Table 13-Urban and rural nonfarm population 1960-76 1
OntarioYear Manitoba Saskatchewan Alb~~-Id~t-~-ana a
~ -~~ -bull----Thousands
1960 5590 739 ~~ 10201961 5730
610 15801 1962 5873
750 620 1046 16165760 6311963 6020 1072 16537771 1964 617]
1J41 1099 16917782 652 ] 126 17306 1965 6325 793 6631966 1154 177046479 803
10 1967 6654 818 675 1185 181016821968 6833 834
1230 18535 ]969 7018
689 1277 IS9S0 849 696 1325 19435 1970 7207 865 1971 7404
703 1376 19902880 7101972 7515 888 1427 20406
7131973 7627 1469 20712896 717 15111974 7742 904 720 21022
1555 21338 1975 7858 9]2 7241976 7985 1600 21658920 728 1648 21958
The data for intercensual years is determined from the average annual rate of increase in population extrapolated between the census years 1961 1966 1971 1976
Sources Statistics Canada Canada Year Book Ottawa various issues Canada 1971 Censwof Canada Population Urban Rural Distnmiddotbutions Ottawa
elasticities for the number of nonfarm population are greater (ranging from 74 to 220) than the elasticities for farm income (ranging from 28 to 70) indicating that the percentage change in farmland prices related to the percentage change in the number of nonfarm population is greater than that relative to the percentage change in farm income The rate of change in the number of nonfarm population in any time period however is rele~ively small in comparison to the rate of change that can Occur in farm income during specified periods During 1972-75 for example the rate of increase in nonfarm population was 05 percent in Saskatchewan while the rate of increase in farm income during that period was 40 percent Thus given the specified elasticities for the two variables for Saskatchewan farm income accounts for 94 percent of the increase in farmland prices while the number of nonfarm purchasers accounts for 6 percent of the increase assuming no further increases in farm income in the next 2 years In addition the total cumulative effect of the increases in net farm income on land prices would not occur until 2 years after the final increase The annual percentage increase in land prices (1972-75) are attributed to
29
Jbull I
Province Net farm income Nonfarm purchasers of land
Ontario 85 15Manitoba 86 14Saskatchewan 94Alberta 6
75 25Total Canada 77 23
Thus during 1972middot 75 net farm income had a greater impact on land prices than the number of nonfarm purchasers of land
Table 14 Net farm income deflated by CPI
Year Oodo IMOOb] Skhewo IAlb ~[~~ Total
Canada Million dollars
1960 1961 1962 1963 1964
586 609 673 593 550
216 105 322 215 306
667 199 914
1062 643
399 400 549 564 456
2396 1838 2990 2924 2427
1965 1966 1967 1968 1969
620 833 647 689 710
31~ 258 284 296 212
885 1009
620 802 714
558 653 494 615 459
2893 3416 2584 2999 2690
1970 ]971 1972 1973 1974
1975 1971j
681 545 703 947
1046
1074 813
146 254 266 494 405
464 359
370 710 590
1191 1357
1616 1423
379 410 520 886 941
960 722
2156 2405 2662 4339 4568
4886 4040
CONCLUSIONS
Although potential for major losses in Canadian agricultural production exists particularly in Ontario this docs not necessarily mean that this land will be lost to production Measurable losses due to urban pressures appear to be small losses in the urban fringe may be larger but cannot be pinpointed If current rates of changtmiddot do not ac-dclatc precipitously pOFulation pressures
30
probably will not be a major factor affecting Canadas competitive position in world wheat trade Evidence indicates that Canada does have the capability to increase wheat production under current cropping patterns to 32 million tons The continued attrition of farmland in Ontario however could be reflected in increased US exports of those products formerly produced in Ontario such as fruit
The rapid increase in farmland prices per se may not necessarily mean that agriculture is facing difficulty in competing with urban development for use of the land Evidence indicates that high product prices are capitalized into land accounting for its increase in price The changes in tenure patterns that have occurred between the 1971 and 1976 Census of Agriculture may also be a reflection of increased returns from agriculture as farmers move to increase their land base quickly by renting in order to take advantage of high productprices
Land use-programs such as the one implemented by the British Columbia Land Commission Act apparently can stop the reallocation of agricultural land to urban uses If the general economic environment is not conducive to the allocation of agricultural land to production however maintaining that land for future agricultural use may require a substantial social investment
REFERENCES
(1) Alberta Department of Energy and Natural Resources The Agricultural and Recreational Land Ownership Act Explanatory bulletin undated
(2)
Foreign Ownership of Land Administration Unpublished data
(3) Alberta Land Use Forum Report and Recommendatio7lS Jan 1976
(4) Beaubien Charles and Ruth Tabacnik
People and Agricultural Land Science Council of Canada Ottawa June 1977
(5) Boylen Diana M
Rural Land Tenure Alberta Land Use Forum Ttchnical ReportNo 6B 1975
(6) British Columbia Government of Land Commission Act
(7) Brown Jacob
Our Home and Native Land Extent and Implications of Foreign Land Ownership The IlgrgISt Vol 711 winter 1978
31
~
l 11 l
(8) Canada Grains Council
Statistical Handbook Various issues
(9) Davianlt R
Selected Agricultural Statistics for Canada Agriculture CanadaOttawa 1977
(10) Environment Canada Lands Directorate
Land Capabilz~y for Agriculture Canada Land Inventory Prelim inary Report Apr 1976
(II) Esau Alvin A J
Land Ownership Rights Law and Land an Overview Alberta Land Use Forum Summary Report 9 Edmonton 1974
(12) FederalProvincial Committee on Foreign Ownership of Land Report to the First Minirters Conference Canadian Intergovernmental Conference Secretariat Aug 1974
(13) Gale John E
What Makes Farm Real Estate Prices Agricultural Finance Review Vol 24 June 1963
(14) G(no BarbaraJ and Larry M
Food Production in the Canadian Environment Science Council ofCanada Ottawa Dec 1976
(15) Gierman D M
Rural and Urban Land Converslon Occasional paper no 16 Fisheries and Environment Canada Ottawa Sept 1977
(16) Hudson S C
A Review of Farm Income Stabilization in British Columbia A Report to the Minister of Agriculture Oct ]977
(17) Jean Clancy V
Land Use Income Assurance Linked in British ColumbiaForeign Agriculture March 22 1976
(18) Manitoba Governmltgtnt of
Agricultural Lands Protection Act Winnipeg
(19) Manitoba Agricuitur Lands Protection Board Unpublished material Winnipeg
(20) Manning E W and S Eddy
The Agricultural Land Reserves of British Columbta an Impact Analysis Fisheries and Environment Canada forthcoming publication
32
(21) Manning E W and J D McCuaig Agricultural Land and Urban Centres an Overview of the Signifimiddot cance of Urban Centres to Canadas Quality Agricultural Land Fisheries and Environment Canada Lands Directorate July 1977
(22) Ontario Ministry of Agriculture and Food Green Paper on Planning for Agriculture Food Land Guidelines Ontario 1977
(23) _____
A Strategy for Ortario Farmland March 1976
(24) Ontario Ministry of Housing A Guide to the Planning Act Ontario
(2gt Parlby G B The Family Farm i71 Alberta its Origins Development Future Alberta Land Use Forum Summary Report 1 Edmonton 1974
(26) Rees W E The Canadian Land Inventory in Perspective Fisheries and Envimiddot ronment Canada Ottawa March 1977
(27) Saskatchewan Government of Farm Own~~rs7ttp -Jt~~-middotRgina
(28) Saskatchewan Farm Ownership Board Unpublished data Saskatoon
(29) _____
First Annual Report Saskatoon 1975
(30) Saskatchewan Land Bank Commission Annual Reports Various issues Regina
(31) ____
Saskatchewan Land Bank Regulatiolls Regina June 1978
(32) Saskatchewan Land Use Policy Committee Land Use In Saskatchewan Agricultural Land Fact Sheet No7 Regina
(33) Shields J A and W S Ferguson Land Resources Production Possibilities and Limitations for Crop Production in tht Prairie Provinces Oz1seed and Pulse Crops in Western Canada Westtrn Cooperativts Ftrtilizers Limited Calgary 1975
33
bull
(34) Shields J A and J L Nowland
Additional Landfor Crop Production Canada Proceedings of the 30th Annual Meeting of the Soil Conservation Society of America San Antonio Aug 1975
(35) Statistics Canada Canada Year Book Ottawa various issues
(36) _____
Census of Agriculture Ottawa various years
(37) _____ loy
Census of Population and Urban Rural Distribution Ottawa
various years
(38) _____
Net Farm Income Ottawa various issues
(39) _____
Quarterly Bulletin of Agricultural Statistics Ottawa various issues
(40) US Department of State Various reports from US Embassy Ottawa
(41) Ward Neville E
Land Use Programs in Canada British Columbia Fisheries and Environment Canada Ottawa July 1976
(42) _____
Land Use Programs in Canada Ontario Fisheries and Environshyment Canada Ottawa September 1977
US GOVERNMENi PRINTING OFFICE 19790_ 630-3902563 REGION 31
34

I
I British Columbia
The British Columbia agricultural land use program implemented by the Land Commission Act was one of the first comprehensive attempts on the part of a Province to redirect the process of agricultural land allocation to nonagricultural uses British Columbia consists of a series of north-south mountain ranges with 90 percent of the land mountainous and nonarable Agriculture is limitd to the narrow fertile valleys between the mountains The af~roclimatic characteristics of the valleys however are conducive to producing such spedalty crops as soft fruits grapes and tobacco (20) Becallse crops are produced in the intermontane valleys to which access is restricted by mountains or sea British Columbia farms are relatively small highly specialized and faced with major transportation constraints (16) The average farm size is 126 hectares compared to an average of 201 hectares for total Canada and 374 hectares for Saskatchewan Rapid population growth has led to competition for use of the same topographically limited land this competition has resulted in land prices rising higher than is warranted by the lands agricultural productive potential (16)
The Provincial Government became increasingly concerned about the Provinces ability to produce food on a very narrow land resource base that was being affected by urban development during the early seventies British Columbia is highly dependent on imported food to meet local demand The Government recognizing the Provinces high dependency on outside supply became more sensitive to keeping future land use options open It soon sought a way to plan urban land uses in a more orderly way while preserving remainshying farmland (41)
In December 1972 the Provincial Government placed a moratorium on all future use of certain agricultural land for purposes other than farming Two Orders-In-Council one in December 1972 and one in January 1973 proshyhibited changes in use of land over 081 hectare classified as farmland for taxation zoned for agriculture or designated as having CLI capability of 1-4 (20) Land did nut have to be in actual agricultural production to be affected by the moratorium only to fit into one of the categories (41) Bill 42 the Provincial Land Commission Act as introduced in February 1973 aimed to preserve agriculturallrlrd for farm use and establish and maintain the family farm bull Farm use was defined as the occupation or use of agricultural land for genuine farm purposes as well as certain other uses compatible with the preservation of land for farm use (26)
Section 2 of the Land Commission Act created the Land Commission a five-member board which would establish agricultural land reserves (ALR) in tle 28 regional districts of the Province The land reserves were to include all land capable of sustaining agriculture-that is all CLI class 1-4 land which had not been irreversibly developed If nonagricultural land was not immedishyately available for urban expansion land sufficient for 5 years of urban growth was excluded from the reserve Lower capability land was included in the reserve where there was evidence that it could be used successfully in conjunction with class 1-4 land Class 7 land was included in those instances
41n September 1977 the Land Commission Act was amended the Land Commission title changed to the Agricultural land Commission and its agricultural orientation strengthened
11
f ~
f J
~~r~~~~-~-~~1lmIf
gtI
where excluding it would result in nonagricultural use of an otherwise agricultural area (20) Land was also exempt from the reserve if it had been continuously used for a nonagricultural purpose 6 months prior to December 21 1972 (4)
The Provincial Government maintained review and veto power over the ALRs developed by the regional districts As the Provincially approved ALR plans came into effect they replaced the previous moratorium on land use (20) Land designated as part of an AJR cOllld not be used for any purpose other than farming except as permitted by the Land Commission Act or by order of the Commissiun (6) Proredures were established for appealing an ALR d1signation All ALR plans were completed by 1975 and as ofJanuary I 1978 the total area within the ALRs was 47 million hectares (20)
The Provincial Government recognized that by limiting the use of land to agricultural purposes it was denying farmers the opportunity to cash in on the increased value of their land (16) Land sales often served as a form of farm retirement pension On the other hand it was argued that farmers should make a living from farming not land speculation and that proceeds from that living should permit them to retire on a decent income (4)
The British Columbia Farm Income Assurance Program (FlAP) was introduced in November 1973 as a corollary to the Land Commission Act It provides income protection for farmers operating under an ALR plan with producers contributing one-third and the Provincial Government two-thirds of the premiums to an assurance fund Indemnities are paid out of the fund when market returns fall to a specified percentage of the basic cost of producshytion which is calculated to include labor management depreciation interest on investment and cash operating costs (16) The programs which are effective for 5 years have operated for fruit trees beef dairy hogs field tomatoes greenhouse vegetables table eggs broiler hatching eggs sheep blueberries and potatoes (J 7) As of September 1977 $89 million had been paid under the program to about 5000 producers representing average payments of $17800 per producer
The British Columbia land use program has been in effect long enough to make an assessment of its impact on land allocation to urban and agricultural uses Manning md Eddy (20) found that the British Columbia ALR did bring about a major shift in the location of new residential and commercial development The ALR also prevented much change in land use within its boundaries The rate of subdivision within the ALR for example was considerably lower than in undesignated areas
The designation of land as agricultural within an ALR plan however was not enough to assure that the land was actually used for agricultural producshytion In the short-term period of the study much middothe ALR land was left idle because returns from farming were insignificc 11 in elation to the costs of capital investment on land purchased at prices refle~i 1emand for the land for urban subdIljsions (20) If economic conditi - ~ not conducive to allocating land to agricultural production opportunity costs are incurred by keeping land in agriculture and even more by leaving it idle Both the British Columbia and Ontario agricultural land use programs incorporate farm income stabilization programs which in effect represent a sociol payment to farmers for not reallocating their land to alternative uses The British
12
l
Columbia program has apparently been successful in keeping land In agriculture although at a relatively high social cost
Ontario
Ontario is the home of a major part of the Canadian population and is the countrys industrial center It is similar to British Columbia in its agloclimatic capability of producing a wide range of specialty crops including corn soybeans soft fruit and tobacco which cannot be produced dsewhere domestically as efficiently Ontarilt however does not face the oilstraints imposed on British Columbia by its rugged topography Most of Canadas prime agricultural land is located in Ontario and transportation to markets and Sources of inputs is not a major cost of production as in British Columbia The Province does experience intense competition for use of prime agriculshytural land Speculation and nonfarm investment stemming from urbanshyoriented population pressures are identified as major factors driving up the price of land making it difficult for farmers in the Province (21)
rhe Ontario Government has not placed a moratorium on use of farmland as in British Columbia (42) Like the latter however one of the motives for Ontarios developing a land use program to preserve agricultural land was to reduce future dependence on other nations for those commodities which can be produced within the Province (22)
Ontario agricultural land use programs were developed on the premise that (1) land use will be determined by the operation of the market place to the greatest extent possible (2) that tradeoffs will be made between economic growth and desired land use patterns (3) that land use programs be conshyducted and enforced at the local municipal level and (4) that the Provincial Planning Act would be the main vehicle used to achieve ProvinLial land usepolicy objectives
Under the Provincial Planning ACl a designated planning area (which may be a single municipality groups of municipalities or a region) may draw up an official land use plan a statement of the development policies of the region It may include a map and text showing land use allocations The plan by itself does not indicate how any piece of property may be used Zoning and other bylaws however which state lpecifically what mayor may not be done on individual parcels of property must conform to an Official Plan The Province maintains ultimate review and veto authority over the regionalOfficial Plans (24)
An Official Plan is expected to remain flexible and is therefore subject to review and OImendment An amendment may represent an actual change in policy or a refinement of existing policy In e former instance the Official Plan would have to be changed before zonirigbylaws could be implemented to permit the new use In the latter instance the change would merely be added to the plan (24)
The Ontario Planning Act administered by the Ontario Ministry of Housing was originally devised to solve urban problems The Ontario Ministry of Agriculture however provides agricultural expertise as part of the development plan review process Although Official Plans have not been developed for all regions the ultimate goal is to have all settled areas of theProvince under a plan
13
The Ontario Ministry of Agriculture has been working to develop a more comprehensive agricultural land use program and guidelines under which agricultural considerations can be incorporated into local plans under the Planning Act The Ministry released a policy statement (21) in March 1976 specifying the governments commitment to preserve better agricultural land and to maintain the economic feasibility of using such land for agricultural purposes (42) These policy objectives could be achieved through Provincial commodity stabilization programs production expansion programs agricuhural economics research and development of a market value tax assessment to relieve the burden of real estate taxes on farmland
The preservation of better agricultural land would also be achieved through programs to encourage municipal developm~nt on poorer soils and to channel recreational and industrial development to lands less suited for agriculture The O~Hario Ministry of Agriculture is also committed to developing guidelines that apply agricultural interests to Official Regional Plans (21)
The guidelines presented in 1977 (22) specify that the CLI could be used to identify prime agricultural land Once the land capabilities are identitled the allocation of land among land uses should be evaluated This distribution of land should reflect the priority of agriculture however if agricultural capabilities exist If land is designated as agricultural it should be incorposhyrated into the Official Plan of the region and its supporting land use map High capability lands should be given the greatest protection and uses compatible to its long-term retention for agriculture should be specified Once agricultural land is incorporated into the Official Plan it can be used only for agricultural or agriculturally compatible purposes The agricultural use spedfication can be changed only if the Official Plan is amended Thus it is the ease or difficulty with which the Official Plan can be altered which detennines whether or not land remains agricultural
LAND TENURE PROGRAMS
Land tenure is an issue closely related to land use because land use combines human and land resource inputs The owner most frequently detershymines how the land will be utilized If ownership of a certain quality land is restricted to farmers the land will likely be used for agricultural production
Ownership Control
The owner-operated family farm is a concept traditional to North Amershyican agriculture Although the feudal land system did exist in Quebec during 1626-1854 immigrants left Europe for Canada to get away from the restricshytive feudal land tenure system A land system allowing maximum individual control evolved in Canada as a result (11)
Canadian settlement policies established the owner-operated family farm as the predominant form of agricultural production unit (25) Technological changes in agriculture resulted in an increase in the scale of farming and a shift from single proprietorship to partnerships or family corporations ~ These
Family corporations are farm corporatiuns in which the immediate family holds a majority of the shares resides on the farm and provides most of the labor
]4
changes have caused Concern about the economic survival of family farms their ability to compete with commercial corporations or communes and the effect of their decline on the rural community (3)
Boylan argues that there are three traditional forms of tenancy full owner part owner and tenant (5) The full owner has the most security and freedom for decisionmaking of the three tenure forms Full ownership facilitates the adoption of improved farming practices and effective longshyrange farm plans necessary for efficient usc of farm resources
Part owners and tenants rent or work on shares for others This type of tenure involves a lease in which the landlord conveys rights of use and possession of a given property for a deiiniw period of time in return for payme1t Rental contracts are based on Custom and tend to be fairly rigid Insecurity in rental tenure which results in the movement of operators from farm to farm often affects the efficiency of farm resource use Rental tenants typically do not make the long-term decisions necessary for continued effishycient agriculture such as those decisions relating to soil maintenance Consequently rental tenancy conflicts with social goals concerning the long-term existence of agriculture (5)
When nonresidents foreigners or commercial corporations own the land they often act as absentee landlords renting the land to farmers Foreign nonresident and commercial corporate ownership of agricultural land has thus been a focus of land tenure programs in Canada Foreign investors and commercial corporations with access to capital not available to Canadian family farmers are investing in land as a hedge against inflation Since they can use their capital resources to buy land at prices unrelated to the return from agricultural production they are perceived to be driving up the price of agricultural land (7) Family farmers with a smaller capital base thus find it increasingly difficult to compete for land resources needed for efficient agriculture Or to transfer land to the next generation of young farmers Sas katchewan Manitoba and Alberta hav( devdoped legislation to control foreign nonresident and commercial corporation ownership of land
Saskatchewan
The Saskatchewan Farm Ownership Act of 1974 as amended was developed on the premise that Provincial residents who were involved in day-to-day agricultural operations and who spend a major part of their time and agricultural income in the Province should control agricultural resources In addition they should be protected to some extent from capital resources accumulated in other industries or countries (29)
Under the Farm Ownership Act implemented by the Farm Ownership Board nonresidents and nonagricultural corporations7 are prohibited from owning more t~m 65 hectares or a quarter section Nonresidents need not dispose ofand held prior to 1974 or of holdings acquired between March 31
A resident is defined 15 one who lives in Saskatchewan for 18~ days or more a year or within 20 miles of the Saskatchewan border This includes US citizens who may own land on both sides of the border
An agricultural corporation is defined as a corporation primarily engaged in farming where at lea~t 60 percent of both the voting and nonvoting stock is owned by resident farmers (27)
1974 and September 15 1977 if the assessed value of the holdings for taxation is not greater than $15000 (27)
A nonresident holding land in excess of the amount stipulated in the Act has 5 years from the date of becoming a nonresident to dispose of the excess land unless he or she is a former farmer8 in which case the land may continue to be held regardless of residence status Former farmers may also transfer their land to direct relatives -- spouse child grandchild brother sister nephew niece or spouse thereof regardless of their residence status (27) Nonrsidents intending to become a resident within 3 years may with the permission of the Farm Ownership Board acquire more than 65 hectares during the 3-year period (27)
Nonagricultural corporations with holdings in excess of 65 hectares prior to March 31 1974 must dispose of the excess land by January 1 1994 and submit a land holding disclosure statement to the Farm Ownership Board
once a year (27) The Act is enforced by the Farm Ownership Board which may conduct
investigations into land ownership Anyone who does not comply with or impedes an investigation is subject to a maximum fine of $1000 Anyone found guilty of contravening the Act is liable for a $10000 fine a 6-month imprisonment or both A corporation violating the law IS subject to a maximum fine of $100000 every corporation officer involved is liable for a maximum fine of SI0000 a 6-month imprisonment or both The Board may also order nonresidents or nonagricultural corporations to divest of any land over that amount permitted (27)
A computer land registry system based on a survey of all rural municipalshyities providing information on 5000 nonresidents and 1000 corporations is used to enforce the Act The survey forms the basis of a continuing registry used to monitor land transfers (29) Legislation is being formulated requir ing residence to be declared as part of a land transfer
Manitoba Under the Manitoba Agricultural Lands Protection Act of June 1977 as
amended and administered by the Agricultural Lands Protection Board nonresidents9 may own no more than 8 hectares of land A nonresident can own land in excess of 8 hectares if it was owned prior to April 1 1977 or if right to the title for the land arose prior to that date (18)
If a corporation becomes a nonresident through the sale of shares or if a nonresident corporation acquires land in excess of 8 hectares through a legal settlement it has 2 years to dispose of the excess land The Board may take legal action to dispose of land acquired by a nonresident in excess of the amount stipulated if the nonresident has not done so within 2 years of
notification (J8) Investigations may be conducted to implement the Act Any person who
does not supply information requested is liable for a maximum fine of $500
A former farmer is defined as someone who at some time in the past lived in Saskatchewan and farmed the land for years
A Canadian resident is defined as a Canadian citizen or landed immigrant actually living in Canada or a corporation the majority of whose issued voting and nonvoting shares is owned by Canadian citizens permanently residing in Canada
16
Any individual or corporation contravening the law is liable for a maximum fine of $15000 In addition any corporaton officer responsible for contrashyvention of the law is liable for a maximum fine of $15000 Enforcement is ensured through Sworn declarations on citizenship attached to the land transfer (8)
Alberta
1 Foreigq ownership of land in Alberta is controlled by the Foreign Ownershyship of Land (temporary) Regulations established by an Order-in-Council under Section 33 of the Citizlnship Act on April 26 1977 These temporary regulations will eventually be supplanted by the Foreign Ownership of Land Regulations passed under the dual authorily of the Agricultural and Recreashytional Land Ownership Act and Section 33 of the Citizenship Act 10 (J)
Hnder the regulations ineligible persons-non-Canadians and temporary reSIdents-and corporations with 50 percent or more of their shares or memberships held by ineligible pernons cannot own more than 8 hecares of controlled land Controlled lapd is defined as any land oUfside the boundaries of a city town new inwn Village or summcmiddot village Controlled land however may be acquired by a foreign state for diplomatic or counsul purshyposes The area limitation does not apply to controlled land transferred through inheritance There are no restrictions on urban property (1)
Enforcement of the regulation is ensured by sworn declaration attached to land transfers and by investigative procedures carried out by the Foreign Ownership of Land Administration with use of information supplied by Land Titles Branch (1) Contravention of the law is subject to a maximum fine of $10000 imprisonment of up to 1 year or both Land that is acquired in contravention of the law may be sold by judicial sale Proceeds from the sale are used to cover sale expenses and any remaining funds up to the amount originally paid for the land are returned to the individual Any proceeds exceeding the amount originally paid for the land are put into the General Revenue Fund of Alberta l)
Transfer of Ownership
The transfer of agricultural land from One generation to the next is an integral part of maintaining the owner-operated family farm ensuring that future farmers are available to utilize the land preserved for agriculture (32) A start in farming however requires substantial capital resources As land prices continue to increase the need for capital for young farmers entering the industry becomes increasingly acute
Sallkatchewan
The Saskatchewan Land Bank established in 1972 by the Land Bank Act and administered by the Land Bank Commission was developed to alleviate some of the problems associated with the generational transfer of land Its objectives were to develop a viable agricultural industry in Saskatchewan and
IOAs of OCllb~r 1978 Bill 40 was not yet in effecl Regulations under Bill 40 however will not differ in intem fTOm the temporary regulations but will be more detailed
17
provide for a transfer of farms from generation to generation rather than have family farms absorbed by large farm units The Land Commission a government agency purchases land thereby absorbing the capital costs associated with land transfer It then rents the land to applicant farmers The land bank program provides continuous sales opportunities to Saskatchewan farmers and enables individuals to begin farming independently of substan tial fa~i1y assistance It also encourages the perpetuation of viable family farm units through the transfer of land to direct descendants (30)
Although the land bank program involves the transfer of land through rental tenancy efforts have been made to eliminate this type of transfers detrimental effects on efficient resource utilization Land Bank leases for example are long term and the Commission reimburses the lessee for capital improvements made during tenure which (it is expected) would provide the security necessary to make long term investment decisions to use resources efficiently
Under the program the Land Bank Commission may purchase land from anyone wishing to sell In instances where the Commission must allocate available funds among several offers for sale it will purchase by order of priority from farmers who (1) want to retire and transfer their land to a direct descendant (2) are selIing land that can be used to establish a viable farm unit (3) have large tracts of land on which two or more operators can be supported (4) have palcels of land constituting full units or (5) have no other sale alternative (3l)
The Commission purchases land at market value This is determined through an appraisal process in which the productive value of the cuhivated portion of the sale property is correlated with the productive value and sale price of cultivated properties of similar soil quality in the samt area The productive value is determined through lax assessment data Thus the Commission price is essentially determined by the relationship between prices of recent land sales in the area and the assessed value of the land for taxation purposes A similar process is used to determine the market value of grazing land Assessments are also made of the value of buildings and other improve ments on the property (31)
Land purchastd by the Commission is allocated to lessees on the basis of a point competitj~e system if there is more than one applicant for a given piece of land Applicants are scored on their income potential skill age vendors preference and potential disruption of existing farming enterprises The applicant must declare an intention to make farming the principal occupa tion and be of legal age a resident at the time of leasing and during tenure and a Canadian citizen or immigrant The applicants and spouses combined average annual income for the preceding 3 years must not exceed an amount annually determined by the Commission II The applicants and spouses net worth may not exceed $21000 in 1979 Applicants gain or lose points if their projected net income projected land base in work units or age is outnide the optimal range established by the Commission Points are gained for educa tion experience and for an indication from the vendor that the applicant is the preferred recipient of the land Points are lost for the average distance in
JJBa~d on (h~ composit ind~x of wag~ for Saska(ch~wan in 1977178 this amount was 520000 in 1979
18
II
miles ~-(iat the piece of land applied for is from other land units the applicant is farming (JJ)
Applicants scoring highest arc then intervilwld 10 assess their motivation management ability and other characteristic all of which arc also numershyically scored The applicant with the highest cumulative point score unless otherwise determined by the Commission is awarded the lease (31)
The llase remains in effect until the lessee reaches the age of 65 or dies The lessee may stipulate in writing if the least is to be passed on 10 a direct dlscendant After the age of 65 short-term leases may be granltd under certain circumstances
Since June 1 1978 rent is based on the production value of the land whierl is calculated from th( prices of oilseetis wheat and barley and thtlong-term yield of equal quality land in th area Prior to that time rent was based on a percentage of the lands market value The lessee is responsible for the payment of taxes (J])
Lessees have the option to purchase land after leasing from tht Commission for 5 years The land is sold to lessees at its market value at the time of sale Llssees purchasing land are entiLied to an earned homestead quarter refund made by the Commission on the purchase price of a quarter ~ection of land If the lessee lives on the rented land the inhabited quarter section is the section on which the refund is paid If the lessee does not live on the rented land a quarter section is designated as the humestead quarter on which the refund is paid The refund is 20 percent of the price paid by the purchaser for the qultrter section to a maximum of $5000 paid over a period of 5 years following the land transfer In order to receive the refund the purchaser must be actively engaged in farming and remain a bull esident of Saskatchewan during the 5 years or the balance Q1f the refund is forfeited (J1)
Buildings and improvements on the property are sold under a long-term agreement to the lessee When the lease expires the Commission purchases tht lessees earned equity based on the market value of the improvements thus ensuring that lessees receive the benefits of their investment decisions This combined with the homestead refund means that the lessee builds equity while renting from the Commission (31)
Effects of the Land Tenure Programs
During 1972-77 the Land Bank Commission acquired 354000 hectares of land for a total cost of S8l million This land as of December 31 1977 was being leased to 1912 ksse(s through 2009 leases (30)
In Saskatchewan nonresidents purchased a total of 59877 hectares in 1976 compared to 56769 hectares in 1977 (28)
Compiled data on foreign land transactions in Manitoba is unavailable (19)
In Alberta the amount of land purchases by non-Canadians and foreign corporations during 1976-77 as monitored under the Foreign Ownership of Land Regulations declined 60 percent DuringJanuarY-August 1978 foreign purchases were running 89 percent behind purchases for the same period in 1977 In 977 foreign purchases accounted for 2 percent of total area of rural sales compared to 5 percent of total rural sailS in 1976 (2)
19
LAND USE AND TENURE IN PERSPECTIVE
The dominant themes that emerge from the hind use and tenure programs are that Canadian farmland prices have been increasing and that these increases affect land allocation to agriculture and land tenure patterrs In order to fully assess these themes it is necessary to know (1) how much agricuturalland is actually being lost due to nonagricultural use (in this case urbanhiation) (2) what changes have occurred in land tenure patterns and (3) what factors influence farmland prices in Canada
Loss of Agricultural Land Through Urbanization
D M Gierman (15) has determined that during 1966-71 12801 hectares of class 1-4 agricultural land were irretrievably ca~yerted to urban use annually in Canada The highest rates of conversion Occurred in Ontario and Alberta where an average of 6199 and 2046 hectares respectively of class 1-4 agricultural land were annually converted (table 6) Over 80 percent of the land converted was formerly classified class 1-4 for agriculture The converted land however represents less than 1 percent of total class 1-4 landin those two Provinces
The annual loss of production due to the permanent reallocation of land to urban uses can be estimated by converting the amount of class 1-4 agriculshytural land annually incorporated into cities to a class 1 equivalent proporshytionately allocating the class 1 equivalent land to crops according to the 1976 cropping pattern and multiplying the area allocated to each crop by the potential yield for that crop on class 1 equivalent land (tables 7-10) Accordshying to these calculations losses of potential production due to the direct incorporation of land into cities in the short term (1 year) anc n the long run (20 years) assuming constant 1966-71 rates are relatively small in the three Prairie Provinces Loss of potential production due to land use changes in Ontario however is fairly substantial particularly in the long term DecHnes in production of the major crops in Ontario by 1996 could range from almost 4 percent of average production of tame hay to over 6 percent of rye (tables 7-10)
Manning and MCCuaig (21) quantified the amount of CLI class 1-4 agricultural land likely to be affected by urbanization by looking at CLI class 1-4 land within a 50-mile radius of 19 of Canadas major Census Metropolitan a Areas Fifty-four percent of Canadas class 1 land and 21 percent of Canadas class 1-4 land is within 50 miles of the specified areas Approxishymately 45 million hectares of class 1-4 land is located within the fringe areas of urban centers in Ontario Applying the same methodology used to detershymine the productive capacity of agricultural land directly incorporated into urban centers it is evident that the productive capacity of the urban fringe area in Ontario (table 7) exceeds present production levels for the Province
Census Metropolitan Areas as desirnated by Statistics Canada are urban areas with Over 100000 inhabitants The 19 areas are Edmonton Calgary Saskatoon Regina Winnipeg Thunder Bay Sudbury Windsor Toronto Kitchner St Catherines Hamilton LondonOttawa Montreal Quebec Chicoutini St John and Halifax
20
-------___I~
Table 6-Average annual conversion rates of rural land of vanous
agricultural capabilities to urban uses 1966-71
Province Total class
5-6
HectaresOntario 2496 1789 1503 41I 6199Manitoba 293 219 512538 409 5 952Saskatchewan 28 60 88127 63 29 219 8Alberta 4 12564 747 471 264 2046 165 186Other Provinces 35176 1285 827 1197 3385 498Total Canada 3136 4486 70 3263273 1906 12801 992 539 1531 - = not applicable
Source D M Gierman Rural to Urban Land Conversion Fisheries and Environment Canada Lands Directorate Occasional Paper No 16 Sept 1977
and is over 50 percent of the total production potential on all CLI class 1-4 land in the Province (table 2)
This means that a substantial quantity of agricultural land in Ontario is subject to change from agricultural to urban-oriented use The exact proporshytion of land that may actually change however cannot be determined from available information Although the potential for increased crop production in Ontario is substantial due to the combination of good land and favorable climate this potential is affected by competition between agriculture and urban development
The situation in the Prairie Provinces is considerably different The amount of land located in the fringe area of cities in Manitoba Saskatcheshywan and Alberta equals 14 30 and 27 miI1ion hectares respectively (21) The productive potential of this land is equal to about one-fourth to one-half of present production in Manitoba one-fourth in Saskatchewan and one-third in Alberta
Land Tenure
Total Canadian farm area has been declining-down about 14 million hectares or 2 percent during 1961-76 A 25-percent decrease in eastern Canada was partially offset by a 5-percent increase in western Canada Farmland declined about 13 million hectares in Ontario and increased 11 million hectares in Alberta Thus the amount of farmland is declining in eastern Canada which has the best agroc~imatic potential for food producshytion and increases in farmland are occurring in western Canada which has considerably less agroclimatic potential Land which can grow fruit vegeshytables and corn in eastern Canada is being replaced by land suitable for barley and hay in western Canada
Average farm size in Canada continued to increase during 1971-76 from 187 hectares to 201 hectares The largest increases in size occurred in Manitoba and Saskatchewan where farms increased 9 percent from 220 to 240 hectares and 342 to 374 hectares respectively
During 1971-76 the total number of farms declined about 18 percent (table 11) The percentage of farms fully operator owned in Canada declined
21
I
I
- - - -
- ~~ - ~~~
~
~ A_shy
f
Table 7-Ontario Estimated loss in crop production on class I equivalent land due to conversion to urban uses ~ rIClass 1 Productive capacity of converted agricultural land
~uivalent area ~ I yearCrop in cropo 20 yean Productive capacity of urban fringe ff
Iconverted annually Production on1Percentage of Production on IPercentage ofconvertwto urban wes average Class 1 ~uivalnt
areal converted average I Production on 1Percentage of H area in urbanproduction l area urban fringe 1~productionmiddot averagefringe ~Hectares areaSMetric tons Percent productionMetnc tons fiPercentWheat 1000 hectares 318 1000 metric tons 1704 Percent ~ Oats 028 t280 34080 55 ~958 229Barley 25 1227221 19160 50 199955 202Rye 24 691 ~ 34 19100 18249Com 947 31 2580 61
159 687 115 H129 8059 25 ~~Tame hay 1635 25 161180 49 95 22612263 682Fodder com 20518 245260 39 5804 11721756 1177Potatoes 22 882827 435120 14344Nl 810Other 21 373
Nl 1114 16200 41 15666 159- 19- 570- - 147Total 5094
802 - shy- -3668 - = not applicable
Class I equivalent area in crops converted annually to urban USe times potential yield on class I equivalent land (from table 2)
(1976 ara ti~es 1967middot76 yield) times 100 (Annual production on converted area)
Annual production on convened area times 20
(1976area times 1961middot76 yield) times 100 (Annual production on area converted oVer 20 years)
Area in urban fringe times potential yield on class I equivalent land (from table 2)
bull (1976 area ~imes 196776 v~eld) times 100 (Annual prodUcuon On urban fnnge area)
Sources D M Gierman Rural to Urban Land Conversion Fisheries and Environment Canada lands Directorate Occasional Paper No 16 September 1917 and E W Manning and j D McCuaig Agncultural Land and Urban Centres an Overview ofthe Significance ofUrban Centres to Canadas Quality Agricultural Land Fisheries and EnvironmentCanada lands Directorate july 1917
Table 8- Manitoba Estimated loss in crop production on class I equivalent land due to conversion to urban uses
CIa I Productive capacity of converted agricultural land equivalent area I year Productive capacity of urban fringeCrop 20 yranin crops
converted annually Production on Percentage of conv~rled CI I equivalentProduction on 1Percentage of
to urban uses average productiorn Percentage ofconverted averageareal production area in urban urban fringearca production averagefringe areaHeclares producrion1Melnc Ions Percenl Meine Ions Percent 1000 heclares Wheat 1000 melnc Ions 242 Percent702 ~~Oats 14040 05377 350246 03 1015 38Barley 4920104 57 113395 362~3 42Mixed grains 7900 59O 15232 578Rye 6
~ 640 45 16 43
15 51Buckwheat ~3 300 57 363 83 02 20 38Com 60 40I 44 ~ 4 27Tame hay 80 3389 2596 OS 8 33Fodder com 11920 51 2 45 ~2 129 864 3iFlaxSttd 900 43 - 33~ lt 50 3 67M Sunnower 1000 70 32 -shy Nl 3 3 02 48 72
Ra~d 60 33 51tJO 15 523 ~ 5~ Mustard seltd 460 49 28I 1
Other crops 15 I ~2 20 33 2
32 34 a--bullbullbull- 2 67Summer fallow 145 19
211 Total 746
~ 1083
- = not applicable
Class I equivalent area in crops converted annually to urban use times potential yield on class I equivalent land (from table 3)
(1976 area ti~es 1967middot76 yield) times 100 (Annual production on converted area)
Annual production on converted area times 20
(1976 area times 1967middot76 yield) 100 (Annual production on area converted over 20 years) times
Area in urban fringe times potential yield on class I equivalent Idnd (from table 3)
(1976 area ~imes 1967middot76 y~e1d) times 100 (Annual production on urban frmge area)
Sources D M Gierman RU1a110 Urban Land Conversion Fisheries and Environmem Canad Lands Directorate Oteasiona Paper No 16 September 1977 and E W Manning and J D McCuaig Agricullural Land and Urban Cenlres an Overview of Ihe Significance of Urban Cenlres 10 Canada S Qualily Agneullural Land Fisheries and EnvironmentCanada Lands Directorate July 1977
~
0
Table -Saltkatchewan timated I m nop pmduction on cia I luilent land due to conenio to uban u CI I n
Productive capacify of conerted agricuhural landequivalen areaCrop I year
20 yea in cropo
converted annually Productive capacity of urban fringeProduction on 1 Percentage of 10 urban ilia convrrtrd avrrage Productio on I Pecenage of
CI I equivllen area I production convltnrd avrragr Production on I ~
area in urban Percenage ofHectares arra Production urban fringe Meine Ions fringe avrrage Wheal Percent Meine Ions I aira l
67 Percent productionOars 194 JOoo heClares000Barley 6 19 3880 JOOO melne Ions
003 PercentII 00Rye 380 88442 I 00 03 2564
Tame hay 3 840 79 22 00 03 253
Rapeseed 8 54 60 148 22
~- 3 00 04 562Other crops 5 1080 14 22
~shy 4 00 04 35Nl 26Summer fallow 100 108 ~ ~ 67 -
03 72436 25 - 54
~ 39 12 Total area 167 887 - v_~middotmiddotshy bull- = not applicable - 2195
Class I equivalem area in crops converted annually to urban Use times potemial yielel on class I cquivalem land (from table 4) (1976 area ti~es 1967middot76 yield) times 100
(Annual produlttlon on converted area)
Annual production on convened area limes 20
(l976aa times 1967middot76 yield) times 100 (Annual production on area converted over 20 years) I
Area in urban fringe times potential yield on class I equivalem land (from table 4)
(1976 area ~imes 1967middot76 yeld) times 100 (Annual production on urban frmge area)
j D M G~bull tlt Ubo Lo Cmbull yh ~_ Co t n~ Ocroo P N p nood E W M
Canada Lands Directorate July 1977 J D Mabullbull _ Uoo C_ M C Qoooo1 Lo ood bullbullbull0 I ~ of U COO
I--------~~-==o~~~~~~~~
f shy
~~~tmiddotmiddot ~ -
~ Table lO-Alberta Estimated loss in crop production on class 1 equivalent land due to conversion to urban uses lt
I
CI I Productive capadly of coverred agriculrural land equivalent area
Crop I yenin cropo 20 yean Productive capacity of urban frin~ converled annually Production on JPercenta~ of
to urban IUeI onyerred ayeta~ Producrion on - Percenta~ of CI I equiyalentconverted avera~ Production onarea I production t I Percenta~ ofarea in urban arr~J production urban fringr
Hectares fringr averageMelnc Ions arealPercent Melnc Ions I produclionWheat Percent364 1000 hecla resOats 1056 003 JOOO melric Ions Percent118 21120Barley 378 05203 451370 7560 1308Mixed grains 1406 03 52 146 32
18 28120 467Rye 58 57 3202 45712 1160 1737Tame hay 30 03 48 3522250 600 70Flaxseed 1675 55 2903 155 33500 38Rapeseed 8 60 3503 31049 160 2077Mustard d 74 03 57 6 37NI I 1480 tJ1 Other crops I 01 53 9 326049 20 90Summer fallow - 2 32-- 424
25 2- - - 61 25
~ - -Total 1660 - ~- - not applicable 2055----- -
525
lt-Class I equivalent area in crops converted annualy 0 urban u limes potential yield on class I equivalent land (from table 5)
(1976 area ti~es 1967-76 yield) times 100 (Annual producuon on converted area)
-1
Annual production on convened area times 20
(1976 area times 1967-76 yield) 100 (Annual production On area convened over 20 years) Urnes bull
Area in urban fringe times potential yield on class I equivalent land (from table 5)
bull (1976 area ~imes 1967-76 veld) times 100 (Annual produclJon on urban frmge area) j
Sources D M Giennan Rural 10 Urban Land Conversion Fisheries and Environment Canada Lands Directorate Occasional Paper No 16 September 1977 and E W_ Manning and Canada Lands Directorate July 1977 J D McCuaig Agnculural Land and Urban Centres an Qnew of Ihe Significance of Urban Cenlregt 10 Canada Qualily AgrIcultural Land Fisheries and EnvironmentI
I ----~~~i~~
I
Table II - Number and proportion of census farms by tenure of operator 1971 and 1976
OwnerProince Part Owner1971 1 1976 1 1971 1 1976 1 1
1971 1 1976 1 1971 1 1976 Number Percentage of
total Number Percentage of Ontario 691162 total501165 i4Manitoba 66 1987721608 2171517238 2162 28Saskatchewan 58 1118441499 1073436612 54 32 36Alberta 53 3009737193 2739833584 3959 39Canada 59 21284251066 20206189063 3469 63 35---------------- 95862 93757 26 31Tenant
-I97I-=C-imi-J 1971 1 Total-shy
1976J J 1971 1 1976 Number Percentage of
Ontario total Number49113 4403 5Manitoba 62189 947221991 76983Saskatchewan 6 75374 349815568 29963Alberta 7 84225 769703520 69578Canada 7 619200 6270217298 573105 6 366128 300118
Source R Davianlt Selected Agricultural Statistics for Canada Agriculture Canada Ottawa1977
from 69 percent of the total number of farms in 1971 to 63 percent of the total in 1976 and the number of farms partly owned or fully rented by the operator increased from 26 to 31 percent and 5 to 6 percent of the total number of farms respectively The percentage of owner-operated farms in Alberta and Saskatchewan remained about the same during 1971-76 although the total number of owner-operated farms in Canada declined The largest decreases in the percentage of owner-operated farms oCcurred in Manitoba and Ontario where the percentage of owner-operated farms declined from 62 to 58 percent and 74 to 66 percent respectively during 1971-76 (table II)
Farmland Prices
Canadian farmland prices increased 121 percent in nominal terms during 1971-76 from an average of $24631 per hectare to an average of $54372 per hectare The largest increases in farmland price occurred in Ontario where farm prices increased 150 percent from an average of $80240 per hectare in 1971 to an average of $2007_01 in 1976 The smallest increases Occurred in Manitoba where farm price increased 94 percent from an average of $17865 per hectare in 1971 to $34638 in 1976
Price reflects the intersection of demand for and supply of land Thus the allocation of land between divergent uses relates to the cumulative effect of the demand for those uses upon its price Farmland price is affected by the interaction of farm and nonfarm demand Farm purchasers are defined as those individuals for whom the price of land is determined by past and expected returns from the land for agricultural production Nonfarm purshychasers are individuals for whom the price of land is determined by past and
26
expected returns from the land for other than agricultural purposes (13) Foreign purchasers of land are considered nonfarm buyers when the price at which they are willing to buy land is determined by economic conditions in their domestic economy rather than returns from Canadian agriculture even if the land they purchase remains in agriculture through tenant farming
The determinants of farmland price relating to nonfarm demand include the presence of minerals for extraction forests population pressure on use of the land which is manifest in urbanization construction of transportation systems speculation and recreational or residential construction Those relating to farm demand for land include farm income pressures to enlarge farm holdings and advances in agricultur~1 technology (13)
Land prkes are an underlying focus of Canadian agricultural land programs particularly since the impact of nonagriculturally oriented demand on land prices influences the allocation of land away from agriculshyture and affects preferred land tenure patterns The land use and tenure programs therefore deal with the effects of urban-oriented and foreign or nonresident nonfarm purchasers on land prices use allocation and tenure ptterns
Since farmland prices are determined by a combination of farm and nonfarm demand the question arises as to their relative effects on Canadian farmland prices (table 12) The effects of farm and nonfarm demand on farmland prices were estimated by means of an econometric model Because Canadian programs focus on the effect of urban oriented nonfarm buyers on land price the number of urban and rural nonfarm residents in each of the Provinces (Ontario Manitoba Saskatchewan and Alberta) was used as a proxy for nonfarm demand (table 13) It was assumed that each additional urban and nonfarm rural resident represents potential demand for residences transportation or other nonagricultural uses Net farm income was used as a measurement of the effect of farm demand on land prices (table 14) It was assumed that the supply of land is constant and that the impact of a change in farm income on land prices is distributed over a 2-year period following the year of the change T~e analysis is for the period 1960-76
The following equation was used
Yil = a j + t3 iX 1iI-1 + YiX 1iI-2 + OiX2il + Ei
where Y farmland price in real terms = total Canada (C) Alberta (A) Manitoba (M) Ontario (0)
and Saskatchewan (S) X I net farm income in real terms
urban and nonfarm rural populationX2
The parameters of the above equation were estimated by ordinary least squares regression for each of the four Provinces and total Canada with the following results
ii DW CV
YC = 1
-20126 + 17024 XI CI-I (431)
+ 21009 XI CI-2 + 17765 X ZC1(477) (1067)
097 156 3
YA1 = -11673 + 05628 XI AI-I + 2174 XI AI-Z + 29117 X ZA1(210) (376) (080) 094 170 4
27
~ ~~ 1
l~
YM I = - 95S11 + 0917S XI M I_I + 12098 XI M 1-2 + 28765 X M 077 188 7(175) bull (l7S)middot (159)z 1
YObullI = -10214 + 45268 XI 01-1 + 30839 XI 01-2 + 17994 X 0 I z 096 207 6(395) (242) (754) bull
Y51 = -9501 + 11926 Xl 51-I + 16129X _ + 19218XI5I Z(351) bull (406) bull (507)ZS1 089 167 6
IIe elasticities of the two explanatory variables for each of the four Provinces and total Canada are as follows
Province XI XI Ontario 70 161Manitoba 29 117Saskatchewan 39 220Alberta 28 74Total Canada 44 135
Results of the analysis indicate that the two variables were significant and accOunted for most of the variation in land prices during 1960-76 The
Table 12 - Value of farmland deflated by CPI
Year c Ontario ManitobaI Saskatchewan Total Canada
Million dollars 1960 4172 1312 30481961 2748 148474415 1350 31021962 5238 1444
2177 1527438881963 3570 175725244 1546 43921964 5551 1735
3847 184604952 4240 19960
1965 5782 1967 56941966 6153 2100 4785 21858
62421967 6824 5109 234482250 66611968 7554 2305 5520 25II8
65541969 8398 5756 262272046 5539 5395 25466 1970 7667 2129 59671971 7718 2046
54II 2564057591972 5256 251817688 1952 54961973 8671 2076
5071 247045917 53141974 10173 267832387 6675 6152 30914
1975 II586 2456 78311976 12567 6780 345362666 8742 6950 37204 Sources Statistics Canada Quarterly Bulletin ofAgncultura Statistics Ottawa various issues
28
-----shy~
Table 13-Urban and rural nonfarm population 1960-76 1
OntarioYear Manitoba Saskatchewan Alb~~-Id~t-~-ana a
~ -~~ -bull----Thousands
1960 5590 739 ~~ 10201961 5730
610 15801 1962 5873
750 620 1046 16165760 6311963 6020 1072 16537771 1964 617]
1J41 1099 16917782 652 ] 126 17306 1965 6325 793 6631966 1154 177046479 803
10 1967 6654 818 675 1185 181016821968 6833 834
1230 18535 ]969 7018
689 1277 IS9S0 849 696 1325 19435 1970 7207 865 1971 7404
703 1376 19902880 7101972 7515 888 1427 20406
7131973 7627 1469 20712896 717 15111974 7742 904 720 21022
1555 21338 1975 7858 9]2 7241976 7985 1600 21658920 728 1648 21958
The data for intercensual years is determined from the average annual rate of increase in population extrapolated between the census years 1961 1966 1971 1976
Sources Statistics Canada Canada Year Book Ottawa various issues Canada 1971 Censwof Canada Population Urban Rural Distnmiddotbutions Ottawa
elasticities for the number of nonfarm population are greater (ranging from 74 to 220) than the elasticities for farm income (ranging from 28 to 70) indicating that the percentage change in farmland prices related to the percentage change in the number of nonfarm population is greater than that relative to the percentage change in farm income The rate of change in the number of nonfarm population in any time period however is rele~ively small in comparison to the rate of change that can Occur in farm income during specified periods During 1972-75 for example the rate of increase in nonfarm population was 05 percent in Saskatchewan while the rate of increase in farm income during that period was 40 percent Thus given the specified elasticities for the two variables for Saskatchewan farm income accounts for 94 percent of the increase in farmland prices while the number of nonfarm purchasers accounts for 6 percent of the increase assuming no further increases in farm income in the next 2 years In addition the total cumulative effect of the increases in net farm income on land prices would not occur until 2 years after the final increase The annual percentage increase in land prices (1972-75) are attributed to
29
Jbull I
Province Net farm income Nonfarm purchasers of land
Ontario 85 15Manitoba 86 14Saskatchewan 94Alberta 6
75 25Total Canada 77 23
Thus during 1972middot 75 net farm income had a greater impact on land prices than the number of nonfarm purchasers of land
Table 14 Net farm income deflated by CPI
Year Oodo IMOOb] Skhewo IAlb ~[~~ Total
Canada Million dollars
1960 1961 1962 1963 1964
586 609 673 593 550
216 105 322 215 306
667 199 914
1062 643
399 400 549 564 456
2396 1838 2990 2924 2427
1965 1966 1967 1968 1969
620 833 647 689 710
31~ 258 284 296 212
885 1009
620 802 714
558 653 494 615 459
2893 3416 2584 2999 2690
1970 ]971 1972 1973 1974
1975 1971j
681 545 703 947
1046
1074 813
146 254 266 494 405
464 359
370 710 590
1191 1357
1616 1423
379 410 520 886 941
960 722
2156 2405 2662 4339 4568
4886 4040
CONCLUSIONS
Although potential for major losses in Canadian agricultural production exists particularly in Ontario this docs not necessarily mean that this land will be lost to production Measurable losses due to urban pressures appear to be small losses in the urban fringe may be larger but cannot be pinpointed If current rates of changtmiddot do not ac-dclatc precipitously pOFulation pressures
30
probably will not be a major factor affecting Canadas competitive position in world wheat trade Evidence indicates that Canada does have the capability to increase wheat production under current cropping patterns to 32 million tons The continued attrition of farmland in Ontario however could be reflected in increased US exports of those products formerly produced in Ontario such as fruit
The rapid increase in farmland prices per se may not necessarily mean that agriculture is facing difficulty in competing with urban development for use of the land Evidence indicates that high product prices are capitalized into land accounting for its increase in price The changes in tenure patterns that have occurred between the 1971 and 1976 Census of Agriculture may also be a reflection of increased returns from agriculture as farmers move to increase their land base quickly by renting in order to take advantage of high productprices
Land use-programs such as the one implemented by the British Columbia Land Commission Act apparently can stop the reallocation of agricultural land to urban uses If the general economic environment is not conducive to the allocation of agricultural land to production however maintaining that land for future agricultural use may require a substantial social investment
REFERENCES
(1) Alberta Department of Energy and Natural Resources The Agricultural and Recreational Land Ownership Act Explanatory bulletin undated
(2)
Foreign Ownership of Land Administration Unpublished data
(3) Alberta Land Use Forum Report and Recommendatio7lS Jan 1976
(4) Beaubien Charles and Ruth Tabacnik
People and Agricultural Land Science Council of Canada Ottawa June 1977
(5) Boylen Diana M
Rural Land Tenure Alberta Land Use Forum Ttchnical ReportNo 6B 1975
(6) British Columbia Government of Land Commission Act
(7) Brown Jacob
Our Home and Native Land Extent and Implications of Foreign Land Ownership The IlgrgISt Vol 711 winter 1978
31
~
l 11 l
(8) Canada Grains Council
Statistical Handbook Various issues
(9) Davianlt R
Selected Agricultural Statistics for Canada Agriculture CanadaOttawa 1977
(10) Environment Canada Lands Directorate
Land Capabilz~y for Agriculture Canada Land Inventory Prelim inary Report Apr 1976
(II) Esau Alvin A J
Land Ownership Rights Law and Land an Overview Alberta Land Use Forum Summary Report 9 Edmonton 1974
(12) FederalProvincial Committee on Foreign Ownership of Land Report to the First Minirters Conference Canadian Intergovernmental Conference Secretariat Aug 1974
(13) Gale John E
What Makes Farm Real Estate Prices Agricultural Finance Review Vol 24 June 1963
(14) G(no BarbaraJ and Larry M
Food Production in the Canadian Environment Science Council ofCanada Ottawa Dec 1976
(15) Gierman D M
Rural and Urban Land Converslon Occasional paper no 16 Fisheries and Environment Canada Ottawa Sept 1977
(16) Hudson S C
A Review of Farm Income Stabilization in British Columbia A Report to the Minister of Agriculture Oct ]977
(17) Jean Clancy V
Land Use Income Assurance Linked in British ColumbiaForeign Agriculture March 22 1976
(18) Manitoba Governmltgtnt of
Agricultural Lands Protection Act Winnipeg
(19) Manitoba Agricuitur Lands Protection Board Unpublished material Winnipeg
(20) Manning E W and S Eddy
The Agricultural Land Reserves of British Columbta an Impact Analysis Fisheries and Environment Canada forthcoming publication
32
(21) Manning E W and J D McCuaig Agricultural Land and Urban Centres an Overview of the Signifimiddot cance of Urban Centres to Canadas Quality Agricultural Land Fisheries and Environment Canada Lands Directorate July 1977
(22) Ontario Ministry of Agriculture and Food Green Paper on Planning for Agriculture Food Land Guidelines Ontario 1977
(23) _____
A Strategy for Ortario Farmland March 1976
(24) Ontario Ministry of Housing A Guide to the Planning Act Ontario
(2gt Parlby G B The Family Farm i71 Alberta its Origins Development Future Alberta Land Use Forum Summary Report 1 Edmonton 1974
(26) Rees W E The Canadian Land Inventory in Perspective Fisheries and Envimiddot ronment Canada Ottawa March 1977
(27) Saskatchewan Government of Farm Own~~rs7ttp -Jt~~-middotRgina
(28) Saskatchewan Farm Ownership Board Unpublished data Saskatoon
(29) _____
First Annual Report Saskatoon 1975
(30) Saskatchewan Land Bank Commission Annual Reports Various issues Regina
(31) ____
Saskatchewan Land Bank Regulatiolls Regina June 1978
(32) Saskatchewan Land Use Policy Committee Land Use In Saskatchewan Agricultural Land Fact Sheet No7 Regina
(33) Shields J A and W S Ferguson Land Resources Production Possibilities and Limitations for Crop Production in tht Prairie Provinces Oz1seed and Pulse Crops in Western Canada Westtrn Cooperativts Ftrtilizers Limited Calgary 1975
33
bull
(34) Shields J A and J L Nowland
Additional Landfor Crop Production Canada Proceedings of the 30th Annual Meeting of the Soil Conservation Society of America San Antonio Aug 1975
(35) Statistics Canada Canada Year Book Ottawa various issues
(36) _____
Census of Agriculture Ottawa various years
(37) _____ loy
Census of Population and Urban Rural Distribution Ottawa
various years
(38) _____
Net Farm Income Ottawa various issues
(39) _____
Quarterly Bulletin of Agricultural Statistics Ottawa various issues
(40) US Department of State Various reports from US Embassy Ottawa
(41) Ward Neville E
Land Use Programs in Canada British Columbia Fisheries and Environment Canada Ottawa July 1976
(42) _____
Land Use Programs in Canada Ontario Fisheries and Environshyment Canada Ottawa September 1977
US GOVERNMENi PRINTING OFFICE 19790_ 630-3902563 REGION 31
34