can more revenue be raised by increasing income tax
TRANSCRIPT


© Institute for Fiscal Studies, 2009 1
Can more revenue be raised by increasing income tax rates for the very rich?
Mike Brewer and James Browne*
Institute for Fiscal Studies
1. Introduction After three decades in which such a reform would have been politically unthinkable, the government announced in the 2008 Pre-Budget Report (PBR) that it would increase income tax rates for people on incomes of £100,000 or more, beginning in 2010–11. By so doing, the government hopes to raise just over £3 billion to help reduce public sector borrowing. But individuals on incomes this high are likely to be more responsive to changes in the tax system than the vast majority of the population. So any attempt to extract more revenue from them risks being frustrated as they reduce their taxable income by various means. This Briefing Note discusses how much scope there is to raise revenue from the very rich by increasing income tax rates and assesses in detail the amount of revenue that is likely to be raised by the government’s proposed reforms. It extends analysis presented in the 2009 IFS Green Budget1 and updates some calculations in a submission to the Mirrlees Review.2 It also discusses information recently released by HM Treasury and HM Revenue & Customs concerning their methodology for calculating how much * This Briefing Note was funded by the ESRC-funded Centre for the Microeconomic Analysis of Public Policy at IFS (grant number M535255111). The Survey of Personal Incomes is Crown Copyright material and has been used with the permission of the Controller of HMSO and the Queen’s Printer for Scotland. The authors are grateful to Richard Blundell, Robert Chote and Andrew Shephard for their comments on earlier drafts.
1 J. Browne, ‘Income tax and National Insurance’, in R. Chote, C. Emmerson, D. Miles and J. Shaw (eds), The IFS Green Budget: January 2009, Commentary 107, IFS, London, 2009 (http://www.ifs.org.uk/budgets/gb2009/09chap11.pdf).
2 M. Brewer, E. Saez and A. Shephard, ‘Means-testing and tax rates on earnings’, in J. Mirrlees et al., Dimensions of Tax Design: The Mirrlees Review, OUP for IFS, Oxford, forthcoming. An earlier version of this chapter is available at http://www.ifs.org.uk/mirrleesreview/press_docs/rates.pdf.

© Institute for Fiscal Studies, 2009 2
revenue these reforms will raise. The Briefing Note shows that there is considerable uncertainty over the revenue that could be raised from the very rich by increasing income tax rates, both because we cannot be certain about the distribution of incomes above £100,000 and because we cannot be certain how those affected will respond to the tax increase. It goes on to discuss under what conditions the measures in PBR 2008 could yield as much revenue as the Treasury is forecasting. 2. Proposed income tax reforms to 2011–12 This section outlines the two tax changes proposed in the 2008 Pre-Budget Report that would affect those with incomes over £100,000.3 2.1 Description The government announced in the 2008 Pre-Budget Report two measures that would increase the amount of income tax paid by those with incomes greater than £100,000. The government has proposed that: • from 2010–11, the income tax personal allowance would be withdrawn in two stages from those with incomes over £100,000, effectively creating two short bands of income in which the marginal income tax rate is 60%; • from 2011–12, a new income tax rate of 45% would apply to income over £150,000. Figure 1 shows the effect of these changes on the income tax schedule, and Figure 2 shows the overall marginal rate schedule (or tax wedge) before and after these changes, including both employee and employer National Insurance and indirect taxes. Increasing the income tax rate to 45% above £150,000 would take the overall effective marginal tax rate on earned income above this level from 48.4% to 52.8% as a percentage of employer cost, taking both employee and employer National Insurance (NI) contributions into account.4 This 3 It draws on J. Browne, ‘Income tax and National Insurance’, in R. Chote, C. Emmerson, D. Miles and J. Shaw (eds), The IFS Green Budget: January 2009, Commentary 107, IFS, London, 2009 (http://www.ifs.org.uk/budgets/gb2009/09chap11.pdf).
4 This is calculated by adding together the income tax rate, employee NI rate and employer NI rate and dividing by one plus the employer NI rate – in this case, (0.45 + 0.015 + 0.133)/1.133.

© Institute for Fiscal Studies, 2009 3
implies that 52.8 pence of every extra pound that an employer spends increasing the pay of someone on this tax rate will be taken in income tax and National Insurance and the employee will receive the remaining 47.2 pence. When we take into account the fact that the state also takes an Figure 1. Income tax schedule, 2009–10 and 2011–12
0%
10%
20%
30%
40%
50%
60%
70%
£0 £50,000 £100,000 £150,000 £200,000
Annual gross earnings
Mar
gina
l inc
ome
tax
rate
2009–10
2011–12
Notes: Assumes individual is aged under 65. All figures expressed in 2009–10 prices. Source: Authors’ calculations. Figure 2. Overall marginal rate schedule, 2009–10 and 2011–12
10%
20%
30%
40%
50%
60%
70%
80%
£0 £50,000 £100,000 £150,000 £200,000
Annual gross earnings
Ove
rall
effe
ctiv
e m
argi
nal t
ax r
ate
2009–10
2011–12
Notes: Percentages expressed as a proportion of gross employer cost (i.e. gross earnings plus employer NI). Includes income tax, employer and employee NI, and constant indirect tax rate of 17%. Assumes individual is below state pension age, contracted in to the Second State Pension, has only one job and has constant earnings throughout the year. All figures expressed in 2009–10 prices. Source: Authors’ calculations.
© Institute for Fiscal Studies, 2009 4
average of 17 pence in every pound that people spend in VAT and excise duties, this increases the overall effective marginal tax rate from 55.3% to 59.6% of the additional cost to the employer of paying an extra pound.5 Another reform announced in the PBR was that the lifetime limit for contributions to a pension would be frozen for the five years from 2011–12 to 2015–16 at £1.8 million. This would limit the ability of some very rich individuals to defer paying tax on their income by increasing payments into their pension. Since deferring paying tax in this way would also reduce the amount they would have to pay if their incomes were greater than £150,000 currently but less than this in retirement, this reform limits to some extent the ability of high-income individuals to avoid paying tax at the proposed 45% rate. 2.2 Estimating the revenue effects The Treasury estimates that the 45% tax rate will affect 350,000 people, and raise £1.6 billion in a full year after accounting for the impact on tax revenues of any changes in behaviour caused by the tax change (we refer to this as the ‘behavioural response’ to the tax change). This behavioural response would arise in the following way: increasing the marginal rate of income tax at the top of the income distribution to 45% makes earning slightly more a little less attractive to those already earning more than £150,000, and reduces the cost to them of earning slightly less. We would therefore expect these individuals to respond to this change by reducing their taxable income. They could do this by increasing their contributions to a private pension, working less hard or making more effort to avoid or evade tax. These changes might also discourage high-income individuals from coming to the UK, and encourage those already in the UK to emigrate or retire earlier. All of these responses would tend to reduce the amount of revenue raised by this reform, and in theory could even mean that this tax rise costs money. In general, the size of these revenue effects will depend on: 5 59.6% is equal to the 52.8% calculated above plus the average consumption tax rate of 17% all divided by 1.17. The increase from 55.3% to 59.6% also takes into account increases in National Insurance rates scheduled for 2011–12.

© Institute for Fiscal Studies, 2009 5
• how high-income individuals respond to changes in their marginal tax rate and their total tax bill; this will affect what they pay not just in income tax but in other taxes too; • the number of people on different incomes above £150,000 (which requires us to estimate what the distribution of these high incomes will look like in 2011–12 from what we know about the distribution of those incomes today). We look at each of these below, as well as considering the role of sampling error.
3. Responsiveness of the very rich to changes in their marginal tax rate A submission to the Mirrlees Review of the tax system co-authored by one of us (Brewer) with another IFS researcher and Professor Emmanuel Saez of the University of California, Berkeley, (henceforth BSS6) estimated the responsiveness of very rich individuals in the UK to changes in their marginal tax rate. In particular, BSS estimated a parameter known as the taxable income elasticity, which tells us how much taxable income falls when the effective marginal tax rate rises. Using information on how the income share of the richest 1% of adults changed during the 1980s, the last time marginal tax rates for the very rich were altered, BSS estimated that the taxable income elasticity is 0.46.7 This means that when the net-of-tax rate (that is to say, one minus the marginal tax rate) falls by 1% of its original value, then the taxable income of the very rich falls by 0.46%. For example, suppose the marginal tax rate was originally 50% and increased to 50.5%. Then the net-of-tax rate would have fallen from 50% to 49.5%, or a fall of 1%, and the elasticity of 0.46 implies that the taxable income of the very rich would decline by 0.46%. In the case of the government’s proposed reform, Section 2 pointed out that the overall marginal tax rate would increase from 55.3% to 59.6%. 6 M. Brewer, E. Saez and A. Shephard, ‘Means-testing and tax rates on earnings’, 2008, http://www.ifs.org.uk/mirrleesreview/press_docs/rates.pdf.
7 We are therefore implicitly assuming that individuals and firms will respond the same way to changes now as they did in the 1980s. This may be inaccurate if, for example, high earners are able to extract increased salaries from firms in response to a tax rise as a result of increased global competition for their services.

© Institute for Fiscal Studies, 2009 6
This means that the net-of-tax rate falls from 44.7% to 40.4%, and so we would expect the taxable income of the very rich to fall by 0.46×(4.3/44.7), or 4.5%. In other words, a rise in the tax rate of 4.3 percentage points, or 7.8%, leads to a fall in the net-of-tax rate of 4.3 percentage points, or 9.6%, and this leads to a fall in income of 4.5%. However, BSS point out that there is a great deal of uncertainty around this number. First, the paucity of data meant that the authors had to use a relatively simple approach, leading them to describe this estimate as ‘very preliminary’ and ‘tentative’ (BSS, pp. 15 and 18). The elasticity is estimated using changes to top incomes that happened during the 1980s, a period when the top rate of income tax was falling and when income inequality was increasing. This approach may then confuse responses to the policy with any underlying factor increasing income inequality, and this might mean that the estimated elasticity is too high. Furthermore, even if their approach to estimating the parameter was correct, the estimate was based on a small amount of data and is therefore subject to sampling error: indeed, BSS estimate that moving one standard deviation either side of the central estimate gives values of 0.33 and 0.59 (in other words, there is still a roughly one-in-three chance that the true elasticity lies outside this range).8 Under the government’s proposed reform, these would imply falls in taxable income of 3.2% and 5.7% respectively. We use these three values of the elasticity in the analysis below. Bear in mind that the taxable income elasticity is not derived from immutable preferences, but is affected by the structure of the tax system and by the extent to which the revenue authorities clamp down on fraud and evasion.9 Note that what we are doing here is not ‘dynamic scoring’ – we are not considering the full effects of the tax change on economic activity as a whole, only the effect of the tax change on the amount of taxable income declared by those it directly affects. 8 This assumes that the approach to estimating the elasticity was correct.
9 See J. Slemrod and W. Kopczuk, ‘The optimal elasticity of taxable income’, Journal of Public Economics, 84, 91–112, 2002.
© Institute for Fiscal Studies, 2009 7
After PBR 2008, we asked HM Treasury and HMRC for any information that would help us understand how they calculated that the 45% tax rate would raise £1.6 billion a year. Part of their reply states: We decided to make decisions on the behavioural effects after looking at the package as a whole rather than at the individual elements. There was discussion of the links with the pension LTA [lifetime allowance] measure and ways to avoid the additional charge. The conclusion was that the assumptions on the personal allowance restriction (reducing the yield by 5 per cent), and the use of a 0.3 elasticity on the additional NICs above £100K were reasonable. However, the 0.4 elasticity on the additional charge over £150K should be revised down to 0.35. This gives us two interesting pieces of information: • The Treasury believes the taxable income elasticity of the very rich is 0.4. This is slightly below BSS’s, but well within one standard deviation. • The Treasury believes that freezing the lifetime allowance for pension contributions will lower this elasticity to 0.35. We will discuss the reasonableness of this assumption later on, but note that this estimate is still within one standard deviation of BSS’s. We will therefore also include estimates based on an elasticity of 0.35 in our analysis below. 4. Income growth to 2011–12 and the shape of the income distribution among the very rich Having established the extent to which the very rich might be expected to respond to changes in the tax rates they face, estimating the impact of any fall in income on tax revenue requires a detailed estimate of: • how many taxpayers are affected; • the precise distribution of income amongst the very rich. Estimates of both can be derived from the Survey of Personal Incomes (SPI). The SPI is an annual sample of taxpayers constructed by HMRC with anonymised information about individuals who pay tax through PAYE, those who pay tax through self-assessment and a few non-taxpayers who come into contact with HMRC. Individuals with high incomes are oversampled, so this is a much better source of information on those with very high incomes than household surveys such as the Family Resources
© Institute for Fiscal Studies, 2009 8
Survey that IFS researchers generally use to analyse tax and benefit reforms. Nonetheless, the number of observations in the data with very high incomes is still very small, and so estimates of the revenue raised by changes to the top tax rate can be sensitive to the sample. Estimating the impact of the government’s proposed reforms requires estimates of the income distribution among the very rich in 2011–12. The Treasury estimates that 750,000 individuals will be affected by the proposed withdrawal of the income tax personal allowance10 (because their incomes will be greater than £100,000 in 2011–12) and that 350,000 will have incomes of £150,000 or more. In order to create a hypothetical distribution of incomes in 2011–12 in a simple and transparent way, we take the latest year of SPI data (from 2005–06), and increase everyone’s income by a common factor which ensures that the 750,000th richest individual has an income of £100,000 in 2011–12; this turns out to involve an increase in nominal earnings by 23%, or average annual income growth of 3.5% between 2005–06 and 2011–12, or average real income growth of 0.7% (using actual inflation between 2005–06 and 2008–09 and Treasury forecasts from then on). Note that this adjustment means that relative income differentials within the richest 750,000 individuals are assumed to be the same in 2011–12 as they were in 2005–06. Saez11 has shown that the change in tax revenue from a change to the top rate of tax depends upon the ratio of average (mean) incomes of those with income above the top tax threshold to the size of that threshold. It turns out to be more useful to calculate −z
z z, where z is a threshold and
z is the mean income of those with incomes above z (in other words, if z is a threshold above which a hypothetical top rate of tax applies, then the average income of those affected is z, and −z z is the amount of income 10 For more on this proposal, see J. Browne, ‘Income tax and National Insurance’, in R. Chote, C. Emmerson, D. Miles and J. Shaw (eds), The IFS Green Budget: January 2009, Commentary 107, IFS, London, 2009 (http://www.ifs.org.uk/budgets/gb2009/09chap11.pdf).
11 E. Saez, ‘Using elasticities to derive optimal income tax rates’, Review of Economic Studies, 68, 205–29, 2001.

© Institute for Fiscal Studies, 2009 9
over which the new tax rate applies). BSS refer to this ratio as a, or the Pareto parameter (for reasons explained below). Figure 3. The Pareto parameter, a, 2005–06
1.50
1.60
1.70
1.80
1.90
2.00
2.10
2.20
£0 £50,000 £100,000 £150,000 £200,000 £250,000 £300,000 £350,000 £400,000 £450,000 £500,000
Threshold for hypothetical top rate rate (i.e. z bar)
Par
eto
para
met
er, a
Source: Authors’ calculations using 2005–06 Survey of Personal Incomes. Figure 4. The Pareto distribution as an approximation to our 2011–12 income distribution
0.00000
0.00001
0.00010
0.00100
0.01000
£100,000 £150,000 £200,000 £250,000 £300,000 £350,000 £400,000 £450,000 £500,000
Pro
babi
lity
dens
ity
(log
sca
le)
Pareto distribution
Actual income distribution
Notes: The Pareto distribution has shape parameter 1.8. The vertical axis uses a logarithmic scale. Source: Authors’ calculations using the 2005–06 Survey of Personal Incomes.

© Institute for Fiscal Studies, 2009 10
Figure 3 shows estimates of a and how it varies with the (hypothetical) top tax threshold, z . It also shows 95% confidence intervals (based on bootstrapping). It shows two things: • The central estimate of a is 1.8. For a top rate of tax affecting incomes over £150,000, as proposed by the government, the 95% confidence interval is 1.70 to 1.94. • The value of a does not vary much for values of z above £100,000. This means that the shape of the distribution of top incomes in the UK is close to a Pareto distribution (with parameter a).12 Figure 4 gives a direct comparison by plotting our estimated income distribution in 2011–12 above £100,000 with a Pareto distribution with shape parameter 1.8. (Based on an analysis of the 2003–04 SPI, BBS took a to be equal to 1.67 when estimating the Laffer bound tax rate for the UK.) It can be seen that the match is very close. 5. Estimating the revenue-maximising rate of tax on top income and estimating the impact on revenues of the proposed 45% tax rate This section provides a first attempt to combine the findings in Section 3 and Section 4, by estimating first the revenue-maximising rate of tax on top income and then the impact on revenues of the proposed 45% tax rate. Section 4 showed how top incomes in the UK are approximately Pareto-distributed. This is a common finding, and much past work on the shape of the top of the income distribution has assumed that the distribution takes the Pareto shape. There is considerable advantage in doing this if the very top of the distribution is estimated poorly by micro-data. This was also the approach taken by BSS. In particular, they showed that the marginal tax rate applying to the very rich which maximises overall tax revenues (sometimes called the Laffer bound to tax rates) can be calculated with the formula:
τ =+ ⋅
* 11 a e
12 A Pareto distribution has a CDF of ⎛ ⎞= − ⎜ ⎟⎝ ⎠
( ) 1a
mxF x
x where a is as defined in the text
and xm is a scale parameter.
© Institute for Fiscal Studies, 2009 11
where e is the taxable income elasticity (discussed in Section 3) and a is as defined in Section 4.13 BSS estimated that the revenue-maximising overall marginal tax rate affecting the richest 1% was 56.6%. In 2011–12, this would correspond to a top rate of income tax of 41%. This led us to conclude that the government’s proposed tax rate of 45% could raise ‘approximately nothing’.14 Figure 5 expands on this by using the full SPI data rather than the Pareto approximation to estimate the impact on tax revenues from changes to the rate of income tax affecting those with incomes over £150,000 in 2011–12, under the central estimate of the taxable income elasticity from Section 3, under the Treasury’s estimate and under the assumption of no behavioural response. The revenue-maximising rate can also be deduced from this graph, by looking at the rate of income tax for which the change in revenues is maximised.15 Figure 5 shows the following: • If BSS’s taxable income elasticity is correct, the revenue-maximising income tax rate applying to incomes over £150,000 in 2011–12 is the current 40% rate, and a 45% rate would raise less money than this. A similar result can be obtained by assuming that the income distribution takes a Pareto distribution with a Pareto parameter of 1.8, which gives 13 In fact, the revenue-maximising top rate that applies above a threshold z is given by
( )τ =⎛ ⎞+ ⋅⎜ ⎟−⎝ ⎠
* 11zz
ez z
. But if the distribution of top incomes has a Pareto distribution,
then this is equivalent to the formula in the main text and is independent of the threshold z . For more details, see BSS or E. Saez, ‘Using elasticities to derive optimal income tax rates’, Review of Economic Studies, 68, 205–29, 2001.
14 See M. Brewer and J. Browne, ‘Tax and benefit changes and distributional analysis’, IFS Post-PBR Briefing, 2008 (www.ifs.org.uk/budgets/pbr2008/taxben.ppt).
15 Note that BSS’s estimate of the taxable income elasticity applies to the richest 1% of individuals, but this is a slightly larger group than those with income above £150,000 in 2011–12. We would expect the responsiveness of individuals to changes in their marginal tax rate to increase with income (see E. Saez, J. Slemrod and S.H. Giertz, ‘The elasticity of taxable income with respect to marginal tax rates: a critical review’, 2009, http://elsa.berkeley.edu/~saez/saez-slemrod-giertzJEL09elasticity.pdf), and so it might be the case that the elasticity of this group be a little higher than assumed here.
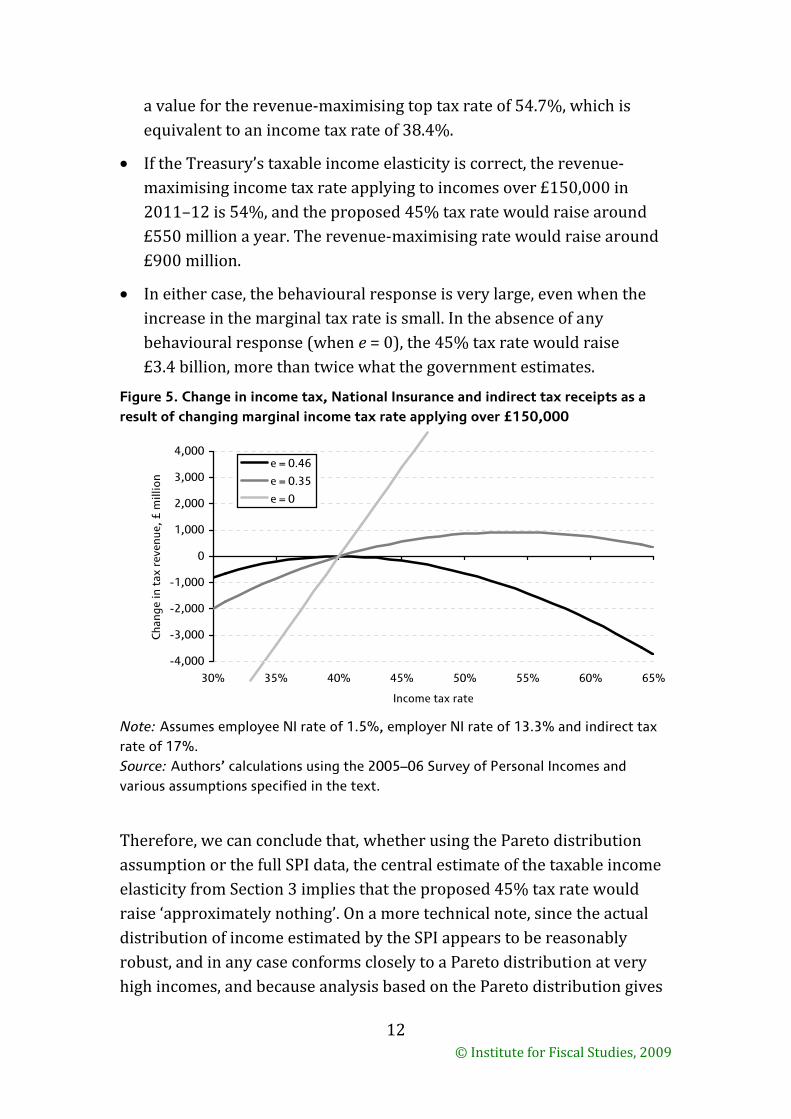
© Institute for Fiscal Studies, 2009 12
a value for the revenue-maximising top tax rate of 54.7%, which is equivalent to an income tax rate of 38.4%. • If the Treasury’s taxable income elasticity is correct, the revenue-maximising income tax rate applying to incomes over £150,000 in 2011–12 is 54%, and the proposed 45% tax rate would raise around £550 million a year. The revenue-maximising rate would raise around £900 million. • In either case, the behavioural response is very large, even when the increase in the marginal tax rate is small. In the absence of any behavioural response (when e = 0), the 45% tax rate would raise £3.4 billion, more than twice what the government estimates. Figure 5. Change in income tax, National Insurance and indirect tax receipts as a result of changing marginal income tax rate applying over £150,000
-4,000
-3,000
-2,000
-1,000
0
1,000
2,000
3,000
4,000
30% 35% 40% 45% 50% 55% 60% 65%
Income tax rate
Cha
nge
in t
ax r
even
ue, £
mill
ion
e = 0.46
e = 0.35
e = 0
Note: Assumes employee NI rate of 1.5%, employer NI rate of 13.3% and indirect tax rate of 17%. Source: Authors’ calculations using the 2005–06 Survey of Personal Incomes and various assumptions specified in the text. Therefore, we can conclude that, whether using the Pareto distribution assumption or the full SPI data, the central estimate of the taxable income elasticity from Section 3 implies that the proposed 45% tax rate would raise ‘approximately nothing’. On a more technical note, since the actual distribution of income estimated by the SPI appears to be reasonably robust, and in any case conforms closely to a Pareto distribution at very high incomes, and because analysis based on the Pareto distribution gives

© Institute for Fiscal Studies, 2009 13
the same answer as that based on the full data, the rest of the analysis in this Briefing Note uses the full distribution of top incomes implied by the SPI. 6. Sampling error The previous three sections discussed the estimate of the taxable income elasticity in BSS, showed how the SPI can be used to estimate the distribution of top incomes in 2011–12, and combined these two to confirm a claim previously made by one of us that the proposed 45% tax rate will raise ‘approximately nothing’. However, both of these estimates are derived from samples and so are subject to sampling error; in other words, the true elasticity might not be 0.46 and the true distribution of top incomes might be slightly different from that implied by the SPI sample. This section shows how sensitive estimates of the impact on tax revenues that would result from changes to the rate of tax affecting those with incomes over £150,000 in 2011–12 are to sampling error in the estimated taxable income elasticity and top income distribution. This is done for each estimate in turn: • Figure 6 shows 95% confidence intervals of the impact on tax revenues of changes to the rate of tax affecting those with incomes over £150,000 in 2011–12 under the central estimate of the taxable income elasticity from Section 3, but having bootstrapped the top income distribution. • Figure 7 shows the effect on tax revenues that would result from changes to the rate of tax affecting those with incomes over £150,000 in 2011–12 under the main estimate of the top income distribution shown in Section 5, but with the three values of the taxable income elasticity discussed in Section 3.16
16 Note these are not the 95% confidence intervals of the elasticity but the 68% confidence intervals; the 95% confidence intervals gave values that were so large as to be implausible and unhelpful for practical purposes.

© Institute for Fiscal Studies, 2009 14
Figure 6. Sensitivity of change in income tax, National Insurance and indirect tax revenues to the shape of the income distribution (95% confidence interval)
-2,500
-2,000
-1,500
-1,000
-500
0
500
1,000
1,500
2,000
2,500
30% 35% 40% 45% 50% 55% 60% 65%
Income tax rate
Cha
nge
in t
ax r
even
ue, £
mill
ion
Note: Assumes employee NI rate of 1.5%, employer NI rate of 13.3% and indirect tax rate of 17%. Source: Authors’ calculations using the 2005–06 Survey of Personal Incomes and various assumptions specified in the text. Figure 7. Change in income tax, National Insurance and indirect tax revenues as a result of changing marginal income tax rate applying over £150,000
-2,500
-2,000
-1,500
-1,000
-500
0
500
1,000
1,500
2,000
2,500
30% 35% 40% 45% 50% 55% 60% 65%
Income tax rate
Cha
nge
in t
ax r
even
ue, £
mill
ion
e = 0.46
e = 0.33
e = 0.59
Note: Assumes employee NI rate of 1.5%, employer NI rate of 13.3% and indirect tax rate of 17%. Source: Authors’ calculations using the 2005–06 Survey of Personal Incomes and various assumptions specified in the text.
© Institute for Fiscal Studies, 2009 15
Figure 6 shows that, for example, under the central estimate of the taxable income elasticity from Section 3, uncertainty over the shape of the income distribution means that a 45% income tax rate could cost the government £0.3 billion or raise the government a negligible amount.17 Figure 7 shows that, if the elasticity is one standard deviation lower than BSS’s central estimate, then the proposed 45% tax rate will increase total government revenue by £0.9 billion, and if it is one standard deviation higher than the central estimate, then it will cut revenues by £0.8 billion. Therefore, we can see that estimates of the change in revenue caused by different tax rates affecting top incomes are slightly sensitive to sampling error in the SPI sample, but a far greater source of uncertainty is the imprecision of the taxable income elasticity estimated in BSS. For that reason, the rest of this Briefing Note ignores the sampling error in the SPI but continues to model the impact on tax revenues assuming three different taxable income elasticities. The next section examines the uncertainty in this result that arises if different tax revenues are considered. 7. Which tax revenues to consider? As the titles of Figures 6 and 7 made clear, the calculations underpinning them assumed that any change in individuals’ taxable income caused by a change in the rate of income tax led not just to changes in income tax revenue, but also to changes in National Insurance contributions and indirect tax revenues.18 This is a sensible approach to take to costing the impact of tax changes if it is felt that the resulting change in taxable income reflects a genuine change in the total income of very rich individuals (or a genuine change in their 17 Technically, this range reflects only the uncertainty over the true shape of the income distribution in 2005–06, given the SPI data for 2005–06 (equivalently, it reflects the uncertainty over the revenue yield from a 45% tax rate in 2005–06 applying to incomes over £81,250). Forecasting the top income distribution in 2011–12 introduces considerably more uncertainty, but of an unknown size.
18 E. Saez, J. Slemrod and S.H. Giertz, ‘The elasticity of taxable income with respect to marginal tax rates: a critical review’, 2009, http://elsa.berkeley.edu/~saez/saez-slemrod-giertzJEL09elasticity.pdf also point out that if changes in reported individual incomes are the result of real changes in economic behaviour, such as reduced labour supply, then this will also have consequences for consumption tax revenue.

© Institute for Fiscal Studies, 2009 16
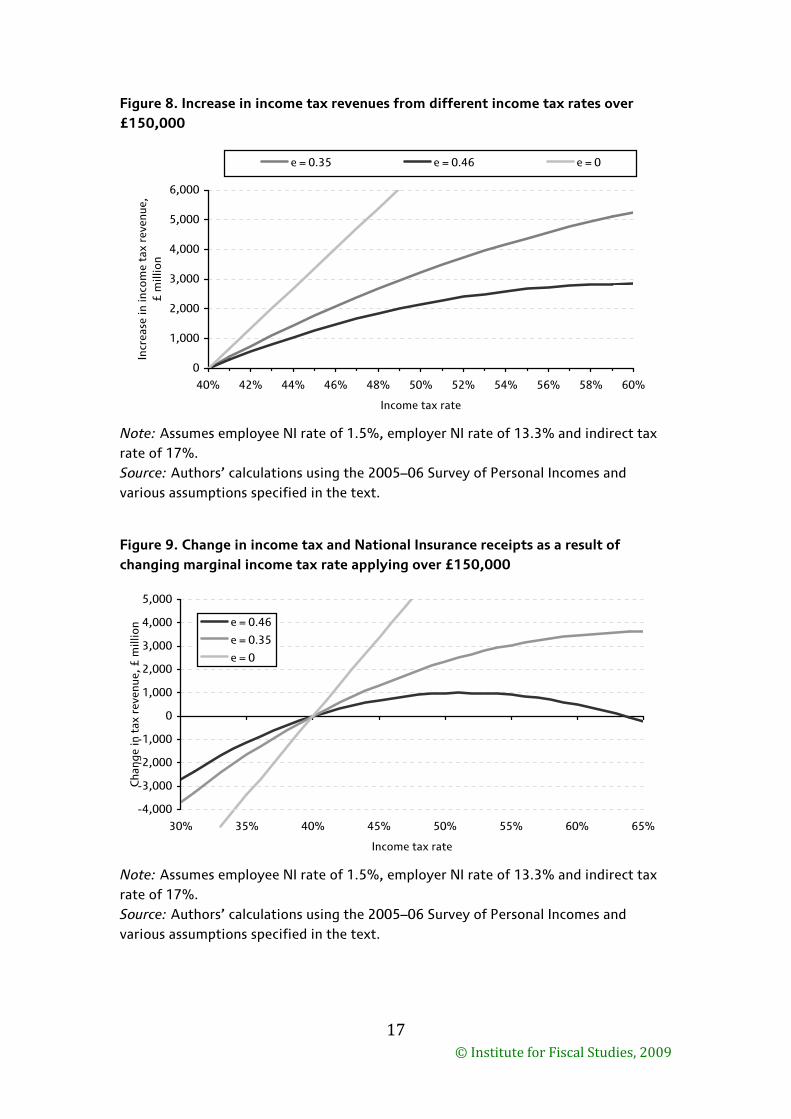
number, perhaps through changes in net migration of very rich individuals, or if the tax changes lead people to start or stop work or to alter their retirement age). On the other hand, if the only response of individuals to (say) a rise in the top rate of tax were to take greater advantage of tax planning and tax avoidance schemes, then it is possible that taxable income – i.e. that income known to the tax authorities and liable to income tax – may fall, as predicted by the taxable income elasticity, but with no impact on individuals’ overall income. In this case, there might be no impact on indirect tax revenues. In this case, overall tax revenues would clearly fall by less. To illustrate this, Figure 8 shows the impact on revenue from income tax from those with incomes over £150,000 when the marginal income tax rate on incomes above this level changes. It shows that, under BSS’s central estimate of the taxable income elasticity, income tax revenues are maximised at an income tax rate of around 60% and that the government’s proposed 45% income tax rate is estimated to increase income tax revenue by £1.3 billion, close to the government’s estimate of £1.6 billion. In fact, under the Treasury’s estimate of the elasticity, we estimate that the reform would increase income tax revenues by nearly £1.8 billion. It seems, therefore, that the Treasury is not only using a lower estimate of the taxable income elasticity than BSS, but also not taking into account any effect of the reform on any other tax revenues. However, the earned income tax base for National Insurance is similar to that for income tax, so if high-income individuals reduce their earned income in response to an increase in their marginal tax rate, it is highly likely that (employer) National Insurance receipts will fall as well. Figure 9 shows what happens to our estimates of the revenue effects if we take account of the impact on National Insurance contributions as well as income tax and assuming that earned and unearned income fall by the same proportion in response to a tax change. It shows that the rate of income tax that maximises combined income tax revenue and National Insurance contributions is around 51% under BSS’s central estimate of the elasticity and that a 45% income tax rate would increase revenues by around £0.7 billion. Under the Treasury’s lower estimate of the elasticity, the rate that maximises these revenues is above 60%, and a 45% income tax rate on incomes over £150,000 would raise £1.3 billion a year.
© Institute for Fiscal Studies, 2009 17
Figure 8. Increase in income tax revenues from different income tax rates over £150,000
0
1,000
2,000
3,000
4,000
5,000
6,000
40% 42% 44% 46% 48% 50% 52% 54% 56% 58% 60%
Income tax rate
Incr
ease
in in
com
e ta
x re
venu
e,£
mill
ion
e = 0.35 e = 0.46 e = 0
Note: Assumes employee NI rate of 1.5%, employer NI rate of 13.3% and indirect tax rate of 17%. Source: Authors’ calculations using the 2005–06 Survey of Personal Incomes and various assumptions specified in the text. Figure 9. Change in income tax and National Insurance receipts as a result of changing marginal income tax rate applying over £150,000
-4,000
-3,000
-2,000
-1,000
0
1,000
2,000
3,000
4,000
5,000
30% 35% 40% 45% 50% 55% 60% 65%
Income tax rate
Cha
nge
in t
ax r
even
ue, £
mill
ion e = 0.46
e = 0.35
e = 0
Note: Assumes employee NI rate of 1.5%, employer NI rate of 13.3% and indirect tax rate of 17%. Source: Authors’ calculations using the 2005–06 Survey of Personal Incomes and various assumptions specified in the text.
© Institute for Fiscal Studies, 2009 18
So the analysis in Figures 5 and 8 has suggested large ranges for the revenue-maximising top rate of income tax (from 40% to 60%) and for the amount of money raised by the proposed 45% income tax rate (from approximately nothing to £1.3 billion) assuming a taxable income elasticity of 0.46, depending on the nature of the behavioural response of the very rich and which tax revenues are being considered. These ranges are even wider if uncertainties concerning the elasticity are taken into account. However, arguably, we should be accounting for the effects of this reform on the revenues of even more taxes. For example, increasing the individual income tax rate but not the corporation tax rate could induce some self-employed individuals to incorporate and have income taxed as company profits and dividends rather than as self-employment income. This would reduce income tax revenue but increase corporate tax revenue. Only looking at the effect of tax changes on personal taxable income would therefore overstate the responsiveness of high-income individuals to changes in their marginal tax rate.19 Slemrod20 and Gordon and Slemrod21 showed that part of the increase in individual incomes after the Tax Reform Act of 1986 in the US, which reduced individual income tax rates relative to corporate tax rates, was due to a shift of income from the corporate to the personal sector. However, the fact that the government also intends to increase the income tax rate on dividends for those with incomes greater than £150,000 from 32.5% to 37.5% in 2011–12 would limit the incentive for individuals to do this. This response to the higher income tax rate may become more attractive, though, if the self-employed were prepared to defer compensation by retaining income within their companies to generate capital gains (to be realised when they sold their companies). The difference between the income tax rate of 45% and the 19 See E. Saez, J. Slemrod and S.H. Giertz, ‘The elasticity of taxable income with respect to marginal tax rates: a critical review’, 2009, http://elsa.berkeley.edu/~saez/saez-slemrod-giertzJEL09elasticity.pdf.
20 J. Slemrod, ‘High income families and the tax changes of the 1980s: the anatomy of behavioural response’, in M. Feldstein and J. Poterba (eds), Empirical Foundations of Household Taxation, University of Chicago Press, 1996.
21 R. Gordon and J. Slemrod, ‘Are “real” responses to taxes simply income shifting between corporate and personal tax bases?’, in J. Slemrod (ed.), Does Atlas Shrug? The Economic Consequences of Taxing the Rich, Cambridge University Press, 2000.

© Institute for Fiscal Studies, 2009 19
capital gains tax rate of 18% would provide a greater incentive to do this than when the income tax rate is 40%. 8. Withdrawal of the personal allowance above £100,000 Section 2 set out that the government intends there to be two short 60% income tax bands between £100,000 and £106,475 and between £140,000 and £146,475 from 2010–11. Just like the new higher rate of income tax, it seems likely that these will lead some people to reduce their income. The most direct impact will be on people who expect their income to fall within these ranges: they will face a considerable incentive to reduce their taxable income, perhaps by making additional private pension contributions,22 to the point where the phase-out begins.23 Using the SPI as before, we broadly agree with the government’s assessment that this change will raise £1.6 billion a year. Even if we assume that everyone whose income falls in the range where income is subject to a 60% marginal income tax rate reduces their taxable income to the bottom of that range in response to this reform, the reform would raise £1.3 billion, even allowing for reductions in indirect tax revenues (and it would raise £1.5 billion if only income tax revenues were considered). It would appear, then, that this change would have a large distortionary impact on a relatively small number of people. However, there will likely be other effects that are missed by considering only those whose marginal rate of income tax is affected: • Individuals with incomes between £106,475 and £140,000 would be paying £1,295 more in tax each year than before, and those with incomes greater than £146,475 would be paying £2,590 more. These individuals would find their marginal tax rate unaffected by this reform, though. But they may decide to work less hard and reduce their 22 Such individuals would receive income tax relief at 60% when making an individual contribution to their pension (and greater relief if it was made via their employer, for example through salary sacrifice), but would be likely to only face a tax rate of 40% on their pension income in retirement.
23 In this case, the main distortion created by this tax increase for these individuals would seem to be the additional effort expended by these individuals when managing their affairs in a tax-efficient way.

© Institute for Fiscal Studies, 2009 20
incomes below £100,000, emigrate from the UK, not migrate to the UK or retire earlier, if they considered the income tax burden to be too high. On the other hand, they might work harder in order to maintain their level of post-tax income. Given the sums involved, though, it seems unlikely that either effect will be significant, at least in the short term. • The 60% income tax bands reduce the incentive for an individual whose income is just below one of the bands to obtain a larger increase in their income (taking them into or above the band). Likewise, it reduces the cost to someone whose income is just above a band from reducing their income so that it lies within or below the band. Technically, these are non-marginal effects and are not captured by the analysis used in this Briefing Note, but these effects could be significant, particularly in the longer term. 9. Could the government raise any more money by squeezing the rich? If BSS are right about the level of responsiveness of high-income individuals to changes to their marginal tax rate, it does not seem as though introducing a new top rate of income tax above £150,000 could raise revenue for the government to any significant extent. In this section, we discuss other ways of raising revenue from the rich. 9.1 Introducing the higher rate from £100,000 rather than £150,000 The estimate of the taxable income elasticity from BSS was an estimate of the average responsiveness (weighted by income) of the top 1% of income earners, which roughly corresponds to those with incomes greater than £150,000 in 2011–12. While BSS do not present an estimate of an average elasticity of all those with incomes greater than £100,000, in response to a Freedom of Information request the Treasury included its estimate of 0.3 for this group, considerably lower than its estimate of 0.35 for the group with incomes greater than £150,000. This suggests that a higher rate of tax above £100,000 could raise some revenue for the government, as shown in Figure 10. Given HMT’s assumption about the taxable income elasticity of those with incomes greater than £100,000, introducing a higher rate of income tax slightly lower down the income distribution could raise a fairly considerable amount for the government. Given that very similar rates

© Institute for Fiscal Studies, 2009 21
applied only above £150,000 would lead to less tax revenue, this seems at first sight contradictory. There are two reasons for this result. First, the Treasury is implicitly assuming that those with incomes between £100,000 and £150,000 are relatively unresponsive to changes in their marginal tax rate.24 Second, when the income tax rate is raised from a lower level, the behavioural response of those with incomes greater than £150,000 is the same as when it is raised from a higher level, since it is assumed to only depend on the marginal tax rate, but they have to pay more tax as they have to pay the new higher rate over a wider range of income. As can be seen in Figure 10, an income tax rate of 47% above £100,000 would raise £1.6 billion, the amount the government expects from the 45% rate above £150,000. Applying this rate while maintaining the phase-out of the personal allowance would increase the marginal income tax rate to 67% in the two bands between £100,000 and £106,475 and between £140,000 and £146,475, though. If the increase did not apply within these bands, a 49% income tax rate would be needed to raise the £1.6 billion. An Figure 10. Change in income tax, National Insurance and indirect tax receipts as a result of changing marginal income tax rate applying over £100,000
-4,000
-3,000
-2,000
-1,000
0
1,000
2,000
3,000
4,000
30% 35% 40% 45% 50% 55% 60% 65%
Income tax rate
Cha
nge
in t
ax r
even
ue, £
mill
ion
e = 0.3
e = 0
Note: Assumes employee NI rate of 1.5%, employer NI rate of 13.3% and indirect tax rate of 17%. Source: Authors’ calculations using the 2005–06 Survey of Personal Incomes and various assumptions specified in the text.
24 An average elasticity of 0.3 above £100,000 and 0.35 above £150,000 implies that the average elasticity between £100,000 and £150,000 is 0.17.

© Institute for Fiscal Studies, 2009 22
alternative to both the 45% rate and the phase-out of the personal allowance would be to introduce a single income tax rate of 60% above £100,000. This would nearly be sufficient to raise the £3.2 billion the government expects from its income tax changes for the very rich. However, if the revenue-maximising marginal tax rate above £150,000 is 54%, as we obtain using the Treasury’s estimate of the taxable income elasticity, it must be true that if the income tax rate is above 54%, revenue could be raised by lowering this rate to 54%. For example, having an income tax rate of 55% between £100,000 and £150,000 and 54% above £150,000 would raise more than simply having an income tax rate of 55% above £100,000. Therefore, we now turn to the prospect of raising money by introducing a higher rate between £100,000 and £150,000 only. 9.2 Introducing a higher tax rate between £100,000 and £150,000 Generally, optimal tax theory tells us that marginal tax rates should be higher in parts of the income distribution where there are relatively few individuals relative to the number above that band and where individuals are less responsive to changes in their marginal tax rate. Therefore, it is possible that the optimal tax schedule would have higher marginal tax rates slightly below the top than at the very top, although it is unlikely to involve two large spikes in the marginal income tax rate schedule as it does under the government’s proposal. Since, as we stated above, the Treasury appears to believe that those with incomes between £100,000 and £150,000 are relatively unresponsive to changes in their marginal tax rate, a higher marginal tax rate between these levels would raise some money for the government. We saw in Section 5 that the revenue-maximising marginal tax rate above £150,000 using the Treasury’s estimate of the taxable income elasticity was 54% and that this would raise around £900 million. Applying this rate above £150,000 and a higher rate between £100,000 and £150,000 would enable the government to raise the £3.2 billion it expects to raise from the very rich.25 Using the Treasury’s elasticity of 0.35 above £150,000 and its implied elasticity of 0.17 between £100,000 and £150,000, we estimate that £3.2 billion could be raised by increasing the income tax rate to 59% 25 Note that this is in place of the phase-out of the personal allowance as well as the 45% income tax rate above £150,000.

© Institute for Fiscal Studies, 2009 23
between £100,000 and £150,000 and to 54% above £150,000. This takes into account the effect of behavioural response on consumption tax revenues. However, we must insert a note of caution here. So far, we have assumed that incomes at the very top of the income distribution are only dependent on the effective marginal tax rate. As we discussed in Section 8, though, the attractiveness of seeking a more substantial increase in income depends on the marginal tax rate over that whole range of income. This effect is ignored by this analysis, which concentrates solely on marginal effects. 9.3 Increasing the existing higher rate of income tax Another way of raising money from the rich would be to increase the higher rate of income tax (applying above £43,875 in 2009–10) above 40%. The Treasury’s Ready Reckoner estimates that each percentage point rise would raise £1.4 billion a year in 2011–12.26 Therefore, increasing the higher rate of income tax from 40% to 41% would raise nearly as much as the government expects from the 45% rate above £150,000. However, the Ready Reckoner costing does not take into account the effects of the reform on indirect tax revenues, so in reality government revenues might not increase by this much. Changing the higher rate of tax would only affect the richest 11% of individuals in 2011–12 according to our uprated SPI data. If the government wanted to raise an additional £3.2 billion from high-income individuals, allowing for behavioural response affecting indirect tax revenues also, an alternative to its two policies affecting those with incomes greater than £100,000 would be to raise the higher rate of income tax to 43%.27 This would represent a transfer of money from the rich to the very rich relative to the government’s plans but would have the 26 Source: HM Treasury, Tax Ready Reckoner and Tax Reliefs, November 2008 (http://www.hm-treasury.gov.uk/d/pbr08_taxreadyreckoner_287.pdf). This does allow for behavioural response but we do not have details of the elasticity used and we believe that the Treasury only examines the impact of the reform on income tax revenues.
27 The Ready Reckoner says that this would raise £4.2 billion, although this does not account for the effects of any behavioural response on indirect tax revenues. Taking these into account, government revenues should increase by at least £3.2 billion.
© Institute for Fiscal Studies, 2009 24
advantage of avoiding the complexity of the government’s package, with only two income tax brackets rather than seven. 9.4 Expanding the tax base Finally, the government could attempt to broaden the base of income tax in order to reduce the ability of high-income individuals to avoid paying income tax. So far, we have assumed that the taxable income elasticity is a structural parameter of the economy that cannot be altered by government policy. Kopczuk28 shows that the US Tax Reform Act of 1986, which increased the size of the tax base by reducing the number of deductions that could be made to taxable income, led to a reduction in the taxable income elasticity. A lower taxable income elasticity would imply that the revenue-maximising marginal tax rate was higher and that more money could be raised by increasing income tax rates. It is precisely this argument that the Treasury is using when it argues that the taxable income elasticity used should be ‘revised down’ as a result of the measure announced in the 2008 Pre-Budget Report to freeze the lifetime limit for contributions to pensions for five years. This would restrict the extent to which high-income individuals can avoid paying the 45% rate of tax by putting more money into their pension funds. The extent to which this will reduce the taxable income elasticity is open to question, though. The US Tax Reform Act of 1986 represented a significant simplification of the tax code and substantially reduced the number of deductions that could be made to income. Kopczuk (ibid.) concludes that these tax simplifications ‘reduced the elasticity of reported income to the tax rate at the mean tax base from 0.199 to 0.155’, a reduction of 0.044 or 22.1%. That was a much larger reform than freezing the lifetime limit for pension contributions, so we would expect the effect to be much smaller for this reform. However, Kopczuk’s figure is for all married individuals, not the top 1% of the income distribution. He shows that the responsiveness is greater for those on high incomes, mainly because they are more likely to take advantage of deductions. Therefore, reducing the number of deductions would have had a greater effect on 28 W. Kopczuk, ‘Tax bases, tax rates and the optimal elasticity of reported income’, Journal of Public Economics, 89, 2093–119, 2005.

© Institute for Fiscal Studies, 2009 25
their responsiveness to changes in their marginal tax rate than on that of the population as a whole. Even taking this into account, though, assuming that the taxable income elasticity will fall from 0.4 to 0.35 (a reduction of 0.05 or 12.5%) in response to a relatively small policy change seems optimistic. Nevertheless, in general, more anti-avoidance activity could reduce the ability of high-income individuals to respond to changes in their marginal tax rate in ways that would reduce the amount of government revenue, which would enable more money to be raised from increasing the marginal tax rate faced by these individuals. For example, the extent to which high-income individuals can avoid higher rates of income tax by converting income to capital gains depends on the gap between their marginal income tax rate and the capital gains tax rate, currently 18%. It therefore follows that an increase in the main rate of capital gains tax would not only increase revenues from capital gains, but would also reduce individuals’ responsiveness to higher income tax rates, increasing the revenue-maximising top income tax rate. 10. Conclusion This Briefing Note has discussed the scope for raising more revenue from the very rich, and the amount of revenue that is likely to be raised by the government’s proposed 45% rate of income tax on incomes above £150,000. It has shown that there is considerable uncertainty over the revenue that could be raised from the very rich, both because of statistical imprecision in the parameters used in this calculation and because of uncertainty over the precise nature of the response of the very rich and which tax revenues would be affected. However, it has argued the following: • Under the central estimate of the taxable income elasticity estimated by a recent contribution to the Mirrlees Review, and taking a pessimistic view that behavioural responses to higher rates of income tax lead to genuine falls in income, and thus spending, amongst the very rich, the current rate of 40% is estimated to be the revenue-maximising rate. The proposed income tax rate of 45% on incomes above £150,000 would therefore cost rather than raise money.
© Institute for Fiscal Studies, 2009 26
• The Treasury has estimated that the measure would raise £1.6 billion. Part of the reason why this is higher than our estimate is that the Treasury assumed an elasticity that was lower than that in BSS, although well within the statistical margin of error. However, this is by no means sufficient to explain the difference between the two estimates. It would appear that the Treasury has not allowed the behavioural response to affect revenues other than income tax receipts. Our estimate, using the Treasury’s elasticity but considering the impact on revenues from National Insurance and consumption taxes as well, would be £0.6 billion. • The Treasury’s assumption for the taxable income elasticity is not implausible, but it seems unlikely that the taxable income elasticity will be reduced by as much as the government predicts by the decision to freeze the lifetime pension contribution limit. • An alternative way of raising £3 billion, albeit one which would transfer money from the rich to the very rich compared with the government’s plans, would be to abandon both the 45% income tax rate and the phase-out of the personal allowance for those with incomes above £100,000, and replace both with an increase in the higher rate of income tax from 40% to 43%.