can electric propulsion help to reduce air pollution … · 4.2 level of air pollution generated by...
TRANSCRIPT
Hanna Pzenioslo UPM 4
CAN ELECTRIC PROPULSION HELP TO REDUCE AIR POLLUTION FROM URBAN FREIGHT TRANSPORT IN A COST-EFFECTIVE WAY? CASE STUDY OF COPENHAGEN MUNICIPALITY

Can electric propulsion help to reduce air pollution from urban freight transport in a cost-effective way? Case study of Copenhagen
Municipality
2
List of Content List of Figures ......................................................................................................................................4
List of Tables .......................................................................................................................................5
Executive summary .............................................................................................................................7
1. Introduction: project motivation and scope of the thesis.............................................................8
1.1 Background ...............................................................................................................................8
1.1.1 Impacts of air pollution generated by transport ...........................................................8
1.1.2 Types of air pollutants generated by transport, their source and significance of an impact
of specific pollutants ...................................................................................................................9
1.1.3 Approaches to reduction of air pollution from transport................................................... 12
1.1.5 Cost-effectiveness of reduction of air pollution................................................................. 17
1.1.4 Motivation for choosing Copenhagen Municipality as a focus area ................................... 19
Interest of Copenhagen Municipality in electric freight vehicles and night distribution .............. 19
1.1 Research question ............................................................................................................. 21
1.2 Structure of the report ...................................................................................................... 23
2. Theoretical foundations ................................................................................................................ 25
2.1 Theory of external costs: cost-effectiveness of reduction of external costs .............................. 25
2.1.1 What external cost is and how it is created ....................................................................... 25
2.1.2 Measurement of which external costs is useful – all or narrowed down to a specific
geographic area? ....................................................................................................................... 26
2.1.3 Where does an optimum level of air pollution lie? Is 100% reduction a goal or a level for
which reduction of air pollution is cost-effective? ..................................................................... 27
2.2 Method for measurement of costs of air pollution produced by transport ............................... 30
2.3 Method for measurement of abatement costs of electric vehicles ........................................... 32
2.3.1 Method for comparison of costs of conventional and electric vehicles .............................. 32
2.3.3 Method for comparison of costs of day and night distribution .......................................... 35
3. Methodology ................................................................................................................................ 38
3.1 General comments .................................................................................................................. 38
3.2 Methods applied ..................................................................................................................... 41
3.2.1 Cost-effectiveness of reduction of air pollution–method for assessment of abatement tool
of electric freight vans ............................................................................................................... 41
3.2.2 Scenario method – a method for assessment of abatement tools ..................................... 42
3.2.3 Case study method ........................................................................................................... 45
4. Analysis of cost-effectiveness of reduction of air pollution through deployment of electric freight
vehicles for urban goods distribution. Case study of Copenhagen Municipality ................................. 51
Can electric propulsion help to reduce air pollution from urban freight transport in a cost-effective way? Case study of Copenhagen
Municipality
3
4.1 General method applied .......................................................................................................... 51
4.2 Level of air pollution generated by freight transport in Copenhagen ....................................... 54
Summary................................................................................................................................... 58
4.3 Costs of air pollution generated by freight transport in Copenhagen ....................................... 58
Cost of pollution produced by conventional freight vans ........................................................... 58
Cost of pollution produced by electric freight vans .................................................................... 59
Summary................................................................................................................................... 61
4.4 Cost of deployment of electric freight vehicles by companies for day time goods deliveries in
Copenhagen .................................................................................................................................. 61
Comment on input data ............................................................................................................ 61
Calculation of difference in cost of conventional and electric freight van ................................... 63
Calculation of a difference in a total cost of vehicles ................................................................. 64
Summary................................................................................................................................... 67
4.5 Difference in cost of electric and conventional freight vans by companies operating in the day
and night time in Copenhagen Municipality .................................................................................. 67
Estimation for Copenhagen Municipality ................................................................................... 68
4.6 Cost-effectiveness of reduction of air pollution through electric freight vans in Copenhagen
Municipality .................................................................................................................................. 70
5 Discussion of findings on cost-effectiveness of reduction of air pollution with electric vehicles
deployed for day and night time operation ....................................................................................... 71
5. 1. Consideration of differences in cost of vehicles .................................................................... 71
5.2 Consideration of difference in cost of pollution ....................................................................... 74
5.3 Discussion of potential impact of night distribution on the increased competitiveness and cost-
effectiveness of reduction of air pollution through electric freight vans. ....................................... 76
5.4 Beyond cost-effectiveness: how much does it matter that electric freight vans can reduce
pollution in a cost-effective way? .................................................................................................. 77
5.4.1 How much of the total air pollution present in Copenhagen Municipality can be reduced by
electric freight vans? ................................................................................................................. 77
5.4.2 How significant is a cost of a vehicle in the total cost of goods deliveries activities? .......... 78
5.4.3 What is a cost-effectiveness of electric vehicle compared to other alternative fuels? ....... 78
6. Conclusions ................................................................................................................................... 80
7. References .................................................................................................................................... 84
8. Appendixes ................................................................................................................................... 88
8.1 Questionnaire with answers from a phone-based semi-structured interview with Robert
Goevaers on night distribution in the Netherlands (PIEK project). ................................................. 88
8.2 Calculations of costs of night distribution for Rotterdam. ........................................................ 90

Can electric propulsion help to reduce air pollution from urban freight transport in a cost-effective way? Case study of Copenhagen
Municipality
4
List of Figures
Figure 1 Forecasts for transport related emission of air pollution ...................................................... 11
Figure 2 Factors contributing to transport air pollution emission ...................................................... 12
Figure 3 Scope of available tools within reduction of air pollution from transport activities in cities .. 13
Figure 4 Process of choosing tool for reduction of air pollution ......................................................... 14
Figure 5 Process of choosing electric vehicles as a potential tool for reduction of air pollution from transport
in cities .............................................................................................................................................. 14
Figure 6 Comparison of energy use for vehicles fuelled with different alternative fuels ..................... 15
Figure 7 Sources of TTW emission from ICE vehicles.......................................................................... 17
Figure 8 Night distribution effects on the cost and air quality ............................................................ 19
Figure 9 A graphic presentation of Environmental external cost ........................................................ 25
Figure 10 Genesis of the environmental externalities: chain reaction ................................................ 26
Figure 11 Situation of not optimal price for reduction of air pollution ............................................... 27
Figure 12 A real-life location of an optimal level of environmental improvement ............................ 29
Figure 13 An applied for the needs of empirical researches location ................................................ 30
Figure 14 General steps within the process of calculation of costs of pollution .................................. 31
Figure 15 Method for calculation of costs of pollution in a specific area ............................................ 31
Figure 16 Cost factors of a vehicle ownership and usage ................................................................... 32
Figure 17 General method used for estimation of cost-effectiveness of reduction of air pollution
through electric freight vans in Copenhagen Municipality ................................................................. 42
Figure 19 Composition of CO2 reduction from different initiatives planned within CPH 2025 Climate
Plans ................................................................................................................................................. 49
Figure 20 Goals for CO2 emission from energy production in Copenhagen Municipality in 2025. ...... 50
Figure 21 Cost composition for electric light trucks ........................................................................... 62
Figure 22 Estimation of difference in cost of conventional and electric vehicles for Copenhagen
Municipality ...................................................................................................................................... 64
Figure 23 Exemplary difference in purchase + fuel cost of electric and conventional freight van GVW
3-3,5t ................................................................................................................................................ 66
Figure 24 Exemplary difference in purchase + fuel cost of electric and conventional freight van GVW
2-3 t .................................................................................................................................................. 66
Figure 25 Exemplary difference in purchase + fuel cost of electric and conventional freight van GVW
0-2 t .................................................................................................................................................. 66
Figure 26 Input data for calculation of difference in fuel cost between day and night ....................... 69
Figure 27 Difference in purchase + fuel cost difference for the night time operation ........................ 69

Can electric propulsion help to reduce air pollution from urban freight transport in a cost-effective way? Case study of Copenhagen
Municipality
5
List of Tables Table 1 Comparison of CO2 emission produced from vehicles fuelled with different alternative fuels
for Greece......................................................................................................................................... 15
Table 2 Limits on air pollution with Euro standards ........................................................................... 16
Table 3 Values for local air pollution produced from electrical vehicles ............................................. 16
Table 4 Comparison of costs of alternative fuels for vehicles. ............................................................ 18
Table 5 Methods applied in the current research .............................................................................. 41
Table 6 Health costs of air pollution in Copenhagen Municipality ...................................................... 45
Table 7 Costs of air pollution generated from road transport in Copenhagen by transport mode
[DKK/km] .......................................................................................................................................... 46
Table 8 Composition of costs of pollution generated by road transport in Copenhagen. ................... 47
Table 9 Composition of road transport in Copenhagen...................................................................... 47
Table 10 Composition of freight vehicles fleet in Copenhagen ........................................................... 48
Table 11 An average daily traffic in Copenhagen on a normal weekday . .......................................... 48
Table 12 WTW Emission from freight vans in Denmark [g/km] .......................................................... 54
Table 13 Average emission from energy plants in Denmark............................................................... 55
Table 14 GVW-splitted goods transportation with freight vans in Copenhagen Municipality ............. 55
Table 15 Estimation of energy consumption by freight electric vans for Copenhagen Municipality .... 56
Table 16 Estimation of air pollution produced by freight electric vans for Copenhagen Municipality . 56
Table 17 Estimation of pollution generated by traffic in Copenhagen ................................................ 57
Table 18 Emission from 1 electric and 1 conventional freight van in Copenhagen Municipality ......... 58
Table 19 Estimation of cost of pollution for Copenhagen daily traffic for different shares of EVs in the
traffic flow ....................................................................................................................................... 61
Table 20 Estimation of energy costs for conventional and electric freight vans ................................. 63
Table 21 Difference in purchase cost per year assuming 1-8 years utilisation of ................................ 65
Table 22 Difference in purchase cost per year with tax exemption per year assuming 1-8 years
utilisation of electric freight van and 8 years utilisation of diesel freight van ................................... 65
Table 23 Difference in purchase + fuel cost per year ........................................................................ 65
Table 24 Cost of noise reducing equipment required for performance night distribution in the
Netherlands ...................................................................................................................................... 67
Table 25 Difference in fuel costs per year between Mercedes Benz Vito E-cell and Mercedes Benz
Vito ................................................................................................................................................... 69

Can electric propulsion help to reduce air pollution from urban freight transport in a cost-effective way? Case study of Copenhagen
Municipality
6
Title: Can electric propulsion help to reduce air pollution from urban freight transport in a cost-
effective way? Case study of Copenhagen Municipality.
Theme: Sustainable mobility
Project period: 1st of February 2013 – 6th of June 2013
Project type: Master thesis in Urban Planning and Management
Author: Hanna Przenioslo
Supervisor: Morten Skou Nicolaisen
Total pages: 89
Physical copies: 2
I wish to express my gratitude to supervisor, Morten Skou Nicolaisen and to Jin Xue for their both
ordering and inspiring comments.

Can electric propulsion help to reduce air pollution from urban freight transport in a cost-effective way? Case study of Copenhagen
Municipality
7
Executive summary
This paper aims to analyse potential of electric freight vans to decrease air pollution generated by
transport in Copenhagen Municipality and to find out if this can be done in a cost-effective way.
Results show that it is not a cost-effective solution, mainly due to high purchase costs of an electric
freight van. However, if electric freight vans were deployed, costs of pollution from transport of
goods in this municipality would be remarkably reduced. Though, when it comes to reduction of air
pollution from whole road transport in Copenhagen Municipality it is visible, that it is not a first need
action; much higher reduction of pollution can be achieved from the passenger transport. When
these actions are already undertaken, as it is in Copenhagen Municipality, focus should be directed in
the next place on freight vans, since this is a second most polluting mode of transport operating in
this municipality. Moreover, policies targeted on passenger vehicles and freight vans should focus on
decreasing number of vehicles. This way two benefits are gained: pollution and congestion decrease.
Decline in congestion can be also achieved by shifting freight vehicles to night operation. Though,
increase in competitiveness of electric freight vans against conventional vans cannot be achieved
through this action.

Can electric propulsion help to reduce air pollution from urban freight transport in a cost-effective way? Case study of Copenhagen
Municipality
8
1. Introduction: project motivation and scope of the thesis
1.1 Background
External costs of transport in cities are more intense compared to smaller settlements. This is caused
by a high density of transport activities performed there. Air pollution is one of several external costs
produced by transport in cities. Others are noise, congestion, safety of pedestrians, time losses and
increased energy usage. Though, due to limited financial resources, public policies must direct them
only to these fields, which pose the biggest problems. Therefore, this section firstly aims to describe
scope of negative effects of air pollution generated by transport in cities, to consider importance of
this problem. Further, also significance of impact of specific air pollutants generated by transport is
discussed, with a distinction of source of their generation. This is an important information to assess
which pollution can be eliminated with deployment of electric vehicles and which cannot. When
problems are identified, main groups of approaches to deal with them are shortly presented. Within
these approaches, electric vehicles solution is chosen as a central point of analysis of this paper. For
that reason, next step of this section is an initial consideration of cost-effectiveness of reduction of
air pollution with this solution, which would be built up throughout the whole paper. Finally,
motivation for choice of Copenhagen Municipality as a case study area for discussion of this issue is
presented.
1.1.1 Impacts of air pollution generated by transport
Impacts generated by air pollution can be considered in two or three dimensions: local, regional and
global (K. BUTTON 2010, P. 165). External effect of air pollution at the global level and regional level are
visible in the impact on environment: at the global level global warming and ozone layer degradation,
while at the regional mainly in form of acid rains. Finally, impacts at the local level, especially in cities,
is primarily visible in the negative effect on health of inhabitants of the area (K. BUTTON 2010, P. 165)1.
As this paper aims at discussing pollution in the cities, its focus is concentrated mainly on local
impacts of air pollution; impact of pollution generated at the higher levels are also considered, but
only in regards to their impacts for the local level.
According to WHO estimations from 2002, 100 000 deaths yearly in the WHO European region
(Europe, Middle east and Central Asia) can be associated with presence of air pollution in cities (WHO
2005, P.185). Further, the average life expectancy in the Region is suspected to be shortened by one
year due to air pollution. When it comes to transport, it is responsible for a big part of external
1 In general, health effects are estimated to be the most important cost factor produced by air pollution: health
costs accounts for 95% of the damage costs caused by particles, NOx and SO2 (K. FUNK, A. RABL 1999, P. 399).

Can electric propulsion help to reduce air pollution from urban freight transport in a cost-effective way? Case study of Copenhagen
Municipality
9
effects of air pollution present in cities. One of the examples can be that the death toll from
transport related air pollution is of similar size to that caused by traffic accidents (wHO 2005, P. XVI).
Air pollution has severe effect on health of people in general, but especially in urban areas, where
the number of vehicles per land unit is the highest and a synergistic effect exists in the cities, where
emission of different pollutants generates smog and surface zone (K. BUTTON 2010, P. 180).
According to WHO, air pollution generated by transport contributes to: increased mortality
(cardiopulmonary causes), increased risk of respiratory morbidity, non-allergic respiratory problems,
allergic reactions of people suffering from asthma can increase premature births and to low birth
weight. It is suspected, that air pollution contributes to cancer, but there are insufficient proves to
conclude on this (WHO 2005, P.169). On the other hand, it must be noted, that it is hard to estimate
health effects generated by a specific activity – e.g. transport, as it very hard to distinguish effects of
the pollution generated by specific activity from the whole from air pollution mix present in cities. It
is mainly because a negative effect on health of specific pollutants cannot be identified, since in
many cases only presence of two or more pollutants generates a negative effect on health (WHO,
2005, P.XVI).
Goods distribution in cities accounts for a significant share of pollution generated in cities: 25 % of
CO2 emission, 30% of nitrate oxides and 50% of the particulates is generated by trucks and vans in
cities (C. MACHARIS, S. MELO 2011, P.21). One of the reasons for this is they are a heavy energy
consumers (COST 321 ACTION 1998). Another is that diesel is the most commonly used fuel type for
freight urban transport (BESTUFS 2010, P.21). It is important information, since emission of particle
matter from diesel vehicles is 8-9 times higher than this emission from gasoline vehicles (s.s. JENSEN,
M. KETZEL & M. S. ANDERSEN 2010, P.44), and particle matter accounts for majority of costs of pollution
generated in cities. Moreover, freight vehicles pollute more, since they make frequent stops: the fuel
consumption increases strongly if the vehicle has to stop very often: with five stops on a distance of
10 km the fuel consumption increases by 140% (BESTUFS 2010, P. 55). Further, freight vehicles used to
transport goods in cities pollute more than long haulage vehicles per km. It is because they do not
have to travel long distances, so companies are using in the cities the oldest vehicles from the fleet
(C. MACHARIS, S.MELO 2011, P.21).
1.1.2 Types of air pollutants generated by transport, their source and significance of an
impact of specific pollutants
For the reasons of this research it is important to distinguish pollution generated in TTW part of
production of pollution by vehicles and more specifically, by different parts of a vehicle (e.g. engine,

Can electric propulsion help to reduce air pollution from urban freight transport in a cost-effective way? Case study of Copenhagen
Municipality
10
wear and tire of brakes or tires). This is done in order to learn which negative effects on health and
environment in cities can be decreased through the deployment of electric freight vehicles. This
pertains to both the types of pollution and the magnitude of the adverse effects impose by them.
Source of emission and impact of specific local pollutants are presented below:
Particulate matter, fine solids or liquid particles (...) such as dust, smoke or smog (BUTTON, 2010,
P.178), are emitted from the combustion process in the vehicle’s engine, from brakes’ usage
(which is also powered by the vehicle’s engine) and wear of tires (BUTTON, 2010, P.179). It is
estimated, that traffic accounts for 25-50% of emission of particulate matters in cities (WHO,
2005, P.70). Particulate matters were found to be a transport related pollutant generating the
most severe effects on health (BUTTON, 2010, P.179). Since health costs account for majority of
costs of local air pollution, particle matter is also the most significant contributor to total costs of
local air pollution (CE DELFT 2008, P. 46).
Nitrogen oxides, sulphur dioxide and carbon monoxide are created during process of fuel
burning in the combustion engine (MINISTRY OF ENVIRONMENT, 2009). Transport is responsible for
80% of its emission in cities (MINISTRY OF ENVIRONMENT 2009). A half of carbon monoxide emission
is generated by transport (K. BUTTON 2010, P.180). When it comes to sulphur dioxide, only 5% of
its emission is directly connected with transport, while the major contributor to its emissions are
coal-based energy plants producing electricity (K. BUTTON 2010, p.181).
Volatile organic compounds are emitted during exhaust emission from vehicles (MINISTRY OF
ENVIRONMENT 2009).
Lead was for a long time a component of petrol, however usage of leaded petrol is banned in
Europe from 19990s (WHO 2006, P.1); transport accounted for around 100% emission of lead in
the core urban areas (K. BUTTON 2010, P.178).
Emission of the following pollutants exceeds emission standards levels established for Europe:
particulate matters (different sizes), nitrogen oxides, benzene (one of volatile organic compounds),
sulphur oxide and carbon monoxide (WHO 2005, P.65), (CE DELFT 2008, P.46). Being more specific about
air pollutants emitted by transport in European cities, the main exceeding emission norms for Europe
are nitrogen dioxide and benzene (WHO 2005, P.XIII). However, emission of the majority of listed
above pollutants is expected to decrease in Europe to the level meeting EU norms for air pollution
values, mainly due to EU regulations on vehicles’ emission and fuel used. Remaining problem is CO2,
which is forecasted not to fall, but even to grow (WHO, 2005, P. XIV,24), as can be noted from Figure 1:

Can electric propulsion help to reduce air pollution from urban freight transport in a cost-effective way? Case study of Copenhagen
Municipality
11
Figure 1 Forecasts for transport related emission of air pollution
Source: WHO, 2005, P.24
Lack of visible impact of carbon dioxide on the local environment. Should then external costs of
CO2 emission be ignored in the calculation of the local scale costs of pollution?
Greenhouse gases are generated during combustion process in the vehicle’s engine (K. BUTTON 2010,
P.179). 25% of total carbon dioxide is emitted from transport, which 75% share is produced by road
transport (EU TRANSPORT GHG 2011). Effects of greenhouse gases have a global character: they are
strongly suspected to contribute to global warming and degradation of ozone layer (K. BUTTON 2010,
P.165). Currently, impacts of global warming and degradation of ozone layer are not significant, but
they will become in the near future. Future external costs linked to greenhouse gases emission in
cities can be created by the following: flooding caused by rising sea levels and extreme weather
conditions, health costs associated with temperature changes, changes in the energy consumption
(decreased heating during warmer winters but increased use of air conditioning during warmer
summers), increased cost of water (higher demand for water from agriculture caused by warmer
climate), harm of ecosystem and biodiversity, and hard to estimate external costs of so called “major
events” (e.g. loss of ice sheet on Greenland) (CE DELFT 2008, P. 72).
As external costs of global warming and ozone layer degradation are currently visible to small
extent, it is hard to calculate their cost, especially for a specific area (at the local level); neither
nitrous oxide nor methane nor carbon dioxide was yet found to have currently a remarkable negative
effect at the local level. Therefore, in order to calculate external cost of greenhouse gases emission
at the local level, it is necessary to estimate future external costs of global warming and degradation
of ozone layer: both future damage costs (external costs) and current avoidance costs (abatement
costs). Damage costs are hard to estimate, but the costs needed to avoid them can be calculated on

Can electric propulsion help to reduce air pollution from urban freight transport in a cost-effective way? Case study of Copenhagen
Municipality
12
the basis of the developed scenarios for different avoidance policy tools and different levels of
desired greenhouse gases reduction (CE DELFT 2008, P. 74).
CO2 is one of several components of greenhouse gases produced by transport (two other main
contributors to climate change effects are nitrous oxide - N2O and methane - CH4), but researchers
tend to present their impacts together with CO2 in form of CO2 equivalent emission (CE Delft 2008,
P.73).
1.1.3 Approaches to reduction of air pollution from transport
This section firstly presents briefly different approaches to reduction of air pollution, and later
focuses more on technological changes approach and within it on electric vehicles. The main aim is to
show how much emission can be eliminated, in regards to different technological improvements of
the vehicle.
Different approaches to reduction of air pollution from transport
Figure 2 presents division into 3 factors influencing emission air pollution from transport, but they
could be also summarized into 2 more general ones. First, decoupling transport from external
environmental effects (such as decrease of emission per unit of fuel), and second decoupling
economic activities from transport demand (such as decrease of total transport services demanded
and increased efficiency in performing transport services (WORLD BANK B, 2004, P.20).
Figure 2 Factors contributing to transport air pollution emission
Source: WORLD BANK B, 2004, P.21.
Approach aiming to decrease emission per unit of fuel is a broadly discussed policy. More and more
restrictive standards for emission from vehicles are being established in many countries; support for
deployment of alternative fuels is also visible (WORLD BANK A, 2005, P.6). However, some drivers would
rather pay a fine for not obeying established emission standards, than invest into new technologies.
Moreover, traffic congestion, spread of urban areas and increased commuting time may offset the
benefits derived from these [technological] improvements (WHO, 2005, P.XIV).

Can electric propulsion help to reduce air pollution from urban freight transport in a cost-effective way? Case study of Copenhagen
Municipality
13
Therefore, approach to decrease of total transport services demand, as well as fuel consumption per
unit of transport service is also an important complementary option to consider by public authorities.
These options are often not directly attempting to decrease air pollution, but to deal with problems
perceived as important for drivers, such as congestion. However, in the end, through, for instance,
decrease of congestion, they contribute to reduction of air pollution: segregated busways increase
vehicle speed and yield travel time savings for passengers; they concurrently tend to reduce emissions
per passenger kilometre (WORLD BANK A, 2005, P.6).
Within discussed options, there can be identified specific tools, as presented in the Figure 3.
Figure 3 Scope of available tools within reduction of air pollution from transport activities in cities
Source: own drawing on the basis of WORLD BANK B, 2004.
Assessment of specific solution can be achieved through consideration of the following issues, as
described in Figure 4:

Can electric propulsion help to reduce air pollution from urban freight transport in a cost-effective way? Case study of Copenhagen
Municipality
14
Figure 4 Process of choosing tool for reduction of air pollution
Source: WORLD BANK 2004, P.7.
Reproducing the scheme for air pollution generated by transport in cities, the following answers
could be given:
Figure 5 Process of choosing electric vehicles as a potential tool for reduction of air pollution from transport in cities
Source: own drawing, on the basis of WORLD BANK 2004, P.7.

Can electric propulsion help to reduce air pollution from urban freight transport in a cost-effective way? Case study of Copenhagen
Municipality
15
One of solutions: alternative fuels and showing how much electric vehicles reduce compared to
others.
Alternative fuels technology, and within this electric vehicles tool was chosen as a focus of discussion
of the current paper. Electric vehicles can decouple the most emission from transport, considering
the currently available alternative fuels. An advantage over conventional fuels and other alternative
fuels is especially visible at the local level, especially in cities, as exhaust fumes are totally eliminated
with electric vehicles and the emission is generated outside the city, i.e. from energy plants. From
Table 1, it is visible that EVs can decrease CO2 levels more than other alternative fuels (of course
place of electricity in this rank strongly depends on the share on the composition of sources for
energy production, which differ from country to country). However, it is also visible, that this level of
air pollution reduction is possible only if electricity is produced from renewable resources.
Table 1 Comparison of CO2 emission produced from vehicles fuelled with different alternative fuels for Greece.
Source: K. G. TSITA, P. A. PILAVACHI 2012, P.682.
Further, electricity is a more energy efficient source of fuel for vehicles than both conventional and
other alternative fuels, as can be noted from Figure 6:
Figure 6 Comparison of energy use for vehicles fuelled with different alternative fuels
Source: Wei Shen at all 2012, p. 303 (data for China).
ICE ICE + 1st generation
biofuels
ICE + 2nd generation
biofuels
Fuel cell Hybrid Plug-in hybrid
Electric vehicle
CO 2 emission (WTW
measurement) [g/km]
167.5 161.2 83.8 95.4 158.2 105.8 72.9

Can electric propulsion help to reduce air pollution from urban freight transport in a cost-effective way? Case study of Copenhagen
Municipality
16
Electric vehicles can also emit less local pollutants that conventional vehicles meeting the highest
standards for emission in Europe (Euro VI), especially when energy is produced from clean sources,
as can be noted when Table 2 and Table 3 are compared:
Table 2 Limits on air pollution with Euro standards
Source: THE INTERNATIONAL COUNCIL ON CLEAN TRANSPORT, TTW approach, 2011, P.37 (data for European Union)
Table 3 Values for local air pollution produced from electrical vehicles [g/km]
Directly from electric vehicle
0 0 0 0,002 0
From energy plant
0,019 0,007 0,061 0,016
Source: Data for Denmark calculated in WTW approach.
Following information included earlier in this chapter (section 1.1.2), local air pollutants generated
directly by vehicles are produced almost exclusively during the process of fuel burning in the
combustion engine and related activities (usage of brakes). Hence, they are no longer produced, if an
electric vehicle is deployed. Particle matters, is the only component of air pollution produced by non-
exhaust related activities of a vehicle, namely from tear of tires and usage of a clutch, so this
emission is not excluded from driving an electric vehicle (see Figure 7). However, particle matters
emission produced from these sources is so small, that researches tend to not include them in
calculations and therefore local air pollution produced by electric vehicles is generally assumed to be
none (COUNCIL OF EUROPE 1998).

Can electric propulsion help to reduce air pollution from urban freight transport in a cost-effective way? Case study of Copenhagen
Municipality
17
TTW emission from internal combustion engine vehicles:
exhaust emissions under thermally stabilized engine operation (hot emissions);
exhaust emissions during transient operation after engine start-up (cold-start emissions);
emissions originating directly from fuel evaporation;
non-exhaust PM emissions produced by wear on vehicle components (such as tyres, brakes
and clutch) and road abrasion.
Source: WHO, 2010, P.25
However, if not only TTW (tank-to-wheels; pollution generated directly by a vehicle, from its
operation) pollution is included, but also WTT (well-to-tank; pollution indirectly generated by a
vehicle, during production of fuel for a vehicle), then electric vehicles have an important indirect
source of pollution, i.e. energy plants, which supply electric vehicles with electricity. In order to be
truly environmentally friendly, electricity for electric vehicles must be produced from clean energy
sources, what further requires deployment of a smart grid in order to balance fluctuations of energy
supply. However, there is a long way to achieve this goal, mainly due to inconvenience plus low
benefits associated with using smart grid for charging batteries of electric vehicles by individual
households (E-MOBILITY NSR B, 2013).
To sum up, for the mentioned above reasons, it seems to be reasonable to discuss deeper electric
vehicle tool. Trend in European Union shows that a main chance for vehicles fuelled with alternative
fuel sources, at least on the European market, lies in commercial vehicles used in cities. The other
markets are expected not to switch to alternative fuels, but to more efficient diesel engines: The 15
countries belonging to the EU before May 2004, however, are likely to shift significantly towards
more efficient diesel engines, but not towards alternative fuels, whose small fraction mainly reflects
their use only in dedicated applications, such as urban fleets and company cars (WHO, 2005, P.20).
1.1.5 Cost-effectiveness of reduction of air pollution
Sustainable transport cannot be achieved by focusing on reduction of external environmental costs
alone, without consideration of the effect created by this action in the two other dimensions –
economy and society. Only the three of them taken together create a sustainable future. Hence,
reduction of negative environmental effects should not be performed in a way where the expense
borne by the economy is unreasonably high. One of the criteria that can be given to characterize a
“reasonable cost”, is that the valued monetary benefit for environment or society (decrease of
external costs such as health treatment costs) is not higher than the cost borne to achieve this
Figure 7 Sources of TTW emission from ICE vehicles

Can electric propulsion help to reduce air pollution from urban freight transport in a cost-effective way? Case study of Copenhagen
Municipality
18
benefit (abatement cost). This way, society, who finances through taxation actions for reduction of
external environmental costs, pays purely for the benefit achieved.
High cost of electric vehicles
The high financial costs of electric vehicles influence their applicability and put a question mark on
rationality of supporting their deployment by public authorities. High cost of electric vehicles is linked
mainly to a purchase cost, which is almost always higher than of conventional ones. On the other
hand, operational costs of electric vehicles (especially this fuel associated) proved to be in several
cases lower than this for conventional vehicles (see for instance: B. A. DAVIS, M. A. FIGLIOZZI, 2012, P.
135), but not in all of them (see for instance: EA ENERGIANALYSE, 2011, P.30).
Cost of deployment of an electric vehicle can occur to be higher than the associated benefits for
environment; hence it is crucial to compare these values; if costs are higher than a value of decrease
of external environmental costs, their support should be reconsidered.
Moreover, cost of electric vehicle is also high compared to other alternative vehicle technologies, for
instance, in the case of Greece, Tsita & Pilavachi (2012), found that it is the second most expensive
alternative to conventional fuel, as shown in Table 4:
Table 4 Comparison of costs of alternative fuels for vehicles.
Source: K. G. TSITA, P. A. PILAVACHI 2012, P.682.
Potential of night distribution for reduction of costs of usage of electric vehicles
An alternative option which can potentially increase benefits of electric vehicles is to combine their
deployment with the other solutions aiming to solve transportation problems. One of such solutions
is night distribution. A positive impact of night distribution on the air pollution was proved in the
Netherlands, within the PIEK project (SUGAR 2012, P.34-36). Benefit of PIEK project of reduction in air
pollution emission, was followed by congestion decrease and diminished cost for companies.

Can electric propulsion help to reduce air pollution from urban freight transport in a cost-effective way? Case study of Copenhagen
Municipality
19
However, PIEK project was realised on diesel and electricity fuelled vehicles. Electric vehicles are
noiseless, so they switch to night distribution can be cheaper than conventional vehicles, since noise
reducing retrofits needed are much smaller.
Source: SUGAR, 2012, s.41.
1.1.4 Motivation for choosing Copenhagen Municipality as a focus area
Interest of Copenhagen Municipality in electric freight vehicles and night distribution
Copenhagen Municipality is a part of European Union, and as such is obliged to put efforts to meet
goals specified in the EU transport policies. These goals are ambitious: Halve the use of
‘conventionally-fuelled’ cars in urban transport by 2030; faze them out in cities by 2050 (EUROPEAN
COMMISSION B 2011, P.9). European Commission suggested as one of the solutions night distribution
with alternatively fuelled vehicles: Last mile distribution could be performed with low-emission urban
trucks, which not only reduce environmental impacts but also congestion as deliveries can take place
at night time (EUROPEAN COMMISSION B, 2011, P.8).
Figure 8 Night distribution effects on the cost and air quality

Can electric propulsion help to reduce air pollution from urban freight transport in a cost-effective way? Case study of Copenhagen
Municipality
20
Following recommendations of European Commission, Copenhagen municipality endeavours to
achieve by 2025 the following share of alternative fuels (electricity, hydrogen, biogas and bio
ethanol): 20-30 % of all light vehicles, 30-40% of all heavy vehicles (vehicles above 3.5 tonnes) and
100% of freight vehicles used by workers of Copenhagen Municipality authority (COPENHAGEN
MUNICIPALITY A, 2013). This ambitious goal is not far-fetched, as, taking as example electric vehicles
and in the end of 2011 there were already 800 owners of electric vehicles (which 34 of were owned
by Copenhagen Municipality), well-developed network of public charging points, distributed across
the whole Copenhagen Municipality (both slow and quick charging points). Moreover, several
companies already perform city distribution with electric vehicles. Further, there are operating
companies (Avis, SIXT), which lease electric vehicles, both for private users and for companies
(including leasing of electric vans used for city distribution); electric taxis are also under operation
(Clean drive).
“Green mobility” is a name of transport development strategy of Copenhagen Municipality, which
aims to implement into life SUMP (Sustainable Urban Mobility Plans) guidelines developed recently
by European Union. One of the goals of this strategy is that Copenhagen must be the laboratory for
green mobility solutions (COPENHAGEN MUNICIPALITY D, 2011).
In order to achieve stated goals for freight vehicles (both light and heavy vehicles are covered by this
definition), Copenhagen Municipality implemented Environmental Zones (Miljø Zoner) and is
currently conducting City Logistic pilot – one of 13 main actions to be realized by the strategy for
freight vehicles (Strategi for tung koretojer i Kobenhavn Kommune). Vehicles above 3.5 tonne, which
want to access Environmental Zones, must be equipped with filters reducing disperse of particulate
matter of 80% from the diesel engine. These filters decrease also significantly emission of nitrogen
oxides. Second main activity within reduction of air pollution from freight vehicles, City Logistic
Project, aims to study effects of integration of city distribution activities with an urban consolidation
centre (UCC) located at the edge of the Copenhagen Municipality, where goods to be distributed
within the Municipality are delivered. Secondly, City Logistic Project aims to investigate effects of
integration of electric vehicles for the last mile deliveries, i.e. from UCC to customers. Moreover,
deliveries during night time are also considered to be integrated with UCC concept (COPENHAGEN
MUNICIPALITY B, 2013).
Copenhagen municipality is also involved in projects concerning electric passenger vehicles and
establishment of charging infrastructure. These projects are as follows:

Can electric propulsion help to reduce air pollution from urban freight transport in a cost-effective way? Case study of Copenhagen
Municipality
21
E-mission in the Øresund Region aims to promote the spread of electric vehicles and stimulate
sustainable economic growth in the Øresund Region. Main points of this program are:
collaboration on payment, information campaigns, an annual electric car rally and a regional
mayor summit. The project was initiated 1 January 2011 and ending on 31 December 2013.
The project Green eMotion is to create the conditions for a greater use of electric vehicles in
Europe. The project aims to: develop and test the user-friendly and standardized technical
solutions, collect data and exchange experiences between partners to identify "best practice".
Green eMotion consists of 42 partners from industry, energy industry, electric car operators,
municipalities, universities and research institutions. The project was started 31 March 2011
and completed 1 March 2015.
The project TEN-T for electric vehicles aims to analyze and test the deployment of an
integrated solution for intelligent charging of electric vehicles as charging stations and
battery switch station. The solution will enable the long journeys between several countries in
the electric car and combine electric car by train and plane. The method will be tested in
Spain, Austria, Belgium and Luxembourg and in more depth in Denmark and the Netherlands,
where three pilots will make it possible to optimize the technical and operational
requirements. This would allow the same solution could be deployed across Europe at a later
date. TEN-T started 1 September 2010 and is ongoing until 31 December 2012 (COPENHAGEN
MUNICIPALITY C, 2013).
To summarize, an interest of Copenhagen municipality in electric mobility is visible, and within it also
in electric freight vehicles. Hence, it seems to be beneficial to focus on Copenhagen Municipality as a
case study for this research.
1.1 Research question
RQ1: Are electric vans used for urban goods distribution a cost-effective tool for reduction of air
pollution in cities? How can cost-effectiveness of electric vehicles be affected by deploying them
for night distribution?
RQ2: Is there a threshold share of electric freight vehicles above which cost effectiveness of their
deployment changes significantly?
Aim of the posed questions is to discuss cost-effectiveness of reduction of air pollution through
freight electric vehicles. This is because of problem areas chosen for analysis: air pollution generated

Can electric propulsion help to reduce air pollution from urban freight transport in a cost-effective way? Case study of Copenhagen
Municipality
22
by transport in cities. Copenhagen municipality was chosen as a focus area of the current research,
for the reasons provided in the previous section.
Can electric propulsion help to reduce air pollution from urban freight transport in a cost-effective way? Case study of Copenhagen
Municipality
23
1.2 Structure of the report
Introduction – theoretical background necessary to understand motivation of the research and
reasons for the chosen scope of it are presented. On the basis of literature review, information on
the size and scope of air pollution emitted by transport as well as on its negative impacts and its
costs is analyzed. Role of urban transport in generation of pollution, and within it of freight urban
transport is described, showing a reason for a chosen scope of the research. Further, it is discussed to
what extent air pollution from freight transport in cities can be decoupled and what are the tools
used to achieve that as well as their costs. Later, case study of Copenhagen municipality is
introduced: ambitious goals of air pollution decrease, reasons for this – costs generated by air
pollution, and interest in electric vehicles as one of considered tools to achieve this goal is described.
Following this interest, missing knowledge about electric vehicles solution which can be helpful for
public authorities of Copenhagen municipality is identified: how cost effective electric vehicles can be
in reducing local air pollution in Copenhagen municipality. Furthermore, night distribution concept is
introduced. This is for the reason that this is another widely discussed solution for reduction of air
pollution, which can be combined with electric vehicles, hence increase reduction of air pollution and
their cost. Second reason for focusing on night distribution is that this solution proved to be
successful for a big scale in one of the European countries. This finishes the motivation part of the
research.
Secondly, research question is formulated based on the motivation for a chosen scope of the
research.
Theoretical background necessary to perform the research
Theories necessary to learn about:
a) Relation between external environmental costs and cost of their reduction.
b) A method for assessment of cost of pollution produced by transport.
c) A methods for assessment differences between electric and conventional vehicles.
d) A methods for assessment differences between cost of vehicle distributing goods in the day
and night shift.
First information (a), was used to build a framework for analysis of cost-effectiveness: it allowed to
gather proper data for this calculation and to correctly interpret the findings. Second information
(b), was used to estimate costs of pollution produced from a specific mode of transport. Further (c),
analytical part applied presented method for comparison of cost of electric freight and conventional
vehicles in Copenhagen Municipality. and air pollution levels. Finally (d) this method was used to

Can electric propulsion help to reduce air pollution from urban freight transport in a cost-effective way? Case study of Copenhagen
Municipality
24
compare costs of electric and conventional vehicles in the day and night shift. Method (c) and (d)
were also used to further discuss attained results.
Analytical part – in order to answer research question, information about cost of electric freight vans
and costs of air pollution generated by freight vans is gathered for Copenhagen Municipality.
Moreover, level of air pollution possible to be reduced through electric vehicles utilization is
analyzed. Finally, cost-effectiveness of reduction of air pollution through electric vehicles is assessed.
Discussion
The final result of an empirical part of a research is an answer on cost-effectiveness of air pollution
reduction, which is achieved through a deployment of electric vehicles. Result of this estimation is
put into perspective of not taken into account cost factors. Further, it is considered to what extend
results achieved should affect policy directed to electric vehicles in Copenhagen Municipality.
Conclusion
It is also concluded if electric vehicles proved to be cost-effective and how this information can be
used by decision makers. Further, it is summarized to what extent reduction of pollution and costs of
pollution can be potentially reduced through the shift of freight vans to electric propulsion. Extent to
which night distribution can improve cost-effectiveness is also presented. Finally, reflection on
extend to which technological changes such as electric propulsion for vehicles is made.

Can electric propulsion help to reduce air pollution from urban freight transport in a cost-effective way? Case study of Copenhagen
Municipality
25
2. Theoretical foundations
2.1 Theory of external costs: cost-effectiveness of reduction of external
costs
This chapter focuses on theory of external environmental costs, in order to discuss if there can be
identified a level of external costs, which is optimal for both environment (and society, as air
pollution reduction influences both environment and people) and economy. This way question of
existence of cost-effective level of reduction of air pollution is answered.
2.1.1 What external cost is and how it is created
Taking example of a driver, while driving, he creates two types of costs. One of this costs is borne by
the very driver, e.g. in form of fuel cost or environmental fees; this cost is called private cost. Second
cost created is not borne by him, but by a whole society; this cost is e.g. share of cost of pollution,
which is not borne by a driver, but by society. Therefore, this cost is called an external cost, and is
described as social cost diminished by a private cost. This cost is often created when it comes to
freight vehicles: Today, these external costs are not covered by taxes and fees. For heavy road
vehicles, for instance, taxes charged are consistently low in relation to the marginal costs (E. FRIDELL,
M. JERKSJO, C. WOLF, M. BELHAJ 2009, P.35). Marginal2 external cost in a transport field can be described
as a cost created by an additional vehicle added to an already existing vehicles’ flow; cost which is
however not borne by a driver of this vehicle (such as fuel cost), but by society, so for instance
emission of pollution or noise. The marginal external cost is visualised at the Figure 9 (in a form of a
triangle):
Figure 9 A graphic presentation of Environmental external cost
Source: G. RILEY 2012.
2 Focus of this chapter is put mainly on the marginal costs and not on average or total costs. It is because scenario method is utilized in the analysis part of the current research – measurement of costs associated with pollution and its reduction is performed for specific share of electric vehicles in traffic; total or average costs are not sufficient to show costs for this detailed situations.

Can electric propulsion help to reduce air pollution from urban freight transport in a cost-effective way? Case study of Copenhagen
Municipality
26
Figure 16 shows that, social equilibrium lies in a point, where all external costs would be covered by a
polluter. In the picture, it is situation (c), when marginal social costs is covered by polluter: marginal
private cost curve would be then raised to a level of marginal social cost. In this situation, decreased
marginal private cost become also equal to increased marginal social benefits.
Genesis of environmental externalities can be described as follows, by Kenneth Button:
Figure 10 Genesis of the environmental externalities: chain reaction
Source: K. BUTTON 2010, P.252.
Market failures factor is the first stage within the chain of formation of environmental costs.
Therefore, in order to fight these externalities, this should be a first area of intervention of public
policy intervention. This policy is called a first-best approach, as it directs the action into the primary
problem generator. However, sometimes, due to transactional (process) costs and lack of political
acceptance, this approach cannot be applied. In this situation intervention into the next stages of the
external cost creation process, so called second-best approaches, should be considered (K. BUTTON
2010, P.252). This can occur to be a more cost-effective solution in such circumstances.
2.1.2 Measurement of which external costs is useful – all or narrowed down to a specific
geographic area?
According to Mayeres, it is important not to focus on the whole scope of external costs, but only on
these which are in legitimacy of specific public authorities, who have a legal power to take steps
against them: As each government level will, in general, only take into account the welfare of the
inhabitants of its constituency, it will only take into account the external costs that are borne by these
inhabitants. Therefore splitting the external costs in function of the population they affect is useful
information [for the specific public authorities] (MAYERES AT ALL. 1996, P. 112). However, this approach
seem to not hold true for costs of air pollution, since greenhouse gases, do not currently create
significant costs for the local societies, but they are expected to create a huge one in the future.
Therefore, if these costs are not taken into account today, abatement actions will not be undertaken,
and the upcoming huge costs will not be mitigated.

Can electric propulsion help to reduce air pollution from urban freight transport in a cost-effective way? Case study of Copenhagen
Municipality
27
2.1.3 Where does an optimum level of air pollution lie? Is 100% reduction a goal or a level
for which reduction of air pollution is cost-effective?
If the optimum environmental improvement level should be decided on, then externalities should be
reduced only up to the point for which marginal external damage costs are equal to marginal
avoidance costs. Economic theory suggests that optimal prices should reflect external costs in an
optimal traffic situation; the optimal price is where marginal external damage costs are equal to
marginal avoidance costs (CE DELFT 2008, P.12). In the current research, answer for the following
question is sought: is the cost of electric vehicle an optimal price for reduction of air pollution? Are
the marginal damage costs of air pollution produced by a conventional vehicle bigger than a marginal
cost of deployment of an electric vehicle?
Figure 11 Situation of not optimal price for reduction of air pollution
Source: own elaboration, on the basis of G. RILEY 2012.
Situation of not optimal reduction of air pollution is shown in the Figure 11, in a point d (Q3, P2).
Point d presents a situation when cost borne by a polluter is higher than external cost produced by
him (cost borne by polluter equal to external cost is marked with a black arrow, while the additional
cost is marked with a red arrow). In regards to electric vehicles, reduction of air pollution achieved
(Q1-Q3) could be described as caused by switch to an electric vehicle, which produces less external
costs; that is why pollution level drops. However, in this situation, cost of reducing pollution with an
electric vehicle would be higher than a financial benefit from reduction of external costs. Usage of
electric vehicles as a tool to fight air pollution costs would not be rational (rational in the economic
sense, i.e. cost-effective) in the situation of costs distributed as shown in Figure 11; level of air

Can electric propulsion help to reduce air pollution from urban freight transport in a cost-effective way? Case study of Copenhagen
Municipality
28
pollution reduction is achieved with an irrational cost – cost which is higher than the external cost
produced.
Second important information which can be derived from Figure 11 is that the optimum level of
reduction of external environmental costs is not necessarily 100% decoupling from economic
activities – level of reduction of air pollution in point d is not rational. It is possible that another tool
should be considered, but it should be also borne in mind, that it is possible, that a tool which totally
decouples externalities keeping the cost of this action equal to social benefit just do not exist, and
therefore a tool optimizing level of pollution should be rather sought:
Many environmental groups argue for substantial reductions or total elimination of adverse
environmental effects, but this ignores the cost associated with removing such nuisances. While some
people suffer from the environmental intrusion associated with transport, others clearly benefit from
being able to travel more freely or move goods more cheaply. In almost all cases, environmental
improvements would reduce the net benefits enjoyed by transport users. Economists tend, therefore,
to think in terms of optimizing the level of pollution rather than “purifying” the environment entirely
(K. BUTTON 2010, P.165-166).
...and being more specific about reducing external environmental costs from transport activities:
When talking about the excessive environmental harm caused by various forms of transport it is
important to remember that this is an excess above the optimal level of pollution, not above zero
pollution, or some perceived “pure environment” (K. BUTTON 2010, P.167).
Shape of marginal cost of pollution and marginal abatement cost functions: theoretical and when
applied by the researches
1) Real shape of cost functions, as described in theories:
Figure 12 shows functions of MC and MSB cost (MC – marginal private cost; MSB – marginal social
benefit), and the price for the optimum level of pollution reduction. Both MC and MSB functions are
not linear. It can be noted, that the MC function increases only slightly, but after crossing with MSB
function its slope sharpen significantly. This specific shape of MC function is caused by the fact that
achieving some level of environmental improvement can be done without significant technological
changes; however, to reduce externalities over this level requires more radical, so more costly
changes. From the same figure, it can be noted that a slope of MSB function is almost reverse, i.e.
function diminishes sharply to the moment of attainment of a certain level of reduction of air
pollution, after which slope of the function levels flattens. This is because reduction of the most

Can electric propulsion help to reduce air pollution from urban freight transport in a cost-effective way? Case study of Copenhagen
Municipality
29
severe externalities is prioritized within the goals of environment policies: many of the seriously toxic
materials (for example, lead) are likely to be among the first to be removed in the clean-up program
(K. BUTTON 2010, P.167).
Figure 12 A real-life location of an optimal level of environmental improvement
Source: K. BUTTON, 2010, P.167.
If the shape of the functions presented in Figure 12 is to be explained for the focus of the current
research, electric vehicles, then it could be this way:
The function of marginal external environmental costs (MB) depends on the number of EVs;
the more EVs already present in the traffic, the aggregated pollution generated by traffic is
lower, so the lower marginal external environmental benefit added by an electric vehicle.
The function of marginal abatement costs (MC) depends on the share of EVs in the traffic
flow. This can be linked to a growing number of these vehicles on the market, causing e.g.
dropping purchase price linked to mass production, or decreasing price of servicing vehicles
linked to a growing number, so competition, between cars workshops specialized in repairs
of electric vehicles.
2) An assumed shape of functions as applied for by the empirical researches:
Apart from knowledge on how the value of marginal cost of pollution and the abatement cost
depend on the composition of traffic flow, marginal external costs are very often assumed to be
equal to average external costs when empirical researches are performed:
For emissions the average and marginal costs are usually considered to be the same. The main costs
here are health-related and expected to be linear and the tool uses average costs , P.35).

Can electric propulsion help to reduce air pollution from urban freight transport in a cost-effective way? Case study of Copenhagen
Municipality
30
However, for climate gases the marginal costs are likely to be higher than the average cost (p.35),
but for instance External cost calculator used by Marco Polo EU project, assumes that marginal
climate change costs are also equal to the average ones (MARCO POLO 2013, P.4).
This assumption is used by a significant number of researches in this field (see for instance on line
calculators for external costs of transport, such as: CER & UIC 2011, DANISH MINISTRY OF TRANSPORT 2010,
a tool developed by Chalmers University of Technology (E. FRIDELL, M. JERKSJO, C. WOLF, M. BELHAJ 2009,
P.35), or a methodology used by Marco Polo EU project for air pollution costs calculation from freight
transport (MARCO POLO, 2013).
Following this assumption, marginal cost of an electric vehicle (MC) would be assumed to be equal to
its average value, i.e. cost would be not influenced by the growing share of electric vehicles on the
market. Further, MB function would be also assumed equal to average value, i.e. marginal benefit of
air pollution reduction associated with replacing a next conventional vehicle with an electric vehicle
would not depend on the already achieved share of electric vehicle in the traffic flow. In this situation
Figure 12 should be transformed into Figure 13:
Figure 13 An applied for the needs of empirical researches location of an optimal level of environmental improvement
Source: OWN DRAWING.
Błąd! Nie można odnaleźć źródła odwołania.shows that optimal environmental improvement cannot
be pointed out anymore, since marginal costs are constant, so the relation between marginal costs
for polluters and benefits for society are the same for all levels of reduction of air pollution.
Therefore, either 0 or 100% reduction is cost-effective and it is sufficient to perform cost-
effectiveness analysis for a one chosen freely level of reduction of air pollution, since this result is
valid for all levels.
2.2 Method for measurement of costs of air pollution produced by transport Measurement of costs of pollution is a complex, multi-task and time requiring task. Therefore,
calculation of costs of air pollution is prepared mainly at the national level, and if prepared for the

Can electric propulsion help to reduce air pollution from urban freight transport in a cost-effective way? Case study of Copenhagen
Municipality
31
local one, only major pollutants are taken into account, often limited only to particle matter.
Methodology produced by HEATCO, shows complexity of this task:
Figure 14 General steps within the process of calculation of costs of pollution
Source: CE DELFT, 2008, P. 48.
In order to calculate costs for specific area, there can be used, for example, the following
methodology, used by Marco Polo EU project:
Figure 15 Method for calculation of costs of pollution in a specific area
Source: MARCO POLO 2013, P.3.

Can electric propulsion help to reduce air pollution from urban freight transport in a cost-effective way? Case study of Copenhagen
Municipality
32
This method measures cost of pollution per vehicle-kilometre, distinguishing type of a vehicle
performing transport activity, and afterwards multiplying this cost by a number of vehicles with a
distance travelled and by a load factor of a vehicle. This way coefficient of cost/ load transported
multiplied by distance is produced. Both local and global air pollution (greenhouse gases) is
calculated this way. Theories for estimation of costs of pollution are not discussed in more details,
since this data required for the current research is already gathered from other researches.
2.3 Method for measurement of abatement costs of electric vehicles
Aim of this subchapter is to describe cost factors associated with two presented shortly in the
introductory part potential methods for reduction of air pollution from transport: deployment of
electric vehicles and night distribution. Main focus is on method for calculation of differences in costs
of electric and conventional vehicles, but cost factors for night distribution are also presented, since
this option can help to reduce costs of electric vehicles used for delivery activities in cities.
2.3.1 Method for comparison of costs of conventional and electric vehicles
In general, costs of a vehicle can be split into fixed and operational ones. The following cost factors
are normally included in the calculation:
Figure 16 Cost factors of a vehicle ownership and usage
Source: CALIFORNIA DEPARTMENT OF TRANSPORTATION OFFICE OF TRANSPORTATION ECONOMICS, 2013.

Can electric propulsion help to reduce air pollution from urban freight transport in a cost-effective way? Case study of Copenhagen
Municipality
33
Looking through different researches analyzing costs of electric vehicles/comparing costs of electric
vehicles with costs of conventional vehicles, it can be noted, that detailed cost factors vary from
research to research. There can be distinguished approaches focusing purely on operational fuel
costs, these extending them with purchase costs, and these which take into account all operational
and purchase costs.
There are currently few researches available, focusing on methodology for cost calculation of freight
electric vehicles. From these, there was chosen method developed by B. A. Davis and M.A. Figliozzi,
for urban freight electric vehicles in USA. This method is followed (to the possible extend, depending
on data availability) in the analysis of cost of electric freight vehicles performed by the current
research.
a) Total cost of one electric freight vehicle
Costs:
- Purchase cost
- Resale value
- Energy cost
- Maintenance cost per mile/km
- Battery replacement cost not included
- Tax incentive for the purchase
Inflationary factors:
- discount factor
- rate of inflation in electricity costs
Other parameters:
- Electricity consumed per day
- Days of service per year
- Daily distance travelled to serve route by vehicles
- Whether the battery is replaced in year k (binary 0-1 parameter) not included
b) Total cost of one conventionally fuelled freight vehicle
The following cost factors differs between an electric and conventional vehicle:
- Fuel cost
- Rate of inflation in fuel costs
- Fuel consumed per day (B. A. DAVIS, M. A. FIGLIOZZI, 2012, P. 10-11).

Can electric propulsion help to reduce air pollution from urban freight transport in a cost-effective way? Case study of Copenhagen
Municipality
34
Authors of this methodology argue, that even though they are aware of the potential impact of grid
overwhelming by electric vehicles on the future increases of electricity price, they do not expect this
to significantly influence competitiveness of electric vehicles, because of the higher efficiency of EVs
relative to conventional trucks and the long-term stability and lower growth of electricity prices in
relation to fuel fossil energy sources volatility, it is unlikely that electricity price increases due to this
phenomenon would have a large to affect the competitiveness of EV (B. A. DAVIS, M. A. FIGLIOZZI, 2012,
P.9).
Besides of the research performed by B. A. Davis and M. A. Figliozzi, there were also analyzed few
other analyses describing cost factors of electric vehicles. On the basis of them, the following cost
factors are additionally taken into account in the cost analysis performed by the current research:
- Cost of CO2 emission per km (W. FUNG, M. FIGLIOZZI, 2012, P. 137). I would include this cost into my
calculation, since these are important cost factors for vehicles in Denmark – taxes on the vehicle and
fees for entering several Danish cities (including Copenhagen), depending on the pollution
generated. Therefore cost of filter installation required entering Copenhagen Municipality will be
included in the research.
- Cost of insurance of a vehicle (BETTER PLACE, 2013). In the calculation performed by Better Place, cost
of insurance for an electric vehicle differs from this for a conventional one.
Besides of the costs of electric vehicles described above, there are also several costs, which are hard
to include in the cost calculation, but they should be at least mentioned next to results of calculation,
as they are factors which can influence the calculated cost value:
Costs: charging infrastructure establishment cost, lower range, lack of spare parts and repair
shops, adaptation of logistics processes, smaller payload, fluctuant range in low
temperatures, sub-contraction is less feasible with EVS, Lacking dispatching system for EVs.
Benefits: Improved image, more manoeuvrable in the narrow streets, lower number of parts
to repair, reserved and free parking places in the city (E-MOBILITY NSR, 2013).
Main cost drivers for electric freight vehicles
Several estimations of difference between costs of electric and conventional passenger vehicles were
performed in Denmark. Results of these often contradictory estimations are gathered below:
Energy cost:
o Energy cost of electric vehicle is around 20% cheaper than of conventional vehicle
(CLEVER 2013).

Can electric propulsion help to reduce air pollution from urban freight transport in a cost-effective way? Case study of Copenhagen
Municipality
35
o Energy cost of EV can occur to be from 30% to 65% more expensive that of ICE vehicle,
depending on the different development of battery’s prices (EA ENERGIANALYSE, 2011,
P.30).
Resale value:
o Depreciation per year is lower for electric and conventional vehicle (HOJE TAASTRUP
MUNICIPALITY 2013).
o Depreciation per year value is the same for electric and conventional vehicle (BETTER PLACE
2013)
Maintenance cost:
o Maintenance costs the same for EV and ICE (HOJE TAASTRUP MUNICIPALITY 2013, BETTER PLACE
2013).
o Maintenance costs were much lower for an EV compared to ICE vehicle (CLEVER 2013).
Purchase cost:
o Final finding: price of an EV is insignificantly higher than of ICE vehicles (HOJE TAASTRUP
MUNICIPALITY 2013).
Estimations of costs for freight electric vehicles were not yet performed in Denmark. In the case of
electric light trucks utilization in USA, B.A Davis and M. Figliozzi (2013), concluded, that the following
factors should be in place, in order to make electric freight vehicles competitive against conventional
freight vehicles:
daily travel distance is close to battery’s range,
majority of the route must be travelled in a low speed,
stops of vehicle are numerous and densely distributed,
purchase price is reduced (B.A. DAVIS & M. FIGLIOZZI 2013, P. 22).
This shows, that purchase cost and fuel cost are the main cost drivers identified by these researchers,
where fuel cost is a cost driver creating a positive difference between electric and conventional
vehicle and purchase price is a cost driver creating a negative difference between them.
2.3.3 Method for comparison of costs of day and night distribution
Night distribution is already widely used in the Netherlands. The requirement for vehicles performing
night distribution in Dutch cities is that this must be done with “silent” vehicles. In the Netherlands,
if deliveries are performed within the residential area, diesel engines of a truck must be replaced
with a gas one (GOEVAERS, 2013). Therefore, noise reducing retrofits both in vehicle and trailer must
be made (SUGAR 2012). When it comes to electric vehicles, their engine produces very low noise and
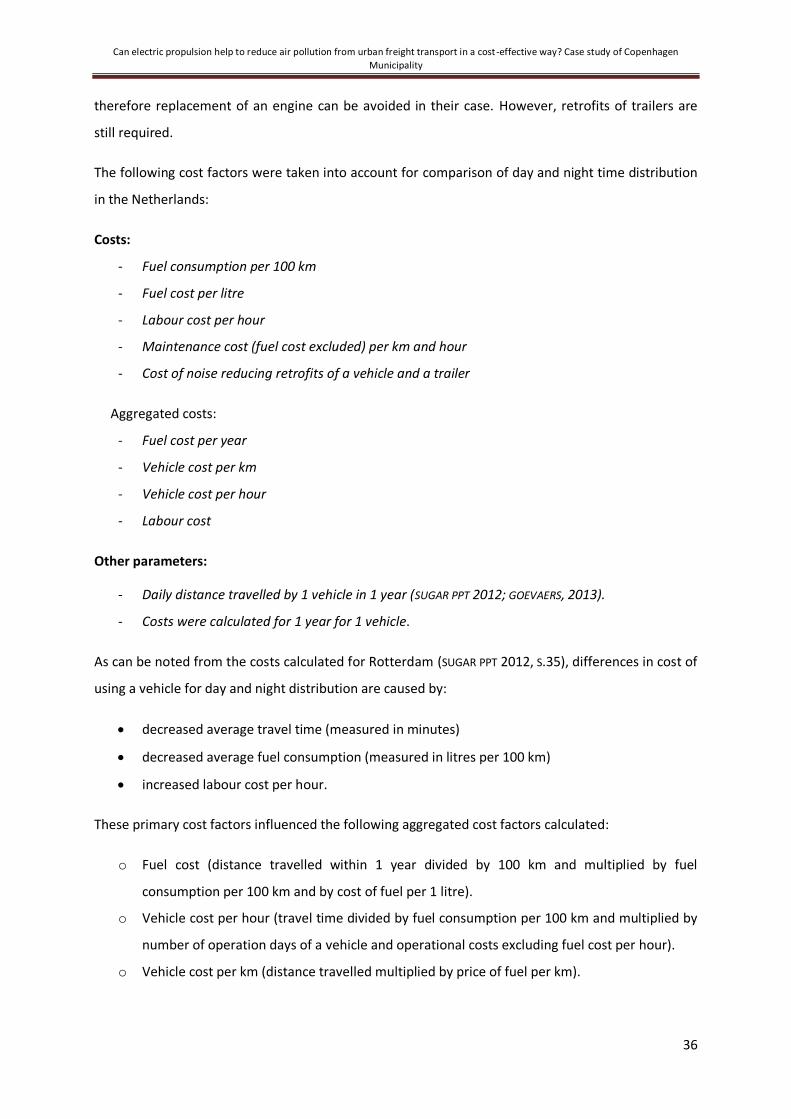
Can electric propulsion help to reduce air pollution from urban freight transport in a cost-effective way? Case study of Copenhagen
Municipality
36
therefore replacement of an engine can be avoided in their case. However, retrofits of trailers are
still required.
The following cost factors were taken into account for comparison of day and night time distribution
in the Netherlands:
Costs:
- Fuel consumption per 100 km
- Fuel cost per litre
- Labour cost per hour
- Maintenance cost (fuel cost excluded) per km and hour
- Cost of noise reducing retrofits of a vehicle and a trailer
Aggregated costs:
- Fuel cost per year
- Vehicle cost per km
- Vehicle cost per hour
- Labour cost
Other parameters:
- Daily distance travelled by 1 vehicle in 1 year (SUGAR PPT 2012; GOEVAERS, 2013).
- Costs were calculated for 1 year for 1 vehicle.
As can be noted from the costs calculated for Rotterdam (SUGAR PPT 2012, S.35), differences in cost of
using a vehicle for day and night distribution are caused by:
decreased average travel time (measured in minutes)
decreased average fuel consumption (measured in litres per 100 km)
increased labour cost per hour.
These primary cost factors influenced the following aggregated cost factors calculated:
o Fuel cost (distance travelled within 1 year divided by 100 km and multiplied by fuel
consumption per 100 km and by cost of fuel per 1 litre).
o Vehicle cost per hour (travel time divided by fuel consumption per 100 km and multiplied by
number of operation days of a vehicle and operational costs excluding fuel cost per hour).
o Vehicle cost per km (distance travelled multiplied by price of fuel per km).

Can electric propulsion help to reduce air pollution from urban freight transport in a cost-effective way? Case study of Copenhagen
Municipality
37
o Labour cost (travel time multiplied by number of operation days of a vehicle and labour cost
per hour). On the basis of these factors, difference in a total cost of operation of a vehicle in
the day and night time was counted. Only operational costs were counted, as the fixed costs
(purchase cost, maintenance cost and resale value) were assumed to be the same for day
and night distribution. One of operational costs, vehicle cost per km, was also not affected by
switch from day to night time performance, since the distance travelled is constant.

Can electric propulsion help to reduce air pollution from urban freight transport in a cost-effective way? Case study of Copenhagen
Municipality
38
3. Methodology
3.1 General comments
Data gathering protocol
Information presented in the introductory and theoretical foundations chapter, were collected on
the basis of a literature review performed for the needs of the current research, but also on the basis
of knowledge gathered by the author throughout one year of work in the field of electric vehicles
within the E-mobility NSR project, including conferences, interviews and literature review.
Data used in the analytical part were primarily gathered from secondary sources, i.e. from previously
performed researches, from websites and from statistical data bases. Several information were not
publicly available and therefore they were gathered through email and phone based communication.
There was also performed an interview with Mr. Robert Goevaers on experiences with night
distribution implementation in the Netherlands within PIEK project.
Additionally, there were conducted surveys concerning difference in cost of usage electric and
conventional vehicles experienced by companies in Copenhagen municipality3, but data gathered
was insufficient to be used for calculation. There are currently very few companies using electric
vehicles for goods transport in Copenhagen, and therefore author was able to enter into contact with
all of them; however, only 2 agreed to share data, and these still were incomplete. For this reason,
secondary data sources gathered from car dealers, statistics repositories of Copenhagen and
Denmark were used as input data.
Validity
Internal validity Research is fully internally valid, if factors affecting achieved result are only these
posed by researcher, i.e. assumptions made for the research fully explain attained results. Internal
validity is lacking, when important factors affecting results are not known. Author of the current
research attempted to ensure that analyses performed are internally valid. It was possible with first
of analysis, differences in costs of vehicles, since only these costs were calculated, were author had a
full knowledge on factors creating obtained value: purchase and fuel cost. Specific cost factors
affecting differences in these costs were explained and discussed. Internal validity of the second
analysis is lower, because energy consumption per distance travelled (so cost of pollution) was
calculated for conventional vehicles on the basis of the most sold freight vans models and not on the
3 Companies already utilizing electric vehicles for goods distribution were surveyed: KLS Grafisk Hus and Loomis
Danmark.

Can electric propulsion help to reduce air pollution from urban freight transport in a cost-effective way? Case study of Copenhagen
Municipality
39
basis of the real composition of the fleet of freight vans in Copenhagen Municipality. This affected
result of difference in cost of pollution produced by an electric and conventional vehicle.
External validity. This research performed an estimation of possible cost difference and not the real
life cost calculation. It is because situation of a big number of electric freight vans in Copenhagen
Municipality was only projected, and is not a current situation. Results on costs of vehicles can be
easily transferred to other countries, since city-specific cost factors taken into account are only
number of vehicles and distance travelled by these vehicles in Copenhagen. This way, results on
difference in cost of vehicle between an electric and conventional freight van per 1 km travelled can
be transferred (however, only for vehicles of a similar GVW). Results on costs of pollution cannot be
transferred, since these costs are very place specific. For instance, energy plants providing electricity
for Copenhagen Municipality produces it from much cleaner energy sources than for instance energy
plants in China. This way, cost of pollution produced by electric vehicles in China is higher than in
Copenhagen Municipality. Additionally, factors such as population exposure to pollution also differ
from place to place.
Reliability
The same vehicle models were used to calculate costs of electric and conventional vehicles, differing
mainly with kind of propulsion technology applied. This way, reliability of results of comparison of
vehicles was increased. Secondly, estimation of pollution for total fleet of freight electric vehicles in
Copenhagen, was based on weighted arithmetician mean. This way influence of number of vehicles
in specific energy consumption classes on the total level of pollution created was included. Thirdly,
inclusion of a changing payload factor was also included to estimate differences between costs of
pollution produced by electric and conventional freight vehicles. This way reliability of this result was
also increased, since electric vehicles are characterized by a smaller ratio between payload and GVW
and therefore have to travel longer distance.
Limitations of the research
Due to lack of data, assumption that marginal costs of pollution and marginal costs of vehicles are
constant caused, that answer for research question 2 was not possible. Findings on cost-
effectiveness for one electric vehicle were not affected this way, but answer for the question if e.g.
60% share of electric vehicles in the traffic is a more cost-effective tool to reduce air pollution than
30% could be potentially biased.
In general, there is many assumptions made in this research, due to incomplete data available. Each
assumption decreases realism of results achieved. However, since all assumptions are described in

Can electric propulsion help to reduce air pollution from urban freight transport in a cost-effective way? Case study of Copenhagen
Municipality
40
the research, formulas can be easily modified by replacing the assumed values with more reliable
ones. Further, author tried to ensure, that all assumptions made are as close to reality as possible.
Data used for estimation of level of pollution produced by conventional freight vans and data on cost
of pollution from these vehicles were gathered from different source. Therefore, level of pollution
produced per km cannot be translated into cost of pollution per km. This fact did not affect
assessment of cost-effectiveness, but just level of pollution produced cannot be translated to cost of
pollution
Surveys on costs of electric and conventional vehicles were conducted, but insufficient data were
gathered to perform analyses on their basis. Therefore, average values for cost factors gathered from
dealers’ websites were used instead and combined with average values for cost factors specific for
freight vehicles operating in Copenhagen Municipality. This was possible for purchase and fuel costs.
If more real-life data was gathered from companies, then it would be also possible to estimate only
average purchase and fuel cost for the whole Copenhagen Municipality. It seems to be, that it still
would not be possible to estimate average maintenance and labour cost, since they are strongly
dependent on business profile of companies. It is because there is many branches within which
companies transport goods and within each branch, all costs can differ significantly (maybe except
purchase cost and fuel cost per km). Maintenance and labour costs should be then calculate for each
company specifically.
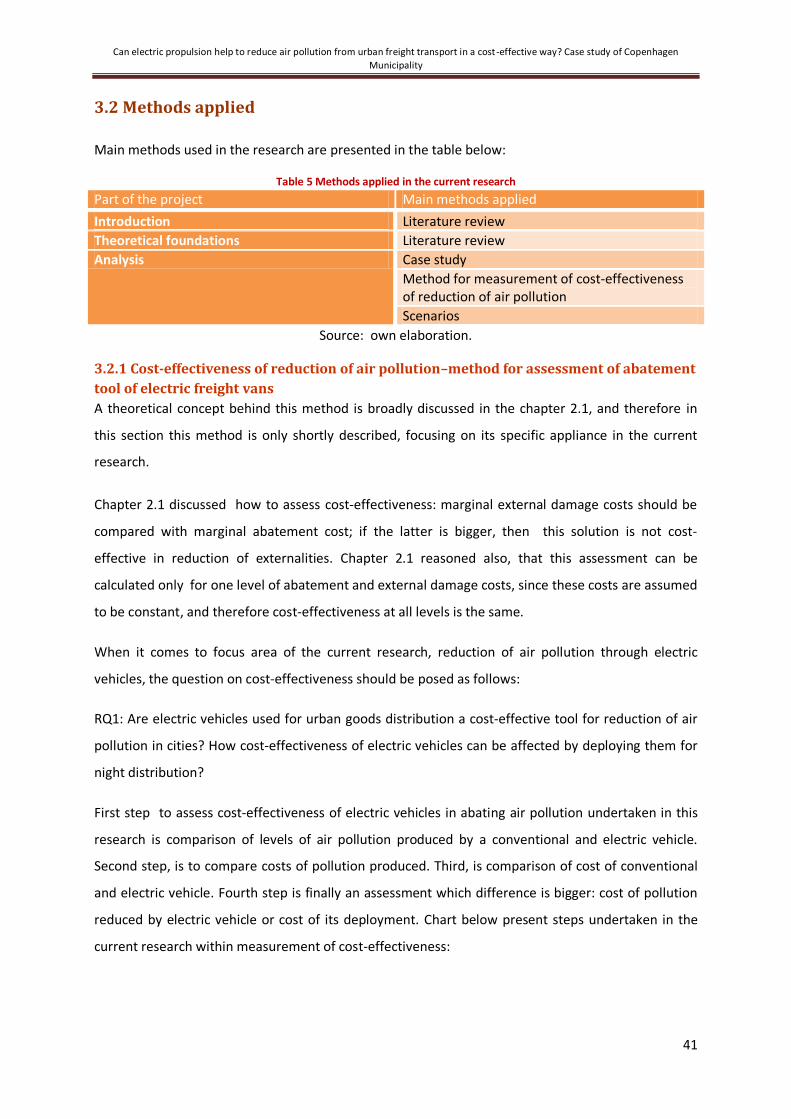
Can electric propulsion help to reduce air pollution from urban freight transport in a cost-effective way? Case study of Copenhagen
Municipality
41
3.2 Methods applied
Main methods used in the research are presented in the table below:
Table 5 Methods applied in the current research
Part of the project Main methods applied
Introduction Literature review
Theoretical foundations Literature review
Analysis Case study
Method for measurement of cost-effectiveness of reduction of air pollution
Scenarios
Source: own elaboration.
3.2.1 Cost-effectiveness of reduction of air pollution–method for assessment of abatement
tool of electric freight vans
A theoretical concept behind this method is broadly discussed in the chapter 2.1, and therefore in
this section this method is only shortly described, focusing on its specific appliance in the current
research.
Chapter 2.1 discussed how to assess cost-effectiveness: marginal external damage costs should be
compared with marginal abatement cost; if the latter is bigger, then this solution is not cost-
effective in reduction of externalities. Chapter 2.1 reasoned also, that this assessment can be
calculated only for one level of abatement and external damage costs, since these costs are assumed
to be constant, and therefore cost-effectiveness at all levels is the same.
When it comes to focus area of the current research, reduction of air pollution through electric
vehicles, the question on cost-effectiveness should be posed as follows:
RQ1: Are electric vehicles used for urban goods distribution a cost-effective tool for reduction of air
pollution in cities? How cost-effectiveness of electric vehicles can be affected by deploying them for
night distribution?
First step to assess cost-effectiveness of electric vehicles in abating air pollution undertaken in this
research is comparison of levels of air pollution produced by a conventional and electric vehicle.
Second step, is to compare costs of pollution produced. Third, is comparison of cost of conventional
and electric vehicle. Fourth step is finally an assessment which difference is bigger: cost of pollution
reduced by electric vehicle or cost of its deployment. Chart below present steps undertaken in the
current research within measurement of cost-effectiveness:

Can electric propulsion help to reduce air pollution from urban freight transport in a cost-effective way? Case study of Copenhagen
Municipality
42
Source: own drawing.
3.2.2 Scenario method – a method for assessment of abatement tools
Next to the method assessing cost-effectiveness, scenario method is also applied in the current
research. Reason for employing this method is the same: to give an opinion on rationality of support
of electric vehicles by public authorities. This method was expected to play an important role in this
research: enable to answer research question 2. However, since answering this question occurred to
be impossible, this method finally plays a minor role in this research. Cost-effectiveness of reduction
of air pollution through electric vehicles cannot be assessed for scenarios: different share of these
vehicles in the traffic flow.
Cost-effectiveness of reduction of air
pollution
Level of pollution:
Difference between conventional and
electric vehicle
Abatement cost:
Difference in cost of conventional
and electric vehicle
Cost of pollution:
Difference between
conventional and electric vehicle
Figure 17 General method used for estimation of cost-effectiveness of reduction of air pollution through electric freight vans in Copenhagen
Municipality
Can electric propulsion help to reduce air pollution from urban freight transport in a cost-effective way? Case study of Copenhagen
Municipality
43
Scenario method is a method used in all four analyses building up the analytical part of this research.
Firstly, it is used for analysis of difference in level of pollution and costs of pollution produced by
electric and conventional freight van in regards to various shares of electric freight vans in the total
fleet of freight vans. Secondly, it is used in the third and fourth analysis, where it is used to show
differences in cost of electric vehicle in scenarios of 1-8 years life cycle. It was necessary to consider
several scenarios in this case, since an average life cycle of electric vehicle is still hard to estimate.
Why scenario method was developed?
Main benefit from using scenarios is well grasped by Nijkamp: Using and constructing scenarios may
provide new insights into possible paths and policies and their impacts on the future situation, and
societal and political choices may become clearer (NIJKAMP 1997, P.142). This is a goal of the current
research – to support public authorities in Copenhagen Municipality in making decision on the policy
towards electric vehicles.
Important difference between forecasts based on the econometric methods and scenarios is that aim
of the second is not to present an exact estimation of a future situation, but to show the possible
directions in which it can develop. This is because scenarios are a basis of a discussion of impacts of
the possible and not only probable future situations (NIJKAMP 1997, P.146). Therefore, scenarios
method seems to be a feasible one to utilize in the field of transport. Forecasting future situations in
this field is so complex, depends on so many factors that in the limited time given for elaboration of
this paper, an attempt to discuss alternatives of future situation, rather than predicting its exact
shape, seem to be a more proper action.
In all cases the development of scenarios was a response to the inability of predictions and trend-
based approaches to handle situations of rapid change, high levels of uncertainty and the need to
achieve trend breaks (D. BANISTER & R. HICKMAN 2012, P.1). Rapid change and high level of uncertainty
are the characteristics well describing a cost-effectiveness of air pollution reduction through electric
vehicles: quickly developing technology of batteries and big differences in the estimation of future
number of electric vehicles make an exact estimation very hard to perform.
Description of a chosen type of scenario and utilization of the scenario method in the current
research
Banister and Hickman distinguish three main approaches to scenarios building: forecasting,
exploratory and backcasting. Forecasting approach of scenarios: it is the most useful where
substantial external change is not expected and where there is some expectation that current trends
will continue into the future (D. BANISTER & R. HICKMAN 2012, P.2). This is because forecasting approach

Can electric propulsion help to reduce air pollution from urban freight transport in a cost-effective way? Case study of Copenhagen
Municipality
44
focuses primarily on the probable and possible futures, and it does not include “exaggerated”, more
unrealistic scenarios. On the other hand, exploratory scenarios focus on the bigger variety of
scenarios: scenarios are plausible representations but more mind stretching, and where the power of
the central variables are exaggerated so that there is more space for creative design within each
scenario (D. BANISTER & R. HICKMAN 2012, P.2). Backcasting approach aim is much different from the
forecasting and exploratory approaches, as its main aim is to describe steps, which may lead to the
developed scenarios (NIJKAMP 1997, P.146).
Exploratory approach, called also a prospective one, was used in the current research, because a
factor of substantial external change is true for the current research; future fuel prices and future
cost of electric vehicles can vary significantly compared to current levels. Furthermore, forecasting
approach is used for short time period (NIJKAMP 1997, P.145), and time period of the current research
is 12 years.
Why scenarios instead of forecast was used as a method in the current research
The aim of the developed scenarios is to take a point of departure in the future – present potential
(and not necessarily probable) place of electric vehicles on the urban freight vehicles market in
Copenhagen. Scenarios are developed on the basis of today’s data; so that role of scenarios is to
answer a question: how cost-effective would electric vehicles be in reduction of air pollution if they
would be wide spread today? For that reason, factors such as inflation in cost of energy, discount
rate in counting cost of companies or expected change in share of renewable sources of energy are
not included.
One can argue, that a forecast could give better results, since they are able to model the future
situation, taking into account changing in time costs. Author is aware, that a forecast is a useful tool
to predict the future, but in the case of market of electric vehicles, author is aware that results of
forecasts vary significantly, since electric vehicles is still an emerging market, and therefore such a
forecast could easily end-up giving biased results. If these results can be used to assess cost-
effectiveness in the future, it is a hard guess, but information about the current cost-effectiveness
can for sure serving as useful information for public authorities in deciding about their policies
directed into future.
Alternative future scenarios are based on one axe of uncertainty: share of electric freight vehicles in
the total share of freight vehicles performing transporting goods in Copenhagen Municipality. How
would costs of pollution look in the respective future scenarios? Further, how would costs of electric
vehicles look? These are questions which the developed scenarios answer to. There were established
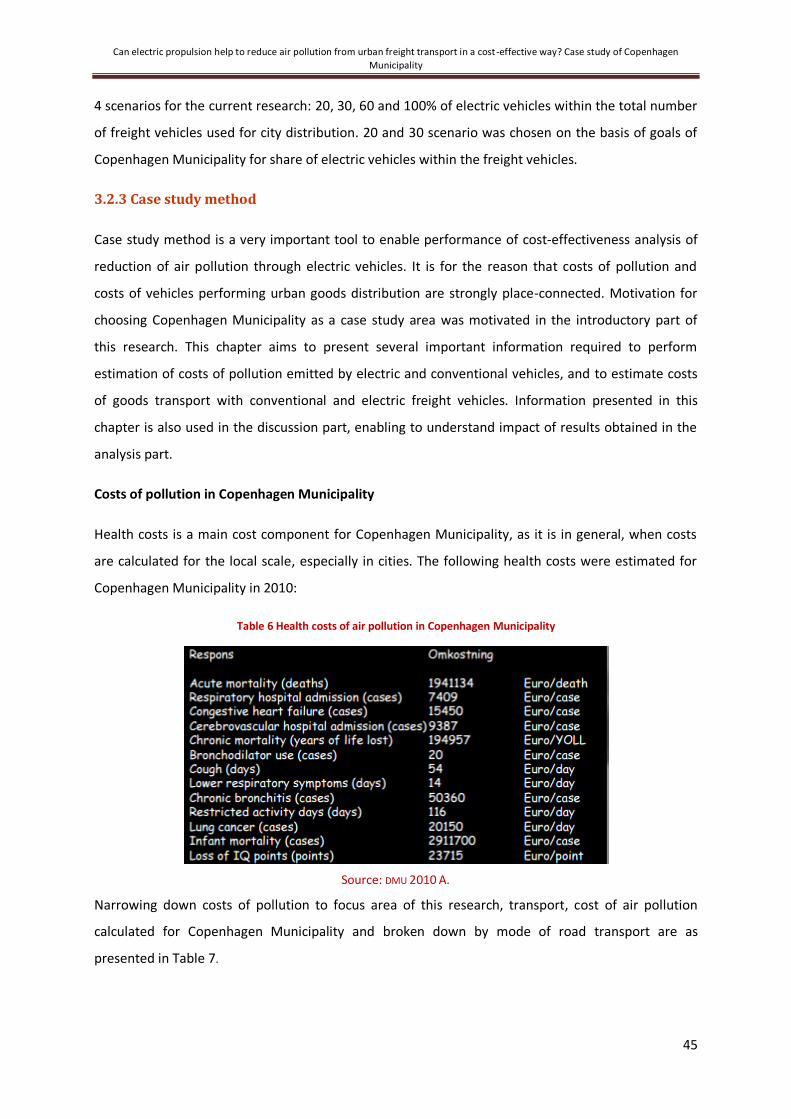
Can electric propulsion help to reduce air pollution from urban freight transport in a cost-effective way? Case study of Copenhagen
Municipality
45
4 scenarios for the current research: 20, 30, 60 and 100% of electric vehicles within the total number
of freight vehicles used for city distribution. 20 and 30 scenario was chosen on the basis of goals of
Copenhagen Municipality for share of electric vehicles within the freight vehicles.
3.2.3 Case study method
Case study method is a very important tool to enable performance of cost-effectiveness analysis of
reduction of air pollution through electric vehicles. It is for the reason that costs of pollution and
costs of vehicles performing urban goods distribution are strongly place-connected. Motivation for
choosing Copenhagen Municipality as a case study area was motivated in the introductory part of
this research. This chapter aims to present several important information required to perform
estimation of costs of pollution emitted by electric and conventional vehicles, and to estimate costs
of goods transport with conventional and electric freight vehicles. Information presented in this
chapter is also used in the discussion part, enabling to understand impact of results obtained in the
analysis part.
Costs of pollution in Copenhagen Municipality
Health costs is a main cost component for Copenhagen Municipality, as it is in general, when costs
are calculated for the local scale, especially in cities. The following health costs were estimated for
Copenhagen Municipality in 2010:
Table 6 Health costs of air pollution in Copenhagen Municipality
Source: DMU 2010 A.
Narrowing down costs of pollution to focus area of this research, transport, cost of air pollution
calculated for Copenhagen Municipality and broken down by mode of road transport are as
presented in Table 7.

Can electric propulsion help to reduce air pollution from urban freight transport in a cost-effective way? Case study of Copenhagen
Municipality
46
Table 7 Costs of air pollution generated from road transport in Copenhagen by transport mode [DKK/km]
Vehicle type PM2.5 NOx SO2
Total cost of
pollution from a
specific vehicle
mode4
Personal gasoline
vehicle 0.03 0.05 0.01 0.09
Personal diesel
vehicle 0.20 0.05 - 0.25
Bus (diesel) 0.66 0.63 0.02 1.31
Freight gasoline
van 0.05 0.08 0.01 0.14
Freight diesel van 0.32 0.09 0.01 0.41
Truck (diesel) 0.62 0.45 0.02 1.09
Total cost from all
vehicle types 1.88 1.35
0.08
(excluding personal
diesel vehicle)
3.29
Source: Jensen, S.S., Ketzel, M., & Andersen, M.S. 2010, p.44.
Table 7 shows that if number of vehicles in specific mode classes was not taken into account, but
only cost generated by one vehicle per km, the biggest cost of pollution driver5 are trucks, and the
least passenger vehicle. This is not surprising. since truck is the biggest energy consumer and
personal vehicle is the smallest one. Further, it is also important to note, that differences in pollution
generated by passenger and freight vehicles are huge. When it comes to specific air pollutants, the
most of PM2.5, NOx and SO2 is generated by buses and trucks. It can be easily spotted, that diesel
vehicles produce significantly more PM2.5 than gasoline ones, if cost of emission from diesel and
gasoline vehicles is compared,. Interestingly, emission of SO2 is almost equal for all types of vehicles.
Situation changes radically, when total cost of pollution generated by each group of vehicles is
calculated, instead of cost per km per each group of vehicles. It is caused by inclusion of a number of
vehicles in each group as a factor influencing cost of pollution.
4 Including only PM2.5, NOx and SO2, since this data was only available.

Can electric propulsion help to reduce air pollution from urban freight transport in a cost-effective way? Case study of Copenhagen
Municipality
47
Table 8 Composition of costs of pollution generated by road transport in Copenhagen.6
Cost of pollution
generated per km
Position in a rank of the
most polluting group of
vehicles (for one vehicle from each
group)
Number of vehicles
% of total fleet
Total cost of
pollution from
vehicles
% of total cost of
pollution generated
Personal (diesel + gasoline)
0.17 4 124512 82.8% 21167 70%
Bus (diesel)
1.31 1 447 0.3% 585 2%
Freight van
(diesel + gasoline)
0.275 3 23844 15,9% 6557 22%
Truck
1.09 2 1620 1.1% 1765 6%
Total 2.85 X 150423 100% 30075 100% Source: own calculation on the basis of Table 9 and Table 7.
Road transport and traffic levels in Copenhagen Municipality
Total number of vehicles and number of freight vans was counted on the basis of data from Statistics
Denmark:
Table 9 Composition of road transport in Copenhagen
Passenger vehicles 124512
Co
pen
hag
en 2
012
Busses 447
Freight vans 23844
Trucks 1053
Trailers 17 411
Motorcycles 7364
Scooters 2092
Tractors 1139
Fire trucks and trucks and vans for cleaning purposes
567
Source: STATISTIKBANKEN 2013.
6 Cost of pollution generated by motorcycles, scooters, tractors and trailers excluded due to lack of data (11%
of vehicles in Copenhagen Municipality).

Can electric propulsion help to reduce air pollution from urban freight transport in a cost-effective way? Case study of Copenhagen
Municipality
48
Table 9 shows, that passenger vehicles are the biggest group of vehicles in Copenhagen Municipality;
freight vans is a second biggest group of vehicles utilised. Table 10 shows, that the most popular
weight of freight van utilised in Copenhagen Municipality are vans between 2 and 3 tonnes.
Table 10 Composition of freight vehicles fleet in Copenhagen
Freight vans 0-2.000 kg
Freight vans 2.001-3.000 kg
Freight vans 3.001-3.500 kg
Freight vans in total
3322 13457 7065 23844 Source: STATISTIKSBANKEN 2013
Since passenger vehicles is the biggest group of vehicles, they also generate the biggest traffic on
Copenhagen’s roads: more than 4 times more km is travelled daily by this mode than by the second
largest group, which travels 0,89 million km daily.
Table 11 an average daily traffic in Copenhagen on a normal weekday [million km].
Type of vehicle 2012
Passenger vehicles 3.60
Freight vehicles 0.89
Trucks 0.11
Buses 0.08
Motocycles 0.04
Total 4.72
Source: STATISTIKSBANKEN 2013 A
Noise limits for night distribution
In Denmark, maximum allowed noise level in the night time is the same as for the day time. Though,
noise limits for day and night can be raised if demanded by citizens of a specific area. Therefore, if
night distribution was performed in Copenhagen now, noise lowering equipment for vehicles would
not be probably a requirement. But, on the other hand, it can be expected, that striker limits would
be established, if night distribution was implemented for a big scale in Copenhagen Municipality.
Pollution generation from electricity production in Copenhagen Municipality
There are three power plants that supply electricity to Copenhagen: Fynsværket, Amagerværket and
Vestforbrændingen. Fynsværket runs on coal and natural gas, Amagerværket almost solely uses coal
and Vestforbrændingen – municipal waste. Each year they produce (respectively) 499, 587 and 312
tonnes of SO2, 4403, 1192 and 787 tonnes of NOx and 147, 14 and 6.3 tonnes of primary
particulates. Energy production accounts also for 51% of greenhouse emissions in the city of

Can electric propulsion help to reduce air pollution from urban freight transport in a cost-effective way? Case study of Copenhagen
Municipality
49
Copenhagen. This may become an issue if electric vehicles are introduced as these figures will
certainly rise if no other sources of energy are provided (DMU B, 2006).
Goals of Copenhagen Municipality regarding reduction of air pollution levels from transport and
from energy production
The goals for alternatively fuelled vehicles have already been listed in the introductory chapter.
Besides that, the goals that the Copenhagen Municipality sets are as follows:
75% of trips in Copenhagen should be on time and travelled using bicycles or public
transport.
For 50% of trips to shool or work bicycles should be used.
20% increase in number of passengers of public transport.
CO2-neutral public transport
Figure 18 Composition of CO2 reduction from different initiatives planned within CPH 2025 Climate Plans
Source: COPENHAGEN MUNICIPALITY I 2013, P. 9.
Production of electricity should be based on wind and biomass power in 2025 (COPENHAGEN
MUNICIPALITY 2012 F, P.36). ACCORDING TO CLIMATE Strategy of Copenhagen, changes in the field of
energy production will play a major role in endeavoured reduction of CO2 in Copenhagen
Municipality, as visible in the Figure 19 Goals for CO2 emission from energy production in
Copenhagen Municipality in 2025. Reduction will be mainly achieved through increase in share of
energy produced from wind and biogas as shown in the Figure 19.

Can electric propulsion help to reduce air pollution from urban freight transport in a cost-effective way? Case study of Copenhagen
Municipality
50
Figure 19 Goals for CO2 emission from energy production in Copenhagen Municipality in 2025.
Source:CLIMATE STRATEGY OF COPENHAGEN MUNICIPALITY 2013 P.36.
Type of vehicles chosen within the case study area
Research is focused on freight vans (understood as freight vehicles below 3.5 tonnes). It is for the
reason that bigger electric vehicles are almost absent on the world market and not used in Europe.
The biggest electric truck in operation in Denmark is of 4 t GVW, Modec truck, but this product did
not find sufficient target market and company producing this truck went bankrupt. One of the main
reason for that was a weight of the truck exceeding 3,5 tonnes, causing higher fee for entering the
city and higher truck drivers wages.
Only diesel fuelled freight vans are taken into calculation7, since a vast majority of freight vans in
Denmark operates on diesel (it is cheaper than gasoline when it comes to price per unit of fuel and
also diesel engine is more energy effective – this is important benefit for companies, since
operational costs build up a big part of their costs)8.
7 Composition of freight vans in regards to fuel was not found for neither Copenhagen nor Denmark. The only
data found concerns trucks (vehicles above 3.5 t), and these are 100% fuelled with diesel. 8 Information gathered from a director of Danish Association of Transport and Logistics Centres (BENTZEN 2013).

Can electric propulsion help to reduce air pollution from urban freight transport in a cost-effective way? Case study of Copenhagen
Municipality
51
4. Analysis of cost-effectiveness of reduction of air pollution through
deployment of electric freight vehicles for urban goods distribution.
Case study of Copenhagen Municipality
4.1 General method applied On the basis of the 4 analyses building up this chapter, cost effectiveness of reduction of air pollution
through electric freight vans in Copenhagen Municipality is assessed.
The following calculations are performed in the analysis:
1) Difference in level of pollution produced by a conventional and electric freight van in
Copenhagen Municipality and scenarios for air pollution levels with a different share of electric
freight vans.
Main aim of this part of analysis is firstly to provide input data for calculation to be performed in
point 2), on costs of pollution generated by traffic. Second aim is to answer how much air pollution
can be decreased with electric freight vans.
Method: Firstly, level of pollution generated by one conventional freight van and a total fleet of
freight conventional vans operating in Copenhagen Municipality is counted, on the basis of
information on level of air pollution generated by total transport in Copenhagen. This input data is
gathered from analyses performed by DTU9 (data about vehicles’ fleet composition in Copenhagen
Municipality) and COWI10 (data about level of pollution generated by freight vans in Copenhagen
Municipality). Secondly, level of pollution which would be generated by one electric freight van and a
100% electric total fleet of freight vans in Copenhagen Municipality is estimated. It is calculated in 2
versions: with and without inclusion of pollution generated during production of electricity at the
energy plant (version “without” can be also understood as a situation when production of energy
does not produce any pollution). These 2 calculations are based on input data for: pollution created
from energy production (data source: pollution produced by energy plants producing electricity for
Copenhagen Municipality) and on energy consumption of freight electric vans. The latter data is
calculated separately for 3 GVW classes: 0-2t, 2-3t and 3-3,5t11 (data source: car dealers in Denmark;
energy consumption for specific models in each of distinguished GVW classes). Thirdly, difference in
air pollution produced by an electric and diesel freight van is calculated. Finally, on the basis of
9 DTU 2013. 10 COWI 2010. 11
An average energy consumption from 3 GVW classes in Copenhagen is used; information on energy consumption from each GVW class is weighted on the basis of a share of freight vans in each GVW class in Copenhagen Municipality.
Can electric propulsion help to reduce air pollution from urban freight transport in a cost-effective way? Case study of Copenhagen
Municipality
52
performed calculations, there are developed scenarios on the basis of counted differences in air
pollution produced. Scenarios: 10, 30, 40, 60 and 100% of freight vehicles transporting goods in
Copenhagen replacement for electric ones is developed12. Scenarios include information on changes
in the number of respective vehicles and followed decrease of local pollution and CO2 emission.
Difference in emission factor between one conventional and one electric vehicle is multiplied by a
growing number of electric vehicles in the respective scenarios. There is made an assumption that
marginal reduction of emission produced by an additional electric vehicle is constant. Due to this
assumption, results of the analysis can show higher reduction of air pollution than it would occur in
reality.
2) Difference in cost of air pollution generated by a conventional and a electric freight van in
Copenhagen Municipality and scenarios for cost of air pollution produced with a different share of
electric freight vans.
Aim is to answer a question: how much of cost of pollution produced by freight vans can be
decreased with electric freight vans?
Method: On the basis of levels of pollution calculated in the 1) part of analysis, firstly, there is
calculated cost of pollution generated by one freight van and a total fleet of freight vans operating in
Copenhagen Municipality (data source: analysis performed by DMU, DMU 2010). Secondly, there is
estimated cost of pollution which would be produced by an electric freight van and a 100% electric
total fleet of freight vans operating in Copenhagen Municipality (data source: information included in
DCE 2006: cost of pollution produced by energy plants producing electricity for Copenhagen
Municipality). Thirdly, difference in cost of pollution produced by an electric and diesel freight van is
calculated. Finally, scenarios for 10, 30, 40, 60 and 100% of electric freight vans are performed, on
the basis of differences in cost of pollution.
When it comes to both level and cost of air pollution, I am mainly interested in a difference between
conventional and electric vehicle. It is because aim of my paper is to analyze cost-effectiveness of
reduction of air pollution, reduction through electric vehicles. Level and cost of pollution produced
by electric vehicles is also presented, but it is an additional result, since these information is not
necessary to account cost-effectiveness of reduction of air pollution.
12 Scenarios for 20, 30 are goals established by Copenhagen Municipality for share of alternatively fuelled freight vans till
2025.

Can electric propulsion help to reduce air pollution from urban freight transport in a cost-effective way? Case study of Copenhagen
Municipality
53
3) Difference in cost of a conventional and electric freight van deployment in Copenhagen
Municipality.
Aim is to answer a question: how much does it cost to reduce air pollution through shift to electric
freight vans?
Method: Estimation of differences in costs between a conventional and an electric freight van
performing goods distribution in Copenhagen Municipality is conducted. Further, an attempt to
assess how this cost-effectiveness can be affected by switching distribution to night hours is
undertaken (data source: information from point 1)-3) and from case study in the Netherlands is
used) Method used for calculation follows method used in the Netherlands (as described in the
theory chapter of the current research). Scenarios are not developed, since marginal cost of electric
vehicle is assumed to be constant, due to reason argued in the methodological chapter of this paper.
Since I am counting a difference in a cost of pollution, a difference and not the pure cost of electric
vehicle is calculated. Newly purchased conventional and electric vehicle is used to calculated this
difference. It must be noted, that the difference in cost is calculated under assumption that public
authorities are not interested in a near future (1-2 years) changes in regulations concerning electric
vehicles, but in the longer term (goal for reduction of emission and share of vehicles with alternative
propulsion is established for 2025 for Copenhagen Municipality). In the long term, a broken down
conventional vehicle would be simply replaced with a new electric vehicle, instead of with a
conventional one. Hence, difference in cost is a proper cost indicator. In this situation, difference in
cost shows how much more expensive is an electric vehicle compared to a conventional vehicle.
Author is aware, that if more restrictive regulations on emission from vehicles will be implemented in
the near future, then companies will be "encouraged" to replace conventional vehicles with e.g.
electric ones before they were planning to replace it anyway with new vehicles. Then, difference in
cost should be calculated in another way: cost of electric vehicle minus revenue from selling an
conventional used vehicle. However, due to limited data availability and timelines this second
method of calculation was not performed. Cost of electric vehicle, is also presented, but as an
additional outcome, mostly in order to show what are the additional costs which were not included
in the calculation, due to lack of sufficient data.

Can electric propulsion help to reduce air pollution from urban freight transport in a cost-effective way? Case study of Copenhagen
Municipality
54
4) Cost difference between day and night time operation for conventional and electric freight van in
Copenhagen Municipality.
Aim is to answer a question: can electric freight vans become more competitive against diesel fueled
freight vans if switched from day time to night time operation?
Method: Method used in the Netherlands is followed to calculate differences in cost of vehicle
operating in the night and day time. Method is already discussed in the theoretical chapter. Main
input data are the results from section 3) – costs in the day time for electric and conventional
vehicles.
4.2 Level of air pollution generated by freight transport in Copenhagen
Emission from conventional freight vans
There was available data for total emission produced by an average conventional freight van in
Copenhagen Municipality. However, this data is not useful when electric and conventional vehicle
should be compared, since these vehicles pollute different levels of specific pollutants. Therefore,
emission values for specific pollutants (SO2, NOx, CO2) was used. Only data at the country level were
available.
Table 12 WTW Emission from freight vans in Denmark [g/km]13
Source: COWI 2010, P. 38, STATISTIKBANKEN 2012.
13
Data only at the country level and for 1,5 t GVW freight van was available. However, emission can be only higher for Copenhagen Municipality, since pollution generated in cities is higher due to high concentration of vehicles.
SO2 [g/km] NOx [g/km] CO2 [g/km]
Emission from one freight vans [grams per 1 km
travelled by 1 vehicle]
0.013 1.104 275
Emission from all the freight vans operating in
Copenhagen Municipality [grams per 1 km
travelled by the whole fleet of vehicles: 23 844]
310 26 323 6 557 100
Daily emission from all freight vans currently
operating in Copenhagen [grams/km times
average daily traffic in Copenhagen
Municipality: 0,89 million km]
11 000
980 000
244 750 000

Can electric propulsion help to reduce air pollution from urban freight transport in a cost-effective way? Case study of Copenhagen
Municipality
55
Emission from electric freight vans
Main contributors to emission from energy plants in Denmark are SO2 and NOx, Additonally, CO2
emission was counted, since Copenhagen Municipality aims to decrease this pollutant. The following
emission would be generated by an electric freight vehicle currently used in Copenhagen, considering
pollution generated by energy plants in Denmark14:
Table 13 Average emission from energy plants in Denmark
Size of energy plant Emission of SO2 from an EV
in Denmark [g/MWh]
Emission of NOx from an EV
in Denmark [g/MWh]
Emission of CO2 from an EV
in Denmark [g/MWh]
>25 MWh 60 875 N/A
≤25 MWh 180 300 N/A
Average 129 587,5 445
Source ENERGINET 2013 p. 6, energistyrelsen 2011.
Below, in Table 15, there is presented estimation of energy consumption by an average electric
freight vehicle expected to deliver goods in Copenhagen Municipality. This is calculated on the basis
of information included in Table 14, where energy consumption from several models of electric
freight vehicles is presented, broken down to GVW classess, for which data for energy cosnumption
of conventional vehicle is also provided.
Table 14 GVW-splitted goods transportation with freight vans in Copenhagen Municipality
GVW 0-2 t GVW 2-3 t GVW 3-3,5 t
Vehicle model
Energy consumption
[KWh/km]
Vehicle model
Energy consumption[KWh/km]
Vehicle model
Energy consumption[KWh/km]
Citroen Berlingo
0.22 Omega 1.3 (E-Wolf)
0.16 German E-cars
0.35
Omega 0.7 (E-Wolf)
0.187 Fiat E-Scudo
0.26 Mercedes Vito E-
cell
0.22
Fiat Fiorino
0.24 Renault Kangoo
Van Z.E.
0.16 Smith Edison
0.3
Source:E-WOLF 2013, E-WOLF 2013 A, FIAT FIORINO 2013, DAIMLER 2013, E-MOBILITY NSR 2013.
14 Data for g/Wh was not found for Copenhagen and therefore country level data were applied.

Can electric propulsion help to reduce air pollution from urban freight transport in a cost-effective way? Case study of Copenhagen
Municipality
56
An average energy consumption by freight electric vehicle was estimated, on the basis of current
population of each GVW class for conventional vehicle in Copenhagen Municipality. Results are
presented in Table 15.
Table 15 Estimation of energy consumption by freight electric vans for Copenhagen Municipality
Source: own calculation.
On this basis, it was possible to estimate emission of air pollution from freight electric vans if
deployed in Copenhagen Municipality:
Table 16 Estimation of air pollution produced by freight electric vans for Copenhagen Municipality
Source: own calculation on the basis of STATISTIKBANKEN 2012, STATISTIKSBANEKN A 2012.
Scenarios of various share of electric freight vans in a total fleet of freight vans operating in
Copenhagen
For the need of comparison of difference in pollution produced by electric and conventional freight
vans in scenarios, emission from 1,7 t electric freight van, Fiat Fiorino, was additionally calculated
(since data only for 1,5 t conventional freight van are available). Even though results from these
scenarios show less precisely emission changes for Copenhagen (1,5 t instead of average GVW used),
the percentage difference between emission produced by conventional and electric vehicles received
should be still valid for Copenhagen Municipality (if linearity in change of pollution produced by the
changing share of electric vehicles in the traffic is assumed). Fiat Fiorino consumes 0,24 kWh/km,
which is only 0,03 kWh more that an average energy consumption counted for electric freight vans.
GVW 0-2 t GVW 2-3 t GVW 3-3,5 t
Number of vehicles 1068 1919 320
Weights 32% 58% 10%
Average energy consumption [kWh/km] 0.22 0.19 0.29
Weighted arithmetician mean [kWh/km] 0.21
SO2 [g/km] NOx [g/km] CO2 [g/km]
Emission from an electric freight
vehicle (emission from energy
supply) assuming electricity
consumption of 0,21 kWh/km
0.027 0.12 113.61
Emission from a 100% share of
electric freight vehicles in
Copenhagen
37800 g 168 000 g 159 054 000 g

Can electric propulsion help to reduce air pollution from urban freight transport in a cost-effective way? Case study of Copenhagen
Municipality
57
Hence, since differences in emission between conventional and electric vehicles are very high, it was
concluded, that pollution generated by electric freight vans on average (0,21 kWh/km energy
consumption) can be assumed to be almost the same as that counted for Fiat Fiorino. This way,
emission results presented in Table 17 are valid for an average electric freight van:
Table 17 Estimation of pollution generated by traffic in Copenhagen for various scenarios of EVs share in the total fleet [g/km]
Conventional freight van
100% 90% 70% 60% 40% 0%
SO2 309 278 216 185 124 0
NOx 26323 23691 18426 15794 10529 0
CO2 6557100 5901390 4589970 3934260 2622840 0
Electric freight van
0% 10% 30% 40% 60% 100%
SO2 0 99 297 396 594 990
NOx 0 465 1396 1860 2793 4655
CO2 0 254654 763962 1018616 1527924 2546539
Sum of pollution
SO2 309 377 513 581 718 990
Sum of pollution
NOx 26323 24156 19822 17654 13322 4655
Sum of pollution
CO2 6557100 6156044 5353932 4952876 4150764 2546539
Share of electric
vehicles in the total fleet
0% 10% 30% 40% 60% 100%
% reduction of emission
(minus reduction
means increase)
SO2 - -22% -66% -88% -132% -220%
NOx - 8% 25% 33% 49% 82%
CO2 - 6% 18% 24% 37% 61%
Source: own calculation.
Emissions presented in Table 17 were counted for 23844 conventional and 33015 electric vehicles
(reason for this: look in chapter 4.2, subchapter “Inclusion of the changing payload factor when
switched from conventional to electric freight van”).
It is also interesting to see what is an average % difference in emission for 1 vehicle: electric vehicle
emits around 231% more SO2, 87% less NOx and 99,5% less CO2 :
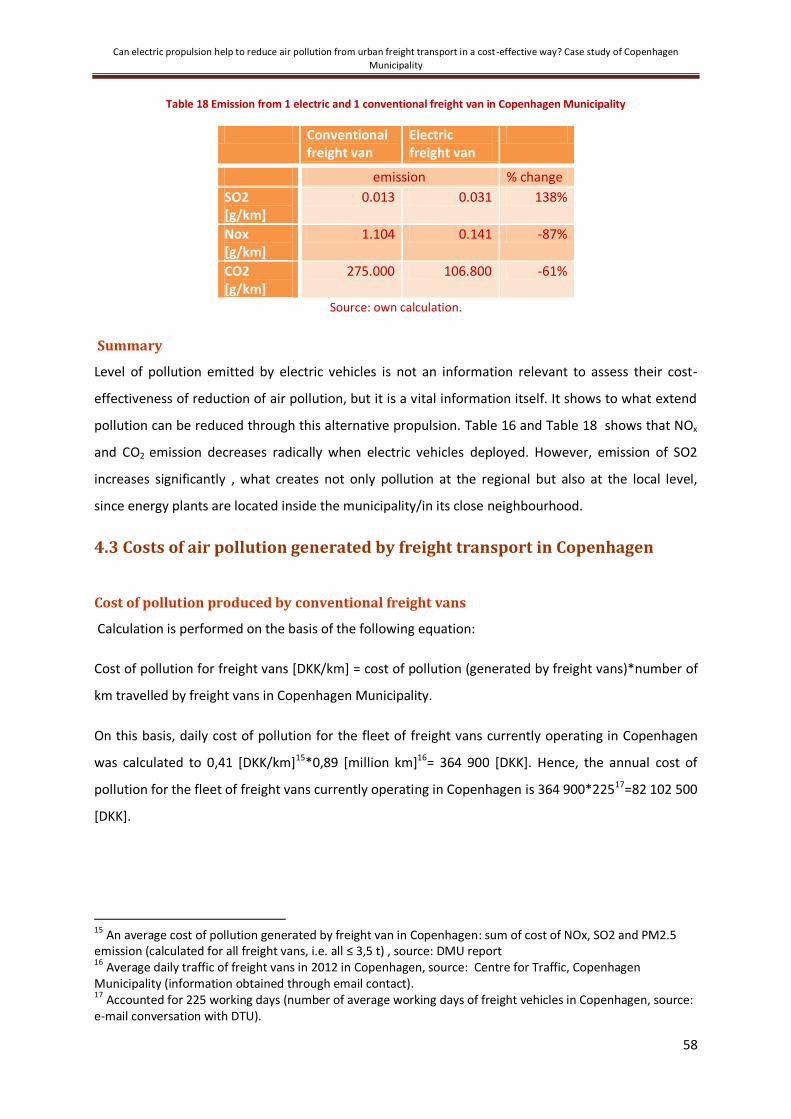
Can electric propulsion help to reduce air pollution from urban freight transport in a cost-effective way? Case study of Copenhagen
Municipality
58
Table 18 Emission from 1 electric and 1 conventional freight van in Copenhagen Municipality
Conventional freight van
Electric freight van
emission % change
SO2 [g/km]
0.013 0.031 138%
Nox [g/km]
1.104 0.141 -87%
CO2 [g/km]
275.000 106.800 -61%
Source: own calculation.
Summary
Level of pollution emitted by electric vehicles is not an information relevant to assess their cost-
effectiveness of reduction of air pollution, but it is a vital information itself. It shows to what extend
pollution can be reduced through this alternative propulsion. Table 16 and Table 18 shows that NOx
and CO2 emission decreases radically when electric vehicles deployed. However, emission of SO2
increases significantly , what creates not only pollution at the regional but also at the local level,
since energy plants are located inside the municipality/in its close neighbourhood.
4.3 Costs of air pollution generated by freight transport in Copenhagen
Cost of pollution produced by conventional freight vans
Calculation is performed on the basis of the following equation:
Cost of pollution for freight vans [DKK/km] = cost of pollution (generated by freight vans)*number of
km travelled by freight vans in Copenhagen Municipality.
On this basis, daily cost of pollution for the fleet of freight vans currently operating in Copenhagen
was calculated to 0,41 [DKK/km]15*0,89 [million km]16= 364 900 [DKK]. Hence, the annual cost of
pollution for the fleet of freight vans currently operating in Copenhagen is 364 900*22517=82 102 500
[DKK].
15 An average cost of pollution generated by freight van in Copenhagen: sum of cost of NOx, SO2 and PM2.5 emission (calculated for all freight vans, i.e. all ≤ 3,5 t) , source: DMU report 16 Average daily traffic of freight vans in 2012 in Copenhagen, source: Centre for Traffic, Copenhagen Municipality (information obtained through email contact). 17
Accounted for 225 working days (number of average working days of freight vehicles in Copenhagen, source: e-mail conversation with DTU).

Can electric propulsion help to reduce air pollution from urban freight transport in a cost-effective way? Case study of Copenhagen
Municipality
59
Cost of pollution produced by electric freight vans
Cost of pollution is calculated with inclusion of pollution generated by electricity production. In the
first situation cost of pollution created by electric vehicles is none. However, in the second situation
it is noticeable:
External pollution costs, accounted for SO2,NOx and
PM2.5 (CO2 not included due to lack of data)
Fynsvaerket Amagervae
rket
Vestforbraend
ingen
External pollution cost of electricity production
(heating production excluded) in 2005 [DKK/kWh] 0.26 0.03 0.47
An average external pollution cost of electricity
production [DKK/kWh]
0.253
An average external pollution cost of emission from
an electric freight vehicle associated with electricity
production in Copenhagen [DKK/km]
0.053
Source: own calculation on the basis of data from DCE 2006, p.21.
Inclusion of the changing payload factor when switched from conventional to electric
freight van
In order to calculate cost of emission for the situation when all freight vans are switched to electric
propulsion, number of km travelled by freight vans in Copenhagen must be recalculated, since
additional vehicles would be needed due to switch to vehicles of smaller payload. This is necessary,
since electric vehicles’ payload is decreased due to battery. In order to include a diminished load
factor to calculation of km travelled by electric vehicles in Copenhagen the following data were
gathered:
An average relation between payload and GVW for freight vans of GVW ≤3,5 t. Calculation
was performed on the basis of data for the 5 most sold freight vans of a GVW around 3 tons
in Denmark in 2012. Differences in ratio payload/GVW do not vary significantly between the
several analyzed vehicles: Volkswagen Caddy: 0,32 (724/2211 [kg]), Volkswagen Transporter:
0,37 (1128/3000 [kg]), Volkswagen Krafter 0,32 (986/3000 [kg]), Mercedes Sprinter Cargo:
0,4 (1554/3878 [kg]), Ford Transit: 0,43 (1309/3000 [kg])18. An average relation between
payload and GVW for freight vans ≤3,5 t is estimated to be: 0,36. On this basis, an average
payload of a freight van in Copenhagen was estimated: 0,36*3 [t] = 1,08 [t], where 3 tones is
the average GVW of freight van in Copenhagen.
18Sources: MERCEDES BENZ 2013, FORD 2013, MERCEDES BENZ A 2013, VOLKSWAGEN 2013, LEASEPLAN.DK 2013.
Can electric propulsion help to reduce air pollution from urban freight transport in a cost-effective way? Case study of Copenhagen
Municipality
60
An average relation between payload and GVW for electric freight vans of GVW ≤3,5 t. Data
was gathered from E-mobility NSR WP 7.3 report. Average relation between GVW and
payload was counted on the basis of electric freight vans around 3 t operating in North Sea
Region countries, since there was identified only one type of electric van in Copenhagen and
only 2 types in Denmark, of a GVW around the average GVW of a freight van operating in
Copenhagen (3t). Again, likesome conventional vehicles, relation between payload and GVW
was similar for analysed models: Mercedes Vito E-cell: 0,27 (850/3050 [t]), Renault Kangoo
Z.E.: 0,33 (715/2126 [t]), Smith Electric Edison: 0,2 (725/3.500 [t]), German E-cars 0,3
(1000/3500 [t]), Aixam Mega Multitruck 0,2 (650/3000 [t]) (source: E-MOBILITY NSR, 2013,
P.299-324). An average ratio between payload and GVW for an electric freight van is
estimated on this basis to be 0,26. Therefore an average payload of an electrically propelled
freight van in Copenhagen (of an average GVW for conventional freight van in Copenhagen: 3
t) is 0,78 [t] (0,26*3 [t]).
Summing up, the difference between the payload of an conventionally fuelled and electric vehicle is
significant: 0,3 [t] (1,08-0,78) for an average freight van in Copenhagen (average GVW). Therefore if
fleet in Copenhagen Municipality is changed to vehicles with electric propulsion, there would be
much more vehicles needed to transport goods in Copenhagen19. An average payload currently
transported by freight vans in Copenhagen: 23844 [vehicles]*1,08 [t/vehicle]= 25751,52 [t]. The
number of electric freight vans needed to transport the currently transported payload is 25751,52
[t]/0,78 [t]=33015 [vehicles], so the number of km which should be travelled is 1,2 million km (0,89
million km/23844 vehicles*33015 vehicles). This result can be also presented as additional kilometers
needed to be travelled by each electric vehicle, instead of number of additional vehicles: 50 km (1,2
million/ 23844) minus 37 km (0,89 million/23844) is 13 km.
Calculation
Finally there can be estimated a cost of pollution which would be generated daily by electric freight
vans used in Copenhagen, if all conventional freight vans are replaced with electric:0,053 [DKK/km]*
1,2 [million km] = 63 600[DKK], and a reduction of costs of pollution in this situation: 364 900 – 63
600 = 301 300 [DKK].
Difference in cost of pollution levels was also calculated, and its results are presented in Table 19:
19
It must be noted, that % of payload occupation could influence this results, but due to lack of data it must have been ignored by the current research.

Can electric propulsion help to reduce air pollution from urban freight transport in a cost-effective way? Case study of Copenhagen
Municipality
61
Table 19 Estimation of cost of pollution for Copenhagen daily traffic for different shares of EVs in the traffic flow [DKK]
electric freight van
0% 10% 30% 40% 60% 100%
0 6360 19080 25440 38160 63 600
conventional freight van
100% 90% 70% 60% 40% 0%
364900 328410 255430 218940 145960 0
Sum 364900 334770 274510 244380 184120 63600
% reduction 0% 8% 25% 33% 50% 83% Source: own calculation.
Summary
Difference in cost of pollution produced by 1 electric vehicle obtained from estimation is significant:
7 times lower. Difference is above 300 000 DKK, if difference in costs of pollution for the total fleet of
conventional freight vans replaced with electric freight vans was measured. Cost of pollution
produced by traffic consisting of 100% conventional vehicles is 83% higher than cost of pollution
produced by traffic where share of electric vehicles is 100%.
4.4 Cost of deployment of electric freight vehicles by companies for day time
goods deliveries in Copenhagen
Comment on input data
There were conducted 3 calculations of cost, in regards to GVW of freight vans operating in
Copenhagen. Calculation was performed for 3 classes: 0-2 t, 2-3 t and 3-3, 5 t. It was decided to do
so, because the relative cost of electric vehicles compared to conventional vehicle can vary
significantly depending on the GVW of the vehicle (it is just a suspicion, but it is better to check if the
difference in cost vary significantly). There was chosen 1 model of vehicle for each GVW class.
Vehicles chosen for the analysis are electric freight van already utilized by companies performing
goods distribution in Copenhagen: Mercedes Vito E-cell (3-3,5 t class), Renault Kangoo Van Z.E. (2-3 t
class) and Fiat Fiorino Van Electric (0-2 t class). Currently there is utilized 10 types of electric freight
vans for goods transport in Copenhagen Municipality (E-MOBILITY NSR 2013). The reason why only
these 3 vehicles were chosen, is that only these 3 models have their diesel equivalent; comparison of
similar models would hopefully ensure higher reliability of results.
It was possible to gather cost data20 only on Mercedes Benz Vito E-cell electric from Loomis company
performing cash transportation in Copenhagen Municipality with these vehicles. Therefore, it was
decided to use instead data from secondary sources: purchase cost: car dealers in Denmark; energy
20 However, still only for purchase and energy costs.

Can electric propulsion help to reduce air pollution from urban freight transport in a cost-effective way? Case study of Copenhagen
Municipality
62
cost (including energy consumption): car dealers in Denmark, average distance travelled in
Copenhagen and cost of energy in Denmark, Loomis uses electric vehicles to transport cash within
the Copenhagen city.
It was planned to apply formula for calculation of difference in costs, which combines all cost factors
described in chapter 2.3: in the method for calculation of difference between conventional and
electric vehicle and calculation of difference between vehicle deployed for night and day distribution.
In that case, calculation of costs should be based on the following equation:
TCOEV-ICE VEHICLE = Purchase cost EV-ICE VEHICLE + Resale value EV-ICE VEHICLE + Energy cost EV-ICE VEHICLE +
Maintenance cost EV-ICE VEHICLE + Labour cost EV-ICE VEHICLE + Battery replacement cost + Insurance cost EV-ICE
VEHICLE + Cost of CO2 emission EV-ICE VEHICLE + tax incentives
Though, due to incomplete data, only purchase and energy cost were calculated. Further, only these
costs were taken into account to assess cost-effectiveness of reduction of air pollution through
electric vehicles. Cost of vehicle calculated only on basis of purchase and fuel cost will hopefully
enable to show close to reality cost difference between conventional and electric vehicle, since
purchase and fuel cost are the main cost drivers for electric and conventional light trucks respectively
(B. A. DAVIS, M. A. FILGIOZZI 2012, P. 19), as presented on the pie charts below:
Figure 20 Cost composition for electric light trucks
Source: B. A. DAVIS, M. A. FILGIOZZI 2012, P. 20.

Can electric propulsion help to reduce air pollution from urban freight transport in a cost-effective way? Case study of Copenhagen
Municipality
63
However, after assessment is performed, potential impact on the result of the remaining cost is
reflected upon.
106 and 143 km was taken as a distance travelled daily by conventional and electric freight vans
respectively (DTU 2013). Firstly it was intended to take into account the same distances as taken for
calculation of costs of pollution (37 and 50 km for conventional and electric freight van respectively).
However, these distances, are distances travelled daily only within borders of Copenhagen
Municipality and the distance travelled daily by a freight van is much higher: 106 km21. This distance,
travelled daily by a vehicle is a relevant information, and not the distance travelled within
Copenhagen Municipality if cost of vehicle is calculated. Further, distance 37 km should be kept for
calculation of costs of pollution, since only pollution produced in Copenhagen Municipality is
counted; pollution produced in the rest of distance travelled is not relevant for cost of pollution
calculation exclusively for Copenhagen Municipality. Distance travelled by an electric vehicle was also
recalculated: 143 km (taking 37km/50km ratio from estimation of cost of pollution).
Calculation of difference in cost of conventional and electric freight van
This chapter consist of several tables, which lead the reader through the steps realized to finally
calculate a difference in cost of conventional and electric freight van operating in Copenhagen
Municipality. Firstly, estimation of difference in fuel cost was performed:
Table 20 Estimation of energy costs for conventional and electric freight vans
Energy consumption [l/km] and [kWh/km]
Fuel cost per km22
Fuel cost per 1 year (distance assumed: 32175(143*225) for EVs: km, for ICE: 23 850km (106*225))
Difference in fuel cost per year
Mercedes Vito diesel 0.099 1.11 26 445 DKK
-12 545 DKK Mercedes Vito Electric
0.27 0.43 13 900 DKK
Renault Kangoo diesel 0.052 0.58 13 890 DKK
-6 168 DKK Renault Kangoo Van Z.E.
0.15 0.24 7 722 DKK
Fiat Fiorino Van diesel 0.057 0.64 15 226 DKK
-4 930 DKK Fiat Fiorino Van Electric
0.2 0.32 10 296 DKK
Source: own elaboration.
21
STATISTIKSBANKEN B 2013. 22 SHELL 2013, DONG ENERGY 2013.

Can electric propulsion help to reduce air pollution from urban freight transport in a cost-effective way? Case study of Copenhagen
Municipality
64
Secondly, there was performed estimation of difference in purchase cost with and without inclusion
of registration tax, which is excluded for electric vehicles in Denmark. In Denmark tax for a
registration of a van vehicle depends on the price of a car: 50% for vans below 16 900 DKK, and 30%
for vans above 16 900 DKK (SKAT 2013).
Figure 21 Estimation of difference in cost of conventional and electric vehicles for Copenhagen Municipality
Conventional23/electric freight
van model24
GVW class of the vehicle Difference in purchase cost [DKK]:
a) registration tax exemption for
EVs included
b) Registration tax exemption for
EVs excluded
Mercedes Vito diesel/Mercedes
Vito E-cell
3 000 – 3 500 kg 13 693 (217 912 - 204 219 )
405 934 (610 153 – 204 219)
Renault Kangoo van
diesel/Renault Kangoo Van Z.E.
2 000 – 3 000 kg 34 300 (184 800 - 150 500)
366 940 (517 440-150 500)
Fiat Fiorino van diesel/ Fiat
Fiorino Van Electric
0 kg – 2 000 kg 49 921 (160 267 -110 346 )
338 404 (448 750 – 110 346)
Source: own calculation.
Calculation of a difference in a total cost of vehicles
Life time of electric freight van is not known currently, and therefore it was not possible to decide for
how many years cost of electric vehicles should be divided. Therefore, chart and table below present
differences in cost of electric and conventional vehicle differing time of utilization of an electric
vehicle (from 1 to 8 years) and keeping the time of utilization of conventional vehicle constant (8
years, which is an average time of usage of freight vans by companies in Denmark).
23 Data for purchase cost and energy consumption of conventional vehicles from dealers in Denmark, source: http://docs.fiatprofessional.dk/Prislister/fiatprofessionalprisliste/,http://fiat-fiorino.electric.vehicle.tel/,http://www.fiatprofessional.co.uk/uk/CMSEN/Pdf/Fiorino_Van.pdf, http://www.renault.dk/media/Pricelist/att27e77efaddeb49d081a4257a7658e1f4/Kangoo_Varebil_DK_20130101.pdf. 24 Data for purchase cost from dealers, data on energy consumption of electric vehicle from companies using electric vehicles in Copenhagen (better also from brochures so then data is somehow comparable with conventional vehicles: theoretical values), source: http://www.ens.dk/sites/ens.dk/files/klima-co2/transport/elbiler/forsoegsordning-elbiler/praktiske-erfaringer-elbiler/erfaringer-fiat/Erfaringer%20med%20Fiat%20Fiorino%20E.pdf, E-MOBILITY NSR 2013. http://www.renault.dk/media/Pricelist/att1a763eec22574171982045c08fff1b1b/Prisliste_KangooZE_DK_20130201.pdf
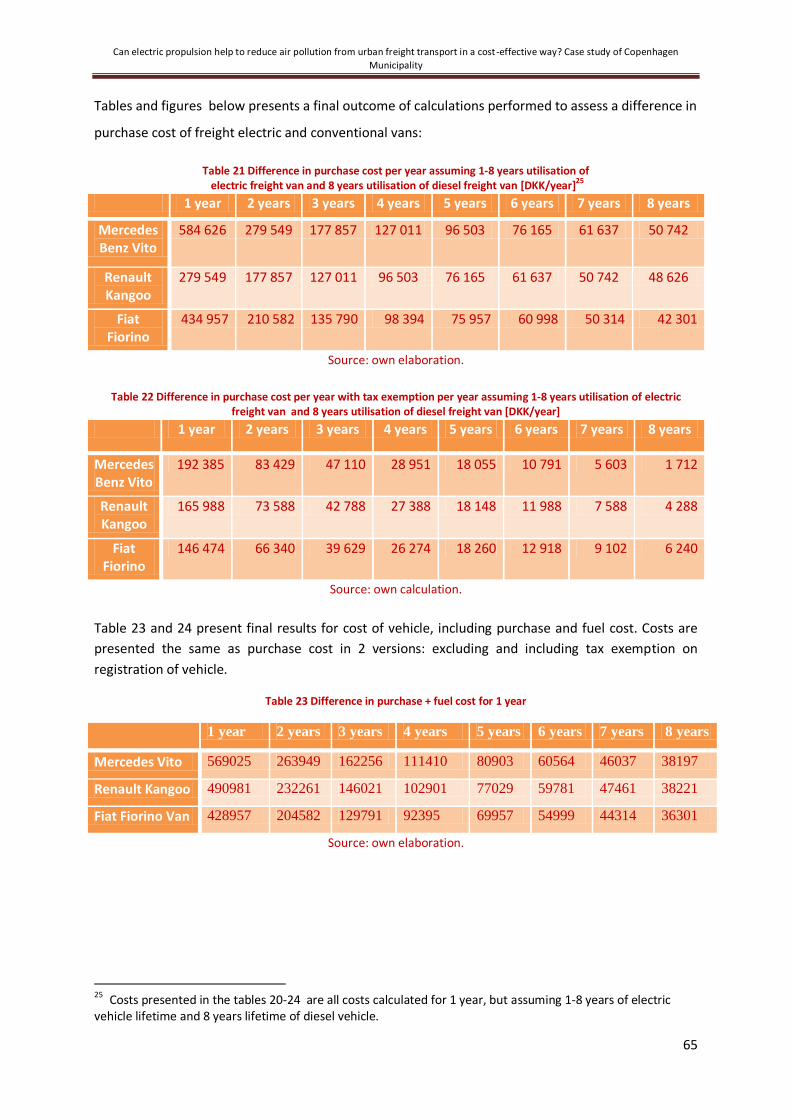
Can electric propulsion help to reduce air pollution from urban freight transport in a cost-effective way? Case study of Copenhagen
Municipality
65
Tables and figures below presents a final outcome of calculations performed to assess a difference in
purchase cost of freight electric and conventional vans:
Table 21 Difference in purchase cost per year assuming 1-8 years utilisation of electric freight van and 8 years utilisation of diesel freight van [DKK/year]25
1 year 2 years 3 years 4 years 5 years 6 years 7 years 8 years
Mercedes Benz Vito
584 626 279 549 177 857 127 011 96 503 76 165 61 637 50 742
Renault Kangoo
279 549 177 857 127 011 96 503 76 165 61 637 50 742 48 626
Fiat Fiorino
434 957 210 582 135 790 98 394 75 957 60 998 50 314 42 301
Source: own elaboration.
Table 22 Difference in purchase cost per year with tax exemption per year assuming 1-8 years utilisation of electric freight van and 8 years utilisation of diesel freight van [DKK/year]
1 year 2 years 3 years 4 years 5 years 6 years 7 years 8 years
Mercedes Benz Vito
192 385 83 429 47 110 28 951 18 055 10 791 5 603 1 712
Renault Kangoo
165 988 73 588 42 788 27 388 18 148 11 988 7 588 4 288
Fiat Fiorino
146 474 66 340 39 629 26 274 18 260 12 918 9 102 6 240
Source: own calculation.
Table 23 and 24 present final results for cost of vehicle, including purchase and fuel cost. Costs are
presented the same as purchase cost in 2 versions: excluding and including tax exemption on
registration of vehicle.
Table 23 Difference in purchase + fuel cost for 1 year
1 year 2 years 3 years 4 years 5 years 6 years 7 years 8 years
Mercedes Vito 569025 263949 162256 111410 80903 60564 46037 38197
Renault Kangoo 490981 232261 146021 102901 77029 59781 47461 38221
Fiat Fiorino Van 428957 204582 129791 92395 69957 54999 44314 36301
Source: own elaboration.
25
Costs presented in the tables 20-24 are all costs calculated for 1 year, but assuming 1-8 years of electric vehicle lifetime and 8 years lifetime of diesel vehicle.

Can electric propulsion help to reduce air pollution from urban freight transport in a cost-effective way? Case study of Copenhagen
Municipality
66
Table 23 Difference in purchase + fuel cost per 1 year with tax exemption per year (assuming 1-8 years utilisation of lectric vehicle and 8 year long utilisation of conventional vehicle)
Source: own calculation.
Figure 22 Exemplary difference in purchase + fuel cost of electric and conventional freight van GVW 3-3,5t
Source: own calculation.
Figure 23 Exemplary difference in purchase + fuel cost of electric and conventional freight van GVW 2-3 t
Source: own calculation.
Figure 24 Exemplary difference in purchase + fuel cost of electric and conventional freight van GVW 0-2 t
Source: own calculation.
-200 000 DKK
0 DKK
200 000 DKK
400 000 DKK
600 000 DKK
800 000 DKK
1 2 3 4 5 6 7 8
Difference in cost (purchase+fuel) per year (assuming 1-8 years utilisation of electric vehicle and 8 year long utilisation of conventional vehicle)
-200 000 DKK
0 DKK
200 000 DKK
400 000 DKK
600 000 DKK
1 2 3 4 5 6 7 8
Difference in cost (purchase+fuel) per year (assuming 1-8 years utilisation of electric vehicle and 8 year long utilisation of conventional …
0 DKK 100 000 DKK 200 000 DKK 300 000 DKK 400 000 DKK 500 000 DKK
1 2 3 4 5 6 7 8
Difference in cost (purchase+fuel) per year (assuming 1-8 years utilisation of electric vehicle and 8 year long …
1 year 2 year 3 year 4 year 5 year 6 years 7
years
8 years
Mercedes Vito 176784 67828 31509 13350 2454 -4809 -9998 -13889
Renault Kangoo
158341 65941 35141 19741 10501 4341 -59 -3359
Fiat Fiorino Van
140474 60341 33630 20274 12261 6919 3103 241

Can electric propulsion help to reduce air pollution from urban freight transport in a cost-effective way? Case study of Copenhagen
Municipality
67
Reader, while considering these findings must be aware, that the results presents cost values far
lower than the cost of vehicle utilisation borne by company performing goods distribution.
Therefore, reason for presenting these results is only to show rough difference between electric and
conventional vehicle (only differences are shown in tables and charts).
Summary
Difference in cost of electric and diesel freight vans occurred to be in favor of conventional vehicles,
also when cost deduction was included into calculation. There was observed one exemption:
Mercedes Benz Vito E-cell becomes more competitive than conventional vehicles when utilized 8
years.
This results clearly show, that without public support electric vehicles are not currently competitive
in regards to cost. It is visible, that this support is needed, but is it beneficial for the society? How
much reduction of costs of pollution can be achieved with them? This question comes back again and
answer for it must be given in order to decide if it is reasonable for public authorities in Copenhagen
Municipality to further support electric vehicles, i.e. if they reduce air pollution significantly and what
is cost-effectiveness of this reduction.
4.5 Difference in cost of electric and conventional freight vans by companies
operating in the day and night time in Copenhagen Municipality
There can be distinguished several cost factors which can cause change in competitiveness relation
between electric and conventional freight vans if both vehicles switch to night time operation. First
of these costs is a noise reducing retrofits of a vehicle and trailers. This can be significantly reduced if
electric vehicles are deployed, since their engines do not emit noise26:
Table 24 Cost of noise reducing equipment required for performance night distribution in the Netherlands
Type of propulsion Cost of retrofits per year [DKK]
Potential cost for electric truck of 40 t 223 603
Conventional truck of 40 t 410 000
Source: INTERVIEW WITH ROBERT GOEVAERS 2013.
Cost of retrofits required to perform night distribution in the Netherlands could not be simply added
to the cost of electric and conventional vehicle. It is because data for the cost of retrofits is available
only for trucks of 40 tonnes GVW (this is a typical GVW of trucks performing night distribution in the
26
These retrofit is required in the Netherlands in cases of distribution performed in the residential areas. This assumption is kept for Copenhagen Municipality.

Can electric propulsion help to reduce air pollution from urban freight transport in a cost-effective way? Case study of Copenhagen
Municipality
68
Netherlands), which can be much bigger than cost of retrofits of freight vehicles analyzed in the
current paper (more expensive engine to replace, bigger trailers to equip with noise reducing
equipment). 186 350 DKK is a cost of conversion of diesel to natural gas propelled engine in the
Netherlands, cost of conversion to gas engine for personal vehicle costs was found to be 37 400 DKK
(so 4678 DKK per year keeping assumption of 8 years utilisation) (WOJDYLA 2013).
The other costs taken into account in the Netherlands for which relation between electric and
conventional vehicle can change if operation switched from day to night time are: fuel cost, labour
cost and vehicle cost per hour and vehicle cost per km. Maintenance cost (defined as operational
cost excluding fuel cost and labour cost) per km and per hour (excluding fuel cost) are cost factors
which were calculated in the Netherlands, but are not calculated for Copenhagen Municipality27.
It was expected, that electric vehicles can increase competitiveness if operating in night, but after
consideration of results from the preceding analysis parts, it seems to be very hard to achieve. It is
because electricity cost per km is much lower than of fuel, and therefore electric vehicles can
become more competitive only if it travels long distances. When vehicle switches from day to night
operation, distance travelled decreases significantly, since congestion is very low. This situation
causes, that electric vehicles become actually less competitive: increasing speed of a vehicle ->
decreasing travel time -> decreasing energy consumption and labour cost -> electric vehicle become
less competitive. In other words: the less electric vehicle travels, the less competitive against
conventional vehicle it becomes (see also for instance: B. A. DAVIS, M. A. FIGLIOZZI, 2012).
To sum up, it can easily noticed, that electric vehicle can become more competitive thanks to switch
from day to night time operation only if noise reducing retrofits of diesel engine are higher than the
difference in other costs between conventional and electric vehicle in the night time. This
comparison is performed in the next subchapter.
Estimation for Copenhagen Municipality
Below, there is presented estimation of potential maximum reduction in operational costs of
performance of goods deliveries for Copenhagen Municipality associated with shift to night
distribution. Method used in the Netherlands was followed. This estimation was performed only for
Mercedes Benz Vito and Mercedes Benz Vito E-cell, since models of electric freight vans from lower
GVW classes already proved to be not competitive against their conventional equivalents.
27
Data on differences in maintenance cost between day and night distribution were not available for Copenhagen and therefore they were assumed to be equal for day and night. What is more, in the Netherlands this cost factor was equal for day and night time operation.

Can electric propulsion help to reduce air pollution from urban freight transport in a cost-effective way? Case study of Copenhagen
Municipality
69
Figure 25 Input data for calculation of difference in fuel cost between day and night
Mercedes Benz Vito Day time Night time
Mercedes Benz Vito (diesel/electric) Diesel electric diesel electric
Distance in km per year per vehicle 23850
32175
23850
32175
Average energy consumption per 1 km (in l for diesel and in kWh for electric
vehicle)
0.099 0.27 0.06 0.16
Cost of fuel per litre 11.2 1.6 11.2 1.6
Fuel cost per year 26445
13900
16027
8237
Source: own calculation on the basis of data used previously in this analysis for Mercedes Benz Vito, average speed in
Copenhagen Municipality during day time: 30 km/h and max speed: 50 km/h.
Table 25 Difference in fuel costs per year between Mercedes Benz Vito E-cell and Mercedes Benz Vito in two options: day and night time
[DKK/year] Day time Night time
Difference in fuel cost per year between Mercedes Benz Vito E-cell and Mercedes Benz Vito
-12545
-7790
Fuel cost difference per year between Mercedes Benz Vito E-cell and Mercedes Benz Vito between day and night time
4755
Difference in cost of noise reducing equipment per year between Mercedes Benz Vito E-cell and Mercedes Benz Vito
- -4678
Source: own calculation.
Figure 26 Difference in purchase + fuel cost difference for the night time operation
without inclusion of difference in cost of noise reducing equipment
1 year 2 years 3 years 4 years 5 years 6
years
7
years
8 years
Cost difference for Mercedes
Benz Vito
576 835 271 759 170 067 119 220 88 713 68 374 53 847 42 951
Cost difference with inclusion
of tax deduction for
Mercedes Benz Vito
184 594 75 638 39 320 21 160 10 265 3 001 -2 187 -6 079
Cost difference for Renault
Kangoo
494 713 235 993 149 753 106 633 80 761 63 513 51 193 41 953
Cost difference with inclusion
of tax deduction for
Reanult Kangoo
162 073 69 673 38 873 23 473 14 233 8 073 3 673 373
Source: own calculation.

Can electric propulsion help to reduce air pollution from urban freight transport in a cost-effective way? Case study of Copenhagen
Municipality
70
4.6 Cost-effectiveness of reduction of air pollution through electric freight
vans in Copenhagen Municipality
In order to assess cost-effectiveness differences in cost of pollution produced and differences in cost
of vehicles are summarized.
Difference in cost of pollution
o Difference per vehicle per km: 0,35 DKK.
o Difference per vehicle per year: 2817 DKK.
o Difference per vehicle per year with assumption that electricity production does not
generate any pollution: 3 413 DKK.
Difference in cost of vehicles was also calculated, for Mercedes Benz Vito:
o Difference in cost per km (the smallest difference in costs) and under assumption that it
is utilised at least 8 years: 1,47 DKK/km (without tax exemption) and -0,43 DKK (with tax
exemption).
o Difference in cost per vehicle per year: 35 141 DKK without inclusion of registration tax
deduction and -13 889 DKK with inclusion.
o Difference in cost per vehicle per year for night time vehicle operation: 42 951 DKK
without inclusion of registration tax deduction, and - 6 079 DKK with inclusion.
o Difference in cost per vehicle per year with exclusion of assumption that electric vehicle
needs to travel longer distance: 31 783 DKK (3 000 DKK smaller than when assumption
was included).
On the basis of these results, it is visible, that electric vehicle is cost-effective in reduction of air
pollution only when exempted from registration tax. In this situation, Mercedes Benz Vito becomes
cost-effective if used 5 years, Renault Kangoo if used at least 6 years and Fiat Fiorino if utilised at
least 8 years. Further, results show, that there is a significant difference in costs of vehicles in favour
of conventional vehicles (purchase and fuel) and it is caused only to small extent by inclusion of
assumption of a diminished payload. Moreover, night distribution proved to not diminish differences
in costs of vehicles. In addition, production of energy for electric freight vehicle from clean energy
sources would not importantly improve cost-effectiveness. Last but not least. electric freight vehicle
should be 260 000 DKK cheaper in order to become a cost-effective tool for reduction of air pollution
in Copenhagen Municipality.

Can electric propulsion help to reduce air pollution from urban freight transport in a cost-effective way? Case study of Copenhagen
Municipality
71
5 Discussion of findings on cost-effectiveness of reduction of air
pollution with electric vehicles deployed for day and night time
operation
Even though this research could not prove that freight electric vehicles are a cost-effective tool in
pollution reduction there are still reasons to investigate few related subjects. This is primarily
because of already existing significant public support for such vehicles in a form of tax exemptions
which affects the real costs borne by the companies. Therefore cost components will be examined to
determine if any of them can be decreased in a short-term. As noted in the introductory chapter,
electric vehicles is the most CO2-reducing technology available (when compared with 1st and 2nd
generation of bio-fuels, fuel cells, hybrid and plug-in hybrid) and the most energy-efficient from all
known currently what is important from environmental point of view so this issue will also be
addressed. It will be mentioned as well that night distribution decreases operational costs of logistic
companies but at the same time removes partially the advantage that electric vehicles have over
diesel vans as the fuel cost generated while vehicles are stuck in heavy traffic. As a result electric
freight van payback period increases even more as the profit from lower operational costs declines.
Furthermore the share of goods delivery-related pollution in transport pollution will be examined
and thus the potential of changes in this field will be assessed. Additionally the significance of vehicle
cost in companies' budget will be estimated and finally, since electric freight vehicles seem not to be
cost-effective in pollution reduction, it is worth having a look if other solutions are – especially
passenger electric vehicles.
5. 1. Consideration of differences in cost of vehicles
Costs were calculated, and it occurred to be that electric freight vans are more expensive than diesel
ones. Therefore question comes: can main cost determinant responsible for difference in cost of
vehicles be decreased in case of freight electric vehicles? Purchase cost of electric vehicles is already
strongly positively affected by tax exemption and this cost cannot be affected by companies on their
own. Besides of public support, decrease of purchase cost can take place only in a long term, due to
factors such as mass production of electric vehicles or technological breakthrough. Though, when it
comes to fuel cost, it can be surely decreased by extending distance travelled with an electric
vehicle. However, it should be also kept in mind that, the more km travelled, the faster come need
to replace a battery. To what point it is profitable to extend distance travelled cannot be answered in
this paper due to time limits, but certainly such information could help companies to minimize costs
of usage of their electric vehicles.

Can electric propulsion help to reduce air pollution from urban freight transport in a cost-effective way? Case study of Copenhagen
Municipality
72
Potential impact of cost factors not included in calculation of difference in cost of vehicles
Purchase and fuel costs were only analysed due to data scarcity. Therefore, this section tries to
discuss potential impact on the total cost of cost factors not taken into account: maintenance cost,
labour cost, resale value, battery cost and insurance cost.
a) Maintenance cost
Data for difference in maintenance costs between electric and conventional freight vehicle were not
available for Copenhagen Municipality (shortage of data gathered from surveys with companies
utilizing electric freight vehicles in Copenhagen Municipality). It was possible to estimate these costs
on the basis of % share of maintenance costs in total cost of vehicle, but this data was only available
for conventional vehicle. Therefore, it was not possible to find out what is a maintenance cost per km
for electric vehicle, and further what would be a difference between maintenance cost of electric
and conventional vehicle. There are contradictory opinions about differences in maintenance costs.
On the one hand, some researchers argue that maintenance costs of electric vehicles are lower than
of vehicles with internal combustion engines, since the electric engine consists of fewer moving parts
and therefore it is less exposed to break downs (E-MOBILITY NSR 2013 A). In estimation of cost
difference between electric and conventional light duty trucks, B. A. Davis and Miguel A. Figliozzi also
assumed maintenance cost of electric vehicles to be lower: 0,16$/km compared to 0,32$/km. On the
other hand, there are opinions such as this of director of Danish Association of Automotive
Manufacturers “SKAD”, who says that maybe electric vehicles break down rarely, but if they do then
the repair is extremely expensive: It must be taken into account, that it can occur to be impossible to
repair an electric vehicle, because costs of reparation will be high, so that the vehicle must be
demolished, since it is required by a Danish law to demolish a vehicle, if the reparation cost is higher
than 80% of vehicles’ value (PHONE-BASED INTERVIEW WITH THOMAS KREBS, DIRECTOR OF DANISH ASSOCIATION
OF AUTOMOTIVE MANUFACTURERS “SKAD”) (MOTOR-MAGASINET, 2012, P.16).
In the calculation performed within PIEK project in the Netherlands, maintenance costs proved to
account for a significant share of total operational costs (30% in the day time and 40% in the night
time). Since maintenance costs are calculated by multiplying travel time for by maintenance cost per
hour, it is possible that differences in these costs between electric and conventional vehicle are
significant (bearing in mind difference in a distance travelled by an electric and conventional freight
van: 143km-106km=37 km).
In the future, when sufficient data are available, it is important to calculate this cost to see the whole
picture of cost differences between electric and conventional vehicle.

Can electric propulsion help to reduce air pollution from urban freight transport in a cost-effective way? Case study of Copenhagen
Municipality
73
b) Labour cost
Labour cost failed to be estimated, because of the lack of information on relation of
loading/unloading activities time to the travel time per day. It was impossible to calculate reliably
labour cost based on the average wage per hour multiplied by travel time (both data were found for
Copenhagen), because this result would show much bigger difference between electric and
conventional vehicle, in favour of conventional vehicle, than it is in reality, when both travel time and
loading/unloading time is included. It is because time of loading/unloading goods is the same for
conventional and electric vehicle, while travel time is much higher for electric vehicle (due to
diminished payload). Moreover, loading/unloading activities in cities account for a big share of total
time of delivery, since distance travelled are small and receivers are densely distributed on the route.
Author is aware, that labour cost accounts for a significant share of total cost of vehicle (e.g. in the
calculation performed in the PIEK project in the Netherlands, 30% of operational costs and 40% of
operational costs during night) and therefore, it should be necessarily included into calculation when
missing data are accessible.
When it comes to both labour and maintenance costs, it should be considered, that in order to
provide companies interested in electric freight vehicles with reliable information on these costs, it
seems to be that specific for an individual company load factor, thus maintenance and labour costs
should be taken into account. It was very hard to calculate an average value for them, since their
load factor is very branch and company-specific. It is because additional kilometres needed to be
travelled with electric vehicle can vary importantly from company to company, since each of them
transports different type of goods and has different load factor.
c) Resale value
Mercedes Daimler, which leases electric freight vans in Copenhagen, assumes the resale value to be
zero – cars are planned to be demolished after 4 years. On the other hand in research focused on
costs of electric light trucks, the resale value was assumed to be a 20% after 10 years of utilization –
assumption used also for conventional vehicles. Nevertheless, this assumption was followed by a
comment that there is a lot of uncertainty about value of this cost, since electric vehicles are very
new on the market (B. A. DAVIS, M. FIGLIOZZI 2012 P.18).
d) Battery replacement cost
This cost was not taken into account in this research, following assumption used by research
performed on electric light duty trucks, that a battery replacement must takes place after 241 401

Can electric propulsion help to reduce air pollution from urban freight transport in a cost-effective way? Case study of Copenhagen
Municipality
74
km (150 000 miles) driven. Since distance travelled by electric freight van in Copenhagen was still
close to the estimated in USA value, 257 400 DKK (32 175 per year), battery was assumed not to be
replaced before 8 years usage.
However if battery is needed to be replaced, additional high cost of around 25% of purchase price of
a vehicle must be considered. It is hard to decide if this cost should be included in the calculation of
the total cost, since findings from their real-life usage are ambiguous. However, that what can be
said clearly, is that batteries’ technology developing rapidly, so lifetime of batteries. This can
suggest, that it is better to wait little bit longer with buying an electric vehicle, but it can be also
suggest, that company can gain more on a green image now, when very few companies finds electric
vehicles suitable for their businesses, while in the future much more can find it attractive.
Battery replacement cost can be also reduced by using it after its power capacity was reduced too
much to be used in a vehicle: it can be used as energy backup at home or sold. IKEA is one of
companies which already started purchasing partially used batteries as energy storage (E-MOBILITY
NSR 2013 B).
e) Cost of insurance
Insurance for electric vehicles can be 40% cheaper than for conventional vehicles. One of the
insurance companies in Copenhagen gives such an offer (TRYG 2013). Certainly, in other insurance
companies insurance price can be the same for electric and conventional vehicle.
f) Cost of CO2 emission (in case of Copenhagen fee for entering environmental zone was calculated)
Filter installation costs is 40 000-50 000 DKK (COPENHAGEN MUNICIPALITY H 2013)However, it is
necessary to install it only for vehicle above 3.5 t, and since this research focuses only on freight vans
this cost is not counted.
5.2 Consideration of difference in cost of pollution
As learned from the previous chapters of this paper, particle matter is responsible for majority of
costs of pollution produced from transport in cities, also in Copenhagen Municipality. Particle matter
cost of emission from freight diesel vans in Copenhagen per km is 32 higher than SO2 emission and
3,5 times higher than NOx emission (see Table 9). If cost per kg was compared, then cost of emission
of SO2 is even higher than of PM 2.5 (239 DKK per kg of SO2, 215 DKK per kg of PM 2.5 and 67 DKK
per kg of NOx, DMU 2010, P.41). This allow to reason, that particle matter plays a major role in
generation of costs of pollution because of very high levels of its emission compared to other
pollutants. This thesis can be acknowledged, when emission from conventional and electric vehicle

Can electric propulsion help to reduce air pollution from urban freight transport in a cost-effective way? Case study of Copenhagen
Municipality
75
[g/km] presented in the introductory chapter is compared: diesel vehicle emits 92% more PM2.5:
0,0250 PM2.5 g/km while electric vehicle only 0,002PM2.5 g/km (data for Denmark for passenger
diesel vehicle and for electric passenger vehicle; for freight electric vehicle can differ, but since
difference are so high it can be assumed that this relation is also real for these vehicles). This is why
difference in cost of pollution produced by an electric and diesel freight vehicle are so high in
Copenhagen Municipality: 0,41 [DKK/km] compared to 0,053 [DKK/km].When it comes to cost of
other main cost generating pollutants in Copenhagen, NOx and SO2, NOx can be roughly estimated
to decrease by 20% and SO2 to increase by 60% compared to conventional freight van (again data
for costs generated by an electric vehicle in Denmark with data for freight vans in Copenhagen
Municipality).
Level of CO2 emission produced by freight vans in Copenhagen can be decreased by 50% through
electric freight vans (on the basis of data for whole Denmark). Data on cost of CO2 emission were not
available, neither for Copenhagen nor for Denmark, and therefore this costs was not calculated.
However, if information presented in the theoretical chapters are recalled, nowadays cost of CO2
emission (more precisely: CO2 equivalent) is very hard to estimate, but it is considered as a main
future driver of costs of pollution. Firstly, due to costs of upcoming climate changes and secondly
because except CO2, emission of all other pollutants generated by transport in Denmark is steadily
decreasing due to more and more restrictive EU standards (as shown in figure 2 and figure 11).
Therefore, even though it is possible that CO2 currently does not create a big cost for Copenhagen
Municipality, policies directed on its reduction should be undertaken. Of course, this advice does not
go in line with cost-effectiveness principle of reduction of air pollution: if costs of CO2 are unknown,
then how can we assess cost-effectiveness of a tool which significantly reduces its emission? In case
of electric freight vans in Copenhagen Municipality it occurred to be quite simple, since cost of
pollution reduced is 2,5 times higher than cost of a vehicle. However, when cost-effectiveness of
different tools is compared, then tool which is more cost-effective in reduction of local pollutants,
but reduces more emission of CO2 is undermined. Therefore, a golden mean could be to balance
criteria of cost-effectiveness and reduction of CO2 emission: tool is reducing only a slightly smaller
level of costs of pollution, but it also reduced CO2 emission. Additional criterion could be that it is
also only slightly more expensive, if cost-effectiveness of reduction of air pollution assessment is to
be kept. This additional criterion could be abandoned, but in that case, it will not be any longer cost-
effectiveness assessment. When it comes to freight vehicles, it seems to be a necessary criterion,
since costs are borne by many companies, and therefore significantly increasing taxation on
conventional vehicles could importantly harm the economic performance of Copenhagen
Municipality. It can be imagined, that decreases in fees for cleaner vehicles, instead of increases in

Can electric propulsion help to reduce air pollution from urban freight transport in a cost-effective way? Case study of Copenhagen
Municipality
76
fees for conventional vehicles will not decrease economic performance of the whole city, but still it
will affect competition on the goods deliveries market, just to smaller and possibly positive extend.
5.3 Discussion of potential impact of night distribution on the increased
competitiveness and cost-effectiveness of reduction of air pollution through
electric freight vans.
Table 25 Difference in fuel costs per year between Mercedes Benz Vito E-cell and Mercedes Benz
Vito shows that night operation actually decreases competitiveness of Mercedes Benz Vito E-Cell.
Mercedes Benz Vito E-cell is cheaper than Mercedes Benz Vito only when utilised 8 years and tax
deduction is included, while in the day time it was for more than 5 years of utilisation. Regarding
Renault Kangoo Z. E., due to shift to night distribution it is more expensive than Renault Kangoo in all
options. Cost factors which are responsible for an increased competitiveness are reduced differences
in maintenance and labour cost, what is caused by a decreased travel time. Percentage difference in
costs are the same for day and night time distribution, but the nominal differences are smaller, since
the both costs drop in the night shift. This can be argued as an increased competitiveness, since
companies will be probably more willing to pay more for an electric vehicle than for conventional
vehicle, when it nominally costs less in the night time than in the day time. Another factor which may
appear, is that since costs of vehicle operation drop in the night shift in general, companies are left
with an additional (temporarily free) financial resources, which they might invest into more
expensive but creating green image vehicle (potential advantage over competitors).
Fuel cost is a cost factor which difference increases in the night shift, because the difference between
electricity and fuel cost per km becomes less important during night – energy consumption per km
falls, so does importance of cheaper fuel and more energy efficient electric engine. On the basis of
Table 27, it can be argued, that the positive difference in fuel cost, both in the day and night time
operation, is still too small to balance the total cost difference between Mercedes Benz Vito E-cell
and Mercedes Benz Vito diesel. Moreover, this difference is significant: -12545 DKK and 7790 DKK
per year, for day and night time operation respectively. Situation can change in favour of electric
vehicles if noise reducing retrofits of vehicles are additionally included in calculation. Difference in
cost of utilisation of a conventional and electric van in the night time is 4 755 DKK higher for electric
van and this is almost the same as the avoided cost of retrofits per year if electric van instead of
conventional is deployed (4678 DKK per year - cost of gas propelled engine).
Summing up, competitiveness of electric freight vans can increase if switched to night distribution.
However, it must be also borne in mind that this increase will be very small, if engine replacement in

Can electric propulsion help to reduce air pollution from urban freight transport in a cost-effective way? Case study of Copenhagen
Municipality
77
diesel vehicles is not obligatory, what can happen in Copenhagen Municipality, since noise limits are
currently equal for day and night time there. However, it can be expected, that if a considerable
number of vehicles would switch to night time operation, especially in the residential
neighbourhoods, noise limits will be tightened.
Besides of an increased competitiveness of electric vehicles, night distribution creates also additional
benefits for society in terms of decreased congestion, thus emission and noise during day time.
Therefore, if public authorities want to support electric vehicles, it is more beneficial for society
(meaning primarily: for health of inhabitants) to support these operating during nights.
Night distribution will not help to notably increase competitiveness of electric freight vans against
conventional. However, in general, if electric vehicles deployed for night distribution, cost of their
utilization will drop due to lower congestion, the same as for conventional vehicles. This result can be
potentially used as an incentive for companies to purchase electric vehicles: if only vehicles below
specified emission are allowed to operate on nights.
5.4 Beyond cost-effectiveness: how much does it matter that electric freight
vans can reduce pollution in a cost-effective way?
5.4.1 How much of the total air pollution present in Copenhagen Municipality can be
reduced by electric freight vans?
The most pollution in Copenhagen is generated by personal vehicles (70%) and therefore main focus
in this municipality should be (and is) put on reduction of air pollution from this mode of transport.
One of tools for reduction of air pollution , public transport in form of buses, is a very effective one:
buses generates 8 times more pollution per km travelled, but can transport at least 20 times more
passengers than passenger vehicles (assuming that there is 5 people in one passenger car, while it is
often 1-2 people)28.
Second the most polluting transport mode in Copenhagen are freight vans, generating 22% of air
pollution. Therefore, focus of public authorities should be also directed in this field; one of the tools
which might be considered are freight electric vans, since they proved to be cost-effective in
reduction of air pollution. It is even more important, since tool for reduction of air pollution which
works in transport of people, using buses (“bigger vehicles”), does not work in goods transportation:
truck generates almost 4 times more pollution per km travelled, but its payload is only 3-4 times
higher. Though, it should be also kept in mind, that only big changes in share of electric vehicles can
28 The most effective transport mode in reduction of air pollution, bicycles, is not discussed here.

Can electric propulsion help to reduce air pollution from urban freight transport in a cost-effective way? Case study of Copenhagen
Municipality
78
cause a significant reduction of costs of air pollution: 10% electric freight vans in traffic flow in
Copenhagen Municipality can cause 8% of decrease of costs of pollution produced by this mode. 50%
reduction can be achieved with 60% freight vans’ replacement with electric ones.
However, it is also visible from data for Copenhagen Municipality, that much higher cost reduction
could be attained from freight transport if trucks are switched to cleaner fuels; they are the most
polluting vehicles when their number in the total fleet is not taken into account, but they constitute
to only 1,1% of the total fleet of vehicles (however, it should be kept in mind, that difference in cost
of pollution produced by freight vans and trucks comes from the difference in payload – more
pollution is produced but also more good are transported).
5.4.2 How significant is a cost of a vehicle in the total cost of goods deliveries activities?
In the other words this question could be posed as: how important is this additional cost for
companies? Cost composition for Copenhagen and Denmark were not found, but in USA, goods
movement accounts for 60% of total cost of deliveries, while the rest is covered by cost of storage of
goods – (38%) and administrative costs (2%). Transportation costs cover also costs of fees and
tickets, but still it seems to be possible to argue, that vehicle cost plays a very important role in total
costs of delivery activities (M. HESSE, J.-P. RODRIGUE 2004, P.180).
In the current research, difference in cost (purchase + fuel) between electric and conventional
vehicle in the most optimistic scenario (Mercedes Benz Vito E-cell is operated, and its life cycle time
is 8 years) was estimated to account for 15% of costs (purchase + fuel) of Mercedes Benz Vito fuelled
with diesel when tax deduction is not included, and for 6% of costs if tax deduction is included. This
are certainly important costs for companies.
5.4.3 What is a cost-effectiveness of electric vehicle compared to other alternative fuels?
On the basis of information presented in the introductory chapter, it can be said, that electricity is
the most energy efficient propulsion compared to all other alternative fuels, and can reduce the
most of CO2 emission from several of them (ICE with first and second generation of bio-fuels, fuel
cells, hybrid, plug-in hybrid). It should be also noted, that electric vehicle is the most expensive from
all alternatively fuelled vehicles and the most importantly, it proved to be not cost-effective in
reduction of air pollution. Therefore, other solutions should be considered. It seems to be the best
not to decide which specific alternative technology to support, if their cost-effectiveness is similar,
unknown, or hard to predict in the near future. In this situation it is the best to decide to the market,
which tool will they use to reduce cost of pollution. This situation can be achieved through taxation
put on vehicles depending on the level of pollution emitted. Subsidy/ tax exemption is in general a

Can electric propulsion help to reduce air pollution from urban freight transport in a cost-effective way? Case study of Copenhagen
Municipality
79
less cost-effective tool and in the long term, when it is finished, there is a strong risk that
beneficiaries will go back to the vehicles used previously.
There are available many alternative approaches for reduction of air pollution from transport, as
shortly presented in introductory chapter. Reduction of emission does not need to take place in form
of reduction of emission per unit of fuel, but can be performed also in form of decrease a total
transport service demanded (such as urban consolidation centres) or decrease of fuel consumption
per unit of transport service (such as night distribution). However, consideration of cost-effectiveness
of alternative to electric vehicle tools is beyond timelines of this project. It was strongly expected,
that since electric freight vehicles are supported by public authorities in so many countries
worldwide, they must be a cost-effective tool for reduction of air pollution. Due to this expectation,
timelines of the project did not include space for comparison of cost-effectiveness of alternative
fuels.
Is it possible, that reduction of air pollution through passenger electric vehicles is more cost-
effective?
Before author started preparation of this paper, it was expected, bearing in mind that electricity cost
is twice lower than diesel fuel cost, that electric freight vans can actually be more competitive than
passenger vehicles, since operational costs accounts for a big part of total cost of freight vehicles.
Nevertheless, if a case of France is taken as an example, K. Funk&A.Rabl found out that passenger
electric vehicles is 30-40% more expensive than conventional passenger vehicle (K. FUNK, A. RABL
199929). If this is compared with difference counted for freight vans, it occurs to be much lower: 30-
40% compared to 300%. This shows, that passenger vehicle can be actually a more cost-effective tool
for reduction of air pollution than freight vans in Copenhagen Municipality.
Even though difference between electric and conventional passenger electric vehicles are much
smaller than for freight ones, sales do not boost. It is for the commonly known reason: range of
electric vehicles is small, and since passenger vehicles are not only used for small distances, within
the city, it is simply not sufficient to meet their demand.
29
Findings from this research are quite old, but knowing that price of electric vehicle decreased significantly from the last decade, it can be assumed that this result if incorrect can only show lower difference between electric and conventional passenger vehicle.

Can electric propulsion help to reduce air pollution from urban freight transport in a cost-effective way? Case study of Copenhagen
Municipality
80
6. Conclusions
RQ1: Are electric vans used for urban goods distribution a cost-effective tool for reduction of air
pollution in cities? How can cost-effectiveness of electric vehicles be affected by deploying them
for night distribution?
No, electric freight vans proved to be not cost-effective, difference in costs of vehicles is higher than
reduced costs of pollution. They proved to be cost-effective only when tax exemption for registration
of electric vehicles was included.
Night distribution was not found able to decrease difference in costs of conventional and electric
vehicle. However, cost-effectiveness can be potentially positively affected, since night distribution
creates additional benefits for environment in form of reduced congestion, thus pollution generated
from conventional vehicles during day time.
RQ2: Is there a threshold share of electric freight vehicles above which cost effectiveness of their
deployment changes significantly?
Since electric vehicles is a relatively new and not widespread product on the market, it was not
possible to identify changes in cost of vehicle factors following an increased share of these vehicles in
the traffic flow. Secondly, it was also not possible to distinguish changes in marginal costs of pollution
followed by increasing share of electric vehicles – long time requiring and costly to gather data would
be needed to estimate this difference. Due to these obstacles thresholds were not identified.
However, in theory, such a threshold exists, and it is a situation, for which marginal reduction of
costs of pollution starts to decrease sharply from an already achieved, probably high, share of
electric vehicles in a traffic flow. This sharp decrease causes, that addition of next electric vehicles to
traffic flow is not cost-effective any more. Starting from that point, further public support for electric
vehicles’ users would be advised to be finalized.
Internal reflection: Which cost factors should be taken into account when total difference in cost of
electric and conventional vehicle is calculated and how choice of specific cost factors used in this
research could affected reliability of cost calculation?
Assumption made in this research significantly affected results: decreased payload causes increased
distance needed to be travelled, thus time to deliver the same amount of goods. Due to this, fuel
cost increases. However, when it comes to fuel cost, additional cost borne due to extended distance
travelled does not prevail over benefit of 50% cheaper fuel cost per km travelled: fuel costs are still

Can electric propulsion help to reduce air pollution from urban freight transport in a cost-effective way? Case study of Copenhagen
Municipality
81
lower, since electric freight vans needs to travel 30% longer distance. Additionally, assumption of an
increased distance needed to be travelled, could also negatively influence cost factors not included in
this research: maintenance and foremost labour cost, since they depend on travel time. Most
probably, electric freight vans would become even more less competitive if labour cost included,
especially in Denmark or other Western European countries, were labour costs are high.
Nevertheless, it can be perceived as realistic, that freight vehicle is not always fully loaded. In that
case, it is possible that electric vehicle does not necessarily have to travel more due to diminished
payload. However, even in this situation cost differences between electric and conventional vehicle
are only slightly smaller.
On the other hand, when goal is not to provide companies with information on costs, but to assess
cost-effectiveness, it seems to be possible to reason on the basis of majority of costs of a vehicle, so,
on the basis of purchase and fuel costs, as done in this research. It was possible to perform reliably
such comparison in this paper, mainly because difference between cost of pollution and cost of
vehicle were very high.
External reflection: how much lack of cost-effectiveness of electric freight vehicles matter?
Answer for the research question, if electric vehicles are a cost-effective tool in reduction of air
pollution, was crucial but not sufficient to decide, if electric vehicles is a good tool to reduce air
pollution in Copenhagen Municipality. To fully answer this question, cost-effectiveness of alternative
tools for reduction of air pollution should be also considered. If all other alternative tools are even
less cost-effective than electric vehicle, this solution could be still considered as a tool to apply. On
the other hand, if costs of pollution are lower than cost of an abatement tool, this additional costs
borne by companies are simply wasted. Therefore, not cost-effective solutions should be considered
only in case when pollution is a very severe problem in a specific city. One can imagine situation, that
costs generated by pollution are very high, but still cost of deployment of abatement tool are higher.
In that situation, it is possible that reduction simply must take place, does not matter the cost.
However, it is not a situation of electric vehicles in Copenhagen Municipality: costs of pollution are
over a dozen lower than cost of this abatement tool.
One thing for sure: if electric vehicles are much more expensive than other potential solutions for
reduction of air pollution, and they reduce not much less than other options, then these other
options should be considered instead. Therefore it is good decision of Copenhagen Municipality, that
besides of whole their interest in electric vehicles, they leave the choice to companies to decide
which alternative propulsion will they deploy, in order to enable Copenhagen to achieve a huge share
of 30-40% of alternatively fuelled freight vehicles in the next 12 years.

Can electric propulsion help to reduce air pollution from urban freight transport in a cost-effective way? Case study of Copenhagen
Municipality
82
How much pollution can be reduced from transport through technological changes?
In the end of this paper, author would like readers to forget for a moment, that electric vehicles
proved to be a not cost-effective tool for reduction of air pollution. Let us imagine future situation,
when electric vehicles or another alternative fuel are cost-effective, and consider to what extend
these tools can reduce pollution generated by transport and if this decrease of pollution would be
sufficient.
Another important question which should be posed, is if these radical solutions for reduction of air
pollution from transport can alone cause a significant reduction of air pollution in cities. Taking as an
example one of European metropolises, London, transportation activities account there for 80% of
total pollution generated. In this perspective, transport can be seen as an activity of a big chance for
reduction of air pollution in cities.
It seems to be, that technological change can be a sufficient tool for reduction of air pollution from
freight vehicles: both trucks and vans. It is because, taking case of Copenhagen Municipality, these
vehicles generate a significantly higher levels of pollution compared to other means of road transport
and they share in traffic is quite small. Therefore, reduction of their number is not a necessity if
technological changes are introduced. Further, their number cannot be simply reduced like it is with
passenger vehicles, which can be replaced with public transport; benefits coming from reduces
pollution due to smaller number of vehicles is offset by pollution created by a truck. The biggest
change can be made in passengers transport: it accounts for high majority of pollution generated by
urban transport. Electric vehicles, alternative fuels and stricter standards on emission from
conventionally fuelled vehicles can help to reduce pollution in cities, but it seems to be far not
sufficient in its reduction from transport of passengers. Passenger vehicle generates per km much
less pollution than one freight van, truck or a bus, hence the problem does not lie there. It comes
from the huge number of passenger vehicles on roads: if emission is counted for all of them together,
it occurs, that they are responsible for generation of high majority of pollution. This clearly shows,
that technological improvements are not sufficient to reduce majority of pollution when it comes to
passenger transport: number of passenger vehicles simply must decrease.
Electric vehicles have a potential to significantly reduce pollution, also carbon dioxide, which current
and future expected costs were not included in the calculation performed in this research. It is
possible, that future climate change costs will be dramatically high, and will exceed cost difference
between a conventional and electric vehicle. The other important argument for not waiting with
radical tools for greenhouse gases reduction is that their costs will most probably be impossible to

Can electric propulsion help to reduce air pollution from urban freight transport in a cost-effective way? Case study of Copenhagen
Municipality
83
reverse. Question which stays open is how much reduction of pollution is needed to avoid
apocalyptic future and how much is it reasonable to pay for it now? Answer for this question
depends mainly on scale of future climate changes which are currently very hard to forecast.
However, if it was assumed, that One can say, that it is not important, that companies have to bear a
high additional cost, since environment is most important value, and should be protected by any
price.

Can electric propulsion help to reduce air pollution from urban freight transport in a cost-effective way? Case study of Copenhagen
Municipality
84
7. References
all., W. S. (2012). Well-to-wheels life-cycle analysis of alternative fuels and vehicle technologies in
China. Energy Policy .
http://www.anchorvans.co.uk/volkswagen-specifications.php (2013).
B. A. Davis, M. A. (2012). A methodology to evaluate the competitiveness of electric delivery trucks .
Transportation Research Part E .
Banister, D. H. (2012). Transportfutures:Thinkingtheunthinkable. TransportPolicy http://dx.do
i.org/10.1016/j.tranpol.2012.07.005 , 1.
Bentzen, K. (2013). A director of Danish Association of Transport and Logistics Centres. (H. Przenioslo,
Interviewer)
BESTUFS. (2010). Quantification or urban freight environmental effects.
http://www.bestufs.net/download/BESTUFS_II/key_issuesII/BESTUF_Quantification_of_effects.pdf.
Better Place. (2013). Comparison of costs of an electric an conventional vehicle.
http://danmark.betterplace.com/priser/privatperson/.
Button, K. (2010). Transport Economics. p.165: Edward Elgar Publishing.
California Department of Transportation Office of Transportation Economics. (2013).
http://bca.transportationeconomics.org/benefits/vehicle-operating-cost/vehicle-operating-costs-
methodology.
CE Delft. (2008). Handbook on estimation of external costs in the transport sector.
Clever. (u.d.). https://www.clever.dk/nyheder/stor-besparelse-ved-koeb-af-elbil/.
Copenhagen Municipality A. (2013). CO2 neutral mobility. http://www.kk.dk/da/om-
kommunen/indsatsomraader-og-politikker/natur-miljoe-og-affald/klima/co2-neutral-
hovedstad/mobilitet.
Copenhagen Municipality B. (2013). City Logistik Projekt. http://citylogistik-kbh.dk/.
Copenhagen Municipality C. (2013). International projects for E-mobility. http://www.kk.dk/da/om-
kommunen/indsatsomraader-og-politikker/trafik-og-infrastruktur/elbiler/internationalt-samarbejde-
om-elbiler.
Copenhagen Municipality D. (2011). Green mobility strategy for Copenhagen Municipality.
Copenhagen: Copenhagen Municipality, The technical and environmental department.
Copenhagen Municipality E. (2013). http://www.miljozone.dk/vognmand_hvorfor.php..
Copenhagen Municipality F. (2012). KPH 2025 Climate Strategy. Copenhagen: Københavns Kommune
Teknik- og Miljøfovaltningen.

Can electric propulsion help to reduce air pollution from urban freight transport in a cost-effective way? Case study of Copenhagen
Municipality
85
Copenhagen Municipality G. (2012). Electric vehicles in Copenhagen Municipality.
http://referencelaboratoriet.dk/wp-content/uploads/2013/02/1-Elbiler-en-kommunes-
planl%C3%A6gning-og-overvejelser.pdf.
Copenhagen Municipality H. (2013). http://www.miljozone.dk/vognmand_sporgsmal.php.
COWI. (2010). Calculation of external cost from transport (Værdisætning af transportens eksterne
omkostningere). Kongens Lyngby: Raport prepared for Danish Ministry of Transport.
Daimler. (2013). http://www.daimler.com/dccom/0-5-1466472-1-1467155-1-0-0-1466827-0-1-8-
7163-0-0-0-0-0-0-0.html.
Danish Energy Networks. (2013). Emission of SO2 and NOx from energy production in Denmark.
http://energinet.dk/SiteCollectionDocuments/Danske%20dokumenter/Klimaogmiljo/Udvikling%20i%
20emissioner%20af%20SO2%20og%20NOx%20fra%201990%20til%202022.pdf.
Danish Ministry of Transport. (2010). TEMA 2010.
http://www.trm.dk/DA/Publikationer/2010/TEMA+2010.aspx.
Delft, C. (2008). Handbook on estimation of external costs in transport.
http://ec.europa.eu/transport/themes/sustainable/doc/2008_costs_handbook.pdf.
DCE (2006). EVA – a non-linear Eulerian approach for assessment .
http://www2.dmu.dk/Pub/EVA_artikel.pdf.
DMU A. (2010). EVA tool for Economic Valuation of Air Pollution.
http://www.dmu.dk/fileadmin/Resources/DMU/Samfund/EVA_LiseFrohn_110507.pdf.
DMU. (2010). Road pricing, Luftforurening og Eksternalitetomkostninger.
Dong Energy . (2013). Electricity prices in Denmark in april 2013.
E. Fridell, M. J. (2009). A tool for calculating external costs associated with transportation of goods.
Göteborg, Sweden, 2009: Chalmers University of Technology.
EA EnergiAnalyser. (2011). CO2-udledning fra fremtidens personbiler i Norden.
http://www.eof.dk/Aktuelt/Rapport-konklusioner.aspx.
Email conversation. (2013). http://www.dst.dk/pukora/epub/upload/16251/21dic.pdf.
E-mobility NSR . (2013). WP 7.3, http://e-mobility-nsr.eu/info-pool/.
Energi Styrelsen. (2011). Statistics for energy production and consumption in Denmark.
http://www.ens.dk/info/tal-kort/statistik-nogletal/nogletal/danske-nogletal.
EU Transport GHG. (2011). http://www.eutransportghg2050.eu/cms/the-contribution-of-transport-
to-ghg-emissions/.
European Commission. (p.8 2011). a http://ec.europa.eu/research/era/docs/en/investing-in-
research-european-commission-europe-2020-2010.pdf.

Can electric propulsion help to reduce air pollution from urban freight transport in a cost-effective way? Case study of Copenhagen
Municipality
86
European Commission B. (p.8 2011). Impact Assessment. Appendix to the White Paper. http://eur-
lex.europa.eu/LexUriServ/LexUriServ.do?uri=CELEX:52011DC0144:EN:NOT.
E-Wolf. (u.d.). http://www.ewolf-car.com/en/omegacargo/omegamini/technical-data.html.
E-Wolf A 2013. (u.d.). http://www.ewolf-car.com/en/omegacargo/omega13/technical-data.html.
FDT. E-mobility NSR WP 5.2 Report, http://e-mobility-nsr.eu/info-pool/.
Fiat. (2013). http://fiat-fiorino.electric.vehicle.tel/.
Ford specifications. (2013). http://www.anchorvans.co.uk/ford-specifications.php.
Goevaers, R. (1st. May 2013). (H. Przenioslo, Interviewer)
Hoje Taastrup Municipality 2013. (u.d.). http://www.elbiler.nu/index.php/om-elbilernu.
International Union of Railways&Community of European Railway and Infrastructure Companies.
(2011). External Transport Cost Calculator. http://ecocalc-test.ecotransit.org/tool.php.
Jensen, S. K. (2010). Road pricing, luftforurening og eksternalitetsomkostninger. Aarhus: DMU.
K. Funk, A. R. (1999). Electric versus conventional vehicles: social costs and benefits in France.
Transportation Research Part D , s. 406.
K. G. Tsita, P. A. (2012). Evaluation of alternative fuels for the Greek road transport sector. Energy
Policy .
K. Macharis, S. M. (2011). City Distribution and Urban Freight Transport. Multiple Perspectives.
Karina Funk, A. R. (1999). Electric versus conventional vehicles: social costs and benefits in France.
Transportation Research , 399.
M. Hesse, J.-P. R. (2004). The transport geography of logistics and freight distribution. Journal of
Transport Geography12 (2004) , s. 180.
Macharis, M. (2011). City Distribution and Urban Freight Transport: Multiple Perspectives. NECTAR.
Mercedes Benz. (u.d.).
http://www.mercedesbenz.co.za/content/south_africa/mpc/mpc_south_africa_website/en/home_
mpc/van/home/new_vans/models/vito_639/panel_van_/data/dimensions.html.
Mercedes Benz A. (2013). www.mbsprinterusa.com/sprinter/cargo-van/compare-competition.
Ministry of Environment of New Zeland. (2009). http://www.mfe.govt.nz/issues/air/breathe.
Most popular freight vans in Denmark in 2012. (2013).
http://www.leaseplan.dk/pu/da/person_varebiler?cookiesAccepted=false.
Motor-Magasinet. (nr. 13/2-15, April 2012). Doden der kribler i fingrene. s. 16.
Nijkamp. (1997).

Can electric propulsion help to reduce air pollution from urban freight transport in a cost-effective way? Case study of Copenhagen
Municipality
87
Parliamentary Assembly. Council of Europe. (1998).
http://assembly.coe.int/ASP/Doc/XrefViewHTML.asp?FileID=8607&Language=EN.
Marco Polo project. (2013). External cost calculator for Marco Polo freight transport proposals.
Hentet fra http://ftp.jrc.es/EURdoc/JRC81002.pdf.
Riley, G. (2012). Market failure - externalities. http://www.tutor2u.net/economics/revision-notes/a2-
micro-externalities-overview.html.
Shell. (2013). Diesel prices in Denmark in 2013. http://www.shell.dk/products-services/on-the-
road/fuels/fuel-price/current-prices.html.
SKAT. (2013). Hentet fra http://www.skat.dk/SKAT.aspx?oId=63&vId=0.
Statistikbanken. (2012). Fleet of vehicles by type of vehicle for 1st January 2012 (Bestanden af
koretojer efter omrade og koretojstype).
http://www.statistikbanken.dk/statbank5a/selectvarval/define.asp?PLanguage=0&subword=tabsel&
MainTable=BIL707&PXSId=111099&tablestyle=&ST=SD&buttons=0.
Statistiksbanken A. (2012).
http://www.ens.dk/DADK/INFO/TALOGKORT/STATISTIK_OG_NOEGLETAL/NOEGLETAL/SAMLET_ENE
RGIPRODUKTION_FORBRUG/Sider/Forside.aspx.
Statistiksbanken B . (2013). http://www.dst.dk/da/statistik/nyt/relateret.aspx?psi=42.
SUGAR . (2010). ppt, slides 46-47.
THE INTERNATIONAL COUNCIL ON CLEAN TRANSPORT. (2011). European Vehicle Market Statistics.
Washington DC: THE INTERNATIONAL COUNCIL ON CLEAN TRANSPORT.
Tryg insurance company. (2013). Hentet fra
http://www.tryg.dk/forsikringer/bilforsikring/elbiler.html.
W. Feng, M. A. (2012). An economic and technological analysis of the key factors affecting the
competitiveness of electric commercial vehicles: A case study from the USA market. Transportation
Research Part C .
WHO. (2005). Health Effects of Transport Related Air Pollution.
Wojjdyla, B. (2013). Should You Convert Your Car to Natural Gas?
http://www.popularmechanics.com/cars/how-to/maintenance/should-you-convert-your-car-to-
natural-gas.
World Bank . (2004). Reducing Air Pollution from Urban Transport. Washington: World Bank.
World Bank . (2005). Reducing Air Pollution from Urban Transport. Companion. Washington: World
Bank.

Can electric propulsion help to reduce air pollution from urban freight transport in a cost-effective way? Case study of Copenhagen
Municipality
88
8. Appendixes
8.1 Questionnaire with answers from a phone-based semi-structured
interview with Robert Goevaers on night distribution in the Netherlands
(PIEK project).
QUESTIONNAIRE FOR COMPARISON OF DAY AND NIGHT DISTRIBUTION
ADDITONAL INFORMATION CONCERNING DATA PRESENTED IN THE PROVIDED PRESENTATIONS OF
PIEK PROJECT
1. What is a distance in Rotterdam, which data is provided for (1035 km)? For how many vehicles this
distance is provided?
A: This is a distance travelled between inner city of Rotterdam and city depot [urban consolidation
centre]. It was counted for 11 round trips for 11 vehicles.
SIZE OF VEHICLES USED FOR NIGHT DISTRIBUTION IN THE NETHERLANDS
1. What size of vehicles was used for night distribution between Tilburg and Eindhoven/in
Rotterdam?
A: There were used exclusively 40 tonnes trucks.
2. Can you specify a share of vehicles below 3.5 tones gross weight (vans) used for night distribution
between Tilburg and Eindhoven/in Rotterdam (it does not have to be an exact share)?
A: It is zero percent. It is because it is not profitable to deliver goods in the night with small vehicles,
when the biggest, 40 tonnes trucks are allowed to enter the city. All night deliveries are performed
with 40 tonnes trucks. When it comes to electric freight vehicles they are simply too small to be
profitable to be deployed for night distribution, and as far as I know, there are no chances in the next
few years, that such big electric trucks will be developed. Therefore, I can see a business model for
electric freight vehicles only for day time distribution.
REGULATIONS CONCERNING NIGHT DISTRIBUTION IN THE NETHERLANDS
1. Is there any regulation in the Netherlands on the maximum allowed level of noise for the vehicles
driving during the night? Why vehicles need to have this noise decreasing equipment?
A: Noise limit for night time vehicle operation established for Rotterdam is 60dB.

Can electric propulsion help to reduce air pollution from urban freight transport in a cost-effective way? Case study of Copenhagen
Municipality
89
2. Is there a tax incentive for performing night distribution, such as subsidy for a purchase of silent
equipment, or a difference in a fee for entering the city by freight vehicle?
A: For three years trucks performing night distribution were exempted from tax, which accounted for
20% of higher costs. This tax exemption was hold, because a noise reducing equipment is required
for performing night distribution in the Netherlands. These costs are significant: 35 000 Euro for
noise reducing equipment for trailer and 20 000 Euro for replacement of diesel engine with a gas
engine. This second retrofit was only needed, when deliveries were to be performed in residential
areas, where noise limits are higher. However, currently trucks performing night distribution are not
longer exempted from tax, but they do not need it. It is a good business model.
COST OF INSTALLMENT OF NOISE REDUCING EQIPMENT/RETROFIT OF A VEHICLE AND LOADING
EQUIPMENT
1. What is a cost of noise reducing installation per truck?
A: Modification of trailer and engine. Modification of trailer costs 35 000 Euro and of engine 20 000
Euro.
3. Could you think about how much would it cost to install noise reducing equipment for vans (up to
3.5 tonnes)?
A: I do not have such information and I cannot estimate it.
4. Could you think about how much would it cost to install noise reducing equipment for electric
freight vehicles? How big the cost difference would be?
A: Electric vehicle is not a business case for night distribution, but conversion of diesel engine to gas
engine can be avoided.

8.2 Calculations of costs of night distribution for Rotterdam.
Source: SUGAR 2012, S.35.
