california state university, sacramento latino student access and success: research findings and...
TRANSCRIPT
California State University, Sacramento
Latino Student Access and Success:Research Findings and Policy Implications
Nancy ShulockInstitute for Higher Education Leadership & Policy
Presented at:NALEO Education Leadership Initiative: California Statewide Policy Institute on
Higher Education Access and SuccessManhattan Beach, CA
January 16, 2007

California State University, Sacramento
Key Points
1. The State context: • State needs must drive policy
• Lagging higher education performance is a concern for future competitiveness of California
• Racial/ethnic and regional gaps must be closed
2. Access has not translated into completion
3. Policy barriers/policy solutions
4. Implications for NALEO?

California State University, Sacramento
Part 1: The State Context
Higher Education Performance Challenges

California State University, Sacramento
Master Plan Lacks Statewide Focus
• Focused on institutions instead of the state and its people– Are we educating enough Californians?
• Access/Affordability/Quality– Success?– Needs of the workforce?
• Changes since 1960– Are UC and CSU shares still reasonable?– Is access still enough?

California State University, Sacramento
“State of Decline?”
• Performance problems at all stages of pipeline: – preparation, participation, completion
• Gaps across regions and race/ethnicity • Education levels, tax base projected to
decline if gaps remain
• NOT ABOUT BLAME• ABOUT EDUCATING CALIFORNIANS
California State University, Sacramento
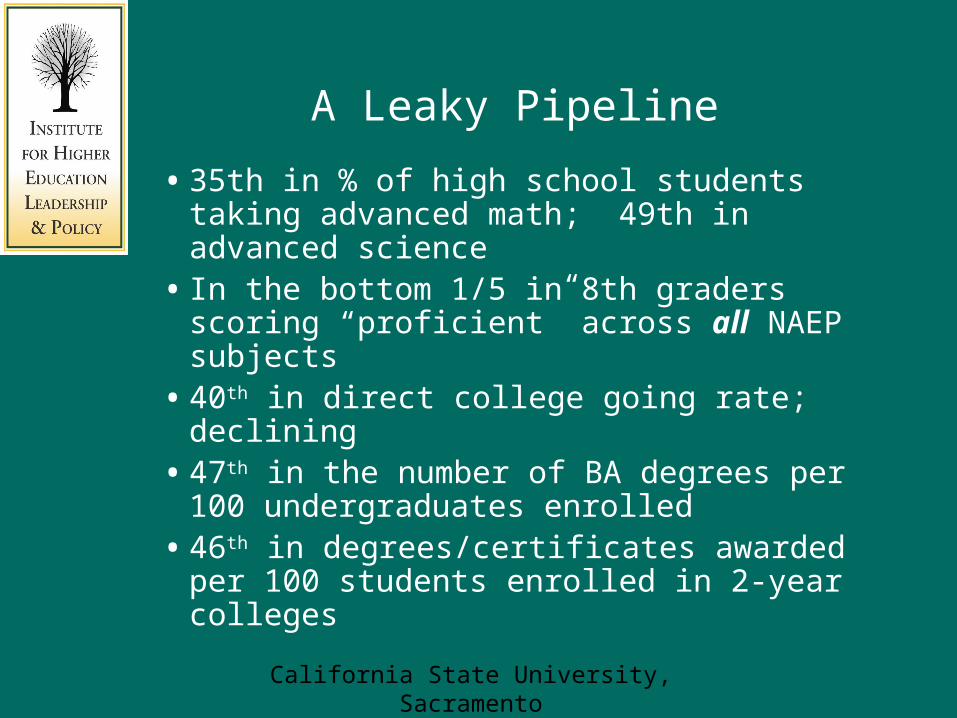
A Leaky Pipeline
• 35th in % of high school students taking advanced math; 49th in advanced science
• In the bottom 1/5 in 8th graders scoring “proficient” across all NAEP subjects
• 40th in direct college going rate; declining• 47th in the number of BA degrees per 100
undergraduates enrolled • 46th in degrees/certificates awarded per
100 students enrolled in 2-year colleges
California State University, Sacramento
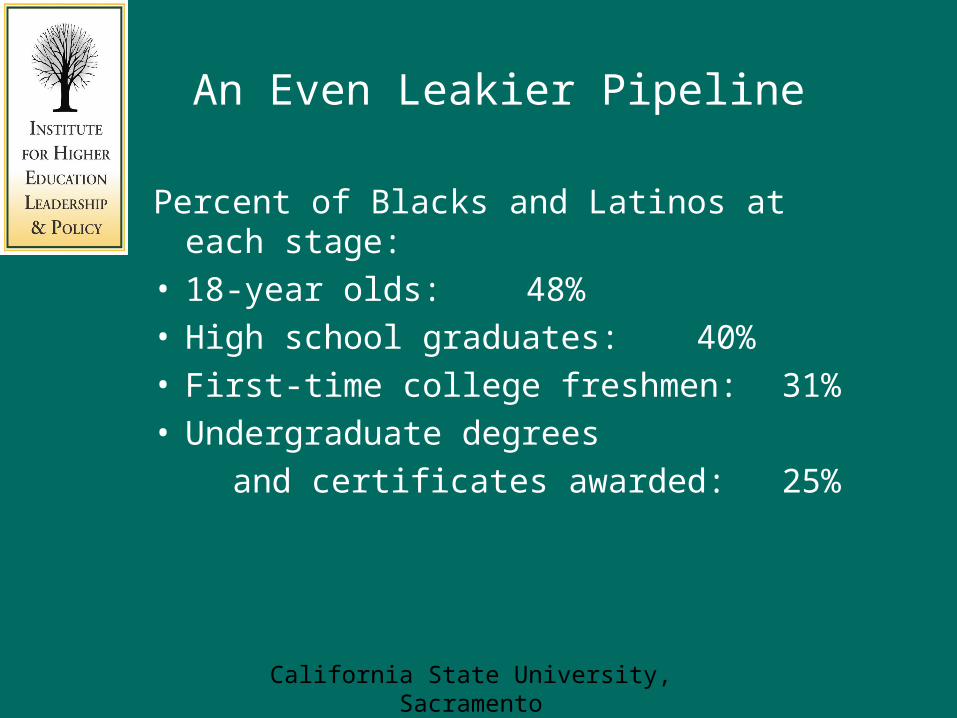
An Even Leakier Pipeline
Percent of Blacks and Latinos at each stage:• 18-year olds: 48%• High school graduates: 40%• First-time college freshmen: 31%• Undergraduate degrees
and certificates awarded: 25%

California State University, Sacramento
Racial/Ethnic Gaps in Preparation
Race/ethnicity Share of 8th Graders at or
Above “Proficient” in Math, 2005-06
Share of 8th Graders at or
Above “Proficient” in Language Arts,
2005-06
Number of Scores on SAT >=1000 and on ACT >=21 per
1,000 HS
Asian/Pacific Islander
43% 59% 414
White 38% 62% 288
Hispanic or Latino
18% 25% 79
Black 16% 27% 94
California State University, Sacramento
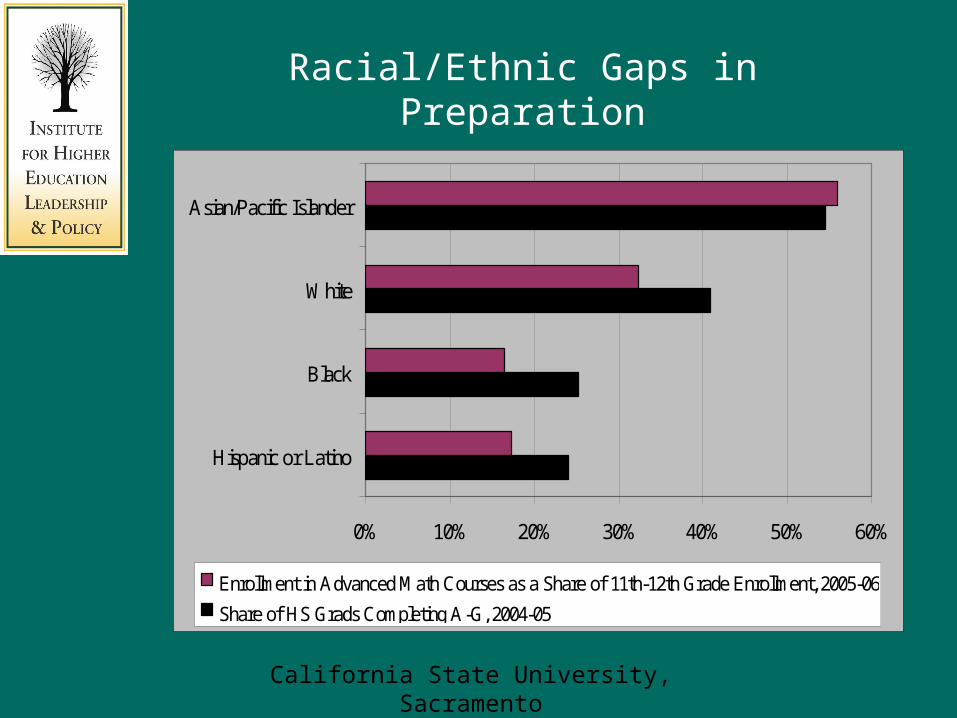
Racial/Ethnic Gaps in Preparation
0% 10% 20% 30% 40% 50% 60%
Hispanic or Latino
Black
White
Asian/Pacific Islander
Enrollment in Advanced Math Courses as a Share of 11th-12th Grade Enrollment, 2005-06
Share of HS Grads Completing A-G, 2004-05

California State University, Sacramento
Racial/Ethnic Gaps in Participation
0% 10% 20% 30% 40% 50% 60% 70% 80%
Asian-Pacific Islander
White
Black
Hispanic or Latino
Direct college-going rate 9th graders enrolling in college within 4 years

California State University, Sacramento
College Participation by Race/Ethnicity
Racial/Ethnic Group
Percent of 18-24 Year Olds in
College
Percent of Adults Ages 25+ in
College
Asian / Pacific Islander
60% 9.1%
White 43% 5.8%
Black 32% 8.8%
Latino 22% 5.4%Source: US Census 2000, Summary File 4, Table PCT63

California State University, Sacramento
White Asian Black LatinoMen:
UC
CSU
CCC
3.6%
5.8%
20.8%
10.9%
9.9%
29.0%
1.2%
3.5%
18.7%
0.9%
2.2%
13.5%
Women:
UC
CSU
CCC
4.2%
8.1%
25.8%
13.2%
11.6%
27.0%
2.1%
6.2%
23.6%
1.4%
4.2%
18.7%Source: Calculated based on enrollment data from California Postsecondary Education Commission and population data from California Department of Finance
Note: Rates do not reflect enrollment in private or out-of-state institutions
Undergraduate Participation Rates by Segment(Ages 17-24, Fall 2002)
California State University, Sacramento
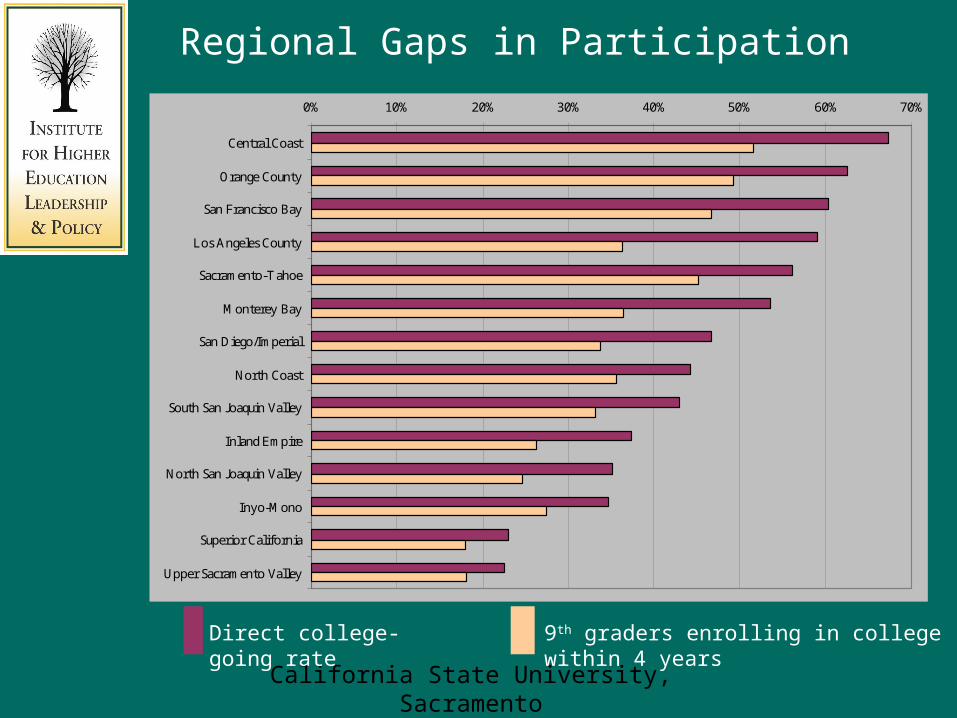
Regional Gaps in Participation
0% 10% 20% 30% 40% 50% 60% 70%
Central Coast
Orange County
San Francisco Bay
Los Angeles County
Sacramento-Tahoe
Monterey Bay
San Diego/Imperial
North Coast
South San Joaquin Valley
Inland Empire
North San Joaquin Valley
Inyo-Mono
Superior California
Upper Sacramento Valley
Direct college-going rate 9th graders enrolling in college within 4 years
California State University, Sacramento
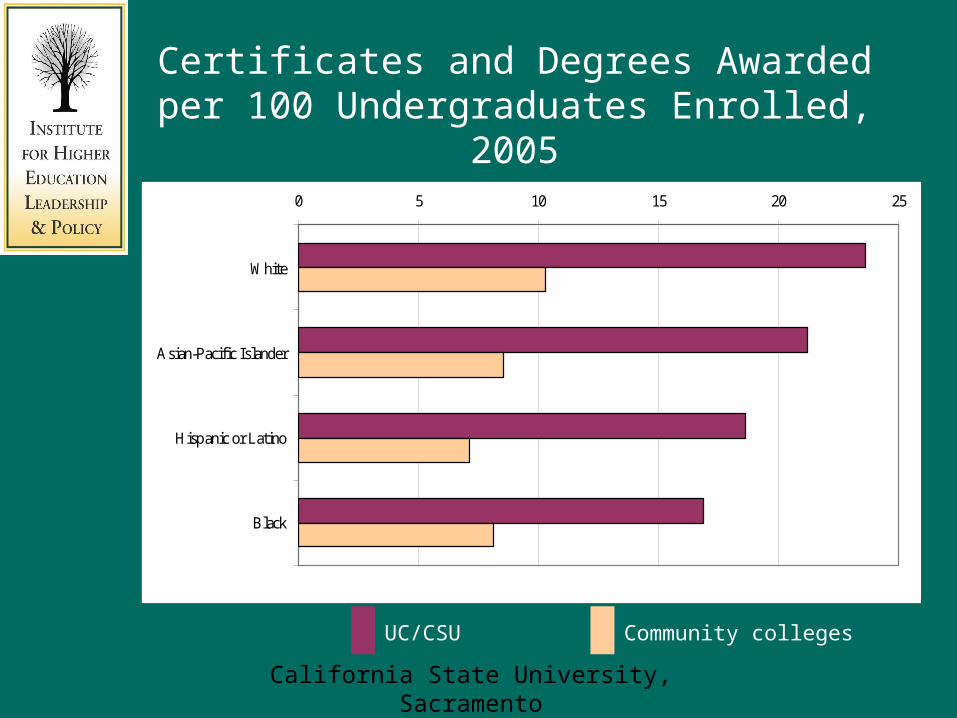
Certificates and Degrees Awarded per 100 Undergraduates Enrolled, 2005
0 5 10 15 20 25
White
Asian-Pacific Islander
Hispanic or Latino
Black
UC/CSU Community colleges

California State University, Sacramento
Racial/Ethnic Gaps in Educational Attainment and Racial/Ethnic Gaps in Educational Attainment and
Per Capita IncomePer Capita Income
0%
5%
10%
15%
20%
25%
30%
35%
40%
45%
50%
Asian-PacificIslander
White Black Hispanic or Latino
$-
$5,000
$10,000
$15,000
$20,000
$25,000
$30,000
$35,000
$40,000
Percent of Population Aged 25 and over With a Bachelor's Degree or Higher
Per Capita Income

California State University, Sacramento
Regional Gaps in Educational Attainment and Per Capita Income
0%
5%
10%
15%
20%
25%
30%
35%
40%
45%
50%
$-
$5,000
$10,000
$15,000
$20,000
$25,000
$30,000
$35,000
$40,000
Percent of Population Aged 25 to 64 With a Bachelor's Degree or Higher Per Capita Income

California State University, Sacramento
Race/Ethnic Gaps in Educational Attainment Race/Ethnic Gaps in Educational Attainment
Bode Poorly for California’s WorkforceBode Poorly for California’s Workforce
Percent of Adults Ages 25 to 64 With an Associates Degree or Higher
Projected Change in the Number of 25 to 64 Year Olds from 2000 to 2020
Whites
African-Americans
Hispanics,Latinos
Native Americans
Asians, Pac. Is.
40.2%
27.4%
12.4%
19.3%
52.9%
Whites
African-Americans
Hispanics,Latinos
Native Americans
Asians, Pac. Is.
-1,309,049
414,406
4,574,193
226,439
1,081,504
0-2,000,000 5,000,0000% 60%30%

California State University, Sacramento
California’s Per Capita Income will Fall Below California’s Per Capita Income will Fall Below
U.S. Average if Race/Ethnic Education Gaps RemainU.S. Average if Race/Ethnic Education Gaps Remain
124.0%
118.1%
108.6%
95.5%
70%
80%
90%
100%
110%
120%
130%
140%
1960 1980 2000 2020
US Average
Given the Current Disparities in Educational Attainment and Projected Growth by
Race/Ethnicity, California’s Income Will Fall Below the U.S Average by 2020 – Unless
Race/Ethnic Gaps are Closed

California State University, Sacramento
Part 2: Access is Not Enough
Access is Not Translating to Completion

California State University, Sacramento
Why We Care About Completion
• Growing knowledge economy is creating enormous demand for educated workers
• Impending retirement of the baby boomers• Projected shortfall of educated workers• Per capita income could fall below national
average in about 5 years• CCC serves 73% of public undergraduates –
must be path to upward mobility• 80% of Latino college students are in the CCC

California State University, Sacramento
Why It’s Been So Hard to Talk About Completion
• Multiple missions of community colleges• Data problems• Resignation: open enrollment = low
completion• Exclusive focus on access• Fear of blaming institutions

California State University, Sacramento
IHELP Research Agenda – Policy Matters!
Finance Study• Identify incentives in finance policies• Evaluate against goals• Conclusion: we are not buying the right thingEnrollment Study• Identify patterns of success• Link patterns to policies• Conclusion: policies do not encourage
successful patternsPolicy Brief (Summary of both)

California State University, Sacramento
Understanding “Multiple Missions” Helps Understand Completion Rates
Degree Seekers, 60%
Job Skills, 20%
Basic Skills, 4%
Personal Enrichment, 16%

California State University, Sacramento
Highest Completion among Degree-Seekers
Transfer, 18%
AA/AS, 4%
Certificate, 2%
No Completion, 76%
California State University, Sacramento
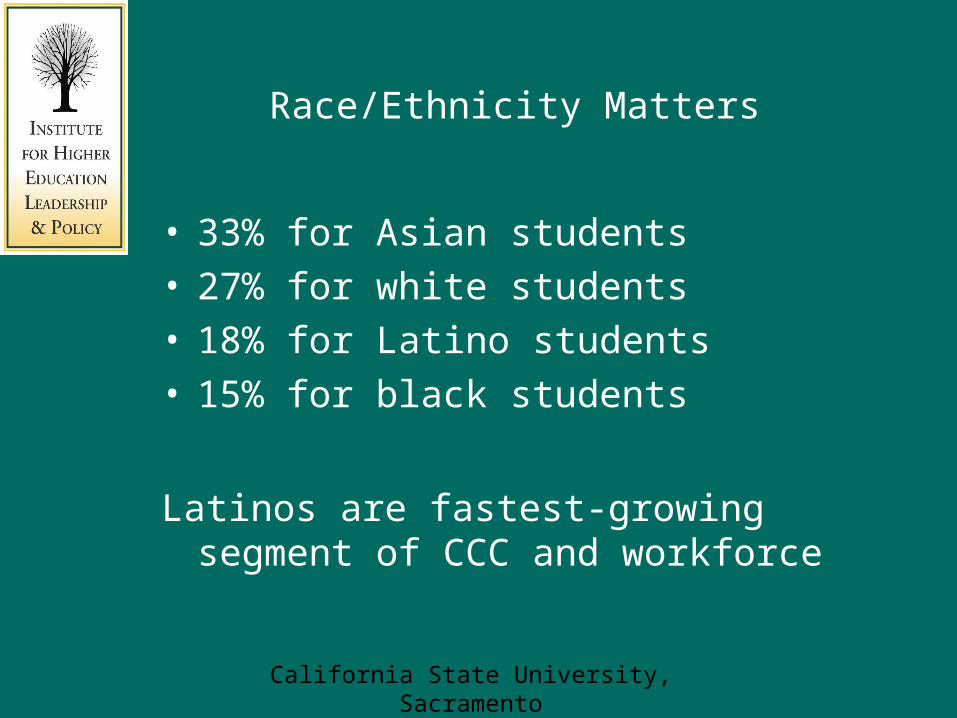
Race/Ethnicity Matters
• 33% for Asian students• 27% for white students• 18% for Latino students• 15% for black students
Latinos are fastest-growing segment of CCC and workforce

California State University, Sacramento
Age Matters
Rates of completion:• 27% for students age 17-19 at enrollment• 21% for students in their 20s• 18% for students in their 30s• 16% for students age 40 or older
CCC promote access for all despite increasing risk of never completing, as delay enrollment

California State University, Sacramento
Enrollment Patterns Matter
Figure 8: Certain Enrollment Patterns are Related to Higher Completion
0%5%
10%15%
20%25%30%
35%40%
45%50%
Full T imeMajority of
Terms
ContinuousEnrollment
OrientationCourse
Drop <20%Courses
Register Late<20% Courses
Perc
ent C
ompl
etin
g C
ert/D
egre
e/T
rans
fer
Followed Pattern Did not Follow Pattern
California State University, Sacramento
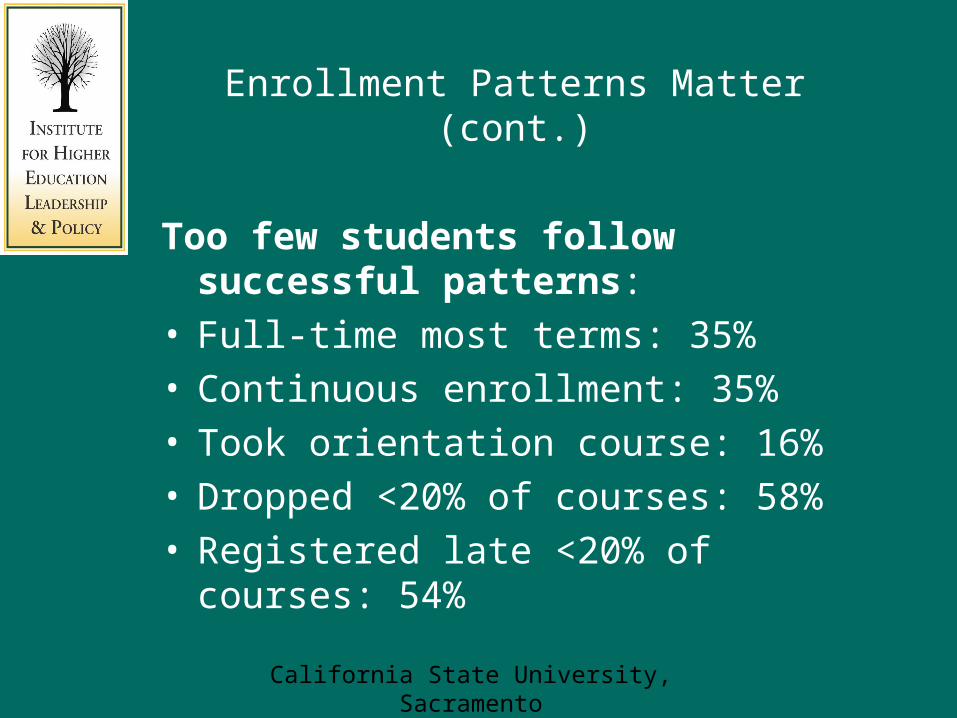
Enrollment Patterns Matter (cont.)
Too few students follow successful patterns:• Full-time most terms: 35%• Continuous enrollment: 35%• Took orientation course: 16%• Dropped <20% of courses: 58%• Registered late <20% of courses: 54%
California State University, Sacramento
Part 3: The Role of Policy
Identifying Policy Barriers to Completion
California State University, Sacramento
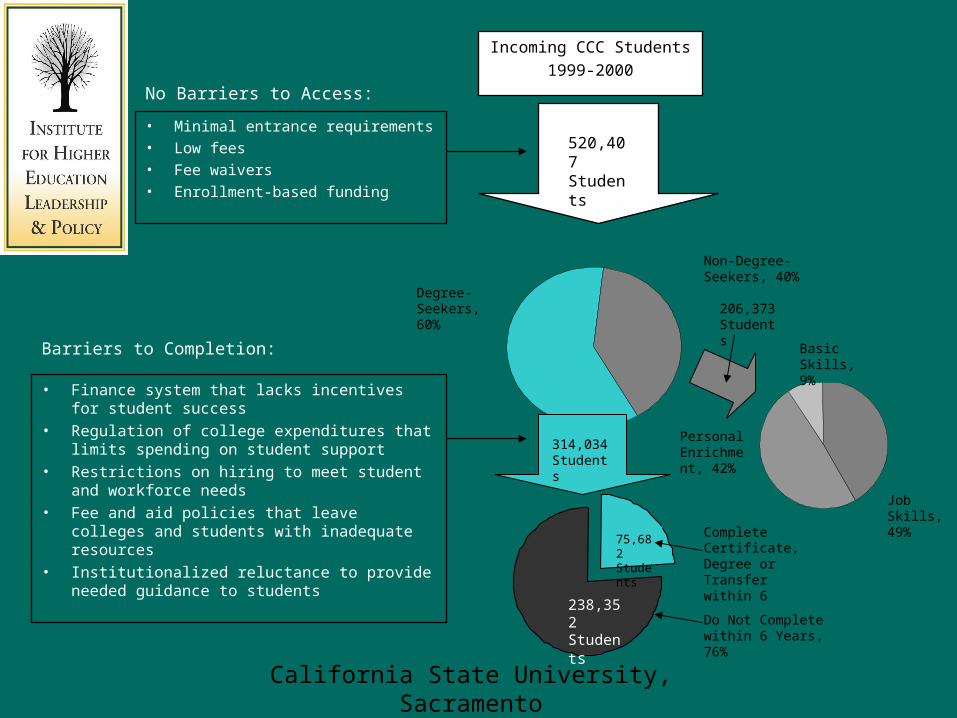
520,407 Students
• Minimal entrance requirements
• Low fees
• Fee waivers
• Enrollment-based funding
No Barriers to Access:
314,034 Students
206,373 Students
• Finance system that lacks incentives for student success
• Regulation of college expenditures that limits spending on student support
• Restrictions on hiring to meet student and workforce needs
• Fee and aid policies that leave colleges and students with inadequate resources
• Institutionalized reluctance to provide needed guidance to students
Barriers to Completion:
Incoming CCC Students
1999-2000
238,352 Students
75,682 Students
Non-Degree-Seekers, 40%
Degree-Seekers, 60%
Job Skills, 49%
Basic Skills, 9%
Personal Enrichment, 42%
Complete Certificate, Degree or Transfer within 6 Years, 24%
Do Not Complete within 6 Years, 76%
California State University, Sacramento
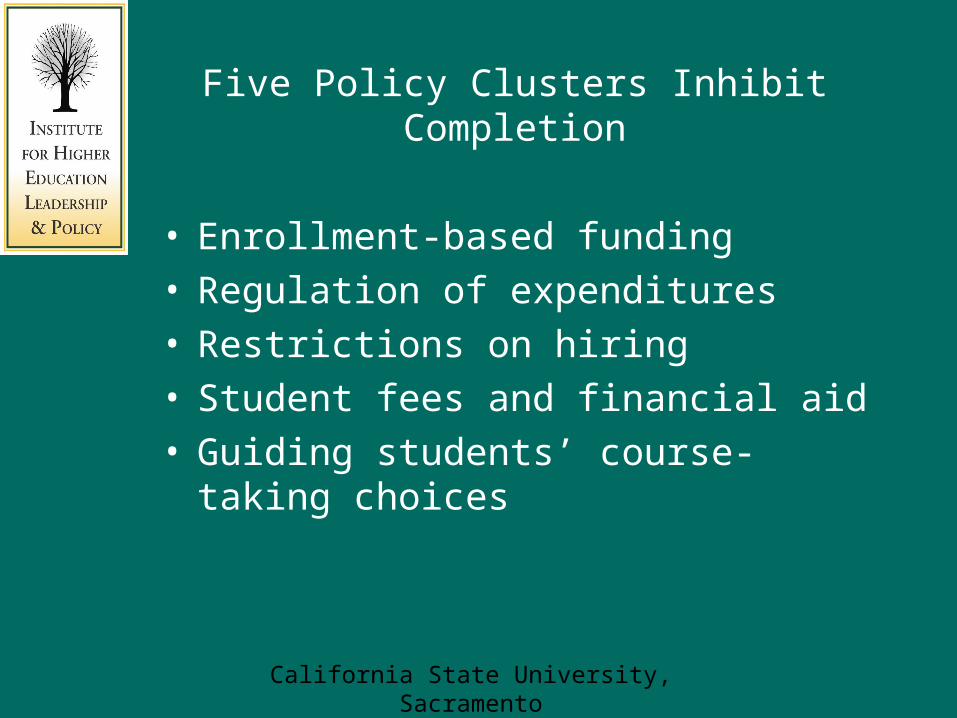
Five Policy Clusters Inhibit Completion
• Enrollment-based funding• Regulation of expenditures• Restrictions on hiring• Student fees and financial aid• Guiding students’ course-taking choices

California State University, Sacramento
Enrollment-based Funding
• Colleges receive most funds based on enrollment early in the term
• Leads to “FTE chase”• Buying college enrollments but not college
completion

California State University, Sacramento
Enrollment -based Funding
Encourages colleges to do the following to maximize funding: Minimize message about preparation Allow students to avoid assessment Make remedial education voluntary Allow students to register late for classes Postpone exams/assignments until after week 3 Minimize course pre-requisites
Allows students to do the following in response to college policies: Register late for courses Avoid basic skills assessment Avoid or delay enrolling in remedial courses Take college-level courses before prepared

California State University, Sacramento
Regulation of Expenditures
• Rigid regulation across all colleges on how to divide expenditures between classroom instruction and other programs and services
• Categorical programs – elaborate rules about how funds are spent, extensive documentation required
• Regulations reflect old model of public accountability – how resources are used rather than outcomes achieved
California State University, Sacramento
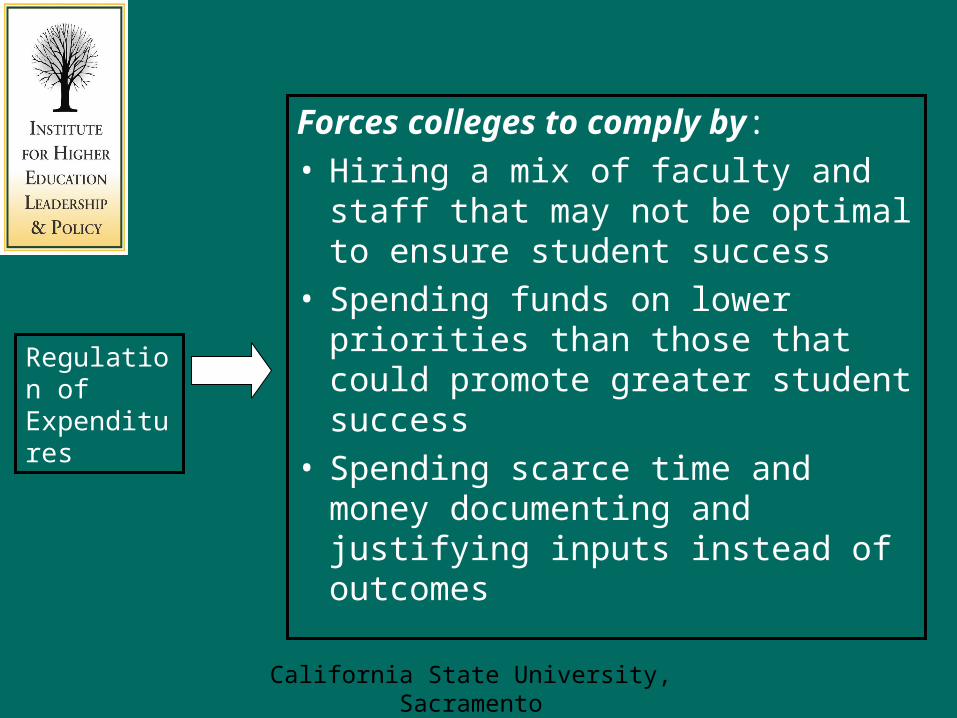
Forces colleges to comply by:• Hiring a mix of faculty and staff that
may not be optimal to ensure student success
• Spending funds on lower priorities than those that could promote greater student success
• Spending scarce time and money documenting and justifying inputs instead of outcomes
Regulation of Expenditures

California State University, Sacramento
Restrictions on Hiring
• Strict control on full-time/part-time faculty ratio• Limitations on workload and hiring of part-time
and temporary faculty• Union contract provisions• All well-intentioned efforts to ensure a corps of
full-time faculty essential to quality• Impact colleges’ ability to offer courses students
want that are needed by employers

California State University, Sacramento
Can force colleges to comply by:
• Basing faculty hiring decisions on arbitrary ratios rather than the needs of the students and the community
• Restricting course offerings that students want and that are needed by employers in the local communities
• Canceling classes that students need to graduate, if taught by part-timers
• Offering too few remedial classes if full-time faculty are not available
Restrictions on Hiring

California State University, Sacramento
Student Fees and Financial Aid• Very little fee revenue available to colleges –
leading to low per-student funding– Fees lowest in the nation by far
– Fees waived for 42% of units (29% of students)
– Fees do not add to college’s resource base
– Campus-based fees prohibited
• Fee policies not used to encourage successful course and enrollment choices
• Financial aid focused on fees/waivers, not affordability
– fees are only 5% to 7% of total cost
– Available financial aid left untapped

California State University, Sacramento
Encourages colleges to:
• Oppose fee increases, leading to below average revenues
• Focus less on federal aid than is desirable
Encourages students to do the following:
• Enroll in courses without much forethought
• Add and drop courses repeatedly without financial consequence
• Forgo available federal and state aid
• Work more hours and attend part-time more than necessary
Student fee and aid policy

California State University, Sacramento
Students’ Course-taking Choices
• Advising under-prepared students is vital for success– Assessment– Placement in appropriate remedial courses– Structuring proper course sequences
(prerequisites)– Advising and orientation
• CCC policies heavily influenced by MALDEF legal challenge from 1988 – much confusion and myth
• Student “right to fail” philosophy• National trend: “institutional responsibility to
help students succeed”

California State University, Sacramento
Encourage colleges to:• Avoid providing necessary guidance to
students• Avoid mandates relating to course-
takingEncourage students to:• Avoid getting assessed for basic skills
proficiency• Ignore recommended course placement• Take college-level courses before they
are prepared to succeed
Policies on Student course-taking choices

California State University, Sacramento
Removing Policy Barriers to Completion
• Change incentives in finance policies• Provide flexibility in spending• Provide flexibility in hiring• Develop affordability policies around total
costs – not just fees– Incentives for full-time and early enrollment
• Change institutional philosophy: help students succeed

California State University, Sacramento
Part 4: NALEO
What Are the Implications?
California State University, Sacramento
How Can NALEO Promote Student Success?
• Support new accountability efforts• Help communicate:
– Concerns about future of California– Concern is not blame– Policy is both cause and solution– Access is not enough– Funding: more needed but must spend more wisely
• Participate in reform efforts– Keep stakeholders focused on end result