calibration of in-flight maneuver performance for the...
TRANSCRIPT
American Institute of Aeronautics and Astronautics
1
Calibration of In-flight Maneuver Performance for the THEMIS and ARTEMIS Mission Spacecraft
Jeffrey E. Marchese1, Brandon D. Owens2, Daniel Cosgrove3, Sabine Frey4, and Manfred Bester5
Space Sciences Laboratory, University of California, Berkeley, CA 94720
We describe the development and details of in-flight calibration techniques used to obtain the required degree of accuracy for mission-required, small-scale trajectory adjustments. Using the dynamics data gathered from dozens of orbital-adjustment maneuvers previously conducted on the ARTEMIS and THEMIS spacecraft, the Space Sciences Laboratory (SSL) Flight Dynamics group has systematized a calibration process employing hill-climbing and grid searches for single segment and multi-segment maneuvers, respectively. This effort has resulted in the characterization of a nonlinear function of thruster performance scale factors and offsets to use in NASA Goddard’s GMAN software package for maneuver planning and reconstruction. To date, use of these factors has greatly reduced deviations between predicted and observed orbital state vector solutions and spin-rate changes following a sequence of orbit-raising maneuvers intended to result in a lunar gravitational capture of the ARTEMIS probes in early 2010.
Nomenclature A ( or B) maneuver = The first (or second) maneuver in a dual maneuver pair ∆SMA = The change in semi-major axis (SMA) as the result of a thrusting event ∆SMA diff = For a given maneuver, the difference in ∆SMA between the reconstructed maneuver and
the SMA change observed from tracking data ∆Spin = The change in spin-rate as the result of a thrusting event ∆Spin diff = For a given maneuver, the difference in ∆Spin between the reconstructed maneuver and
the SMA change observed from tracking data δ = Increment to calibration parameters as part of the minimization process _n pulses = Number of pulses executed in a specific maneuver
1,2Offset = Thrust differential offset applied to the 1st or 2nd jet _on time = Total thruster on-time for a specific maneuver
1,2_Thrust Net = Net thrust force applied to the 1st or 2nd jet
GMANThrust = GMAN-calculated thrust force _thrust duration = Duration of thrust for a maneuver pulse
TSF = Thrust scale factor
I. Introduction ime History of Events and Macroscale Interactions during Substorms1 (THEMIS), a NASA Medium Explorer (MIDEX) mission — consists of a constellation of five spin-stabilized spacecraft (launched in February 2007) to study magnetospheric phenomena2 leading to auroral phenomena. The mission entitled, “Acceleration,
Reconnection, Turbulence, and Electrodynamics of the Moon’s Interaction with the Sun”, (ARTEMIS) involves transferring the two outermost THEMIS spacecraft from their Earth orbits to lunar orbits, where these two spacecraft 1 Flight Dynamics Analyst, UCB/SSL, 7 Gauss Way, Berkeley, CA 94720-7450. 2 Flight Dynamics Analyst, UCB/SSL, 7 Gauss Way, Berkeley, CA 94720-7450, AIAA Member. 3 Navigation Lead, UCB/SSL, 7 Gauss Way, Berkeley, CA 94720-7450. 4 Mission Design Lead, UCB/SSL, 7 Gauss Way, Berkeley, CA 94720-7450. 5 Director of Operations, UCB/SSL, 7 Gauss Way, Berkeley, CA 94720-7450, AIAA Senior Member.
T
SpaceOps 2010 Conference<br> <b><i>Delivering on the Dream</b></i><br> <i>Hosted by NASA Mars25 - 30 April 2010, Huntsville, Alabama
AIAA 2010-2120
Copyright © 2010 by the American Institute of Aeronautics and Astronautics, Inc.The U.S. Government has a royalty-free license to exercise all rights under the copyright claimed herein for Governmental purposes.All other rights are reserved by the copyright owner.
American Institute of Aeronautics and Astronautics
2
will conduct measurements of the interaction of the Moon with the solar wind and its crustal magnetic fields. This transfer was initiated on July 21, 2009 and follows low-energy trajectories with Earth and lunar gravity assists.
As part of mission planning for ARTEMIS, the project team is planning for small-scale trajectory control and station-keeping maneuvers which are required to direct the spacecraft through the extensive lunar approach trajectories and Lissajous-orbits3,4,5. These small-scale orbit corrections require much higher degrees of accuracy and precision than those previously required for THEMIS. In addition, we recognized that having these calibrations for the three remaining Earth-orbiting spacecraft participating in the extension to the THEMIS mission — called THEMIS-Low — would help to further systematize mission design activities.
This paper documents the development and execution of the calibration process used during the THEMIS and ARTEMIS missions. The next section provides some additional background information and also describes the scope of this work. Only specific types of maneuvers were considered for the initial calibration effort described herein. However, the methods described can be extended to other maneuver types. The third section, Methods details the maneuver targeting and the calibration processes. The Application section details the integration of the calibration process into flight dynamics operations and the role of calibration in the ARTEMIS mission. The data gathered to date is presented in the Results section, along with some remarks. A Future Work section provides a discussion of calibration-related topics for future consideration. The Conclusion section brings the paper to a close. There is also an Appendix with details of the curve fitting metrics used in this work.
II. Background and Scope The spacecraft for the missions discussed in this paper have been designated 'P1' through 'P5', where the number
indicates the length of orbital semi-major axis (SMA) during the THEMIS mission, in inverse fashion: spacecraft P1 maintained the orbit with the largest SMA, spacecraft P5 had the smallest. The ARTEMIS mission will employ spacecraft P1 and P2. Spacecraft P3, P4, and P5 will remain in Earth orbit for the THEMIS-Low mission.
During the THEMIS mission, the spacecraft underwent several transformations with regard to physical configuration involving extensions of instrument booms and antennae. Each specific phase is denoted as a deploy phase. This paper focuses only on maneuvers during the current and final deployment phase which features full extension of all spacecraft devices, instrument booms and antennae.
Between August 2007 and June 2009, a total of 137 maneuver operations were conducted with the spacecraft in the fully-deployed configuration. A maneuver operation is defined by one or more thrusting events required to complete a specified objective, such as increasing apogee. Each event employs thrusters from one of two groups: two tangential (or radial) jets or two axial jets. Our calibrations have only been performed on the tangential thrusters in the context of changing the SMA—known as a side-thrust. The ARTEMIS mission will employ this type of thrust event to a much greater degree than other thrust types.
Typically, maneuver operations with sequences of combined events provide no opportunity for orbit state determination between events. Due to the resulting difficulty with resolving the specific orbit-perturbing effects of each event in the sequence, our initial calibration efforts were focused on maneuver operations with single side-thrust events.
This paper narrows its focus further, concentrating on three of the five THEMIS constellation spacecraft, P1, P2, and P5. Spacecraft P3 and P4 have had significantly fewer maneuver operations which meet the above criteria along with one more — maneuver operations which changed SMA by more than 100 km. Small maneuvers (defined by this benchmark) have significantly more inherent execution error than the others, thus skewing comparison statistics.
III. Methods
A. Overview The THEMIS mission side-thrust maneuvers considered for the calibration process were exclusively in-plane
orbit changes, either changes to perigee (performed at apogee) or changes to apogee (performed at perigee). Consequently, these events were specifically intended to increase or decrease SMA. We found that we could tune two maneuver parameters to minimize the difference between the observed SMA and the reconstructed SMA. Here, reconstruction refers to a re-simulation of the maneuver using the telemetry-derived state information and is a component of our regular operational maneuver regimen. The two maneuver parameters of interest were the thrust scale factor — a scaling of the resultant thrust, as effected in our maneuver targeting software, and the thrust differential offset — an offset between the two tangential thrusters that takes into account the net force which [inadvertently] changes the spacecraft spin-rate.
American Institute of Aeronautics and Astronautics
3
B. Maneuver planning and execution Maneuver planning for the missions discussed in this paper is performed using SSL-developed software known
as the Mission Design Tool (MDT)6, which employs the General Maneuver Program (GMAN) — developed at NASA’s Goddard Space Flight Center (GSFC) as a government off-the-shelf software (GOTS) package7. Targeting accuracy guidelines for the THEMIS mission were intended to meet maneuver execution goals within 5%. These targets were routinely met using heuristic scaling inputs which took into account specific spacecraft performance characteristics from previous maneuvers. The calibration process was developed to further systematize performance scaling and to enable maneuver execution goals to be refined to less than 1%. Also, the ARTEMIS mission has requirements for targeting types outside the current capabilities of the MDT.
Maneuver operations are preceded by more than a month of planning that, using the MDT, develops, maintains, and executes a maneuver plan to meet the mission’s orbital requirements. Then, during a specific maneuver preparation phase, the spacecraft state parameters for the maneuver — including spacecraft attitude, spin-rate, fuel tank temperature, and fuel mass — are collected and an on-board commanding sequence (the command load or command sheet) is generated to execute the maneuver on the spacecraft8,9,10.
One additional set of spacecraft state parameters required by the MDT during maneuver preparation is the spacecraft position and velocity. These are obtained in the form of an orbit solution by the process of orbit determination (OD) which is generated using the Goddard Trajectory Determination System (GTDS)11, a NASA/GFSC GOTS software package, from tracking information which is continually gathered and stored on the systems in the mission operations center (MOC)12. This orbit solution becomes the reference initial condition for the maneuver plan.
Subsequent to the maneuver operation, the maneuver is reconstructed by executing GMAN using the actual temperatures, pressures, timing, and thrust direction, as derived from telemetry acquired during the maneuver. This reconstruction of the maneuver generates a final condition which is used as the input for generating the post-maneuver OD from early post-maneuver tracks.
The early post-maneuver ODs show significant variations in the spacecraft's orbit beyond what is observed during steady-state (unperturbed) operations. These variations diminish as more tracking information is acquired. Once the variations in the OD solutions reach a level consistent with the steady-state, a comparison can then be made between the planned maneuver performance and the observed maneuver performance.
The calibration process can then use this comparison — between the planned state using the actual spacecraft state parameters (the reconstruction) and the observed state — to optimize the values for thrust scale factor and thrust differential offset.
C. Side-thrust dynamics Due to the spinning characteristic of the spacecraft, a side-thrust
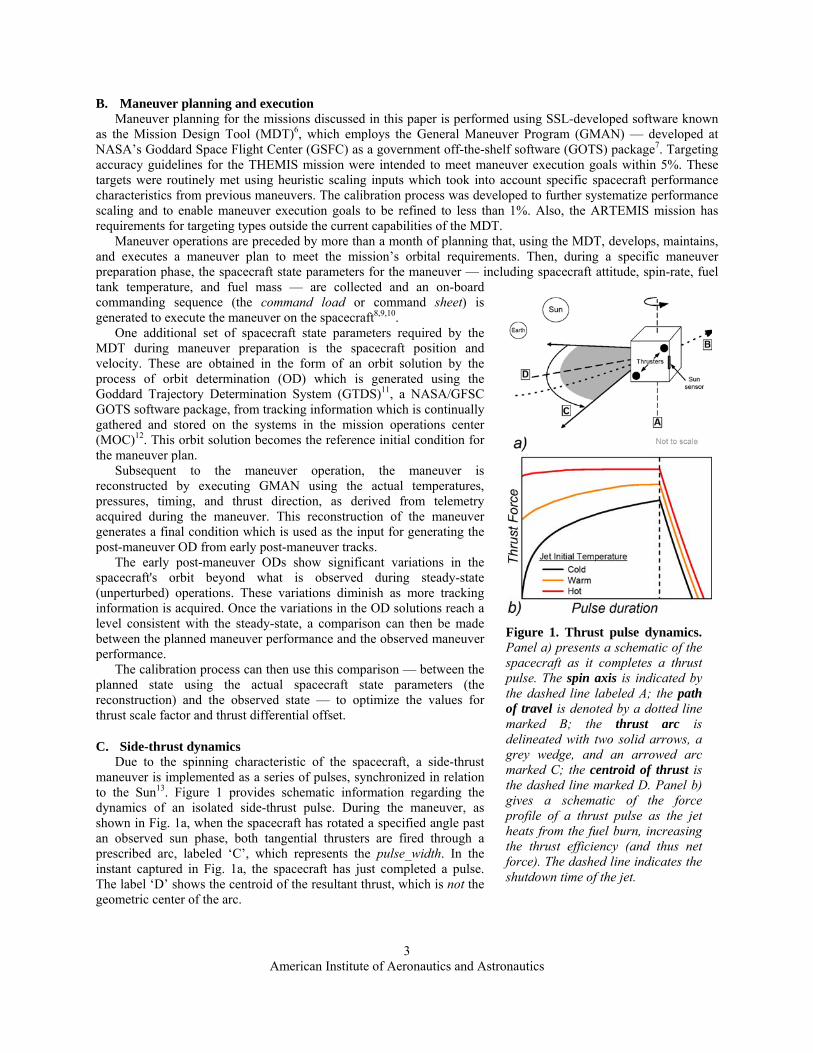
maneuver is implemented as a series of pulses, synchronized in relation to the Sun13. Figure 1 provides schematic information regarding the dynamics of an isolated side-thrust pulse. During the maneuver, as shown in Fig. 1a, when the spacecraft has rotated a specified angle past an observed sun phase, both tangential thrusters are fired through a prescribed arc, labeled ‘C’, which represents the pulse_width. In the instant captured in Fig. 1a, the spacecraft has just completed a pulse. The label ‘D’ shows the centroid of the resultant thrust, which is not the geometric center of the arc.
Figure 1. Thrust pulse dynamics. Panel a) presents a schematic of the spacecraft as it completes a thrust pulse. The spin axis is indicated by the dashed line labeled A; the path of travel is denoted by a dotted line marked B; the thrust arc is delineated with two solid arrows, a grey wedge, and an arrowed arc marked C; the centroid of thrust is the dashed line marked D. Panel b) gives a schematic of the force profile of a thrust pulse as the jet heats from the fuel burn, increasing the thrust efficiency (and thus net force). The dashed line indicates the shutdown time of the jet.

American Institute of Aeronautics and Astronautics
4
Rather, due to thermal effects associated with the jet inlet cooling after each pulse, there is a warm-up cycle that must occur with the initiation of each pulse. Figure 1b shows schematic force profiles for three temperature regimes, as a function of pulse duration.
During the chain of pulses, the initial jet temperature for each pulse increases, approaching (but not quite reaching) the steady-state temperature. Thus, a maneuver with a longer chain of pulses (i.e., more thruster on-time) contributes more thrust closer to the steady-state performance level. Here we will define the term near-steady-state to indicate the point in a chain of pulses at which the initial jet temperature reaches its upper limit − the (red) curve labeled as “Hot” in Fig. 1b.
These thermal effects are modeled by GMAN (through polynomial coefficients which are determined by the manufacturer), but the models are only approximations of these effects.
Other deviations from the model are caused by: • Non-rigid body dynamics • Thruster misalignments • Uncertainty in spacecraft mass and mass distribution • Uncertainty in fuel pressure • Error in Sun phase measurement • Thruster degradation caused by usage and exposure.
Non-rigid body dynamics is a significant contributor to deviations from the GMAN model. Our spacecraft have extended booms and wire antennae. These appendages greatly contribute to flex as forces are applied. They absorb energy in the initial impulse and transmit it back in a complex manner. Fuel slosh, the movement of fuel in the tank also due to impulse, has a similar effect. Both change the dynamics of the motion from that of an ideal rigid body. (Friction will also play a small part in these non-rigid body effects, but its consequence can be considered negligible.)
D. Maneuver optimization As mentioned above, GMAN provides facility for in-flight calibration in the form of a thrust scale factor, which
is configurable for each thruster. This flexibility allows for a thrust differential offset. The thrust scale factor is a multiplier to the thrusting force computed by GMAN for each specific thruster on a
given spacecraft. It can be used to either degrade (as a fraction) or enhance the expected performance of the jet. The thrust differential offset is added to or subtracted from this [average] thrust scale and applied to each thruster, in accordance with the deviation in spin performance from the model of a side-thrust event.
Using these calibration parameters, the net thrust of the 1st or 2nd jet can be written
( )1,2 1,2_ GMANThrust Net Thrust TSF Offset= × + (1) where GMANThrust is the GMAN-calculated thrust, TSF is the thrust scale factor, Offset1,2 is the thrust differential offset, with Offset1 = -Offset2, and the sign of Offset1 is determined by matching the observed spin behavior.
Operationally, the combined set (TSF +Offset1,2 ) is applied to the spacecraft maneuver plans or maneuver preparation through the MDT.
For a given maneuver, values for the calibration parameters are calculated to match the observed maneuver performance using the reconstruction process. The calculations involve an iterative procedure — a small adjustment , δ, is made to the specific calibration parameter being minimized and the difference in reconstructed performance is noted and compared to observation. When the sign in this difference changes, an extremum has been found and the process can stop. As long as this process is designed to follow the slope toward smaller differences, the extremum will be a minimum. A formal term for this type of algorithm is hill-climbing14.
Figure 2. Thrust differential offset as a function of thrust scale factor offset for spacecraft P1, P2, and P5. The data shown are for maneuvers prior to implementation of the calibration process. P1 data is represented by sqaures. P2 data is represented by triangles. P5 data is represented by circles.

American Institute of Aeronautics and Astronautics
5
We found with the THEMIS spacecraft that the process converges faster if an initial thrust scale factor is assumed and the thrust differential offset is adjusted until the final predicted spin of the reconstruction approaches that of the observed. Once the spin-rate change is matched, the thrust scale factor is adjusted until the difference in SMA change (∆SMA diff) is minimized. Since δ is finite, a linear interpolation is performed on the thrust scale factor to obtain ∆SMA diff = 0. Then the final calibration parameters are checked to ensure the performance meets suitable tolerances, maximally of the order of (∆SMA diff / SMA) ~ 10-6, and typically orders of magnitude smaller. This is well below the level of the inherent execution error.
Figure 2 indicates there is little if any dependence of the thrust differential offset on thrust scale factor. Thus, holding the thrust differential offset constant while changing the thrust scale factor (which is interdependent with on-time) is a reasonable course of action.
E. Data analysis As discussed in the Side-thrust Dynamics subsection above, the thrust efficiency for a maneuver is a function of
the number of maneuver pulses, which is proportional to the thruster on-time
on_time = n_pulses × thrust_duration, (2)
where n_pulses is the number of pulses executed during the maneuver. Thrust_duration is the duration of each pulse, with thrust_duration = pulse_width / spin-rate, and pulse_width is the [fixed] angular distance traveled during each pulse. Note that the spin-rate changes by a small fraction during the maneuver, so this is only a first order approximation.
As the data were collected, operational calibration curves were generated using a three-parameter logarithmic fit of the form
( ) ( )0 1 2lnf x B x B B= + + , (3) thus conforming to the generic curves of the thermal-effects of the approach to steady-state thrusting presented in the GMAN supporting documentation and to the internally published test data from the manufacturer of the thruster jets (Aerojet model MR-111C).
The data for spacecraft P1, P2, and P5 are shown in Fig. 3.
To quantitatively determine the suitability of applying Eq. (3) to the data, we calculated the following fit metrics as described in the Appendix. The mean squared error is the average of the sum of squared distances from each data point to the fit curve. The [normalized] subcomponents of the mean squared error: bias, unequal variation, and unequal covariation sum to unity, and are each measures of where the fit is most in error. A bias near unity means the data matches the curve, but is shifted above or below. The unequal variation measures the fit of the standard deviations of the curve with those of the data. For non-periodic data, such as ours, with little or no bias, a good curve fit will have an unequal covaration near unity, meaning that the error is in random deviations of the data points from the curve.
The metrics for the spacecraft P1, P2, and P5 thrust scale factor data are given in Table 1 and show that the functional form given in Eq. (3) is a valid model for the data.
Some caution is in order regarding fitting a function of the form in Eq. (3). This function provides for no asymptotic behavior and also truncates (in the real number space) for x ≤ −B1 . Both these attributes underline the danger of extrapolating from fitted curves. These limitations are somewhat problematic in the sense that one would
Figure 3. Thrust scale factor data for spacecraft P1, P2, and P5 as function of thruster on-time. The markers in all panels indicate thrust factors for maneuvers performed prior to implementation of the calibration process. The solid line is a fit of the form in Eq. (3) to the circle markers. Panel a shows the data for spacecraft P1, the filled star is an outlier in the data. Panel b depicts the data for spacecraft P2. Panel c represents the data for spacecraft P5.

American Institute of Aeronautics and Astronautics
6
like to have a predictive function for maneuvers outside of previously experienced regimes. Some resolution of this dilemma can be found in the form of artificially added asymptotic points and forced truncation, which are techniques that we have used with reasonable success.
For the long on-time behavior of a thruster, the approach of either adding artificial asymptotes or using curve truncation can be justified in the physical sense that the efficiency of a thruster cannot increase without bound. When planning very small maneuvers where the thruster on-time is lower than previously experienced, the lowest truncated value is considered with some possible modification by a heuristic assessment from the flight dynamics team.
IV. Application
A. Operational Description In our flight dynamics operations, the calibration process has two main components, updating the maneuver
planning curves through data gathered from previous and recent maneuvers, and providing input to the MDT with the calibration parameters to apply to a given thrusting event.
Updates to the maneuver planning curves are performed each time the operations on a side-thrust maneuver is completed. We will often calculate interim calibration parameters after the reconstruction and initial orbit solutions, especially when monitoring the performance for critical maneuvers. Usually, after several orbits worth of tracking data has been obtained, a final calibration is run and the maneuver planning curves are updated.
There are several options for selecting calibration parameters when a maneuver is targeted. Often, the calibration parameters are generated by a curve lookup, using the updated versions of the curves presented in Fig. 3. This approach requires the MDT to determine the calibration factor for each thrust event iteratively, as the thruster on-time (in terms of n_pulses) and the thrust scale factor are interdependent. During long-term planning, this approach is generally used.
Alternatively, the automated process can be overridden and the calibration parameters entered directly. During maneuver planning (i.e., constructing the command load for a near-term maneuver), a formalized procedure is followed whereby a designated member of the flight dynamics team determines the mode for calibration parameter selection. Most maneuvers that have thruster on-times within the bounds of the curve-fitting data use the curve lookup. If the specifics of the maneuver fall outside the bounds of the existing curve, the team member responsible for calibrating the maneuver will consider the options and make a determination based on known data and consultation with the other team members.
B. Early ARTEMIS Mission Challenges The initial phase of the ARTEMIS mission consisted of a series of orbit-raising maneuvers (ORMs) for each
spacecraft that were designed to increase apogee enough to enable specific Lunar gravitational encounters. These ORMs were opportunities to test the previous side-thrust calibration parameters and to gather more calibration data.
Requirements for large increases in apogee in each maneuver operation necessitated maneuvers of long thrust_duration. The timing and orbit specifics were such that these maneuvers coincided with significant Earth shadows. Since the spacecraft are unable to execute maneuvers in the absence of Sun synchronization, many of the maneuver operations were configured with dual thrusting events, with no opportunity for orbit state determination in between. Thus we were required to calibrate a large fraction of these maneuvers as an A maneuver and a B maneuver, each with their own calibration parameters. Figure 4 plots the thrust scale factor data for the spacecraft P1 and P2 ORMs in relation to the calibration curves developed from data prior to implementation of the calibration process.
To determine the calibration factors for the first set of dual-maneuver ORMs, which were executed on spacecraft P2, we simply used the calibration curve for each event based on the on-time of that event. When it happened that
Table 1. Fit metrics for calibration data Spacecraft Mean squared
error Bias Unequal
variation Unequal
covariation Notes
P1 2.61×10⁻⁵ 1.26×10⁻⁵ 0.0286 0.971 Excludes outlier P2 5.12×10⁻⁵ 1.14×10⁻¹¹ 0.0269 0.973 P5 2.85×10⁻⁵ 5.19×10⁻⁵ 1.57×10⁻³ 0.998

American Institute of Aeronautics and Astronautics
7
the executed maneuver exceeded the targeted SMA by an unacceptably large factor (greater than our goal of 1%), it became clear that the two events could not be considered independently.
In analyzing each ORM of spacecraft P2 [in succession] to determine the resultant calibration parameters, we required a method for optimizing the pair of thrust scale factors such that the two combined to minimize the difference in the total change in SMA (∆SMA diff). We first attempted to extend our aforementioned hill‐climbing techniques, but, after some exploratory work, we realized the following approach was more direct and useful in dealing with the prevalence of multiple local minima.
Figure 5 plots ∆SMA diff for a grid of thrust scale factor pairs for the A and B maneuvers for the 12th ORM of spacecraft P2, generated from maneuver reconstructions. Inspection indicates a series of local minima in the ∆SMA diff. These local minima make it difficult (or impossible) for automated routines to find a true minimum, if such actually exists. In this case, the approach was to generate grids such as Fig. 5b at a resolution such that maneuver differences due to individual pulses are identified (or nearly so). We then used the grid to choose the pair of thrust scale factors which scaled the A maneuver closest to the most recent calibration curve. This, by definition, placed the A maneuver thrust scale factors on the curve.
For the ORMs for spacecraft P1, no such offset in thrust scale factors was observed. We were able to choose symmetric thrust scale factors with adequate success. The differences between these spacecraft will be discussed presently.
V. Results
A. Data The calibration process has been instrumental in helping us consistently achieve higher accuracy in targeting
than previously realized. Figures 6-11 show before and after targeting accuracies for a range of side-thrust maneuvers for spacecraft P1, P2, and P5. In Figs. 6-8, the spin-rate targeting accuracy is shown. In Figs. 9-11, targeting accuracy is shown for ∆SMA diff. Table 2 provides a statistical summary of these results.
Targeting accuracy for small maneuvers (∆SMA < 100 km) have been grouped separately in Fig. 12 (data only exists for spacecraft P5). The few data points here (while not conclusive) give some indication that, while these maneuvers have a large percentage of inherent execution errors, the targeting accuracy was still improved.
B. Remarks Prior to implementation of the calibration process, spacecraft P2 was the poorest and least consistent performer
in the constellation. Figs. 7 and 10 (note the logarithmic scales) show orders of magnitude improvement in targeting accuracy. The reason for the inconsistent performance of spacecraft P2 is understood when the history of the spacecraft constellation is considered.
Prior to attachment to the spacecraft, the thrusters were profiled according to individual performance and then assigned to each spacecraft. Records indicate that while the other four spacecraft received thruster pairs that were closely matched, spacecraft P2 received two tangential thrusters with markedly differing thrust performance. In contrast, spacecraft P1 received a closely matched pair and also the pair with the best overall thrust performance. This would seem to explain two aspects of Fig. 4. One is the higher thrust scale factor curve for spacecraft P1, as compared to that for spacecraft P2, which is most likely a signature of more efficient performance from the thrusters of spacecraft P1.
Figure 4. ORM thrust scale factor data for spacecraft P1 and P2 as a function of thruster on-time. The lines in each panel give the thrust scale factor curves fit to data prior to the ORMs. The open square markers give the reconstructed thrust scale factors for the first maneuver (the A maneuver) event in each ORM. The open triangles show the reconstructed thrust scale factors for the second maneuver (the B maneuver) event in each ORM.

American Institute of Aeronautics and Astronautics
8
Figure 5. Calibration grid for spacecraft P2 and the 12th orbit raising maneuver, parts A & B. Panel a) is a three dimensional depiction of the thrust scale factors for each A and B part of the maneuver (TSFA,B) and the associated difference between the observed and reconstructed total ∆SMA. Panel b) is the same data projected in the plane as an aid to the eye. Note the fine-resolution logrithmic scale for percent ∆SMA diff.
a)
b)

American Institute of Aeronautics and Astronautics
9
Another obvious feature of Fig. 4 is the offset in the thrust scale factor between A and B maneuvers for
spacecraft P2, which is not apparent for spacecraft P1. One significant aspect of a dual-maneuver is that the initial jet temperature just prior to the B maneuver is considerably higher than at the start of the A maneuver. For spacecraft P2, the thruster performance for the pair would appear to be much less efficient prior to reaching the near-steady-state temperature condition. Therefore, longer thrusting events are more efficient due to the longer time spent thrusting in the near-steady-state condition.
Figure 9. SMA targeting accuracy for spacecraft P1. SMA targeting accuracy is calculated by the difference between the observed and targeted SMA change (as a percentage.) Red columns reflect an over-burn; blue columns indicate an under-burn. Maneuvers to the left of the dashed vertical line occurred prior to implementation of the calibration process. Maneuvers to the right were targeted using the calibration process. A horizontal grid is provided to delineate our accuracy goal of 1%.
Figure 8. Spin-rate targeting accuracy for spacecraft P5. Spin-rate targeting accuracy is calculated by the difference between the observed and targeted spin-rate change divided by the thruster on-time. Red columns reflect an over-burn; blue columns indicate an under-burn. Maneuvers to the left of the dashed vertical line occurred prior to implementation of the calibration process. Maneuvers to the right were targeted using the calibration process.
Figure 7. Spin-rate targeting accuracy for spacecraft P2. Spin-rate targeting accuracy is calculated by the difference between the observed and targeted spin-rate change divided by the thruster on-time. Red columns reflect an over-burn; blue columns indicate an under-burn. Maneuvers to the left of the dashed vertical line occurred prior to implementation of the calibration process. Maneuvers to the right were targeted using the calibration process. Note logarithmic scale.
Figure 6. Spin-rate targeting accuracy for spacecraft P1. Spin-rate targeting accuracy is calculated by the difference between the observed and targeted spin-rate change divided by the thruster on-time. Red columns reflect an over-burn; blue columns indicate an under-burn. Maneuvers to the left of the dashed vertical line occurred prior to implementation of the calibration process. Maneuvers to the right were targeted using the calibration process.

American Institute of Aeronautics and Astronautics
10
This manifests as a much longer warm-up period for spacecraft P2 than for spacecraft P1. It is illustrated by using Eq. (3) with curve coefficients of B0 = 0.028170409, B1 = 28.84873925, and B2 = 0.848575069, for spacecraft P1, and B0 = 0.017036798, B1 = -7.954182903, and B2 = 0.867228605 for spacecraft P2. We find the difference between thrust scale factors for thruster on-times of 10 s and 100 s is more than 92% greater for spacecraft P2 over spacecraft P1. For thruster on-times of 20 s and 150 s, the difference is almost 15%. These calculations correspond to the longer time to near-steady-state performance for spacecraft P2 than for spacecraft P1. With regard to the offset in performance for the A and B maneuvers, we expect that, as the total maneuver length increases, the difference becomes smaller. It is likely (although there is not enough data to confirm) that the offset in data in Fig. 4b would be reduced for longer maneuvers.
We should also note that prior to implementation of the calibration process, targeting was performed by scaling the maneuvers in the MDT according to previous performance experience. For example, if a spacecraft performed on average, such that the SMA target was exceed by 4% , this was planned for in the maneuver preparation. In addition to inherent re-targeting of subsequent maneuvers, the final targeting of a specific orbital parameter was kept small such that its thrust performance variation could be tolerated. Thus all nominal science requirements could be met well within the allocated fuel budget.
Figure 10. SMA targeting accuracy for spacecraft P2. SMA targeting accuracy is calculated by the difference between the observed and targeted SMA change (as a percentage.) Red columns reflect an over-burn; blue columns indicate an under-burn. Maneuvers to the left of the dashed vertical line occurred prior to implementation of the calibration process. Maneuvers to the right were targeted using the calibration process. A horizontal grid is provided to delineate our accuracy goal of 1%. Note logarithmic scale.
Figure 11. SMA targeting accuracy for spacecraft P5. SMA targeting accuracy is calculated by the difference between the observed and targeted SMA change (as a percentage.) Red columns reflect an over-burn; blue columns indicate an under-burn. Maneuvers to the left of the dashed vertical line occurred prior to implementation of the calibration process. Maneuvers to the right were targeted using the calibration process. A horizontal grid is provided to delineate our accuracy goal of 1%.
Figure 12. Targeting accuracy for small maneuvers on spacecraft P5.

American Institute of Aeronautics and Astronautics
11
C. Discussion While we have shown that both mismatched thrusters and thermal effects on jet efficiency are important to our
side-thrust targeting accuracy, there are several other factors that can also limit our ability to meet our tolerance limits. The results contain much noise and are based on limited amounts of data. Some remarks are in order regarding the sources of this noise in the data.
One of the key factors in the successful execution of a maneuver operation lies in the functionality of the fuel tank heaters. The only means of actuating them comes from automated thermostats that trigger on low temperature limits of the tanks. While the heaters can be forced off, there are risks associated with this type of action which often are not reasonable to assume.
Since maneuver preparation and command load generation for a given maneuver operation often precedes the event by 8 hours or more, predicting the spacecraft state parameters such as temperature for that command load becomes a difficult proposition when the tanks get so cold that they are near a heater cycle. Thus, we can sometimes have a 2o to 4o C difference in actual temperature than that used for the maneuver preparation, which would have the same effect on ∆SMA as adding or subtracting several pulses from the maneuver.
One means of countering this effect is to create several command loads in advance and provide contact opportunities near the maneuver for changing to a command load with the most accurate temperature. We have used these techniques with some success, but such extensive logistics are not always practical.
Other notable sources of error include: • GMAN modeling inaccuracies (as mentioned in the Methods section) • Errors in spin-rate profile due to albedo • Uncertainty in spacecraft attitude • Short tracking intervals due to closely timed maneuver operations
Albedo (or earthshine) at perigee has a significant effect on the spin-rate of our spacecraft. It is difficult to characterize. But we know albedo does affect the thrusting event, as we have seen non-ideal spin profiles during our maneuvers that no doubt add to our execution errors.
Knowledge of our spacecraft attitudes are sensitive to the amount of accurate data which can be obtained between maneuvers. Another limit to attitude accuracy lies in the resolution of the spacecrafts’ sun sensors — the photosensitive transducers have an angular separation of 1/8th degree.
Finally, maneuver operations can be closely timed which means our orbit and attitude knowledge are even more limited than normal maneuver operation, giving rise to what are known as navigation errors.
VI. Future Work The data shown in the results section reflect an increase in targeting accuracy for maneuvers at apogee or perigee
to change SMA. During the ARTEMIS mission, several types of targeting will be employed4. In the trans-lunar phase, maneuvers are targeted using changes in velocity vector (∆V) with the distance to a central body and the relative vector angle as a target (B-plane targeting). In the Lissajous phase, where the spacecraft will orbit selected Earth-Lunar zero-gravity (libration) points, the targets will be defined by planes in the rotating libration point (RLP) reference frame15. We are working to adapt our procedures as we gather more data associated with these events.
Table 2. Targeting accuracy statistics Spacecraft Number of
Qualifying Maneuvers
Average ∆Spin diff, RPM/(s
on-time)
Std deviation ∆Spin diff
Average ∆SMA diff,
%
Std deviation ∆SMA diff
P1 pre-calibration 9 1.32×10⁻⁴ 6.53×10⁻⁵ 3.39 1.89 post-calibration 6 2.58×10⁻⁵ 2.42×10⁻⁵ 0.623 0.444
P2 pre-calibration 17 1.16×10⁻³ 1.09×10⁻³ 7.21 2.06 post-calibration 26 2.13×10⁻⁵ 2.42×10⁻⁵ 0.657 0.802
P5 pre-calibration 6 2.48×10⁻⁴ 7.11×10⁻⁵ 4.64 1.90 post-calibration 8 1.59×10⁻⁴ 9.19×10⁻⁵ 0.940 0.564

American Institute of Aeronautics and Astronautics
12
Little work has been done to date with calibration of our axial thrusters. Some effort will be contributed toward understanding the adaptation of these methods in this regard.
Additionally, upcoming work in this area concerns several of the bulleted items in the Methods and Results sections, above. To further reduce our targeting error for upcoming ARTEMIS maneuvers, refinement in our understanding of the following areas will be required:
• Fuel mass • Mass distribution • Thruster alignments • Spacecraft attitude
The first item in this list is the topic of Ref. [16]. To illustrate this issue in terms already discussed here, Fig. 13 may give some clues to the fact that our knowledge of at least some of the spacecraft fuel masses have some uncertainty. It is likely that there is a usage-dependence in unequal thruster inefficiency, such that as the thrusters are used, the stronger of the two will degrade in performance faster. This will eventually equalize their performance, leading to a neutralizing of the thruster differential offset. Figure 13a illustrates this effect for spacecraft P1.
The behavior of the other two spacecraft is somewhat dissimilar from spacecraft P1 and leads us to believe that this is yet another indicator that our fuel mass consumption estimates may be slightly off. Regardless of the cause of this effect, more work is needed to understand its nature.
Finally, in our work to better understand the fuel usage characteristics of the spacecraft, we have encountered manufacturer-described functional forms for the specific impulse, Isp (as a function of jet inlet pressure) which may be a more suitable fit for our thrust scale factor data.
Future work will also involve examining these forms ( )
axf xb cx
=+
, ( ) xf x ab cx
= ++
, (4)
comparing them to the data fits found using Eq. (3). Our curve fitting metrics will be useful in determining the utility of these alternative forms.
VII. Conclusion As of this writing, the ARTEMIS and THEMIS-Low spacecraft are well positioned to carry out their ambitious
extended mission objectives, due in large part to the efforts described in this paper. As we move forward with these missions, we will continue to apply and adapt the techniques mentioned herein. We encourage designers and operators associated with current and future spaceflight missions to look to our techniques and results for inspiration to conduct in-flight calibration efforts, not just relating to thruster efficiency, but to the other varied aspects of their spaceflight that are hindered by uncertainties in the behavioral complexities of their spacecraft. Such efforts should not only be helpful in the realization of extended mission accomplishments—as demonstrated here—but also in mitigating other unforeseen challenges of spaceflight (e.g., the aforementioned problems with pre-maneuver fuel tank temperature prediction).
Appendix — Curve fitting metrics Fits to the data used throughout the calibration work are routinely checked using the mean squared error and its subcomponents as identified by economist Henri Theil17,18. The mean squared error is defined by
Figure 13. Thrust differential offset as a function of total remaining fuel mass for spacecraft P1, P2, and P5. Panel a gives data for spacecraft P1; panel b for spacecraft P2; panel c for spacecraft P5.

American Institute of Aeronautics and Astronautics
13
( )2
1
1 ni ii
MSE S An =
≡ −∑ , (5)
where n is the total number of observations, Si is the ith simulated value, and Ai is the corresponding ith observed value. Equation (5) can be rewritten in terms of the corresponding mean values ( ,S A ) and standard deviations
( ,S SS A )
( ) ( ) ( )2 2 2 1S S S SMSE S A S A r S A≡ − + − + − . (6)
where r is called the correlation coefficient and is defined
( )( )1
1 ni ii
S S
S S A Anr
S A=
− −≡
∑. (7)
Three fit criteria, the subcomponents of MSE , are derived from the sum in Eq. (6). The bias, a measure of error due to offset, is written
( )2M S A
UMSE−
≡ , (8)
the unequal variation, a measure of error in frequency matching for periodic data and range matching, is given by
( )2
S SS S AU
MSE−
≡ , (9)
And the unequal covariation, a measure of phase offset for periodic data, is defined
( )2 1CS SU r S A≡ − . (10)
The sum of these three components is by definition unity. A relatively high value of UC could suggest a systematic phase offset of the curve from the data trend. However, it is more often due to unsystematic (i.e., random) deviations of the data point values from the curve values and therefore it is usually desirable for most of the mean squared error to be due to UC.
Acknowledgments The authors would like to express their gratitude to Conrad Schiff, Daniel Rummel, and Swapan Gandhi for their
contributions to the development of the calibration process. Sam Johnson and Swapan Gandhi provided invaluable assistance with their cogent reviews of our manuscript.
The THEMIS and ARTEMIS missions are operated by the University of California, Berkeley under NASA contract NAS5-02099.
References 1Angelopoulos, V., “The THEMIS Mission,” Space Science Reviews, Vol. 141, No. 1-4, 2008, pp. 5-34. 2Frey, S., Angelopoulos, V., Bester, M., Bonnell, J., Phan, T., Rummel, D., “Orbit Design for the THEMIS
Mission,” Space Science Reviews, Vol. 141, 2008, pp. 61-89. 3Folta, D., Pavlak, T., Howell, K., Woodard, M., and Woodfork, D., “Stationkeeping of Lissajous Trajectories in
the Earth-Moon System with Applications to ARTEMIS,” Proceedings of the 20th AAS/AIAA Space Flight Mechanics Meeting, San Diego, CA, February 14-17, 2010.

American Institute of Aeronautics and Astronautics
14
4Woodard, M., Folta, D., and Woodfork, D., “ARTEMIS: The First Mission to the Lunar Libration Points”, Proceedings of the 21st International Symposium on Space Flight Dynamics, Toulouse, France, September 28 - October 2, 2009.
5Cosgrove, D., Frey, S., Folta, D., Woodard, M., Woodfork, D., Marchese, J. E., Owens, B. D., Gandhi, S., and Bester, M., “Navigating THEMIS to the ARTEMIS Low-Energy Lunar Transfer Trajectory,” Proceedings of the AIAA 2010 SpaceOps Conference, Huntsville, AL, April 25-30, 2010.
6Frey,S., Angelopoulos, V., Bester, M. "THEMIS: Implementation of a Challenging Mission Design", Proceedings of the 21st International Symposium on Space Flight Dynamics, Toulouse, France, September 28 - October 2, 2009.
7General Maneuver Program, Software Package, Ver. 94.03, NASA Goddard Space Flight Center, Greenbelt, MD, 1994.
8Bester, M., Lewis, M., Roberts, B., McDonald, J., Pease, D., Thorsness, J., Frey, S., Cosgrove, D., and Rummel, D., “THEMIS Operations,” Space Science Reviews, Vol. 141, No. 1-4, 2008, pp. 91-115.
9Bester, M., Lewis, M., Roberts, B., Croton, L., Dumlao, R., Eckert, M., McDonald, J., Pease, D., Smith, C., Thorsness, J., Wheelwright, J., Frey, S., Cosgrove, D., Rummel, D., Ludlam, M., Richard, H., Quinn, T., Loran, J., Boyd, R., Quan, C., and Clemons, T., “Ground Systems and Flight Operations of the THEMIS Constellation Mission,” Proceedings of the 2008 IEEE Aerospace Conference, Big Sky, MT, Mar. 1-8, 2008.
10Bester, M., Lewis, M., Roberts, B., Thorsness, J., McDonald, J., Pease, D., Frey, S., and Cosgrove, D., “Multi-mission Flight Operations at UC Berkeley – Experiences and Lessons Learned,” Proceedings of the AIAA 2010 SpaceOps Conference, Huntsville, AL, April 25-30, 2010.
11GTDS, Goddard Trajectory Determination System, Software Package, Ver. 2003.01, NASA Goddard Space Flight Center, Greenbelt, MD, 2003.
12Roberts, B., Lewis, M., Thorsness, J., Picard, G., Lemieux, G., Marchese, J., Cosgrove, D., Greer, G., Bester, M., ”THEMIS Mission Networks Expansion – Adding the Deep Space Network for the ARTEMIS Lunar Mission Phase,” Proceedings of the AIAA 2010 SpaceOps Conference, Huntsville, AL, April 25-30, 2010.
13Sholl, M., Leeds, M., and Holbrook, J., “THEMIS Reaction Control System—From I&T through Early Mission Operations,” Proceedings of the 43rd AIAA/ASME/SAE/ASEE Joint Propulsion Conference & Exhibit, Cincinnati, OH, July 8-11, 2007.
14Russell, S.J.; Norvig, P., Artificial Intelligence: A Modern Approach, 2nd ed., Upper Saddle River, New Jersey: Prentice Hall, 2003, pp. 111-114.
15National Aeronautics and Space Administration, Mission Analysis and Design Tool (Swingby) Mathematical Principles, 1995.
16Owens, B. D., Cosgrove, D., Sholl, M., and Bester, M., “On-Orbit Propellant Estimation, Management, and Conditioning for the THEMIS Spacecraft Constellation,” Proceedings of the AIAA 2010 SpaceOps Conference, Huntsville, AL, April 25-30, 2010.
17Sterman, J. D., “Appropriate Summary Statistics for Evaluating the Historical Fit of System Dynamics Models,” Dynamica, Vol. 10, No. 2, 1984, pp. 51-66.
18Owens, B. D., “Using Phase Space Attractors to Evaluate System Safety Constraint Enforcement: Case Study in Space Shuttle Mission Control Procedure Rework,” Ph.D. Dissertation, Engineering Systems Division, Massachusetts Institute of Technology, Cambridge, MA, 2009.