calibration of gtn damage model parameters using hydraulic … · 2019-12-21 · the vumat...
TRANSCRIPT

Ro. J. Techn. Sci. − Appl. Mechanics, Vol. 61, N° 3, pp. 245−260 , Bucharest, 2016
CALIBRATION OF GTN DAMAGE MODEL PARAMETERS USING HYDRAULIC BULGE TEST
ABDOLVAHED KAMI1, BIJAN MOLLAEI DARIANI2, DAN SORIN COMSA3, DOREL BANABIC3, ALI SADOUGH VANINI2, MATHIAS LIEWALD4
Abstract. In this research, a new approach has been introduced for the identification of GTN damage model parameters. The response surface methodology was used for design of experiments and also for the calculation of the optimum values of the GTN model parameters. For the calibration of the parameters, the values of the major and minor limit strains were measured at the surface of hydraulic bulge test specimens at the onset of necking. Then, a response value was defined as a function of the limit strains. Using this approach, the values of GTN model parameters were calculated for the Bondal sandwich sheet (a sandwich sheet with DC06 skin sheets and a polymeric core layer). The results showed that the introduced approach is able to calibrate the GTN model parameters with a good accuracy, the surface strains, forming force and the onset of necking in the bulge test being predicted with an acceptable accuracy. Furthermore, the forming limit curve (FLC) of the Bondal sheet was constructed using the numerical simulation of Nakazima tests and by using the calibrated values of GTN model parameters. The results showed that the GTN model is able to predict the Bondal sheet FLC with a fair quality, especially in the plane strain and biaxial strain regimes.
Keywords: Gurson, GTN damage model, identification, response surface methodology, anisotropy.
1. INTRODUCTION
Necking and subsequent fracture are important defects, which cause the rejection of products during sheet metal forming processes. So, it is crucial to be able to predict the onset of necking. In recent years, by the improvement of numerical simulation software and damage models, the prediction of fracture during metal forming has become possible with lower effort and an acceptable accuracy. One example of such a damage model is Gurson’s model [1]. This model predicts the fracture using
1 Semnan University, Mechanical Engineering Department, Iran, Email: [email protected]
2 Amirkabir University of Technology, Mechanical Engineering Department, 424 Hafez Ave, 15875–4413 Tehran, Iran
3 Technical University of Cluj-Napoca, CERTETA Research Centre, Str. C. Daicoviciu nr. 15, 400020 Cluj-Napoca, Romania
4 Institute for Metal Forming Technology (IFU) – Holzgartenstr, 17, 70174 Stuttgart, Germany
Kami, A., Dariani, B.M., Comsa, D.S., Banabic, D., Vanini, A.S. and Liewald, M., 2016. Calibration of GTN damage model parameters using hydraulic bulge test. Romanian Journal of Technical Sciences − Applied Mechanics, 61(3), pp.245−260.

A. Kami, B.M. Dariani, D.S. Comsa, D. Banabic, A.S. Vanini, M. Liewald 2 246
a damage potential, which in turn is a function of the yield stress, equivalent stress, hydrostatic pressure and void volume fraction. Gurson’s model [1] takes into account only the growth of pre-existing voids without considering the other important void evolution mechanisms like nucleation and coalescence. So, to improve the performance of the model, Tvergaard and Needleman [2–4] included mathematical descriptions of the void nucleation and coalescence in Gurson’s model. This modified model is known as Gurson-Tvergaard-Needleman (GTN) damage model.
Although, the GTN damage model is a powerful model for the prediction of fracture in ductile metals, its performance is influenced by the accuracy of its parameter identification. The material constants (q1, q2 and q3), initial void volume fraction ( f0), critical void volume fraction at which the voids start to coalesce ( fC), void volume fraction at ductile fracture (fF), maximum void volume fraction that can be nucleated ( fN), standard deviation (SN) and the equivalent strain ( Nε ) are the nine GTN damage model parameters which should be identified. Because of these large number of parameters and due to the non-uniqueness of the identified values of parameters [5, 6], almost all researchers focused on the identification of a reduced set of parameters. The values of the parameters excluded from this set were selected according to the suggestions found in the literature.
Many attempts have been made to develop procedures for the identification of the GTN model parameters in an efficient manner. Here, a brief review of the works in this area will be presented. The main focus will be on works which try to identify the GTN model parameters by studying the macroscopic behavior of materials. Cao et al. [7] identified the parameters of a generalized GTN model using both X-ray micro-tomography and macroscopic mechanical tests. Uthaisangsuk et al. [8] used the direct current potential method to calibrate the equivalent strain and the critical void volume fraction. Fratini et al. [9] used a series of force vs. displacement curves obtained from uniaxial tensile tests to optimize a second order function of GTN parameters and to identify these parameters. Abbasi et al. [10, 11] employed the response surface methodology (RSM) to identify the values of IF-steel and tailor welded blanks made from IF-steel. They performed numerical simulations of the uniaxial tensile test according to a design of experiments. The results of these simulations were used in an optimization procedure to calibrate f0 , fC , fF and fN parameters. Kami et al. [12, 13] used the RSM to find the parameters of an anisotropic GTN damage model. A combination of parameters which results in the best replication of the experimental force vs. displacement curve (in the uniaxial tensile test) was calculated by performing some numerical simulations and optimization. Abbassi et al. [14] calibrated the GTN model parameters using an artificial neural networks system and results of the tensile test. Marouani and Aguir [15, 16] proposed an inverse method combining the numerical simulation with artificial neural network to identify the values of the GTN parameters for sheet metal blanking applications. Chhibber et al. [17] employed an experimental procedure for estimating the GTN material parameters of base metal and weld metal regions of a bimetallic weld. For this purpose, the authors processed the micrographs from the scanning electron

3 Calibration of GTN damage model parameters using hydraulic bulge test 247
microscopy of different interrupted tensile tests performed on some notched tensile specimens. Abendroth and Kuna [18] used the resulting load vs. displacement curve of the small punch test to train a neural network. The identification of the GTN model parameters was done by using a conjugate directions algorithm, which minimizes the error between the experimental load vs. displacement curve and the one predicted by the network function. Cuesta et al. [19] also calibrated the GTN model parameters using the load vs. displacement curve in the small punch test. Springmann and Kuna [20] and Mahnken [21] identified the GTN model parameters by minimizing a least-square functional which represents the quality of accordance between the experimentally and numerically obtained forces at given displacements in the tensile test. Lauro et al. [22] combined the numerical simulation of a notched specimen tensile test with an optimization technique and used the geometrical changes in the notch identified the anisotropy and the GTN model parameters. Muñoz-Rojas [23] used a genetic algorithm and data of the load-displacement curve and final neck diameter in the tensile test to identify the GTN model parameters. Oral et al. [24] applied the GTN model to the failure of a polymeric material. The GTN parameters were calibrated using the Nelder-Mead simplex method by correlating experimental and numerical results of tensile and fracture tests. Broggiato et al. [25] estimated the GTN parameters by means of experimental data collected from digital image processing of a notched specimen during tensile test. Hadj Miloud et al. [26] determined nucleation and critical void volume fractions by utilizing the load-diametric contraction curves obtained from tensile test of axisymmetric notched specimens. Kiran and Khandelwal [27] calibrated the GTN model parameters using experiments performed on axisymmetric notched tensile specimens with different stress triaxiality and fracture initiation locations. The reader is also recommended to refer to Ref. [28], for further information about the calibration of GTN parameters.
The above literature survey indicates that the identification of the GTN model parameters is still a challenging problem. So, in this paper, a new procedure has been proposed to find the GTN parameters. For this purpose, the hydraulic bulge test along with the RSM optimization technique have been employed.
2. ANISOTROPIC GTN DAMAGE MODEL
An anisotropic GTN damage model combined with Hill’s quadratic yield criterion [29] has been developed. The constitutive equations of the model have been implemented as a VUMAT subroutine [13] of Abaqus software. Here, a brief description of the constitutive equations implemented in the VUMAT subroutine will be represented. A full explanation of the GTN model can be found in ref. [13]. The GTN potential function is expressed as:
( ) ( )2
21 2 3
32 cosh 12pq f q q fY Y
∗ ∗⎛ ⎞σΦ = + − − +⎜ ⎟⎝ ⎠
, (1)

A. Kami, B.M. Dariani, D.S. Comsa, D. Banabic, A.S. Vanini, M. Liewald 4 248
where σ is the equivalent stress defined by Hill’48 yield function [29]: 1 22 2 2
22 33 33 11 11 222 2 223 31 12
( ) ( ) ( ),
2 2 2
F G H
L M N
⎡ ⎤σ − σ + σ − σ + σ − σσ = ⎢ ⎥
⎢ ⎥+ σ + σ + σ⎣ ⎦ (2)
In Eq. (2), ( , 1,2,3)ij i jσ = are Cartesian components of a corotational Cauchy stress tensor, while F, G, H, L, M, and N are material constants. These constants can be identified using the Lankford coefficients r0, r45 and r90 obtained from uniaxial tensile tests performed on specimens cut at 0°, 45° and 90° with respect to the rolling direction. The following relationships can be used to evaluate the parameters F, G, H, L, M, and N when these coefficients are available:
0 0
90 0 0 0
0 90 45
90 0
1, , ,( 1) 1 1( )(2 1)3 , .2 2 ( 1)
r rF G Hr r r rr r rL M N r r
= = =+ + +
+ += = =
+
(3)
In Eq. (1), p is the hydrostatic pressure:
11 22 33( )3p
σ + σ + σ= − (4)
and Y is the yield stress of the matrix defined by the Swift hardening law [30]:
0( )nY K= ε + ε (5)
and:
( )
, if
, if
, if
C
F CC C C F
F C
F F
f f f
f ff f f f f f ff f
f f f
∗∗
∗
≤⎧⎪
−⎪= + − < <⎨ −⎪⎪ ≥⎩
(6)
is a porosity parameter depending on the current void volume fraction f. The evolution of void volume fraction is due to the growth of the initial void
volume fraction f0 and the nucleation of new voids at the limits of the second phase particles and inclusions:
growth nucleation ,f f f= + (7)
where
( ) ( ) ( )growth 11 22 33(1 ) p p pf f ⎡ ⎤= − ε + ε + ε⎣ ⎦ (8)

5 Calibration of GTN damage model parameters using hydraulic bulge test 249
and
( )
nucleation1exp ,22
pN N
NN
ff SS
⎡ ⎤⎛ ⎞ε − ε= −⎢ ⎥⎜ ⎟⎜ ⎟π ⎢ ⎥⎝ ⎠⎣ ⎦
(9)
where the ( ) ( 1,2,3)pii iε = are the components of the plastic strain rate tensor and
( )pε is the equivalent plastic strain. The VUMAT subroutine has been used in combination with the Abaqus/Explicit
finite element code [12, 13]. During the finite element simulation, the VUMAT subroutine calculates the current values of the stress components, the equivalent plastic strain and the void volume fraction. If the void volume fraction in one element reaches the critical value fF , that element will be removed from the model. This state is an indication of damage occurrence in the model.
3. EXPERIMENTS
The material used in experiments is a Bondal® sandwich sheet [31]. Bondal® is a vibration-damping composite material with a sandwich structure consisting of a viscoelastic core (with the thickness of 0.05 mm) between two outer steel sheets (DC06 steel sheet with the thickness of 0.6 mm). It offers high structure-borne sound insulation and good airborne sound damping properties and can be used to great effect wherever steel components are subjected to vibrations resulting in structure-borne sound. To obtain the values of the elastic-plastic material parameters as well as the Lankford coefficients of DC06 skin sheets, tensile tests of the sheet have been conducted at 0°, 45° and 90° angles with respect to the rolling direction. The tensile tests in each direction have been repeated five times [32]. Based on these experiments, the value of Young’s modulus, 0r , 45r and 90r have obtained as 210 GPa, 2.03, 1.75 and 2.47, respectively. Also, the Swift’s law has been defined as:
0.246502.5(0.005 ) .Y = + ε (10)
The same experiments have been conducted on the Bondal sandwich sheet. Using the tensile stress-strain curves for the Bondal and DC06 sheets, the stress-strain of the core layer has been determined. To do this, it was assumed that the volume of the materials is constant. By decomposing the tensile force, the value of the stress at the core layer for a specific value of strain was obtained using the following equation [33]:
( )(0)
skincore skin (0)
core2 ,s
sσ = σ − σ + σ (11)

A. Kami, B.M. Dariani, D.S. Comsa, D. Banabic, A.S. Vanini, M. Liewald 6 250
where (0)skins , (0)
cores , σ, skinσ and coreσ denote the initial thickness of the skin layer, initial thickness of the core layer, current value of the tensile stress acting on the cross section of the sandwich sheet, skin layer and core layer, respectively. The plastic stress-strain curve of the polymeric core layer obtained from Eq. (11) is shown in Fig. 1. To compare the properties of each layer, the plastic stress-strain curve of the DC06 skin sheets is also depicted in Fig. 1.
Fig. 1 – Tensile stress-strain curve of the core layer [33].
For the calibration of the GTN model parameters, the values of major and minor strains at the surface of bulge specimens have been measured. The bulge specimens are disk shaped Bondal sheets with the diameter of 180 mm. A speckle pattern of black spots on white background has been sprayed to the surface of the bulge specimens. The bulge test has been conducted using the Erichsen 142–20 machine. The ARAMIS system has been used to measure the major and minor strains at the surface of the specimens during bulging. The bulge test has been repeated three times. Figure 2 shows one of the bulge specimens before and after the test.
Fig. 2 – Hydraulic bulge test sample of Bondal® sheet (a) before and (b) after the test [33].

7 Calibration of GTN damage model parameters using hydraulic bulge test 251
4. NUMERICAL SIMULATION OF THE BULGE TEST
In this research, the numerical simulations of hydraulic bulge test in combination with response surface methodology have been used to calibrate the GTN model parameters. In the bulge test, the sheet is clamped between the die and blank holder and then stretched by the oil pressure. Figure 3 demonstrates the schematic of the bulge test and the tooling. According to this configuration of the test components, the finite element (FE) model of the bulge test has been created in the Abaqus software. In the FE model, the tools have been modeled as axisymmetric rigid bodies using analytically defined surfaces. Because of its symmetry, only one-fourth of the Bondal specimen has been included in the model. Figure 4 shows the FE model of the bulge test.
Fig. 3 – Schematic of a hydraulic bulge test.
Fig. 4 – Finite element model of the Bondal sheet hydraulic bulge test.

A. Kami, B.M. Dariani, D.S. Comsa, D. Banabic, A.S. Vanini, M. Liewald 8 252
In the FE model, the Bondal sheet has three layers (two metallic skins and one core layer). These layers have been tied to each other. The C3D8R element type has been used to mesh the Bondal sheet components. A mesh sensitivity study has been performed to determine the proper element size for the Bondal sheet components. In this mesh sensitivity study, the value of the equivalent plastic strain (the first solution-dependent state variable of the VUMAT subroutine, SDV1) and void volume fraction (the second solution-dependent state variable of the VUMAT subroutine, SDV2) have been measured at the element located at the top center of the Bondal specimen. The results of the mesh sensitivity study are depicted in Fig. 5. As one may notice, by changing the element size from 0.2 mm to 0.4 mm no considerable change occurs in the SDV1 and SDV2 curves. On the other hand, decreasing the element size from 3.2 mm to 0.4 mm have significant effect on the SDV1 and SDV2 curves. So, it was concluded that the appropriate value of the element size is 0.4 mm.
Fig. 5 – Mesh sensitivity analysis (numerical simulation of the bulge test):
effect of element size on the (a) equivalent plastic strain-SDV1 and (b) void volume fraction-SDV2.

9 Calibration of GTN damage model parameters using hydraulic bulge test 253
The DC06 skin sheets have been characterized by a user defined material model. The values of material parameters have been calculated using data obtained from tensile tests as well as the identification procedure. The core layer has been defined as a standard elastic-plastic material. The elastic part has been specified by the Neo-Hookean potential function, U:
210 1
1
1( 3) ( 1) ,U C I JD
= − + − (12)
where I1 is the strain constant, J is the elastic volumetric strain and C10 and D1 are the material constants. The value of C10 and D1 is set equal to 1492.2 and 2.7e-5, respectively. The plastic part of the core layer behavior has been characterized by the stress-strain curve shown in Fig.1.
5. IDENTIFICATION PROCEDURE
As mentioned in section 1, the identification of all nine parameters of the GTN model is not an efficient procedure. Instead, in almost all researches, only a few number of these nine parameters have been selected for calibration (see section 1). Following this aspect, here, we calibrated the value of three parameters, i.e. fN , fC and fF . The values of the remained parameters have been considered as: 1 1.5q = ,
2 1.0q = , 23 1 2.25q q= = , 0.1NS = , 0.3Nε = and 0 0.0005f = [27, 34]. To calculate
the value of fN , fC and fF parameters, a set of numerical simulations of the Bondal sheet hydraulic bulge test has been conducted. These simulations have been designed using a face centered central composite design RSM. The designed simulations are listed in Table 1. In this table, fdelta is the difference between fF and fC . The values of the calibrating parameters have been calculated by the minimization of a response function using RSM. The response function has been defined using the following function:
0.52 21 1 2 2 ( ) ( ) ,exp num exp numResponse = ε − ε + ε − ε⎡ ⎤⎣ ⎦ (13)
where 1ε and 2ε correspond to the major and minor strains, respectively. Also, the exp and num superscripts individualize the experimental and numerically calculated strains. The experimental strains have been determined by the ARAMIS software while the numerical strains have been calculated using the numerical simulation of the bulge test. The value of the response function for each experiment (Response) has been listed in Table 1.

A. Kami, B.M. Dariani, D.S. Comsa, D. Banabic, A.S. Vanini, M. Liewald 10 254
6. RESULTS AND DISCUSSIONS
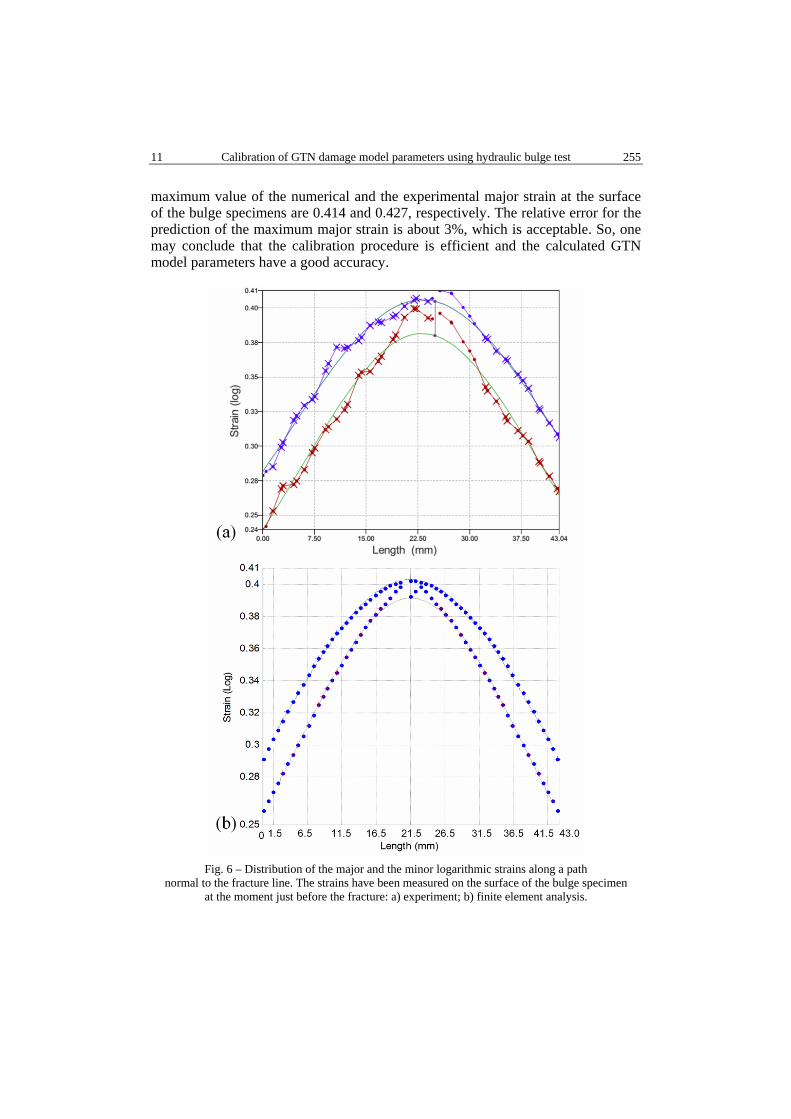
Using the minimization procedure described in the previous section, the values of the calibrating parameters have been calculated as 0.0219Cf = , 0.1677Ff = ( 0.1458deltaf = ) and 0.0008Nf = . In order to confirm the accuracy of the calculations, the numerical simulation of the bugle test has been performed by setting the value of the calibrated (and the remained) parameters. The distribution of the major and the minor logarithmic strains along a path normal to the fracture line have been measured at the onset of necking (Fig. 6b). Correspondingly, using the ARAMIS software the strain distributions have been measured at the surface of the experimental bulge specimen at the onset of necking (Fig. 6a). According to Fig. 6, the distributions of the numerically obtained major and minor strains are almost identical to the experimental strains.
Table 1
Central composite design of the numerical simulation of hydraulic bulge test and their responses
Experiment number Nf Cf ( )delta F Cf f f= − Response
1 0.00150 0.02 0.15 0.054446
2 0.00150 0.05 0.05 0.018093
3 0.00080 0.05 0.15 0.101518
4 0.00115 0.035 0.05 0.052319
5 0.00150 0.02 0.05 0.096068
6 0.00115 0.035 0.10 0.052293
7 0.00080 0.02 0.15 0.015478
8 0.00080 0.02 0.05 0.055245
9 0.00115 0.035 0.15 0.052473
10 0.00115 0.05 0.10 0.052645
11 0.00115 0.02 0.10 0.030247
12 0.00150 0.05 0.15 0.109737
13 0.00115 0.035 0.10 0.052293
14 0.00080 0.05 0.05 0.101920
15 0.00150 0.035 0.10 0.019251
16 0.00080 0.035 0.10 0.018428
17 0.00115 0.035 0.10 0.052293
Furthermore, the distribution of the major logarithmic strain at the surface of bulge specimen at the onset of necking has been compared with experimental data. These distributions are shown in Fig. 7. This figure also indicates that the numerically calculated strains are very close to the experimental results. For example, the
11 Calibration of GTN damage model parameters using hydraulic bulge test 255
maximum value of the numerical and the experimental major strain at the surface of the bulge specimens are 0.414 and 0.427, respectively. The relative error for the prediction of the maximum major strain is about 3%, which is acceptable. So, one may conclude that the calibration procedure is efficient and the calculated GTN model parameters have a good accuracy.
Fig. 6 – Distribution of the major and the minor logarithmic strains along a path
normal to the fracture line. The strains have been measured on the surface of the bulge specimen at the moment just before the fracture: a) experiment; b) finite element analysis.

A. Kami, B.M. Dariani, D.S. Comsa, D. Banabic, A.S. Vanini, M. Liewald 12 256
Fig. 7 – Distribution of the major logarithmic strain on the surface of bulge specimen
at the moment just before the fracture: a) experiment; b) finite element analysis.
Moreover, the bulging force has been measured during the deformation. Figure 8 compares the experimentally and numerically obtained bulging forces. According to this figure, the finite element model of the bulge test predicts the bulging force with an acceptable accuracy. Figure 8 also shows that the finite element model is able to predict the fracture height (the points related to the fracture height are marked by open circles) very well. The fracture height predicted by the finite element model is 31.02 mm while the experimental specimen height is 32.02 mm (the relative error is about 3%). This indicates that the finite element model has good accuracy and also the GTN parameters are well calibrated.

13 Calibration of GTN damage model parameters using hydraulic bulge test 257
Fig. 8 – Comparison of the finite element and experimental bulging forces.
In order to confirm the accuracy of the calibrated parameters, the forming limit diagram (FLD) of the Bondal sandwich sheet has been constructed by simulating a series of Nakazima tests and comparing the numerical results with the experimental FLD. To construct the experimental FLD, different Nakazima tests have been performed on notched specimens having the widths of 30, 90, 110, 130, 140 mm and one circular specimen with the diameter of 190 mm. For the numerical determination of FLD, the same Nakazima tests have been simulated using the GTN damage model. For brevity, the details of the numerical and experimental FLD construction are not included in this paper. More detailed information can be found in our previous works [13, 33]. The numerical and experimental FLDs of the Bondal sandwich sheet are compared in Fig. 9. As one may notice from this figure, the GTN model predicts the limit strains of the FLD with a good accuracy, except the extreme left point. Based on Fig. 9, one may conclude that the calibration procedure introduced in this research is more appropriate for the plane strain and biaxial stretching forming regimes. On the other hand, the procedure is not so accurate for tensile forming conditions (corresponding to the left branch of the FLD).
7. CONCLUSIONS
In this paper a new approach has been introduced for calibrating an anisotropic GTN damage model. Based on the results, the following conclusions can be made:
• The response surface method is an efficient tool for the optimization of the GTN model parameters.

A. Kami, B.M. Dariani, D.S. Comsa, D. Banabic, A.S. Vanini, M. Liewald 14 258
• The calibration of the GTN model parameters based on the numerical simulation of the bulge test and the surface strain measurement is an easy and practical way for calibrating the GTN model parameters.
• The anisotropic GTN damage model is able to directly predict the fracture of the specimens. It is also able to calculate the FLD of the specimens, which in turn can be used to predict the fracture of specimens during deformation.
• The comparison of the numerically determined FLD and experimental data shows that the calibration of the GTN model parameters based on the hydraulic bulge is suitable for plane strain and biaxial stretch forming regimes.
Fig. 9 – Comparison between the forming limit curve obtained by the GTN model
(finite element analysis) and experimental data.
Acknowledgements. The authors would like to thank the ThyssenKrupp Steel Europe AG for providing the Bondal sheet samples. The authors also thank Dr. Ioan Nicodim for his kind help in conducting the experiments.
Received on October 26, 2016
REFERENCES
1. GURSON, A.L., Continuum theory of ductile rupture by void nucleation and growth Part I-Yield criteria and flow rules for porous ductile media, Journal of engineering materials and technology, 99, 1, pp. 2−15, 1977.
2. TVERGAARD, V., Influence of voids on shear band instabilities under plane strain conditions, International Journal of Fracture, 17, 4, pp. 389−407, 1981.

15 Calibration of GTN damage model parameters using hydraulic bulge test 259
3. TVERGAARD, V., On localization in ductile materials containing spherical voids, International Journal of Fracture, 18, 4, pp. 237−252, 1982.
4. TVERGAARD, V., NEEDLEMAN, A., Analysis of the cup-cone fracture in a round tensile bar, Acta Metallurgica, 32, 1, pp. 157−169, 1984.
5. LI, Z.H., BILBY, B.A., HOWARD, I.C., A study of the internal parameters of ductile damage theory, Fatigue & Fracture of Engineering Materials & Structures, 17, 9, pp. 1075−1087, 1994.
6. ZHANG, Z.L., A sensitivity analysis of material parameters for the Gurson constitutive model, Fatigue & Fracture of Engineering Materials & Structures, 19, 5, pp. 561−570, 1996.
7. CAO, T.S., MAIRE, E., VERDU, C., BOBADILLA, C., LASNE, P., MONTMITONNET, P., BOUCHARD, P.O., Characterization of ductile damage for a high carbon steel using 3D X-ray micro-tomography and mechanical tests – Application to the identification of a shear modified GTN model, Computational Materials Science, 84, pp. 175−187, 2014.
8. UTHAISANGSUK, V., PRAHL, U., MÜNSTERMANN, S., BLECK, W., Experimental and numerical failure criterion for formability prediction in sheet metal forming, Computational Materials Science, 43, 1, pp. 43−50, 2008.
9. FRATINI, L., LOMBARDO, A., MICARI, F., Material characterization for the prediction of ductile fracture occurrence: An inverse approach, Journal of Materials Processing Technology, 60, 1−4, pp. 311−316, 1996.
10. ABBASI, M., KETABCHI, M., IZADKHAH, H., FATMEHSARIA, D.H., AGHBASH, A.N., Identification of GTN model parameters by application of response surface methodology, Procedia Engineering, 10, pp. 415−420, 2011.
11. ABBASI, M., BAGHERI, B., KETABCHI, M., HAGHSHENAS, D.F., Application of response surface methodology to drive GTN model parameters and determine the FLD of tailor welded blank, Computational Materials Science, 53, 1, pp. 368−376, 2012.
12. KAMI, A., MOLLAEI DARIANI, B., SADOUGH VANINI, A., COMSA, D.-S., BANABIC, D., Application of a GTN Damage Model to Predict the Fracture of Metallic Sheets Subjected to Deep-Drawing, Proceedings of the Romanian Academy, Series A − Mathematics, Physics, Technical Scienes, Information Science, 15, 3, pp. 300−309, 2014.
13. KAMI, A., DARIANI, B.M., SADOUGH VANINI, A., COMSA, D.S., BANABIC, D., Numerical determination of the forming limit curves of anisotropic sheet metals using GTN damage model, Journal of Materials Processing Technology, 216, pp. 472−483, 2015.
14. ABBASSI, F., BELHADJ, T., MISTOU, S., ZGHAL, A., Parameter identification of a mechanical ductile damage using Artificial Neural Networks in sheet metal forming, Materials & Design, 45, pp. 605−615, 2013.
15. AGUIR, H., MAROUANI, H., Gurson-Tvergaard-Needleman parameters identification using artificial neural networks in sheet metal blanking, International Journal of Material Forming, 3, S1, pp. 113−116, 2010.
16. MAROUANI, H., AGUIR, H., Identification of material parameters of the Gurson–Tvergaard–Needleman damage law by combined experimental, numerical sheet metal blanking techniques and artificial neural networks approach, International Journal of Material Forming, 5, 2, pp. 147−155, 2012.
17. CHHIBBER, R., ARORA, N., GUPTA, S.R., DUTTA, B.K., Estimation of Gurson material parameters in bimetallic weldments for the nuclear reactor heat transport piping system, Proceedings of the Institution of Mechanical Engineers, Part C: Journal of Mechanical Engineering Science, 222, 12, pp. 2331−2349, 2008.
18. ABENDROTH, M., KUNA, M., Identification of ductile damage and fracture parameters from the small punch test using neural networks, Engineering Fracture Mechanics, 73, 6, pp. 710−725, 2006.
19. CUESTA, I. I., ALEGRE, J.M., LACALLE, R., Determination of the Gurson-Tvergaard damage model parameters for simulating small punch tests, Fatigue & Fracture of Engineering Materials & Structures, 33, 11, pp. 703–713, 2010.

A. Kami, B.M. Dariani, D.S. Comsa, D. Banabic, A.S. Vanini, M. Liewald 16 260
20. SPRINGMANN, M., KUNA, M., Identification of material parameters of the Gurson–Tvergaard–Needleman model by combined experimental and numerical techniques, Computational Materials Science, 32, 3−4, pp. 544−552, 2005.
21. MAHNKEN, R., Aspects on the finite-element implementation of the Gurson model including parameter identification, International Journal of Plasticity, 15, 11, pp. 1111−1137, 1999.
22. LAURO, F., BENNANI, B., CROIX, P., OUDIN, J., Identification of the damage parameters for anisotropic materials by inverse technique: application to an aluminium, Journal of Materials Processing Technology, 118, 1–3, pp. 472−477, 2001.
23. MUÑOZ-ROJAS, P.A., CARDOSO, E.L., VAZ, M., JR., Parameter identification of damage models using genetic algorithms, Experimental Mechanics, 50, 5, pp. 627−634, 2010.
24. ORAL, A., ANLAS, G., LAMBROS, J., Determination of Gurson–Tvergaard–Needleman Model Parameters for Failure of a Polymeric Material, International Journal of Damage Mechanics, 21, 1, pp. 3−25, 2012.
25. BROGGIATO, G., CAMPANA, F., CORTESE, L., Identification of material damage model parameters: an inverse approach using digital image processing, Meccanica, 42, 1, pp. 9−17, 2007.
26. HADJ MILOUD, M., IMAD, A., BENSEDDIQ, N., BACHIR BOUIADJRA, B.A., BOUNIF, A., SERIER, B., A numerical analysis of relationship between ductility and nucleation and critical void volume fraction parameters of GTN model, Proceedings of the Institution of Mechanical Engineers, Part C: Journal of Mechanical Engineering Science, 227, 11, pp. 2634–2646, 2013.
27. KIRAN, R., KHANDELWAL, K., Gurson model parameters for ductile fracture simulation in ASTM A992 steels, Fatigue & Fracture of Engineering Materials & Structures, 37, 2, pp. 1−13, 2013.
28. CHEN, Z., BUTCHER, C., Micromechanics modelling of ductile fracture, Springer, Dordrecht, 2013. 29. HILL, R., A theory of the yielding and plastic flow of anisotropic metals, Proceedings of the Royal
Society of London, Series A: Mathematical, Physical and Engineering Sciences, 193, 1033, pp. 281−297, 1948.
30. SWIFT, H.W., Plastic instability under plane stress, Journal of the Mechanics and Physics of Solids, 1, 1, pp. 1−18, 1952.
31. THYSSENKRUPP STAHL, A., Data sheet Bondal®: Composite material with structure and airborne sound damping properties, Bochum, 2012.
32. Beuth Verlag GmbH, DIN EN 10002-1:2001-12. Metallic materials – Tensile testing – Part 1: Method of testing at ambient temperature; English version, Berlin, 2001.
33. KAMI, A., DARIANI, B.M., COMSA, D.S., BANABIC, D., VANINI, A.S., LIEWALD, M., An Experimental Study on the Formability of a Vibration Damping Sandwich Sheet (Bondal), Proceedings of the Romanian Academy, Series A − Mathematics, Physics, Technical Scienes, Information Science, 2017.
34. BENSEDDIQ, N., IMAD, A., A ductile fracture analysis using a local damage model, International Journal of Pressure Vessels and Piping, 85, 4, pp. 219−227, 2008.