calibration of beta-particle-emitting ophthalmic applicators
TRANSCRIPT

NBS Measurement Services:
Calibration of
Beta-Particle-Emitting
Ophthalmic Applicators
U.S. Department of Commerce
National Bureau of Standards

Center for Radiation ResearchThe Center for Radiation Research is a major component of the National Measurement Laboratory in the National
Bureau of Standards. The Center provides the Nation with standards and measurement services for ionizing
radiation and for ultraviolet, visible, and infrared radiation; coordinates and furnishes essential support
to the National Measurement Support System-for ionizing radiation; conducts research in radiation related
fields to develop improved radiation measurement methodology; and generates, compiles, and critically
evaluates data to meet major national needs. The Center consists of five Divisions and one Group.
Atomic and Plasma Radiation Division
Carries out basic theoretical and experimental research into the • Atomic Spectroscopy
spectroscopic and radiative properties of atoms and highly ionized • Atomic Radiation Data
species; develops well-defined atomic radiation sources as radiometric • Plasma Radi at ion
or wavelength standards; develops new measurement techniques and
methods for spectral analysis and plasma properties; and collects,
compiles, and critically evaluates spectroscopic data. The Division
consists of the following Groups:
Radiation Physics Division ^ ^
Provides the central national basis for the measurement of far ultra- • Far UV Physics
violet, soft x-ray, and electron radiation; develops and disseminates • Electron Physicsradiation standards, measurement services, and data for for these radi a- • Photon Physicstions; conducts theoretical and experimental research with electron,
laser, ultraviolet, and soft x-ray radiation for measurement applica-
tions; determines fundamental mechanisms of electron and photon inter-actions with matter; and develops advanced electron- and photon-basedmeasurement techiques. The Division consists of the following Groups:
Radiometric Physics Division
Provides national measurement standards and support services for ultra- • Spectral Radiometryviolet, visible, and infrared radiation; provides standards dissemination • sjaectrophotometryand measurement quality assurance services; conducts research in optical • Radiometric Measurement Servicesradiation, pyrometry, photometry, and quanttm radiometry; and developsspectroradiometric and spectrophotometric standards and calibrationprocedures. The Division consists of the following Groups:
Radiation Source and Instrumentation Division• Accelerator Research• Linac Operations• Electronic Instrunentation• Mechanical Instrinentation
in the standardization of nuclear instrunentation; and developsnew competence in radiation sources and instrunentation. TheDivision consists of the following Groups:
Develops, operates, ana improves major Nbi raaiation raci iniesincluding the electron Linac and race track microtron; develops,designs, and builds electronic and mechanical instrunentation forraHiatinn nrnnrarK: 3nH fflrilitip«;r nrnvidp"; natinnal Ifadprshio
Ionizing Radiation DivisionOffice of Radiation MeasurementRadiation TheoryRadiation Chemistry and Chemical
DosimetryNeutron Measurements and ResearchNeutron DosimetryRadioactivityX-Ray PhysicsDosimetry
Provides primary national standards, measurement services, and basicdata for applications of ionizing radiation; develops new methods ofchemical and physical dosimetry; conducts theoretical and experimentalresearch on the fundamental physical and chemical interactions ofionizing radiation with matter; provides essential standards and
measurement support services to the National Measurement SupportSystem for Ionizing Radiation; and develops and operates radiationsources needed to provide primary radiation standards, fields, andwell-characterized beams of radiation for research on radiationinteractions and for development of measurement methods. The Divisionconsists of the following Office and Groups:
Nuclear Physics GroupEngages in forefront research in nuclear and elementary particle physics;performs highly accurate measurements and theoretical analyses whichprobe the structure of nuclear matter; and improves the quantitativeunderstanding of physical processes that underlie measurement science.

NBS MEASUREMENT SERVICES:CALIBRATION OF BETA-PARTICLE-EMITTING OPHTHALMIC APPLICATORS
John S. Pruitt
Center for Radiation Research
National Measurement Laboratory
National Bureau of Standards
Gaithersburg, MD 20899
U.S. DEPARTMENT OF COMMERCE, Malcolm Baldrige, Secretary
NATIONAL BUREAU OF STANDARDS, Ernest Ambler, Director
Issued July 1987

Library of Congress Catalog Card Number: 87-619844
National Bureau of Standards Special Publication 250-9
Natl. Bur. Stand. (U.S.), Spec. Publ. 250-9, 36 pages (July 1987)
CODEN: XNBSAV
Commercial products— materials and instruments— are identified in this document for the sole pur-
pose of adequately describing experimental or test procedures. In no event does such identification
imply recommendation or endorsement by the National Bureau of Standards of a particular product;
nor does it imply that a named material or instrument is necessarily the best available for the purpose
it serves.
U.S. GOVERNMENT PRINTING OFFICEWASHINGTON: 1987
For sale by the Superintendent of Documents, U.S. Government Printing Office, Washington, DC 20402-9325

PREFACE
The calibration and related measurement services of the National Bureauof Standards are intended to assist the makers and users of precisionmeasuring instruments in achieving the highest possible levels ofaccuracy, quality, and productivity. NBS offers over 300 differentcalibration, special test, and measurement assurance services. Theseservices allow customers to directly link their measurement systems tomeasurement systems and standards maintained by NBS. These servicesare offered to the public and private organizations alike. They aredescribed in NBS Special Publication (SP) 250, NBS Calibration ServicesUsers Guide .
The Users Guide is being supplemented by a number of specialpublications (designated as the "SP 250 Series") that provide a
detailed description of the important features of specific NBScalibration services. These documents provide a description of the:
(1) specifications for the service; (2) design philosophy and theory;
(3) NBS measurement system; (4) NBS operational procedures; (5)
assessment of measurement uncertainty including random and systematicerrors and an error budget; and (6) internal quality control proceduresused by NBS. These documents will present more detail than can be
given in an NBS calibration report, or than is generally allowed in
articles in scientific journals. In the past NBS has published suchinformation in a variety of ways. This series will help make this typeof information more readily available to the user.
This document (SP 250-9), NBS Measurement Services: Calibration ofBeta-Particle-Emitting Ophthalmic Applicators, by J. S. Pruitt, is theninth to be published in this new series of special publications. It
describes the calibration of ophthalmic applicators used in medicaldosimetry for treatment of conditions that can be corrected with theshallow-dose exposures available from beta-particle radioactivesources. The calibrated quantity is the surface absorbed-dose rate towater averaged over the active area of the source (see test number
47030C in the SP 250 Users Guide). Inquiries concerning the technicalcontent of this document or the specifications for these servicesshould be directed to the author or one of the technical contacts citedin SP 250.
The Center for Radiation Research (CRR) is in the process of publishing
21 documents in this SP 250 series, covering all of the calibrationservices offered by CRR. A complete listing of these documents can be
found inside the back cover.
NBS would welcome suggestions on how publications such as these might
be made more useful. Suggestions are also welcome concerning the need
for new calibration services, special tests, and measurement assurance
programs
.
George A. Uriano Chris E. Kuyatt
Director Director
Measurement Services Center for Radiation Research
1 ^ 1

ABSTRACT
This service provides calibrations for ^^Sr + beta particleophthalmic applicators. The calibration determines the averagesurface absorbed-dose rate to water over the active area of theapplicator. The technique used is to measure current per unit massof air at the active surface with an extrapolation ionizationchamber, and to convert this into absorbed-dose rate with Bragg-Graycavity ionization theory. The extrapolation chamber measurementsare made in three parts. In the first part, a 1 mm diameter probeelectrode is used to map the relative dose rate across the source
surface, and to determine the active area. In the second part, theprobe electrode is replaced by a 30 mm diameter electrode, and the
test applicator is replaced by an NBS-owned applicator for qualityassurance measurements. In the third part, the 30 mm electrode is
used with the test applicator to determine the extrapolation curveslope at the source surface. The ratio of this slope to the source
area, divided by the air density, yields current per unit air mass.
The transformation to absorbed-dose rate is described. Thecomponent uncertainties are listed and are shown to yield a total
uncertainty of ± 15%, with the approximate significance of a 95%confidence limit. Data book measurements and a calibration reportare given for one particular applicator.
Key words: absorbed dose rate; calibration service; extrapolation chamber;
ophthalmic applicator; quality assurance measurements; surface
dose rate.
iv

CONTENTS
Page
Abstract iv
List of Figures v1
1. The Calibration Service 1
2. The General Approach 2
3. Description of the System 3
4. Operational Procedures , . . . 10
4.1 Current measurement and correction 10
4.2 Measurement of source area A 12
4.3 Quality assurance measurements 16
4.4 Current per unit air gap 18
5. Surface Absorbed-Dose Rates 19
6. Calibration Uncertainty 20
References 21
Appendix A. Examples from a databook A-1
Appendix B. Sample calibration report B-1
V

LIST OF FIGURES
Page
Fig. 1. NBS-owned ophthalmic applicator SN 0258 1
Fig. 2. Electron energy spectrum from a ^^Sr + ^^Y source 2
Fig. 3. Cross section of 30-mm diameter collecting electrode unit,showing relative position of high voltage electrode and
applicator 3
Fig. 4. Front view of extrapolation chamber and source support structure 5
Fig. 5. Side view of extrapolation chamber and source support structure 6
Fig. 6. Cross section of 1-mm diameter collecting electrode unit ... 7
Fig. 7. Front view of extrapolation chamber housing and measuringinstruments 9
Fig. 8. Variation of ion current and parasitic current acrossapplicator SN 0136 11
Fig. 9. Currents measured with the probe electrode across the face of
SN D-402, plotted as a function of radius, measured from the
center of the current distribution 14
Fig. 10. Theoretical probe profiles for five different source distances,
n = Az/R 15
Fig. 11. Measured probe profiles of applicators SN 0258 and SN 157, in
comparison with theoretical predictions for uniformlydistributed sources 16
Fig. 12. Front view of extrapolation chamber showing source supportstructure retracted for quality assurance measurements .... 17
vi

1. The Calibration Service
This service is intended to provide calibrations for ^^Sr + beta-particle applicators used in medicine for treatment of ophthalmic conditions.It was started in 1977. A typical ophthalmic applicator is shown in figure 1.
It is a New England Nuclear Model NB-1. The National Bureau of Standards(NBS) owns an NB-1, serial number 0258. The quantity chosen for calibrationis the average surface absorbed-dose rate to water over the active area of the
source. If an applicator is immersed in water, or placed on a water-likematerial , such as tissue, the surface absorbed dose rate to water is the rate
at which energy is absorbed by water from the beta particles, per unit mass of
water, at the surface of the applicator. The applicators accepted for
calibration generally have activities between 370 MBq (10 mCi ) and 7.4 GBq
(200 mCi ) . (The corresponding range of surface absorbed-dose rates is fromabout 0.1 Gy/s to about 2 Gy/s.) Activities less than 370 MBq are not veryuseful because of thejong times required to obtain biologically significantexposures, while activities larger than 7.4 GBq would- produce radiationprotection problems for the persons using and calibrating the applicator. The
stated uncertainty is ± 15%, with the approximate significance of a 95%confidence limit.
Welds
A 0.08 mm thick SS foil
B Porous glass disc infused with
radioactive material
C Aluminum Spacer
D 6.35 mm diameter handle
E 10cmX10cmX5 mm plastic shield
Fig. 1. NBS-owned ophthalmic applicator SN 0258.
1

This service was called 8.4K in the old SP250 manual. The designation
has been changed to 47030C in the 1986 version of SP250.1 The latter also
contains instructions for shipping and handling the applicators.
A report entitled "Calibration of Beta-Particl e Ophthalmic Applicators at
the National Bureau of Standards" has been published in the Journal of
Research of the NBS.2 It contains much of the information given in thisreport. Examples from a data book are given in Appendix A, and a samplecalibration report is given in Appendix B.
2. The General Approach
The average surface absorbed-dose rate to water is determined from
ionization-chamber measurements in air, and converted to water with Bragg-Graycavity-ioni zation theory, a routine conversion described in detail in
section 5. Water was the medium chosen for calibration because it is
universally available and its properties are close to those of tissue. Theprimary alternative method of calibration uses thermoluminescent dosimeters,but this method was rejected because these dosimeters must be calibrated witha different radiation source. Use of the Bragg-Gray theory requires knowledgeof only a well-known constant, the energy required to produce unit ionizationin air, and the ratio of average stopping powers for water and air. Thisratio can be calculated from tabulated stopping powers if the beta-particleenergy spectrum is known. Figure 2 shows a typical strontium 90-yttrium 90
energy spectrum. It was obtained with a 5-mm-deep silicon surface-barrierdetector at room temperature in air, under 0.013 mm of aluminized polyethyleneterephthal ate. The measurements were made at a distance of 11 cm from a
Buchl er-Amersham source, and have not been corrected for either backscatter orself-absorption. The spectral shape need not be known with great precision,however, since stopping-power ratios vary slowly with beta-particle energy.
1600 11 1 1 1 1 r
Electron Energy, MeV
Fig. 2. Electron energy spectrum from a ^osp + goy source.
2

The determination of average surface absorbed-dose rate is performed in
two steps using ionization chambers of different diameters, because two
quantities need to be measured. The total current per unit air gap at the
source surface, (I/d)^, is measured with an ion chamber at least two6-particle ranges larger in diameter than the active area of the source; the
active area A of the source is determined by mapping with an ion chamber muchsmaller in diameter than the diameter of the active area. In practice, thetwo measurements are made with the same ionization chamber, but the size of
the collecting electrode is changed. The average surface absorbed-dose rate
is directly proportional to the ratio (I/d)p/(pA), where p is air density.This ratio has dimensions of current per unit mass of air (A/kg).
The general plan of the calibration is to measure ionization current perunit mass of air with the applicator at several distances from the center of
the ionization chamber air gap, and to extrapolate to zero distance and zero
air gap to obtain a value at the surface of the applicator. Sections 3 and 4
are concerned with this determination of extrapolated current per unit mass of
air. Section 5 describes the calculation of the absorbed-dose rate, and
section 6 is a discussion of the uncertainties inherent in this calibrationmethod.
3. Description of the System
The extrapolation ionizationchamber is essentially the same
as that described by Loevingerand Trott,3 with severalcollecting electrodes which can
be interchanged and a thin
al umi ni zed-pl asti c-f i 1 m high-voltage electrode. The relativeposition of the electrodes and an
ophthalmic applicator under studyare shown in figure 3. The
extrapolation chamber itself is a
parallel plate capacitor of
variable plate separation, d.
The guard electrode is groundedand the collecting electrodepotential is very close to
ground. In this condition, thelines of force are perpendicularto the collecting electrode, and
the collecting electrode receivesonly charged particles that havebeen generated in the cylindricalair volume defined by d and thecollecting electrode area, A^..
The extrapolation chamber has
means for both changing d and formeasuring this change, but doesnot provide an absolute measureof d itself without extrapolation
Fig. 3: Cross section of 30-mm diametercollecting electrode unit,showing relative position of
high voltage electrode and
appl i cator.
3

The particular collecting electrode shown has a diameter of about 30 mmand is surrounded by a guard electrode with an outside diameter of 50 mm.
Both guard and collecting electrodes are made of 8-mm thick A-150 conductingplastic, electrically isolated with 30-um plastic film held in place withepoxy cement. The high-voltage electrode is Mylar aluminized on the insidesurface, with a diameter of 70 mm and a thickness of 0.7 mg/cm^ (about 5 i\m)
,
Figures 4 and 5 are respectively a 3/4 front view and a side view of theapparatus, showing the extrapolation chamber above and the NBS ophthalmicapplicator SN0258 below. (The applicators in figures 4 and 5 have beenretracted from their normal position by about 3 cm for clarity.) The extrapo-lation chamber housing is mounted on the underside of the 6-mm thicktriangular brass top plate, which is supported on three 19-mm diameter brassposts. The lower half of this housing, including the bronze ring on which thecircumferential scale is engraved, the captain's wheel, and the mylar HV
electrode foil, can be rotated to change d, the chamber plate separation.Each complete revolution of the captain's wheel changes d by 0.635 mm
(40 turns/inch). The internal collecting-electrode-guard-electrode unit offigure 3 cannot be seen in figure 4, but it rests on three brass supportsrigidly attached to the top plate in figure 4.
The orientation of the captain's wheel, uniquely related to the plateseparation d, can be specified by a single number, the angle of rotation(which may increase to many multiples of Zir radians). In practice, that angleis broken down into two related components, 9 and g. The number e is one-
hundredth of the number read from the circumferential scale shown in figure 4.
This scale consists of 100 divisions, so e varies from 0 to 1 in one revolu-tion. The number g is read from the dial gauge visible at the top of
figure 4. There are two scales on the dial gauge. The large scale is dividedinto 100 divisions, with 0.001 inches per division. The small scale is
divided into 10 units, with 0.1 inches between units. The dial gauge reading
g is the sum of the small gauge reading, a whole number, and the large gaugereading, a fraction between zero and unity. Its units are tenths of an inch.
The two numbers g and e can be related by setting 9 to zero and then
rotating the dial gauge until the large needle points to a multiple of 0.25(four revolutions of the captain's wheel are equivalent to one revolution of
the large dial gauge needle). Then the electrode separation, in mm, can be
written
:
d = 2.54 (gg - g) where 9 =9i
-f (D
and gg is the dial gauge needle reading when d = 0. g^ is the closestmultiple of 0.25 larger than g (for two examples, if g = 5.173 (or 4.635),
g^ = 5.25 (or 4.75), and e = 0.308 (or 0.460)). gg must be measured by
extrapolation, as described in the next section.
The collecting electrode shown in figure 3 has a much larger area than
the active area of all ordinary ophthalmic applicators, which have diameters
between 6 mm and 9 mm. This type of collecting electrode is used to determinethe ratio (I/d)Q, where I is the ionization current generated in the air
volume defined by the collecting area A^. and the electrode separation d. The
ratio I/d is a function of both d and the applicator distance Az, and the zero
subscript refers to the limiting case where both d and az are zero. Thislimiting value of I/d is a characteristic of the source and of the electrodematerial and is independent of A^., if A^- is sufficiently large.
4

5

• Extrapolation chamber
Fig. 5: Side view of extrapolation chamber (above) and source supportstructure. NBS applicator SN 0258 is shown.
6

For measurements of the sourcearea A, the collecting-electrode-guard-el ectrode unit of figure 3 can
be lifted out of the extrapolationchamber and replaced by a unit with
approximately the same outline but
with a much smaller collecting elec-
trode, shown in cross section in the
upper diagram in figure 6. This
probe electrode is a 0.6-mm-di ameterpencil lead, shown as a solid black
vertical strip in both upper and
lower parts of figure 6. It is
surrounded by a 0.4-mm-thick insula-ting ring of epoxy resin, giving an
effective probe diameter of about
1 mm. The probe is surrounded by a
graphite guard ring, 19 mm in
diameter. This in turn is sur-
rounded by a 50-mm-di ameter acrylicring that is recessed from the
surface of the graphite by about0.4 mm. The graphite guard ring is
grounded through a graphite coatingon the acrylic ring.
The probe electrode is morecomplex than the 30-mm electrodebecause of the special precautionstaken to make the 0.4-mm epoxy ring
of uniform thickness. The lowerdiagram in figure 6 shows how this
was achieved with alignment holeswhich were eventually removed. The
alignment holes are in graphite,outside the two Finish Planes,completely filled by the pencil
lead. After the epoxy has dried,the unit is machined until it lookslike the graphite-epoxy insert in
the upper diagram. It was necessaryinsulator, from which the bubbles hadcentri fuge.
Fig. 6: Cross section of 1-mm diametercollecting electrode unit (top)
and the technique used to
center pencil -lead collectingelectrode (bottom). Aftermachining, only the materialbetween the two finish planesremains.
0 use a slow-drying epoxy for the
been removed by spinning in a
The ophthalmic applicator can be moved in three perpendicular directions.The x and y motions (along axes shown in fig. 3) are provided by the micro-scope stage, and are controlled by two horizontal rods with knurled knobs at
the ends. These rods are a safety measure, allowing the x and y positions tobe set to within ± 0.05 mm without excessive radiation exposure to thefingers. Motion along the z axis (perpendicular to the x-y plane) is con-trolled by the vertical barrel micrometer shown just to the right of theapplicator in figure 4. While changing az, the operator's fingers areprotected both by the brass plate on which the microscope stage is mounted andby the 1/4-inch-thick plastic shield attached to the applicator handle.
7

During measurements of both (I/d)^ and A, the source surface must be
raised until it touches the extrapolation chamber high-voltage-electrode foil.(This does not produce a short circuit since only the inner foil surface is at
high voltage.) For determination of the zero-separation dial -gauge reading
gg, or for source insertion and removal, the source support structure has to
be retracted by about 20 cm. These large changes in the z coordinate areproduced by releasing the three rapid retraction screws shown in figure 5 andsliding the microscope-stage down on the three vertical steel rods shown. Thebarrel micrometer is used only for fine control of az.
Figure 7 shows both the apparatus and the measuring instruments. Theapparatus, at the right in figure 7, is surrounded on three sides by a 3/8-inch-thick transparent plastic housing, intended for radiation protection of
the operator who sits facing the front panel. His hands can be inserted intothe housing for source and/or chamber manipulation through doors on eitherside. The operator's torso and face are always protected by 3/8-inch of
plastic. The applicator shown inside the housing in figure 7 has been coveredwith a lead cap, to protect the operators fingers during source/chamber mani-pulation. This lead cap was put in position with the tongs shown lying on thebottom plate of the apparatus in figure 7.
The extrapolation-chamber collecting electrode is connected via low-noisecoaxial cable to the input of a Keithley 610C electrometer. This instrumenthas a dial readout that is usually turned off. In its place, a Digitec 266 DCvoltmeter (DVM) provides a digital readout of the electrometer feedbackvoltage. The XI Output of the 610C is connected to the Hi terminal of theDVM, and the Guard terminal of the 610C is connected to the Lo terminal of theDVM. The 610C is used with the Feedback switch set to Fast, and the modeswitch set to lO'^, lO-^, or lO-io coulombs full scale.
Underneath the electrometer in figure 7 is a locally made DVM timer,which controls the Digitec DVM display. The timer output is connected to
terminals D6 on the DVM card-edge connector, so that the DVM displays theinstantaneous electrometer feedback voltage only when it gets a positive pulsefrom the timer. The front panel of the timer contains an ERC counter, an ITC
comparator, and a Start button. When the Start button is pushed, the timergenerates a pulse, the DVM displays an initial voltage, and the counter startscounting elapsed time. When the counter reaches the pre-set comparatornumber, it generates a second pulse, the DVM displays a final voltage, and thecounter stops counting. For the particular timer shown in figure 7, the time
unit for both counter and comparator is centi seconds. (For some of the local
DVM timers, the time unit is milliseconds.)
Underneath the Digitec DVM is a high-voltage power supply, connectedbetween the chamber high-voltage electrode and ground. This is a KeithleyModel 240A, which can provide from 0 to 1200 volts potential of eitherpolarity. (Although this power supply could be replaced by one delivering 0
to 100 V, both the amplitude and the stability of the 240A have provenadequate.) The voltage is connected to the chamber high voltage electrode by
means of the brass rod shown at the upper right in figure 5, which makes a
sliding contact with a brass ring mounted on insulators above the captain'swheel. The voltage selected in any given situation depends on the electrodeseparation d. During extrapolation measurements, a constant potentialgradient is maintained, since this both minimizes the corrections and exerts a
8

E t_
O O)i- (->
4— O)
O) o00 t_
•r- 4->
3: O^ OJo .—o <u
on •>
-t->
c: ^O) =»e oZ3 — •
£_ C_-!-> t- (1)
00 OJ 4_>
c -(-> o;•r- a; e
E oC7> +-> L_
•r- Ot_ >=3 -aV) I T-fC fO o<D -M t-
E -r- OJCD C
fT3 ^.—- C\J4_) —
'
-c -a
•r— t_ (tJ
c_ O)— 4^ "
OJC7) E r—C O Q-
E Q-oo t- :33 0) onO -£r
jz: +-> £_
t- — "SOJ '—I o—' Q-EfO O) O)^ £_ cno 13 fO
+->
cr 00 ,
—
O -M O•1— c >
E -C,— 13 O)O -r-Q. 4-> ^fO 00L C^4_) -I— tnX --^
4- +-> e.
O OJ•> E
S +-> -r-
OJ <4- +J•r- (U> I— C
C O)o o.^u_ —
cn
9

constant force on the flexible high voltage electrode. It has been found that
electrode flexure is negligible if the voltage gradient does not exceed
40 V/mm. Measurements have been made successfully with gradients between
10 V/mm and 40 V/mm. Corrections have to be applied in all cases, as
explained in a later section.
The two instruments at the extreme left-hand side of figure 7 are fordetermining the relative air density inside the chamber. The lower instrumentis a Wallace and Tiernan Model FA139 aneroid barometer, which reads ambientair pressure in units of millimeters of mercury (mmHg). The upper instrumentis a Yellow Springs Instrument Co. Tele-Thermometer, to which is attached a
long cable with a temperature probe at the end. This probe usually sits in
the chamber well, immediately above the brass backing of the collecting-electrode-guard-electrode unit, and gives an approximate measure of thechamber air temperature.
4. Operational Procedures
This section contains descriptions of the measurement procedures for bothcurrent per unit air gap, (I/d)Q, and source area. A, as well as correctionformulas and quality assurance measurements. An example of data collectionand analysis is given in Appendix A, taken directly from databook 863.
Appendix B shows the report issued for this particular ophthalmic applicator.
4 . 1 Current measurement and correction
The extrapolation chamber current measured in amperes during a run is:
V - V
1 = 0.-4^ (2)
where: C is the electrometer capacitance, in farads,
Vj and Vp are initial and final DVM voltage measurements, in volts.
At is the run time, in seconds, determined by the DVM timer.
The value of the capacitance C must be determined for each electrometerscale by independent measurements. For the particular electrometer shown in
figure 3, NBS #184539, the capacitances measured in March 1982 were:
Full-scale (C) Capacitance (pF)
10-8 10,000.
10-9 1,011.9
10-10 103.94
(These numbers have changed by several tenths of 1% from earlier measurementsin 1979.) Each voltage determination is the product of a DVM reading and a
DVM correction factor. For the DVM of figure 7, NBS #183047, the correctionfactor measured on 86 Feb 21 for the 2-V (or 20-V) scale is 0.9977 (0.9991).(These have changed by 0.1% (0,1%) over the course of 3 years).
10

The measured current is the sum of two components, an ion current
generated in the chamber air gap by interaction between air molecules and the
incident beta-particles, and a parasitic current generated in the body of the
collecting electrode by beta-particles coming to rest. These two componentscan be separated by making measurements with both positive and negative
high-voltage polarity. The ion current component will change sign when the
polarity changes, while the parasitic component will not.
If 1+ and I- are currents measured with positive and negative polarityrespectively, the ion current is:
where I~ is normally a negative number. The parasitic current is (I"^ + I~)/2
and may be either positive or negative. It has no immediate application, but
is usually recorded because abrupt changes may indicate measurement problems.
The data tabulated in Appendix A are good examples of the normal range of
variation of the parasitic current, labeled Tg. Page 136"lists data taken
with a 30-mm diameter collecting electrode such as shown in figure 3. The Tgmeasurements in this case show a normal progression from about -40 pA to about-38 pA as the chamber air gap increases from 0.5 mm to 2.5 mm. Departuresfrom this progression by 20% or more usually indicate that one of the systemelectronic components is malfunctioning.
Figure 8 shows thevariation of both the ion
and parasitic currentsacross the face of the mostasymmetric applicator thathas been studied in thislaboratory. The measure-ments were made with the
probe electrode, using anelectrode spacing, d, of
0.05 mm and an applicatordistance, az, of 0.4 mm.The asymmetry of the ion
current is presumablycaused by an uneven dis^tri-
bution of activity acrossthe applicator face. Thetails of the ion currentdistribution are caused bybeta particles that leavethe applicator with largevelocity components perpen-dicular to the beam direc-tion. The tails rapidlybecome more prominent as
the applicator distance Azincreases.
Fig. 8:
10 20 30
DISTANCE ACROSS SOURCE , mm
Variation of ion current and parasiticcurrent across applicator SN 0136.
11

The graph of parasitic current in figure 8 shows evidence both of
electrons coming to rest in the collecting electrode (the central peak of the
distribution), and background (the negative tails). The central peak of the
parasitic current is more symmetrical than the ion current peak, probably
because of multiple scattering of the primary beam in the plastic backing of
the electrode, which tends to round off the edges of the distribution. The
parasitic background is a current of about 10-50 fA. The ion current
background is negligible.
The ion current calculated with eq (3) must be multiplied by two
correction factors, one to correct air density inside the chamber to 22°C and
760 mmHg, and the other to correct for ion recombination and diffusion inside
the chamber. These factors are given by:
f ^ 760 (T + 273.15) , .^
^temp 295.15 P ^'
Where T is the temperature in degrees Celsius and P is the pressure in mmHg;
f rn 50.5 Id w., 0.0044 sr, in-suL-i-^Zlil^^i i'^ t a\
^ecom= -""^^^^ -"Y~H1 - (17.24 X 10 5)( )]} (5)
where I is ion current in nA, d is electrode separation in mm, A is sourcearea in mm^, and X is potential gradient, in V/mm. Equation (4) comes from
the ideal gas law, and eq (5) comes from Bcrhm,** with bracketed terms for
general recombination, initial recombination, and diffusion, reading from left
to right. (For the data listed on p. 136 of Appendix A, as the chamber air
gap increases from 0.5 mm to 2.5 mm, the general recombination term decreasesfrom 0.9996 to 0.9911, the initial recombination term holds steady at 0.9998,and the diffusion term increases from 0.9949 to 0.9990.)
4.2 Measurement of source area A
This operation is performed with the small collecting electrode, or probe(fig. 6), using a fixed small air gap d (fig. 3), and with az just slightlylarger than d/2. Current measurements can be made at different points in thex-y plane over a large enough area so that the current drops to less than halfits maximum value in all directions. If the x-y plane, determined by themicroscope stage, is parallel to the plane of the chamber high-voltageelectrode, this mapping can be done with no change in Az. These planes areseldom parallel, however, because the rapid retraction mechanism described in
section 3 (for large changes in az) is only a crude adjustment. With thevertical position az set so that the applicator is close to but not touchingthe HV electrode foil when the applicator is centered, the changes in x and ythat occur during mapping of the source may cause the applicator to run intothe electrode, diminishing the air gap in the chamber and reducing the chambersensitivity.
The operator can avoid this effect by simply sighting by eye to determinewhen the applicator is close to the HV electrode foil, independent of thebarrel micrometer readings. A simple test can be run once, to get a feel forwhat the position of the two components looks like when they are too close.
12

With the applicator and HV-electrode foil just barely separated by eye, the
operator can measure the ion-chamber current, reduce the separation by 0.01 mmusing the barrel micrometer reading, repeat the current measurement, etc. It
will be found that the current increases slowly as Az is reduced, until thetwo components touch. With further reduction of az, the current dropsrapidly.
For most ophthalmic applicators, the uppermost surface is not flat, as
shown in figure 3, but slightly convex. The orientation of the applicatorshould be such that the convex surface would be first to touch the HV elec-trode when AZ is reduced to d/2. In extreme cases, the head of the applicatoris cocked relative to the handle, so that the rim of the surface meets the HV
electrode first. In such cases, it may be possible to compensate for this
awkward alignment by tilting the source-support plate, depressing one or moreof the three fittings attaching it to the vertical steel rods.
In preparing for source-area measurements, it is necessary to find g^,the d = 0 point on the dial -gauge scale. This can be done with the source in
position, but retracted by about 20 cm. In this condition, the correctedcurrent is a linear function of d, and the d = 0 point can be determined by
measurements with several air gaps and linear extrapolation to zero current.The corrections required are the two listed in the preceding section, ^^q^qand fpeQom* P^^^ ^ third factor that corrects for scatter from the sidewalls
of the chamber, and a fourth factor that corrects for attenuation in the air
between source and chamber. These extra factors are appreciable only when thesource-chamber distance is large. At 20 cm, the empirical formulas for thesefactors are:
f ^ = 1 - 0.0094 d (6)scat ^ '
where d is the chamber air gap in mm, and:
f = (1 + 0.077 h - 0.335 h2)-iatten ^
h = 1 - (f^ )-i. (7)
^ temp^
Equation (6) was derived by increasing the thickness of scattering material,and eq (7) comes from experiments at reduced atmospheric pressure. ^ (There is
no need to determine g^ each time the probe electrode is used. Its value may
change slightly when this electrode is removed and replaced, but the sourcearea measurement is insensitive to this change.)
The mapping itself consists of repeated measurements with different x and
y coordinates but with similar az = d/2. The air gap d should be reduced to
0.1 mm or 0.2 mm, with the chamber voltage gradient set for about 20 V/mm,
For each change of x and/or y, the applicator must first be retracted(az > d/2) and then returned to az = d/2 after the change, because the x-yplane and the HV foil plane are not parallel. The theoretical description of
the chamber current given in eq (8), below, can be used to show that small
variations in az have a negligible effect on the measured currents.
13

If Xq and y are the values of x and y with the applicator centered by0
eye relative to the collecting electrode, it has been found that 36 current
measurements at '2-mm intervals over the ranges Xq-5 < x < x q"*"^
yQ-5 < y < Yq+S cover a large enough area so that the current drops to less
than half its maximum value in all directions. (In the Appendix A example,
the array of current measurements is plotted at the top of p. 135.) Along
each X = constant (or y = constant) line there are two values of y (or x) for
which I = Ij^^^/2. These two y^, (or X;,) values can be calculated by linear
interpolation, and their average is a measure of one coordinate of the center
of the distribution, y^. (or x^). This may or may not coincide with the
originally estimated center coordinate yQ (or Xq). At the end of the mapping
measurements, an averagey^^
example, yi, and Xi, are listed
and X. are listed as y^,, andc avThe averages = 35.45 mm
and x^ can be calculated. (In the Appendix A
on 135 as y~ and x~, while the values of y.
av cand x^ = 121.88 mm, are not far
from the original y^ = 36.0 mm
and Xq = 121.2 mm.) I is
plotted as a function of
r = /(x - X(-)2 + (y - yj-)2, as
shown in figure 9 for a
particular applicator. (In
the Appendix A example, this
plot is at the bottom of
p. 135.)
For most applicators, the
current decreases monotonical ly
with increasing radius as in
figure 9. A 50% radius R" can
be read directly from the
graph, and the area calculated
from this as TrR"^. This is a
close approximation to the real
area itR2 if the chamber spacing
d, and source distance Az, are
both sufficiently small. A
rough estimate of uncertainty
for a given d and az can be
obtained from the following
equation describing the Fig. 9;
ionization current per unit
mass of air as a function of
position:
3.0
RADIUS,mm
Currents measured with the probe
electrode across the face of
SN U-402, plotted as a function
of radius, measured from the
center of the current distribu-
tion. The curve was drawn
freehand.
14

dm (8)
where in terms of the coordinates of figure 1, y = r/R, n = Az/R,
r = /x2 + y2, and K is a constant.
This equation was derived by the author assuming that the activity is
spread uniformly over a circle of radius R on the source surface, that the
beta-particles are emitted i sotropi cal ly from the source surface, that theirpaths are straight, and that energy deposition is uniform along these paths.
The derivation is based on an A/r2 solid angle approximation where A is a
plane area, and consequently current per unit solid angle becomes infinite as
the distance approaches zero. If the current/volume is normalized to its
value on the central axis of the source (y = 0), the normalized current is
well behaved for all distances (that is, for all values of n).
Figure 10 is a plot of the norma_lized currents for several values of n.
For each curve, the apparent radius R is the product of the true radius R and
the value of jj where the curve crosses the half-value line. For n = 1,
Az_ = R, and ttR2 exceeds t7R2 by a factor of about 2. For n = 0.2 (not shown)
itR2 exceeds ttR2 by about 4%, and for n = 0.1, the difference is less than 1%.
Iri_ a typical case, d = 0.2 mm, Az = 0.12 mm, R = 4 mm, and n = 0.03, for whichTrR2/TrR2 = 1.001.
1.0
zLlJ
a:
OQ 0.5UJN
a:oz
1 1 1 1 1 1
—\ r—
1 1 1
yN/^s^-^r 0.001
0 0.5 ! 1.5 2
RELATIVE RADIUS /X= r/R
Fig. 10: Theoretical probe profiles for five different source distances,
n = Az/R.
15

SN 0258
THEORY
Figure 11 is a plot of probe ion current vs^. radius for two applicators and
matching source profiles calculated from eq (8). The parameter az was
assigned the approximate value 0.1 mm in the calculation, and values of
R = 3.18 mm and 4.35 mm were read from the graph. All four curves have been
normalized at the origin. Equation (8) is not an accurate description of
either source profile, but the comparison with the NBS owned SN 0258 is con-
sistent with the assumptionthat the activity in this
source is spread uniformlyover an area of 4.35-mmradius. The small differ-ences between theory and
measurement appear to be
easily explained. The
differences near r = R can be
attributed to the finite size
of the probe electrode. The
differences at larger radii
probably arise from the fact
that the activity in SN 0258lies below the applicatorface, so that the elementalsources cannot be treated as
isotropic at large angles.
This will cause the real
distribution to fall off morerapidly at large radii thanthe theoretical distribution.The activity in SN 157, in
contrast, appears to be
highly peaked at the center.
Fig. 11:
RADIUS
Measured probe profiles of
applicators SN 0258 and SN 157, in
comparison with theoretical predic-tions for uniformly distributedsources.
4.3 Quality assurance measurements:
After measuring the source area, the probe electrode unit (fig. 6) shouldbe replaced by the 30-mm electrode unit (fig. 3), and the source supportstructure should be retracted for a determination of gg, the d = 0 dial -gaugereading, for this electrode. The unknown source shoula be replaced by theNBS-owned SN 0258 applicator so that this determination can also serve as a
quality assurance test. It is necessary to mount the applicator in a positionthat is independent of the vertical position of the source support structure,which is not reproducible. This can be done as shown in figure 12. The
SN 0258 plastic shield should be pushed as close to the source end as
possible. The support structure should be retracted far enough so that theapplicator handle rests on the bottom plate in figure 10 when it is centeredin the hole as shown, but not far enough for the support structure itself totouch bottom. In this condition, small vertical motions of the supportstructure have no effect on the applicator position.
Extrapolation chamber current measurements should be made at each of thefive g settings listed below. The current measurements should be multipliedby five correction factors, the four already described by eqs (4) to (7), aswell as a decay correction factor:
16

Fig. 12: Front view of extrapolation chamber (above), showing source support
structure retracted for quality assurance measurements. NBS
applicator SN 0258 is shown with its plastic shield moved towards the
source.
17

Way = exp (X At) (9)
where At is the time since the reference date of 1986 Jan 1, and x is the
decay constant (6.659 x 10" ^ dayi for 90sr).
Finally, Qq should be determined by fitting the corrected currents to theequation:
I = Cq + c^g (10)
and calculating:
(11)
The numbers computed for I, Cq, c^, and g^ should be recorded. The datalisted below represents the first three sets of measurements made with theconfiguration shown in figure 12.
Captain's wheel Current, pAsetting, g Feb 20 Mar 21 Apr 3
4.682 1.990 2.013 2.022
4.485 3.939 3.969 3.974
4.288 5.948 5.968 5.982
4.092 7.951 7.977 7.961
3.895 9.923 9.939 9.967
^0 49.288 49.271 49.316
^1 -10.106 -10.097 -10.105
So 4.877 4.880 4.880
The measured currents increased with time, but not enough to change thecoefficients Cq and c, or the di al -gauge-zero setting by more than 0.1%.It is felt that all of these measurements were valid, but the reason for thecurrent increase is unknown. These periodic checks will continue, and the
results considered satisfactory unless g^ changes by as much as 1%. This
would correspond to a change of about 0.1 mm in the dial -gauge-zero setting.
4.4 Current per unit air gap :
Applicator SN 0258 should now be replaced by the unknown source, and thesource support structure raised until the source is near the extrapolation
chamber high-voltage electrode. Then with d = 0.5 mm, and x = x^, y = y^., the
barrel micrometer reading for which az = d/2 = 0.25 mm should be found, by
decreasing az until the current drops rapidly. Current measurements are thenmade for the 5 different air gaps d = 0.5, 1, 1.5, 2, 2.5 mm, with z = d/2 +
0.01 mm, for which the barrel micrometer readings are m = mg + d - 0.49. Thecurrent measurements should be corrected by the factors f^g^p and ^^qqq^ fromeqs (4) and (5).
^
18

The corrected current per unit air gap at zero air gap, (I/d)g, comesfrom fitting the five corrected currents to the equation:
I/d = (I/d)o (1 + a d + 6 d2) (12)
This extrapolation is only approximate for this poor-geometry determination.Sometimes a quadratic equation of this type fits the data very well andsometimes poorly. In general, a » -0.1 mm-i, and 6 0.01 mm-2.
5. Surface Absorbed-Dose Rates
The average surface absorbed-dose rate in water comes from the Bragg-Grayformul a
:
D ^ = ^^^TT^tH^ (I/d)n ^ ^ K ,
Gy/s (13)water 1.197 A 'o extrap back foil ^
'
where A is the source area in mm2 and (I/d)^ is the corrected current per unit
air gap at zero air gap, in nA/mm. In the above equation, 33.7 is the averageenergy in joules, needed to produce one coulomb of ions of either sign in
air,^ 1,124 is the ratio of the average collision mass stopping power of waterto that of air, '7 and 1.197 is the density of air at the reference temperatureand pressure, in kg/m^. The correction factors are:
'^extrap~ 0«98, a correction for systematic errors in the extrapolation
technique;
'^back" 1*010, a correction for difference between backscatter from water
and backscatter from TE plastic;
'^foil" 1*003, a correction for foil attenuation in the extrapolation
chamber entrance foil.
The (I/d)^ ratio from eq (12) depends on the extrapolation path to a
minor extent. For example, if the ratio Az/d had been maintained at 1 rather
than at 1/2, the measured (I/d)Q ratio would have been slightly smaller.Ideally, the ratio should be measured varying only d, with az = 0 throughout.The closest one can come to this ideal situation is to extrapolate I/d to zero
d for several fixed values of az and then extrapolate the zero-d limits to
zero AZ independently, the procedure described at the end of section 2.
However, this increases the calibration time by a large factor and has
consequently been replaced by the present techniques, where Az and d are
extrapolated to zero simultaneously. For applicator SN 0258, it was found
that the ideal (I/d)^ is 2% smaller than the value obtained with Az/d = 1/2.
This is the origin of the correction factor kg^^-^^p.
The backscatter factor was estimated from published formulas for back-
scatter probability as a function of atomic number and beta-particle energy.
^
Using the chemical formulation for the collecting electrode material, and the
source spectrum measured with the silicon detector, figure 2, the value for
'^back obtained.
The foil attenuation correction factor, k^Q^--] = 1.003, was determined
from measurements with extra thicknesses of 0.7 mg/cm2 aluminized foil.
19

6. Calibration Uncertainty
There is some uncertainty associated with each term of eq (13). Thosedetermined by extrapolation-chamber measurements with the 30-mm-diametercollecting electrode, such as (I/d)Q and k^Q^--| , have (relative) standard
deviations of the order of 0.1%. These are much smaller than the estimateduncertainties and are usually ignored. The estimated uncertainties are listedin the table below. Each is intended to be comparable to a (relative)standard deviation, in that the chance that the true value of the quantitylies within plus or minus the stated uncertainty is intended to be about 2 outof 3 (or, strictly speaking, there is a 2 out of 3 chance that the confidenceinterval generated in this fashion will cover the true unknown value of thequantity)
.
Rel ativeAbsorbed -dose-rate uncertainties Uncertainty
(%)
Instrumental 0.3
Average energy per ion pair 0.4
Stopping-power ratio 3
Rate of change of current, (I/d)g 3
Extrapolation correction, k .
^ extrapBackscatter correction, k^^^|^
Attenuation correction, k.foil
Source surface area, A
1
1
<0.1
6
Combined uncertainty (quadratic sum) 7.5
Overall uncertainty (combined x 2) 15
The instrumental uncertainties include voltmeter readings, capacitancemeasurements, and pressure and temperature determinations. The uncertainty in
W/e comes directly from reference 6. The stopping-power-ratio uncertaintyincludes uncertainties in the stopping-powers themselves plus uncertainties in
the beta-particle spectra. The uncertainty in {1/6) q is an estimate of thereliability of a quadratic fit to an extrapolation curve with Az = d/2. The
uncertainties in the three k factors are all estimates based on the size ofthe corrections and on how carefully they were measured. The uncertainty in
surface area is a (relative) standard deviation, based on repeated measure-ments for several sources, using the normal 2-mm grid.
When the uncertainties are combined in quadrature to obtain a combineduncertainty, the result is ± 7.5%. This number is an approximate (relative)
standard deviation. Doubling it gives an overall uncertainty of ± 15% which
can be interpreted as having the approximate significance of a 95% confidence
1 imi t
.
The surface area uncertainty is dominant in table 1 and is the only onethat can be appreciably reduced at present. It can be reduced to about 1% by
mapping a normal source with a 1-mm grid, but this step is so much more time-
consuming that it is not offered as an NBS calibration service. In this case,
however, the combined uncertainty would be about ± 4%. This would lead to a
stated overall uncertainty of ± 8% with the approximate significance of a 95%confidence 1 imit.
20

REFERENCES
1. Calibrations and Related Services, National Bureau of Standards,
Spec. Publ. 250, Gaithersbury , MD 20899 (1986).
2. J. S. Pruitt, "Calibration of Beta-Particle Ophthalmic Applicators at
NBS," J. Res. Nat. Bur. Stand. (U.S.), 91, 165 (1986).
3. R. Loevinger and N. G. Trott, Int. J. Appl . Rad. Isotopes 17, 103 (1966).
4. J. Bahm, Physics in Med. and Biol. 21, 754 (1976).
5. J. S. Pruitt, Radiation Protection Dosimetry Ij^, 151 (1985).
6. ICRU Report 31, International Commission on Radiation Units and
Measurements (Washington, D.C., 1979). The value of W/e cited comes from
the value for dry air (33.85 J/C), modified by a humidity factor for
ambient air taken from Figure 5.14.
7. M, Berger and S. Seltzer, National Bureau of Standards Internal Report,NBSIR 82-2550A (1983); also as ICRU Report 37 (1984). The electronspectrum used was measured with a lithium-drifted silicon detector.
8. Tabata, Ito, and Okabe, Nucl . Instr. Methods 94, 509 (1971).
21


APPENDIX A. Examples from a data book
The examples given are four pages from data book DB863, pages 133-136.
These cover the calibrations of applicator SN176. The first three pages cover
the area determination, using probe electrode 0.5A, and the fourth page covers
the determination of (I/d)g, using 30-mm-el ectrode 30F. There were no
determinations of gg, the a = 0 dial -gauge reading, (The quantities called g
and g^ in this report have in the past been called i and £q.)
The values of gg used in the calibration of SN176 had been measured on
1983 Nov 11 for electrode 0.5A (g^ = 5.585), and on 1985 Apr 1 for electrode
30F (gg = 4.888).
The databook column headings and their meanings are:
time,n :
Real time on a 24-hour scale (i.e., 1436 is 2:36 p.m.). n is a doublenumber, a-b, where a is the number of initial runs not included in the
average and b is the number averaged (i.e., 1-5 means there were six
measurements, but only the latter five were averaged).equip :
A listing of the apparatus. On page 133, for instance, the numbersstand for:
0.5 A is the collecting electrode number
SN 176 is the applicator number
185325 is the NBS number of a Keithley 610C electrometer
103.13 pF is the measured capacitance on the scale used (10~^° coul
)
168929 is the NBS number of a Fluke 412B high voltage power supply
189695 is the NBS number of the comparator on the DVM timer
25 s is the comparator setting
183047 is the NBS number of a Digitec 266 DVM
2V is the DVM scale used
calk:
A listing of the quantities necessary to calculate currents from
measured voltage changes. They are stored in the memory of an HP41C
calculator in bins:
81: d, the chamber electrode separation, in mm
82, 83 and 84: a, B, and k , constants needed for f and f
85: A, either the active area of the source or the collecting
electrode area, whichever is smaller, in min^
86: X, the extrapolation chamber potential gradient, in V/mm
87: I/I(nA), a constant defining the units of the quantity I
88: At, the number of days away from the reference date
89: A, the source decay constant, in days-^
90: C/t, the ratio of capacitance to runtime. C = C x 10^2^
t = t X lO**". The exponent k is usually chosen so that C/t is
a number between unity and 10.
91: Cg, the DVM calibration correction factor
A-1
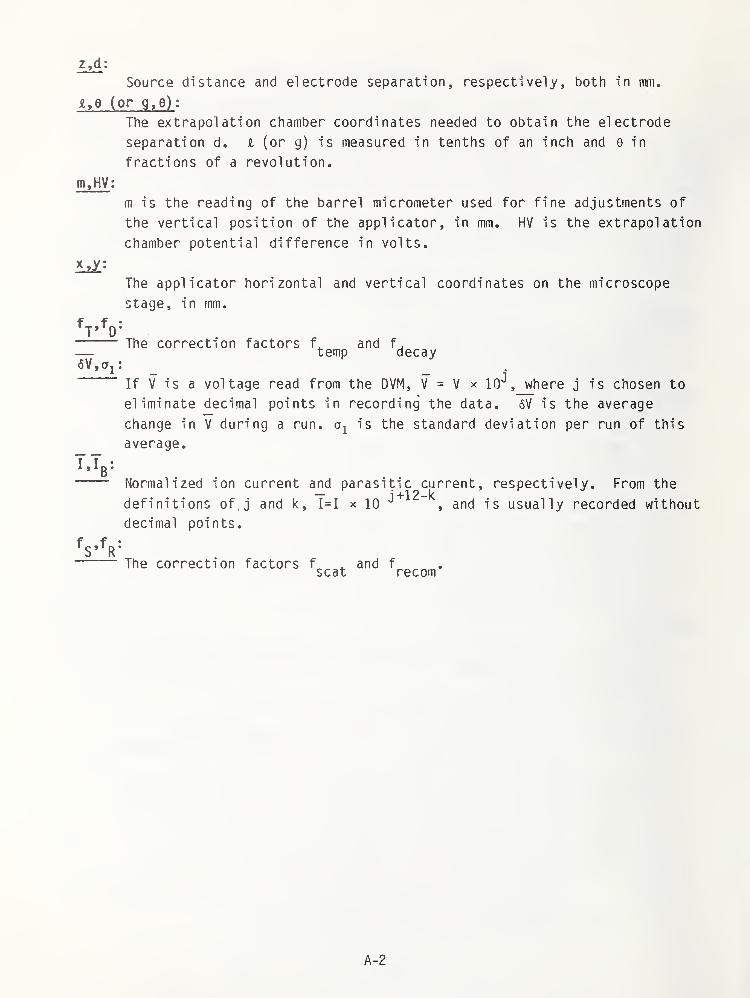
z,d :
Source distance and electrode separation, respectively, both in mm.
A, 9 (or g,e) :
The extrapolation chamber coordinates needed to obtain the electrode
separation d. i (or g) is measured in tenths of an inch and 6 in
fractions of a revolution.
m,HV :
m is the reading of the barrel micrometer used for fine adjustments of
the vertical position of the applicator, in mm. HV is the extrapolation
chamber potential difference in volts.
x,y :
The applicator horizontal and vertical coordinates on the microscope
stage, in mm.
The correction factors f. and f
.
temp decay
If V is a voltage read from the DVM, V = V x 10"^, where j is chosen to
eliminate decimal points in recording the data. 6V is the average
change in V during a run. o-^ is the standard deviation per run of this
average.
Normalized ion current and parasitic current, respectively. From the
definitions ofj and k, 1=1 x lo^'^^^'^
^ and is usually recorded without
decimal points.
The correction factors f . and fscat recom
A-2

NBS S06 —Analyalf pap«r90 1- 10?
GPO 9«7 0F— •404e«
U/»A^ / n- /I
/)
1
I A-ir/jo
g>-. <^.a
SN 17^^ . ( • 37« 7
bTi 6 77^— -T7<?4
^ i77^—-;3 7
'
177 iTHI' o.HW €,Oo •f 32/— I7i
-377 — -
-
Ho-
7^/
7f ._r3„--^•^-^
7<
7/
2_'^5_
17
1 \ -
7^
' -7
-
<?!"
-^7
BMC ^ 33 ^7
11-
<7l ^
7^'
~i/7
^l.i->jr- i
73
-.
I -111
if ^3
-mi
A-3

13^
NBS 506— Analytli paper
90 1- 10?cro i»i2 of
^ 1 J)
*J
1 / \ /
vn Hv ^ . -^T^h .
^/^H^ 0,1 l|«,2. 3V ' -
-1-77- - -
15", 75" 4. 7
1
-—
-
1 A 3 5
HI
^,L0 -t- <J27
-11
- 2)1,0 Oil
11^5',C'5 +_
s:c7 4- /I
-
—.
- 7.066-
£'.11 f "l/t'
— -•
-
HZT
S'M + v5 ,0
s.ci + '2 C" A 11 Zb^
( 0
—
•—
I V » f
.
^/.^)- 5l 117
1
-ii
-i'l?
"+
^11
' /
ST;!, CrOS'Z
s,Ld~ \.
"
"-is"?:'!
L'hCL
—
10
1
0 12fi
223
A-4

NBS 306—Analysis pap«r
GPO t»«2 or — •«048«
lij WW]
A-5

NHS .'>06— Analyilt paper
90 1- 10 •
CPO 1 9«2 OF — *404*«
r /n
r S- 4. ^ Hl=^== L
^)l
A
1
^ / ^ pJ / J
+ i\7
&n...
.._
ici^l. l pF o ->
,
....
•f
—- JAO
-14; ^^—
_
• J^c^ „
ACA
.——.
^fj 1 _
»- —--
LC^
7.7c ^Z^'
- .
.
1
t -fjo r^.1^7 +20
i<Hy Z «.7f_f \^\o \
Z- i y, /
1
\.66 7Sf IC^j
.-
i03C^ I
-
"I— \
),
CI ^; 1 ,2.6 X _ j__
-'
'"^^—rT".5/ \.0
JC (^^ (1,10 -iiC I.on?-3^1
1-6177
uu^ J 0^
• , _
— '17 7
—/./f,
A-6

APPENDIX B
OG 8420/86
OB 863/133TFN ?35324
1985 JUN 24
Pdge I of 2
IJ. S. DEPARTMENT OF COMMERCENATIONAL BUREAU OF STANDARDS
GAITHERSBURG. MO 20899
REPORT OF CALIBRATION
^^Sr Beta-particle Source
Submitted by
Technical Operations Source No,
RS #85-0879
176
Received at NBS on 1985 JUN 28
Calibration date 1985 JUL 10
Beta-particle sources are calibrated in terms of the absorbed-dose rate to
water. Absorbed-dose rate is determined from current measurements with an
extrapolation ionization chamber that has a tissue-equivalent-plastic collect-ing electrode. The water absorbed-dose rate is given by
f)_ 33 .7 ^ 1 .1 24 X B X U f4li r^,/<^ - 1.197 X A Ud^ ^^/^
where {AI/Ad)Q is the rate of change of current (normalized to a referencetemperature and pressure) with extrapolation chamber air-gap thickness as thethickness approaches zero, 33.7 is the mean energy expended per unit charge in air,
1.124 is the ratio of the mean mass stopping power of water to that of air, 1.197is the density of air at the reference temperature and pressure (22*C and 1
standard atmosphere), B is a correction for reduced backscatter from the collectingelectrode, U is a correction for attenuation by the high-voltage electrode, and A
is an area. For calibrations at the surface of the source, A is the active area of
the source, defined as the area within the 50% isodose line at the source surface.The listed diameter is 2/A/n
.
B-1

OG 84^0/851985 JUN 24
Pdtjp ? of ^
For the source submitted, one calibration was made, to determine the averageabsorbed-dose rate to water across the surface of the source. The activesource area was determined by mapping the relative dose rate across the sourcesurface with a 1-mm diameter collecting electrode. The rate of change of cur-rent with air-gap thickness was measured with a 28-tnm diameter conductingplastic collecting electrode.
The water absorbed-dose rate at the surface of the source, averaged over theactive area of the source, is given in the table in SI units (grays per second)and in special units (rads per second).
This measurement has been assigned an uncertainty of ± 15%, which has theapproximate significance of a 95% confidence limit.
Information on the technical aspects of this report can be obtained fromJ. S. Pruitt, Radiation Physics C206, National Bureau of Standards,Gaithersburg, Maryland 208799. (301) 975-5587.
Calibration performed by J. S. Pruitt
Report approved by R. Loevinger
For the Directorby
William R. Ott
Chief, Radiation Physics DivisionCenter for Radiation ResearchNational Measurement Laboratory
Area Correction factors WaterSource Distance A Diameter B U Absorbed-dose rate
(mm) (mm^) (mm) (Gy/s) (rad/s)
176 0 46 7.6 1.010 1.003 0.43 43

FORM NBS-1 14A (REV. 1 1 84)
U.S. DEPT. OF COMM.
BIBLIOGRAPHIC DATASHEET (See instructions)
1. PUBLICATION ORREPORT NO.
NBS/SP-250/9
2. Performing Organ. Report No 3. Publ ication Date
July 1987
4. TITLE AND SUBTITLE InBS Measurement Services:
Calibration of Beta-Particle-Emitting Ophthalmic T^plicators
5. AUTHOR(S)
John S. Pruitt
6. PERFORMING ORGANIZATION (If joint or other than NBS. see instructions)
NATIONAL BUREAU OF STANDARDS
U.S. DEPARTMENT OF COMMERCEGAITHERSBURG, MD 20899
7. Contract/Grant No.
8. Type of Report & Period Covered
Final
9. SPONSORING ORGANIZATION NAME AND COMPLETE ADDRESS (Street. City, Stote. ZIP)
Same as item 6.
10. SUPPLEMENTARY NOTES
Library of Congress Catalog Card Number 87-619844
I I
Document describes a computer program; SF-185, FlPS Software Summary, is attached.
11. ABSTRACTThis service provides calibrations for ^^Sr + ^^Y beta particleophthalmic applicators. The calibration determines the averagesurface absorbed-dose rate to water over the active area of theapplicator. The technique used is to measure current per unit massof air at the active surface with an extrapolation ionizationchamber, and to convert this into absorbed-dose rate with Bragg-Graycavity ionization theory. The extrapolation chamber measurementsare made in three parts. In the first part, a 1 mm diameter probeelectrode is used to map the relative dose rate across the sourcesurface, and to determine the active arpa . Tn tj^e seconc! pa^t theproDe electrode is replaced by a 30 mm diameter electrode, and 'thetest applicator is replaced by an NBS-owned applicator for qualityassurance measurements. In the third part, the 30 mm electrode isused with the test applicator to determine the extrapolation curveslope at the source surface. The ratio of this slope to the sourcearea, divided by the air density, yields current per unit air mass.The transformation to absorbed-dose rate is described. Thecomponent uncertainties are listed and are shown to yield a totaluncertainty of ± 15%, with the approximate significance of a 95%confidence limit. Data booK measurements and a calibration reportare given for one particular applicator.
12. KEY WORDS (Six to twelve entries; alphabetical order; capitalize only proper names; and separate key words by semicolons)
absorbed dose rate; calibration service; extrapolation chamber; ophthalmic
applicator; quality assurance measurements; surface dose rate.
13. AVAILABILITY
Unlimited
I I
For Official Distribution. Do Not Release to NTIS
[X^ Order From Superintendent of Documents, U.S. Government Printing Office, Washington, DC20402.
Order From National Technical Information Service (NTIS), Springfield, VA 22161
14. NO. OFPRINTED PAGES
36
15. Price
{rU.S. Government Printing Office : 1987 - 181-100/6 25 24USCOMM DC 85-4006


PUBLICATIONS IN THE SP 250 SERIES FROM THE CENTER FOR RADIATION RESEARCH
SP 250-1 NBS Measurement Services:Spectral Radiance CalibrationsJ.H. Walker, R.D. Saunders, and A.T. Hattenburg
SP 250-2 NBS Measurement Services:Far Ultraviolet Detector StandardsL.R. Canfield and N. Swanson
SP 250-3 NBS Measurement Services:Radiometric Standards in the Vacuum UltravioletJ.Z. Klose, J.M. Bridges, and W.r'. Ott
SP 250-4 NBS Measurement Services:Fricke Dosimetry in High-Energy Electron BeamsC.G. Soares, E.L. Bright and M. Ehrlich
SP 250-5 NBS Measurement Services:Alpha-Particle CalibrationsJ.M.R. Hutchinson
SP 250-6 NBS Measurement Services:Regular Spectral TransmittanceK.L. Eckerle, J.J, Hsia, K.D. Mielenz,and V.R. Weidner
SP 250-7 NBS Measurement Services:Radiance Temperature CalibrationsW.R. Waters, J.H. Walker, and A.T. Hattenburg
SP 250-8 NBS Measurement Services:Spectral ReflectanceV.R. Weidner and J.J. Hsia
SP 250-9 NBS Measurement Services:Calibration of Beta-Particle-EmittingOphthalmic ApplicatorsJ.S. Pruitt
SP 250-10 NBS Measurement Services:Radioactivity Calibrations with the "4tt"
Ganma Ionization Chamber, and OtherRadioactivity Calibration CapabilitiesJ.M. Calhoun
SP 250-11 NBS Measurement Services:Dosimetry for High-Dose ApplicationsJ.C. Humphreys, D. Hocken, and W.L. McLaughlin
SP 250-12 .NBS Measurement Services:Neutron Personnel DosimetryR.B. Schwartz
SP 250-13 NBS Measurement Services:Activation Foil Irradiationwith CaliforniLTi Fission SourcesG.P. Lamaze and J. A. Grundl
SP 250-14 NBS Measurement Services:Activation Foil Irradiation by ReactorCavity Fission SourcesG.P. Lamaze and J. A. Grundl
SP 250-15 NBS Measurement Services:Photometric CalibrationsR.L. Booker and D.A. McSparron
SP 250-15 NBS Measurement Services:Calibration of X-Ray and Ganima-Ray
Measuring InstrumentsP.J. Lamperti, T.P. Loftus, and R. Loevinger
SP 250-17 NBS Measurement Services:The NBS Photodetector Spectral ResponseCalibration Transfer ProgramE.F. Zalewski
SP 250-18 NBS Measurement Services:Neutron Source Strength CalibrationsE.D. McGarry and E.W. Boswell
SP 250-19 NBS Measurement Services:Calibration of Gamma-Ray-EmittingBrachytherapy Sources
J.T. Weaver, T.P. Loftus, and R. Loevinger
SP 250-20 NBS Measurement Services:Spectral Irradiance CalibrationsJ.H. Walker, R.D. Saunders, J.K. Jackson,and D.A. McSparron
SP 250-21 NBS Measurement Services:Calibration of Beta-ParticleRadiation Instrumentation and SourcesJ.S. Pruitt, C.G. Soares, and M. Ehrlich

U.S. Department of CommerceNational Bureau of Standards
Gaithersburg, MD 20899
Official Business
Penalty for Private Use $300