calgary real estate market report may 2015
TRANSCRIPT

Calgary & Area
Real Estate
Statistics:
May 2015
1
Request Your Free Home
Evaluation Today!
TABLE OF CONTENTS
3
April Real Estate Summary
4 - 5
City of Calgary Detached Homes Sales Data
6 - 7
City of Calgary Attached Homes Sales Data
8 - 9
City of Calgary Apartment Homes Sales Data
10 - 11
Rural Rockyview Detached Sales Data
12
Message From The Calgary Real Estate Board
13 – 14
Rural Foothills Detached Sales Data
15 – 16
City of Airdrie Detached Sales Data
17 – 18
City of Airdrie Attached Sales Data
19 - 20
City of Airdrie Apartment Sales Data
2

New Listings Decline as
Home Prices Ease
Improved sales to new listings ratio
reduces inventory gains
The market continues to perform in mysterious ways! As you can see from the data, some market segments are performing in a more “normal” market pattern and some market segments are softening. If you are curious about the current market value of your home, or market conditions in general, please feel free to contact us. Hope this helps! Susanita de Diego
3

City of Calgary Detached Homes Sales Data
Yearly – May 2014 – May 2015
The following table shows the City of Calgary Detached Homes Sales Data for each month since May
of last year.
Month/Year Detached
Sales
Previous Month End
Inventory + Inventory Added
During the Month
% of Available
Inventory Sold
Days on
Market
Months of
Supply
May 2014 1,774 2,155 + 2,575 = 4,730 37.51% 25 1.44
June 2014 1,549 2,554 + 2,280 = 4,834 32.04% 27 1.77
July 2014 1,362 2,737 + 1,861 = 4,598 29.62% 32 1.96
August 2014 1,278 2,674 + 1,792 = 4,466 28.62% 33 2.05
September 2014 1,224 2,616 + 1,868 = 4,484 27.30% 35 2.10
October 2014 1,290 2,571 + 1,626 = 4,197 30.74% 36 1.71
November 2014 1,033 2,205 + 1,126 = 3,331 31.01% 38 1.95
December 2015 607 2,015 + 763 = 2,778 21.85% 41 2.78
January 2015 535 1,687 +1,843 = 3,530 15.16% 37 4.68
February 2015 739 2,506 + 1,674 = 4,180 17.68% 34 3.99
March 2015 1,082 2,950 + 1,776 = 4,726 22.89% 37 2.79
April 2015 1,149 3,016 + 1,774 = 4,790 23.99% 38 2.63
May 2015 1,366 3,024 + 1,879 = 4,903 27.86% 38 2.13
City of Calgary Detached Homes Sales Data
Monthly – May 2011 – May 2015
The following table shows the City of Calgary Detached Homes Sales Data for each month since May
of last year.
Month/Year Detached Sales Previous Month End
Inventory + Inventory
Added During the Month
% of Available
Inventory Sold
Days on
Market
Months of
Supply
May 2011 1,185 3,666 + 2,263 = 5,929 19.99% 41 3.30
May 2012 1,553 2,914 + 2,435 = 5,349 29.03% 36 2.11
May 2013 1,571 2,549 + 2,389 = 4,938 31.81% 31 1.83
May 2014 1,774 2,189 + 2,576 = 4,765 37.23% 25 1.46
May 2015 1,366 3,024 + 1,879 = 4,903 27.86% 38 2.13
4

The MLS® Home Price Index (HPI)
The MLS® Home Price Index (HPI) was launched on February 6, 2012 as part of a nationwide rollout
involving boards in Canada’s largest cities because average and median price changes can
misrepresent changes in market price. We often refer to the median price as being immune from
outliers. However, if there have been large movements in either the low end or high end of the
price spectrum, the median is unable to reflect the price changes.
The MLS® Home Price Index (HPI) was introduced to provide a better measurement of price and
price trends for residential properties. A benchmark home is one that is comprised of a set of
specific attributes that is typical for the area where it is located.
The City of Calgary Detached Benchmark, Average and Median Prices have shown the following
progression:
5
0
100,000
200,000
300,000
400,000
500,000
600,000
700,000
May-14 Jun-14 Jul-14 Aug-14 Sep-14 Oct-14 Nov-14 Dec-14 Jan-15 Feb-15 Mar-15 Apr-15 May-15
City of Calgary Detached Sale Price
Detached Benchmark Price Detached Average Price Detached Median Price
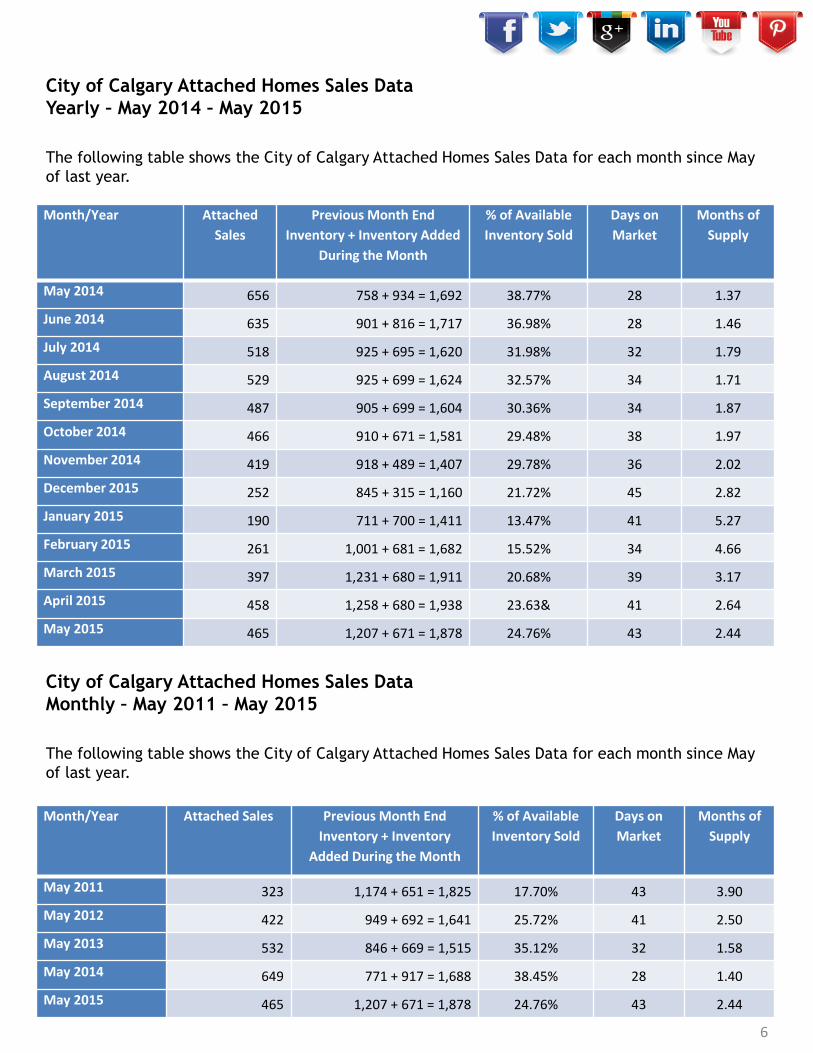
City of Calgary Attached Homes Sales Data
Yearly – May 2014 – May 2015
The following table shows the City of Calgary Attached Homes Sales Data for each month since May
of last year.
Month/Year Attached
Sales
Previous Month End
Inventory + Inventory Added
During the Month
% of Available
Inventory Sold
Days on
Market
Months of
Supply
May 2014 656 758 + 934 = 1,692 38.77% 28 1.37
June 2014 635 901 + 816 = 1,717 36.98% 28 1.46
July 2014 518 925 + 695 = 1,620 31.98% 32 1.79
August 2014 529 925 + 699 = 1,624 32.57% 34 1.71
September 2014 487 905 + 699 = 1,604 30.36% 34 1.87
October 2014 466 910 + 671 = 1,581 29.48% 38 1.97
November 2014 419 918 + 489 = 1,407 29.78% 36 2.02
December 2015 252 845 + 315 = 1,160 21.72% 45 2.82
January 2015 190 711 + 700 = 1,411 13.47% 41 5.27
February 2015 261 1,001 + 681 = 1,682 15.52% 34 4.66
March 2015 397 1,231 + 680 = 1,911 20.68% 39 3.17
April 2015 458 1,258 + 680 = 1,938 23.63& 41 2.64
May 2015 465 1,207 + 671 = 1,878 24.76% 43 2.44
City of Calgary Attached Homes Sales Data
Monthly – May 2011 – May 2015
The following table shows the City of Calgary Attached Homes Sales Data for each month since May
of last year.
Month/Year Attached Sales Previous Month End
Inventory + Inventory
Added During the Month
% of Available
Inventory Sold
Days on
Market
Months of
Supply
May 2011 323 1,174 + 651 = 1,825 17.70% 43 3.90
May 2012 422 949 + 692 = 1,641 25.72% 41 2.50
May 2013 532 846 + 669 = 1,515 35.12% 32 1.58
May 2014 649 771 + 917 = 1,688 38.45% 28 1.40
May 2015 465 1,207 + 671 = 1,878 24.76% 43 2.44
6

The City of Calgary Attached Benchmark, Average and Median Prices have shown
the following progression:
7
0
50,000
100,000
150,000
200,000
250,000
300,000
350,000
400,000
450,000
500,000
May-14 Jun-14 Jul-14 Aug-14 Sep-14 Oct-14 Nov-14 Dec-14 Jan-15 Feb-15 Mar-15 Apr-15 May-15
City of Calgary Attached Sale Price
Attached Benchmark Price Attached Average Price Attached Median Price

City of Calgary Apartment Homes Sales Data
Yearly –May 2014 – May 2015
The following table shows the City of Calgary Apartment Homes Sales Data for each month since
May of last year.
Month/Year Apartment
Sales
Previous Month End
Inventory + Inventory Added
During the Month
% of Available
Inventory Sold
Days on
Market
Months of
Supply
May 2014 515 907 + 818 = 1,725 29.86% 33 2.08
June 2014 480 1,073 + 721 = 1,794 26.76% 37 2.29
July 2014 448 1,097 + 663 = 1,760 25.45% 40 2.41
August 2014 456 1,079 + 656 = 1,735 26.28% 40 2.35
September 2014 435 1,070 + 692 = 1,762 24.69% 39 2.48
October 2014 389 1,078 + 622 = 1,700 22.88% 41 2.67
November 2014 327 1,039 + 478 = 1,517 21.56% 41 2.95
December 2015 223 966 + 303 = 1,269 17.57% 46 3.65
January 2015 155 815 + 745 = 1,560 9.94% 55 7.41
February 2015 217 1,148 + 595 = 1,743 12.45% 40 6.04
March 2015 303 1,134 + 672 = 2,006 15.10% 43 4.68
April 2015 350 1,419 + 610 = 2,029 17.25% 45 3.85
May 2015 359 1,348 + 611 = 1,959 18.33% 48 3.60
City of Calgary Apartment Homes Sales Data
Monthly –May 2011 – May 2015
The following table shows the City of Calgary Apartment Homes Sales Data for each month since
May of last year.
Month/Year Apartment
Sales
Previous Month End
Inventory + Inventory
Added During the Month
% of Available
Inventory Sold
Days on
Market
Months of
Supply
May 2011 294 1,199 + 615 = 1,814 16.21% 52 4.34
May 2012 395 1,133 + 654 = 1,787 22.10% 50 2.99
May 2013 420 872 + 643 = 1,515 27.72% 35 2.19
May 2014 515 936 + 818 = 1,754 29.36% 33 2.14
May 2015 359 1,348 + 611 = 1,959 18.33% 48 3.60
8

The City of Calgary Apartment Benchmark, Average and Median Prices have shown
the following progression:
9
0
50,000
100,000
150,000
200,000
250,000
300,000
350,000
400,000
May-14 Jun-14 Jul-14 Aug-14 Sep-14 Oct-14 Nov-14 Dec-14 Jan-15 Feb-15 Mar-15 Apr-15 May-15
City of Calgary Apartment Sale Price
Apartment Benchmark Price Apartment Average Price Apartment Median Price

Rural Rockyview Detached Sales Data
Yearly – May 2014 – May 2015
The following table shows the Rural Rockyview Detached Sales Data for each month since May of
last year.
Month/Year Detached
Sales
Previous Month End
Inventory + Inventory Added
During the Month
% of Available
Inventory Sold
Days on
Market
Months of
Supply
May 2014 58 306 + 133 = 439 13.21% 69 5.84
June 2014 38 339 + 126 = 465 8.17% 91 9.68
July 2014 45 368 + 83 = 451 9.98% 88 8.07
August 2014 41 363 + 75 = 438 9.36% 82 8.78
September 2014 46 360 + 86 = 446 10.31% 84 7.28
October 2014 37 335 + 69 = 404 9.16% 92 8.30
November 2014 10 307 + 49 = 356 2.81% 116 28.40
December 2015 15 284 + 31 = 315 4.76% 140 14.67
January 2015 19 220 + 88 = 308 6.17% 142 13.05
February 2015 20 248 + 76 = 324 6.17% 74 13.85
March 2015 23 277 + 82 = 345 6.67% 86 12.87
April 2015 28 296 + 68 = 364 7.69% 71 10.89
May 2015 35 305 + 87 = 392 8.93% 78 9.43
Rural Rockyview Detached Sales Data
Monthly – May 2011 – May 2015
The following table shows the Rural Rockyview Detached Sales Data for each month since May of
last year.
Month/Year Detached Sales Previous Month End
Inventory + Inventory
Added During the Month
% of Available
Inventory Sold
Days on
Market
Months of
Supply
May 2011 31 373 + 121 = 494 6.28% 101 13.29
May 2012 48 400 + 140 = 540 8.89% 91 9.13
May 2013 34 393 + 115 = 508 6.69% 69 12.65
May 2014 58 304 + 133 = 437 13.27% 69 5.81
May 2015 35 305 + 87 = 392 8.93% 78 9.43
10

Rural Rockyview Detached Sales Data Benchmark, Average and Median Prices have
shown the following progression:
11
0
200,000
400,000
600,000
800,000
1,000,000
1,200,000
1,400,000
May-14 Jun-14 Jul-14 Aug-14 Sep-14 Oct-14 Nov-14 Dec-14 Jan-15 Feb-15 Mar-15 Apr-15 May-15
Rural Rockyview Detached Sale Price
Rural Rockyview Detached Benchmark Price Rural Rockyview Detached Average Price
Rural Rockyview Detached Median Price

“For the third month in the row, new listings
have eased compared to last year, helping push
the market toward more balanced conditions,
despite the current environment of slower sales
activity,” said CREB chief economist Ann- Marie
Lurie. “This has helped prevent further decline
in the adjusted benchmark price.”
“
” 12

Rural Foothills Detached Sales Data
Yearly – May 2014 – May 2015
The following table shows the Rural Foothills Detached Sales Data for each month since May of last
year.
Month/Year Detached
Sales
Previous Month End
Inventory + Inventory Added
During the Month
% of Available
Inventory Sold
Days on
Market
Months of
Supply
May 2014 31 161 + 63 = 221 14.03% 97 5.74
June 2014 28 178 + 47 = 225 12.44% 64 6.39
July 2014 23 179 + 73 = 252 9.13% 98 8.61
August 2014 18 198 + 55 = 253 7.11% 64 11.83
September 2014 26 213 + 48 = 261 9.96% 96 7.77
October 2014 15 202 + 39 = 241 6.22% 79 12.13
November 2014 10 182 + 19 = 201 4.98% 103 16.30
December 2015 6 163 + 13 = 176 3.41% 167 19.83
January 2015 8 119 + 33 = 152 5.26% 151 15.13
February 2015 17 121 + 39 = 160 10.63% 139 7.94
March 2015 13 135 + 47 = 182 7.14% 139 11.69
April 2015 15 152 + 52 = 204 7.35% 96 11.93
May 2015 23 179 + 63 = 242 9.50% 102 8.57
Rural Foothills Detached Sales Data
Monthly – May 2011 – May 2015
The following table shows the Rural Foothills Detached Sales Data for each month since May of last
year.
Month/Year Detached Sales Previous Month End
Inventory + Inventory
Added During the Month
% of Available
Inventory Sold
Days on
Market
Months of
Supply
May 2011 18 209 + 84 = 293 6.14% 159 13.44
May 2012 17 214 + 88 = 302 5.63% 121 14.82
May 2013 25 204 + 71 = 275 9.09% 80 8.88
May 2014 30 158 + 63 = 221 13.57% 93 5.83
May 2015 23 179 + 63 = 242 9.50% 102 8.57
13
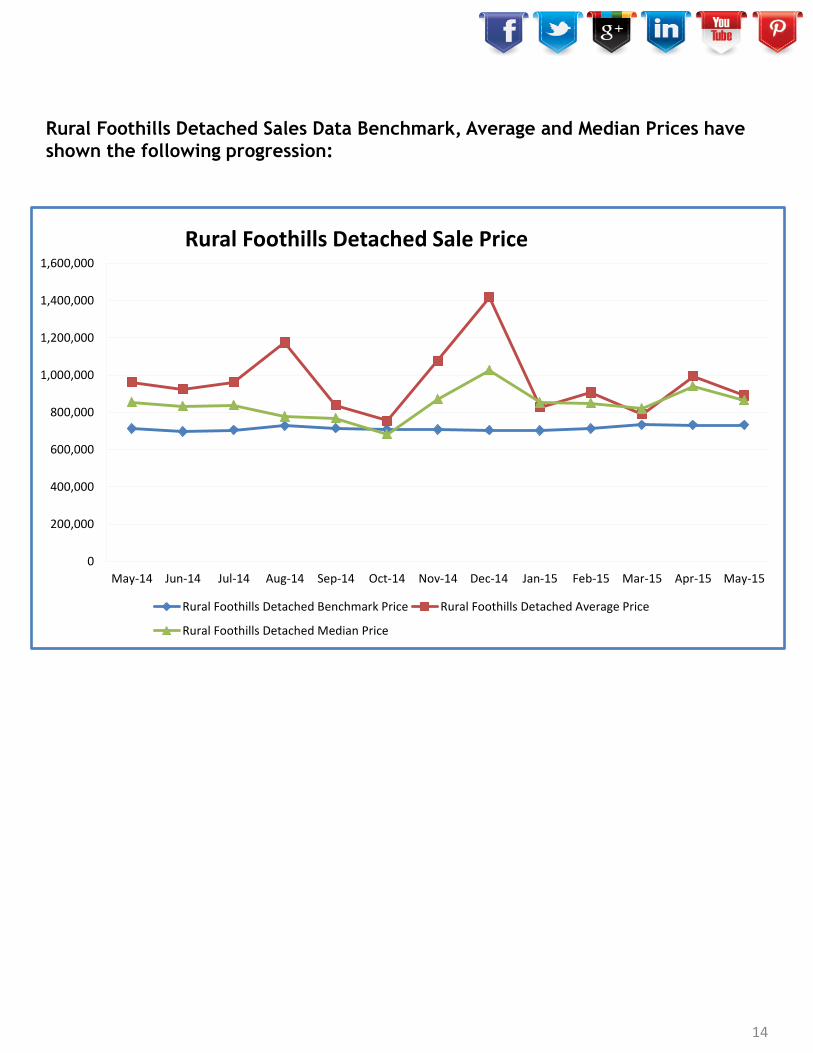
Rural Foothills Detached Sales Data Benchmark, Average and Median Prices have
shown the following progression:
14
0
200,000
400,000
600,000
800,000
1,000,000
1,200,000
1,400,000
1,600,000
May-14 Jun-14 Jul-14 Aug-14 Sep-14 Oct-14 Nov-14 Dec-14 Jan-15 Feb-15 Mar-15 Apr-15 May-15
Rural Foothills Detached Sale Price
Rural Foothills Detached Benchmark Price Rural Foothills Detached Average Price
Rural Foothills Detached Median Price
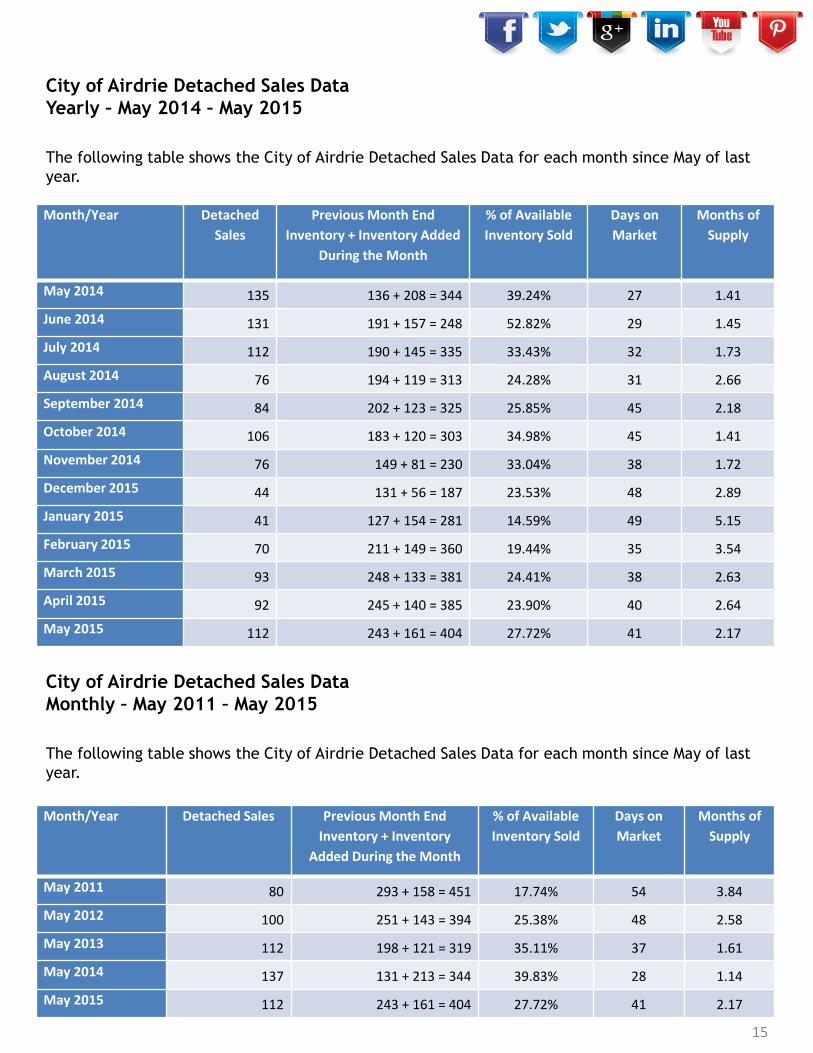
City of Airdrie Detached Sales Data
Yearly – May 2014 – May 2015
The following table shows the City of Airdrie Detached Sales Data for each month since May of last
year.
Month/Year Detached
Sales
Previous Month End
Inventory + Inventory Added
During the Month
% of Available
Inventory Sold
Days on
Market
Months of
Supply
May 2014 135 136 + 208 = 344 39.24% 27 1.41
June 2014 131 191 + 157 = 248 52.82% 29 1.45
July 2014 112 190 + 145 = 335 33.43% 32 1.73
August 2014 76 194 + 119 = 313 24.28% 31 2.66
September 2014 84 202 + 123 = 325 25.85% 45 2.18
October 2014 106 183 + 120 = 303 34.98% 45 1.41
November 2014 76 149 + 81 = 230 33.04% 38 1.72
December 2015 44 131 + 56 = 187 23.53% 48 2.89
January 2015 41 127 + 154 = 281 14.59% 49 5.15
February 2015 70 211 + 149 = 360 19.44% 35 3.54
March 2015 93 248 + 133 = 381 24.41% 38 2.63
April 2015 92 245 + 140 = 385 23.90% 40 2.64
May 2015 112 243 + 161 = 404 27.72% 41 2.17
City of Airdrie Detached Sales Data
Monthly – May 2011 – May 2015
The following table shows the City of Airdrie Detached Sales Data for each month since May of last
year.
Month/Year Detached Sales Previous Month End
Inventory + Inventory
Added During the Month
% of Available
Inventory Sold
Days on
Market
Months of
Supply
May 2011 80 293 + 158 = 451 17.74% 54 3.84
May 2012 100 251 + 143 = 394 25.38% 48 2.58
May 2013 112 198 + 121 = 319 35.11% 37 1.61
May 2014 137 131 + 213 = 344 39.83% 28 1.14
May 2015 112 243 + 161 = 404 27.72% 41 2.17
15

City of Airdrie Detached Sales Data Benchmark, Average and Median Prices have
shown the following progression:
16
0
50,000
100,000
150,000
200,000
250,000
300,000
350,000
400,000
450,000
500,000
May-14 Jun-14 Jul-14 Aug-14 Sep-14 Oct-14 Nov-14 Dec-14 Jan-15 Feb-15 Mar-15 Apr-15 May-15
City of Airdrie Detached Sale Price
Detached Benchmark Price Detached Average Price Detached Median Price

City of Airdrie Attached Sales Data
Yearly –May 2014 – May 2015
The following table shows the City of Airdrie Attached Sales Data for each month since May of last
year.
Month/Year Attached
Sales
Previous Month End
Inventory + Inventory Added
During the Month
% of Available
Inventory Sold
Days on
Market
Months of
Supply
May 2014 48 40 + 58 = 98 48.98% 25 .92
June 2014 46 44 + 64 = 108 42.59% 28 1.13
July 2014 47 52 + 46 = 98 47.96% 26 .94
August 2014 35 44 + 51 = 95 36.84% 32 1.46
September 2014 49 51 + 41 = 92 53.26% 33 .87
October 2014 37 40 + 45 = 85 43.53% 34 .81
November 2014 33 30 + 21 = 52 63.46% 40 .73
December 2015 11 24 + 14 = 38 28.95% 28 2.09
January 2015 17 23 + 43 = 66 25.76% 36 2.53
February 2015 16 43 + 56 = 99 16.16% 40 4.63
March 2015 32 74 + 50 = 124 25.81% 38 2.47
April 2015 40 79 + 55 = 134 29.85% 37 2.13
May 2015 34 85 + 39 = 124 27.42% 31 2.24
City of Airdrie Attached Sales Data
Monthly – May 2011 – May 2015
The following table shows the City of Airdrie Attached Sales Data for each month since May of last
year.
Month/Year Attached Sales Previous Month End
Inventory + Inventory
Added During the Month
% of Available
Inventory Sold
Days on
Market
Months of
Supply
May 2011 13 37 + 31 = 68 19.12% 52 3.77
May 2012 15 29 + 32 = 61 24.59% 51 2.53
May 2013 27 21 + 38 = 59 45.76% 40 1.07
May 2014 48 35 + 58 = 93 51.61% 25 .81
May 2015 34 85 + 39 = 124 27.42% 31 2.24
17

City of Airdrie Attached Sales Data Benchmark, Average and Median Prices have
shown the following progression:
18
260,000
270,000
280,000
290,000
300,000
310,000
320,000
330,000
340,000
350,000
May-14 Jun-14 Jul-14 Aug-14 Sep-14 Oct-14 Nov-14 Dec-14 Jan-15 Feb-15 Mar-15 Apr-15 May-15
City of Airdrie Attached Sale Price
Attached Benchmark Price Attached Average Price Attached Median Price

City of Airdrie Apartment Sales Data
Yearly – May 2014 – May 2015
The following table shows the City of Airdrie Apartment Sales Data for each month since May of last
year.
Month/Year Apartment
Sales
Previous Month End
Inventory + Inventory Added
During the Month
% of Available
Inventory Sold
Days on
Market
Months of
Supply
May 2014 12 20 + 18 = 38 31.58% 29 1.75
June 2014 17 21 + 29 = 50 34.00% 36 1.88
July 2014 21 32 + 16 = 48 43.75% 50 1.24
August 2014 20 26 + 14 = 40 50.00% 36 .90
September 2014 9 18 + 14 = 32 28.13% 40 1.89
October 2014 16 17 + 17 = 34 47.06% 36 .88
November 2014 7 14 + 13 = 27 25.93% 36 3.14
December 2015 9 22 + 9 = 29 31.03% 53 2.11
January 2015 7 19 + 25 = 44 15.91% 40 5.14
February 2015 12 40 + 43 = 83 14.46% 29 3.58
March 2015 13 43 + 11 = 54 24.07% 50 2.77
April 2015 6 36 +19 = 55 10.91% 70 7.17
May 2015 7 43 + 23 = 66 10.61% 36 7.29
City of Airdrie Apartment Sales Data
Monthly – May 2011 – May 2015
The following table shows the City of Airdrie Apartment Sales Data for each month since May of last
year.
Month/Year Apartment Sales Previous Month End
Inventory + Inventory
Added During the Month
% of Available
Inventory Sold
Days on
Market
Months of
Supply
May 2011 7 31 + 7 = 38 18.42% 57 4.00
May 2012 9 26 + 13 = 39 23.08% 87 2.67
May 2013 9 21 + 14 = 35 25.71% 43 2.67
May 2014 12 22 + 18 = 40 30% 29 1.92
May 2015 7 43 + 23 = 66 10.61% 36 7.29
19

City of Airdrie Apartment Sales Data Benchmark, Average and Median Prices have
shown the following progression:
20
0
50,000
100,000
150,000
200,000
250,000
300,000
May-14 Jun-14 Jul-14 Aug-14 Sep-14 Oct-14 Nov-14 Dec-14 Jan-15 Feb-15 Mar-15 Apr-15 May-15
City of Airdrie Apartment Sale Price
Apartment Benchmark Price Apartment Average Price Apartment Median Price

Curious About the
Value of Your Home?
As you can see, current market conditions play a critical role in determining the value of your home. Equally important however, is having an experienced and knowledgeable professional Realtor® on your side. Coldwell Banker Complete Real Estate would welcome the opportunity to discuss any of your Real Estate needs at your convenience.
#yesyoumatter
Request Your Free Home
Evaluation Today!
Coldwell Banker Complete Real Estate Phone: 403-686-1455
21