c o n t e n t s brief history .. .. .. organization · pdf fileno. brief history .. .. .. ......
TRANSCRIPT

Chapter
C O N T E N T S
Subject
No. Brief History .. .. .. Mission Statement .. .. Organization .. .. .. 1. Operating Unit
a. Infrastructure
.. i Civil Engineering Department .. ii Signal Department .. .. .. iii Telecommunication Department .. .. iv Design Department .. .. .. v Directorate of Property & Land .. .. vi Directorate of Information Technology .. b. Mechanical Department
.. i Mechanical Engineering Department ii Purchase Department .. .. iii Stores Department .. .. iv Electrical Engineering Department .. c. Traffic.. Department
.. .. i Passenger Department ii Operating Department .. .. iii Marketing Department .. ..
d. iv Traffic Manager (Dry Port) .. ..
Personnel Department .. .. e. Police Department .. .. .. f. Directorate of Legal Affairs .. .. g. Directorate of Public Relation .. .. h. Pakistan Railway Academy Walton .. .. i. Project & Planning Department .. .. 2. Manufacturing Unit
.. .. i Carriage Factory Islamabad ii Concrete Sleeper Factories .. .. iii Locomotive Factory Risalpur .. .. 3. Welfare & Special Initiative Uint
.. .. i Medical & Health Department ii Directorate of Education .. .. iii Railway Sports .. .. 4. Federal Government Inspector of Railways
5. Vigilance Directorate
.. 6. Railway Construction Company .. 7. Chief Internal Auditor .. .. 8. Pakistan Railway Advisory & Consultancy Services 9. Railway Estate Development & Marketing Company
PART - II
.. .. Statistical Tables
Page
No. 1 3 5
7 27 32 34 36 39
47 50 51 54
57 61 64 67 68 72 75 77 81 85
91 92 93
101 102 105 110 114 118 120 122 125
127

PRINCIPAL STATISTICS
PLANT & EQUIPMENT Unit. 2014-2015
Route - Kilometres Kms. 7,791 Track - Kilometres Kms. 11,881 Locomotives No. 458 Coaching Vehicles No. 1,459 Other Coaching Vehicles No. 281 Freight Wagons No. 15,452 Railway Stations (Excluding Halts) No. 456
OPERATIONS
35,612 Passenger, Mixed & Other No. Coaching Trains Run.
Thousand 21,942 Train Kilometres, Passenger Mixed and Other Coaching.
Thousand 188,441 Coaching Vehicle-Kilometres Freight Train Run No. 5,442 Freight Train-Kilometres Thousand 4,720 Freight Wagon-Kilometres Thousand 158,172 (Freight & Mixed Trains)
Thousand 764,768 Other Coaching Freight Tonne- Kilometres
VOLUME OF TRAFFIC
52,951 Passengers Carried Thousand Passenger Kilometres Thousand 20,288,038 Tonnes of Freight Carried Thousand 3,600 Tonne - Kilometres Thousand 3,301,438 Tonne - Kilometres Freight and
Thousand 4,066,207 Coaching Combined. Freight Wagons Loaded No. 176,155
FUEL CONSUMPTION
562 Furnace Oil Tonnes H.S.D. Oil Liters/Thousand 121,836 Electric Energy KWH NIL Coal Tonnes NIL
EMPLOYMENT & WAGES
78,031 Persons Employed No. Cost of Employees Thousand 23,039,792 Pension Payment Thousand 16,234,554
FINANCIAL RESULTS
31,924,757 Gross Earnings Thousand Total Ordinary Working Expenses Thousand 42,000,125 Operating Ratio Percent 131.53
Provisional
2015-2016
7,791
11,881 460
1,484 274
15,324 512
36,998
23,100
198,386 71,66 6,644
187,130
947,990
52,192 21,200,910
5,001 4,773,548
5,721,538
243,794
663 139,487
NIL NIL
75,242 24,304,566 20,404,401
36,581,865 41,857,951
114.42

STATISTICAL TABLES

INDEX TO TABLES
Page No.
1. Route-kilometres .. .. .. 131
2. Track-kilometres .. .. .. 132
3. Double line track .. .. .. 133
4. Locomotives owned.. .. .. 134
5. Coaching vehicles owned .. .. 135
6. Freight wagons owned .. .. 136
7. Graph .. .. .. 138
8. Passengers carried and kilometres..
..
139
9. Class-wise Passengers carried .. 140 &141
10. Class-wise & Zone-wise Passenger carried & 142 & 145
11.
earning.
.. .. 146 Freight Wagons loaded
12. Graph .. .. .. 147
13. Freight carried (Tonnes) .. .. 148 & 149
14. Commodity-wise Fright Carried, (Tonnes) .. 150
15. Commodity-wise Tonnes Kilometres .. 151
16. Passenger trains run (all gauges) .. .. 152 & 153
17. Freight trains run on Pakistan Railways .. 154 & 155
18. Locomotives usage (B.G.) .. .. 156 & 157
19. Freight train Operation (B.G.) .. .. 158 & 159
20. Coaching Vehicle usage (B.G.) .. .. 1 60
21. Freight wagon usage (B.G.) .. .. 1 61
22. Diesel & Electric Locomotives usage (B.G.) .. 1 62
23. Fuel Consumed .. .. .. 1 63
24. Operating Revenue
..
.. .. 1 64
25. Graph .. .. 1 65
26. Operating Expenses of Pakistan Railways .. 166 & 167
27. Percentage of Expenditure to gross earning .. 1 68
28. Comparative statement for the last five years .. 170 to 173
29. Persons Employed by Pakistan Railways .. 174 & 175
30. Map .. .. ..
129

ROUTE KILOMETRES At the end of the year 2015-2016, the Pakistan Railways had a total of 7,791.00
route- kilometres. Figures shown below represent the total point -to -point length of
the main and branch lines. These do not include kilometreage of yard tracks, or any
parallel tracks/sidings. This kilometreage consists of two different gauges, i.e.,
7,479.00 kilometres of broad -gauge and 312.00 kilometres of metre-gauge.
Route Kilometres 1950-2016.
Year. Broad-Gauge Metre-Gauge Narrow-Gauge Total
(Kilometres) (Kilometres) (Kilometres) (Kilometres)
1950-55 Average 7,313.30 511.88 735.60 8,560.78
1955-60 Average 7,433.18 511.88 637.43 8,582.49
1960-65 Average 7,451.20 511.97 611.10 8,574.27
1965-70 Average 7,513.74 472.08 611.10 8,596.92
1970-75 Average 7,702.54 445.40 611.10 8,759.04
1975-80 Average 7,758.02 445.51 611.25 8,814.78
1980-85 Average 7,735.35 445.40 611.10 8,791.85
1985-90 Average 7,718.37 445.40 611.10 8,774.87
1990-95 Average 7,718.37 445.40 611.10 8,774.87
1995-2000 Average 7,346.22 477.00 .. 7,823.22
2000-2005 Average 7,346.00 445.00 .. 7,791.00
2005-2010 Average 7,479.00 312.00 .. 7,791.00
2010-2011 7479.00 312.00 .. 7791.00
2011-2012 7479.00 312.00 .. 7791.00
2112-2013 7479.00 312.00 .. 7791.00
2013-2014 7479.00 312.00 .. 7791.00
2014-2015 7479.00 312.00 .. 7791.00
2015-2016 7479.00 312.00 .. 7791.00
131

TRACK KILOMETRES
Pakistan Railways had a total of 11,881.00 track-kilometres (including double
line track, yards and sidings) at the end of 2015-2016. This consisted of
11,492.00 kilometres of broad-gauge and 389.00 kilometres of metre-gauge.
Year.
Track Kilometres 1950-2016.
Total
Broad-Gauge Metre-Gauge Narrow-Gauge
(Kilometres) (Kilometres) (Kilometres) (Kilometres)
1950-55 Average 10,478.60 628.09 894.10 12,000.79
1955-60 Average 10,647.22 627.92 752.48 12,027.62
1960-65 Average 10,783.67 628.55 727.36 12,139.58
1965-70 Average 10,934.14 584.92 728.62 12,247.68
1970-75 Average 11,168.12 552.60 727.51 12,448.23
1975-80 Average 11,248.37 552.37 728.80 12,529.54
1980-85 Average 11,327.37 554.10 727.11 12,608.58
1985-90 Average 11,340.11 555.10 726.11 12,621.32
1990-95 Average 11,345.52 555.10 726.11 12,626.73
1995-2000 Average 10,971.00 555.10 .. 11,526.10
2000-2005 Average 10,960.00 555.00 .. 11,515.00
2005-2010 Average 11,235.00 412.00 .. 11,647.00
2010-2011 11,343.00 412.00 .. 11755.00
2011-2012 11,366,00 389.00 .. 11755.00
2012-2013 11,366,00 389.00 .. 11755.00
2013-2014 11,389.00 389.00 11778.00
2014-2015 11,492.00 389.00 11881.00
2015-2016 11,492.00 389.00 11881.00 Note 1.-The percentage of wooden, Metal and concrete sleepers laid in the track at
the end of the year 2015-2016 was approximately 27.%, .26%, and 47% respectively.
132

DOUBLE LINE TRACK
Double line track consists of 1,409 kilometres as detailed below:-
Double Line Track
STATIONS KILOMETRE NO. LENGTH
From To From To (Kilometres)
Kiamari Lodhran 00.0 843 843
Lodhran Sher Shah 00.0 72 72
Sher Shah Multan Cantt 72 87 15
Multan Cantt Khanewal. 87 136 49
Khanewal Sahiwal 934 1,053 119
Sahiwal OKC 1,053 1,156 103
Bhoe Asal Raiwind 1,156 1,179 23
Raiwind Shahdara Bagh 1,180 1,226 46
Lahore Wagah 00.0 23 23
Chak Lala Golra Sharif 1,503 1,522 19
Ab-i-Gum Kolpur 306 343 37
Gulistan Chaman 466 526 60
Total 1409
133

LOCOMOTIVES OWNED
On 30th June, 2016, Pakistan Railways had 12 steam locomotives, 448
Diesel Electric locomotives and NIL Electric locomotives on entire system.
Year-wise figures are as follows :-
METRE- NARROW-
BROAD-GAUGE
Year.
GAUGE GAUGE
Steam Diesel Electric Steam Steam Total
(No.) (No.) (No.) (No.) (No.) (No.)
1950-55 Average 751 37 .. 28 46 862 ___________________________________________________________________________________________________________________________________
1955-60 Average 634 126 .. 36 44 840 __________________________________________________________________________________________________________________________ _________
1960-65 Average 620 255 .. 44 42 961 _____________________________________________________________________________________________________________________________ ______
1965-70 Average 622 333 29 46 41 1,071 ___________________________________________________________________________________________________________________________________
1970-75 Average 517 401 29 38 41 1,026 _____________________________________________________________________________________________________________________ ______________
1975-80 Average 416 470 29 36 41 992 _____________________________________________________________________________________________________________________________ ______
1980-85 Average 367 488 29 32 36 952 ___________________________________________________________________________________________________________________________________
1985-90 Average 172 550 29 25 33 809 ____________________________________________________________________________________________________________________ _______________
1990-95 Average 94 547 29 20 17 707 _____________________________________________________________________________________________________________________________ ______
1995-2000 Average 16 545 29 14 6 610 ___________________________________________________________________________________________________________________________________
2000-2005 Average 5 542 26 9 Nil 582 ____________________________________________________________________________________________________________________ _______________
2005-2010 Average 6 513 18 7 Nil 544 _____________________________________________________________________________________________________________________________ ______
2010-2011 5 500 16 7 Nil 528 ___________________________________________________________________________________________________________________________________
2011-2012 5 494 16 7 Nil 522 _____________________________________________________________________________________________________________________
2012-2013 5 465 16 7 Nil 493 _____________________________________________________________________________________________________________________
2013-2014 5 409 NIL 7 Nil 421 ________________________________________________________________________________________
2014-2015 5 446 NIL 7 NIL 458 ________________________________________________________________________________________
2015-2016 5 448 NIL 7 NIL 460
134

COACHING VEHICLES OWNED
Total number of coaching vehicles owned by Pakistan Railways at the end of
the year 2015-2016 was 1,758. This includes 1,484 vehicles meant for the
conveyance of passengers and 274 vehicles for the conveyance of luggage,
parcels, mails, automobiles, horses, etc., as well as departmental vehicles and
does not include 250 coaching brake -vans and 1 trailers. Air -conditioned
passenger coaches operating between important towns are also included in it. Year-wise figures are as follows :-
Broad-Gauge Metre-Gauge Narrow-Gauge Total
Other Passen- Other Passen- Other Passen- Other Passen-
Year. ger coach- ger coaching ger coaching ger coaching car- ing car- vehi- car- vehi- carriage vehicles
riage vehicles riage cles riage cles (No.) (No.) (No.) (No.) (No.) (No.) (No.) (No.) ____________________________________________________________________________________________________________
1950-55 Average 1,429 839 81 24 164 48 1,674 911 ____________________________________________________________________________________________________________
1955-60 Average 1,540 935 87 27 153 48 1,780 1,010 ____________________________________________________________________________________________________________
1960-65 Average 1,643 1.091 123 29 125 47 1,891 1,167 ____________________________________________________________________________________________________________
1965-70 Average 1,899 1.128 126 32 114 46 2,139 1,206 ____________________________________________________________________________________________________________
1970-75 Average 1,846 1.035 124 32 113 46 2,083 1,113 ____________________________________________________________________________________________________________
1975-80 Average 1,917 764 109 30 111 45 2.137 839 ____________________________________________________________________________________________________________
1980-85 Average 2,166 607 96 28 108 41 2,370 676 ____________________________________________________________________________________________________________
1985-90 Average 2,447 458 76 17 99 30 2,622 505 ____________________________________________________________________________________________________________
1990-95 Average 2,190 371 56 9 69 22 2,315 402 ____________________________________________________________________________________________________________
1995-2000 Average 1,705 376 36 8 14 Nil 1,755 384 ____________________________________________________________________________________________________________
2000-2005 Average 1,549 270 16 5 .. Nil 1,565 275 ____________________________________________________________________________________________________________
2005-2010 Average 1,601 238 5 2 .. Nil 1,606 240 ____________________________________________________________________________________________________________
2010-2011 1,540 234 .. .. .. Nil 1,540 234 ____________________________________________________________________________________________________________
2011-2012 1,584 239 .. .. .. Nil 1,584 239 ____________________________________________________________________________________________________________
2012-2013 1,540 245 .. .. .. Nil 1,540 245 ____________________________________________________________________________________________________________
2013-2014 1,434 262 .. .. .. Nil 1,434 262 ________________________________________________________________________________
2014-2015 1,459 281 .. .. .. Nil 1,459 281 ________________________________________________________________________________
2015-2016 1484 274 .. .. .. Nil 1,484 274
135
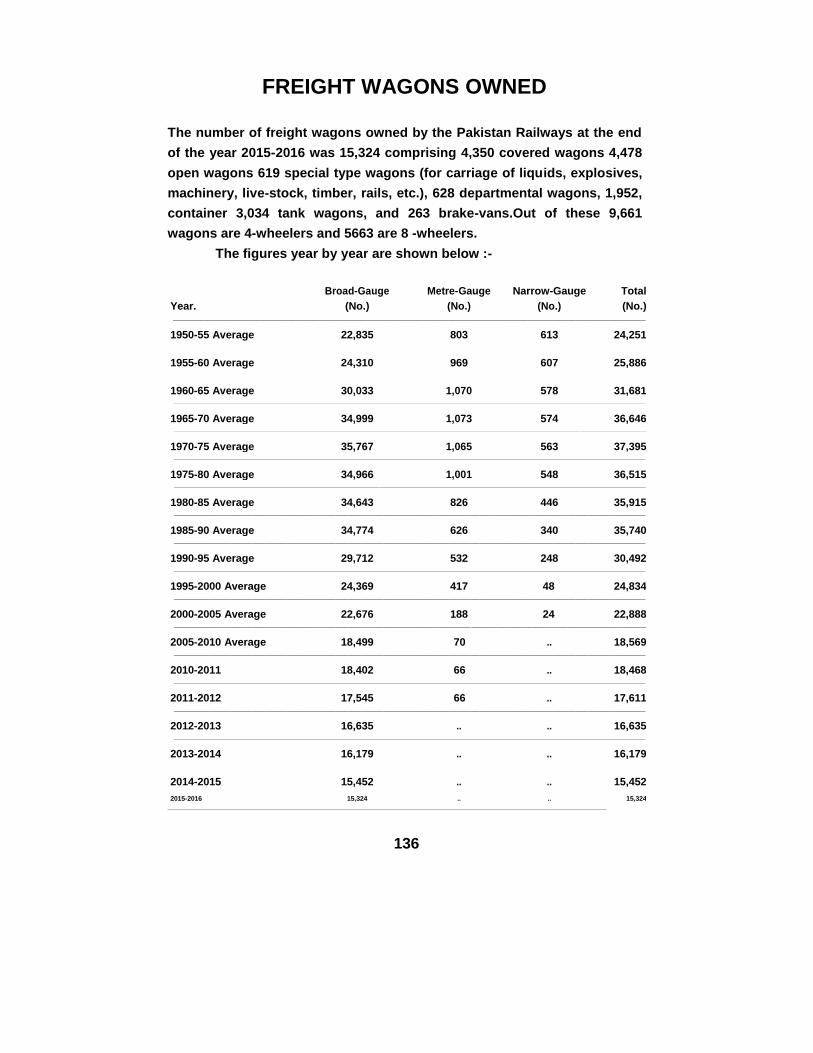
FREIGHT WAGONS OWNED
The number of freight wagons owned by the Pakistan Railways at the end
of the year 2015-2016 was 15,324 comprising 4,350 covered wagons 4,478
open wagons 619 special type wagons (for carriage of liquids, explosives,
machinery, live-stock, timber, rails, etc.), 628 departmental wagons, 1,952,
container 3,034 tank wagons, and 263 brake-vans.Out of these 9,661
wagons are 4-wheelers and 5663 are 8 -wheelers.
The figures year by year are shown below :-
Year.
Broad-Gauge Metre-Gauge Narrow-Gauge Total
(No.) (No.) (No.) (No.) ____________________________________________________________________________________________________________
1950-55 Average 22,835 803 613 24,251 ____________________________________________________________________________________________________________
1955-60 Average 24,310 969 607 25,886 ____________________________________________________________________________________________________________
1960-65 Average 30,033 1,070 578 31,681 ____________________________________________________________________________________________________________
1965-70 Average 34,999 1,073 574 36,646 ____________________________________________________________________________________________________________
1970-75 Average 35,767 1,065 563 37,395 ____________________________________________________________________________________________________________
1975-80 Average 34,966 1,001 548 36,515 ____________________________________________________________________________________________________________
1980-85 Average 34,643 826 446 35,915 ____________________________________________________________________________________________________________
1985-90 Average 34,774 626 340 35,740 ____________________________________________________________________________________________________________
1990-95 Average 29,712 532 248 30,492 ____________________________________________________________________________________________________________
1995-2000 Average 24,369 417 48 24,834 ____________________________________________________________________________________________________________
2000-2005 Average 22,676 188 24 22,888 ____________________________________________________________________________________________________________
2005-2010 Average 18,499 70 .. 18,569 ____________________________________________________________________________________________________________
2010-2011 18,402 66 .. 18,468 ____________________________________________________________________________________________________________
2011-2012 17,545 66 .. 17,611 ____________________________________________________________________________________________________________
2012-2013 16,635 .. .. 16,635 ____________________________________________________________________________________________________________
2013-2014 16,179 .. .. 16,179 _________________________________________________________________________________________________
2014-2015 15,452 .. .. 15,452 ______________________________________________________________________________________________________ 2015-2016 15,324 .. .. 15,324
____________________________________________________________________________________________________________
136

PASSENGERS CARRIED and Kilometres
During the year 2015-2016, the Pakistan Railways carried 52,192,269
passengers making a total of 21,200,910,079 passenger-kilometres, averaging
406 kilometres per passenger. These figures include passengers travelling on
reduced fare tickets but excluding those travelling on free passes.
Year-wise figures are shown below :-
No. of Total Average Average Average Rate
Year.
Passengers Passenger No. of Revenue Charged per
Carried Kilometers Kilometres per Passenger In in travelled by Passenger per Kilometre
(Thousand) (Thousand) a Passenger in (Rs.) (in Paisa)
1950-55 Average 78,942 6,778,538 85.9 1.50 1.75 ____________________________________________________________________________________________________________
1955-60 Average 102,657 8,064,025 78.5 1.56 1.99 ____________________________________________________________________________________________________________
1960-65 Average 126,284 9,533,593 75.5 1.55 2.05 ____________________________________________________________________________________________________________
1965-70 Average 130,475 10,025,201 76.9 1.83 2.28 ____________________________________________________________________________________________________________
1970-75 Average 134,076 10,792,170 80.5 2.36 2.93 ____________________________________________________________________________________________________________
1975-80 Average 145,710 15,111,969 103.7 4.47 4.31 ____________________________________________________________________________________________________________
1980-85 Average 113,474 17,402,638 153.4 11.32 7.21 ____________________________________________________________________________________________________________
1985-90 Average 82,319 18,483,168 224.5 21.15 9.42 ____________________________________________________________________________________________________________
1990-95 Average 69,084 17,828,907 258.1 40.76 15.55 ____________________________________________________________________________________________________________
1995-2000 Average 67,964 18853,609 277.4 65.22 23.35 ____________________________________________________________________________________________________________
2000-2005 Average 72,828 21,992,225 301.9 101.87 33.70 ____________________________________________________________________________________________________________
2005-2010 Average 80,557 20,970,516 312.9 139.24 44.51 ____________________________________________________________________________________________________________
2010-2011 64,903 20,618,829 317.68 184.36 58.03 ____________________________________________________________________________________________________________
2011-2012 41,097 16,093,350 391.59 271.07 69.27 ____________________________________________________________________________________________________________
2012-2013 41,957 17,388,413 414.43 322.62 77.85 ____________________________________________________________________________________________________________
2013-2014 47,690 19,778,557 366.5 331.51 90.45 ______________________________________________________________________________________________________________________________________________________________
2014-2015 52,951 20,288,038 383.15 339.40 88.58 ___________________________________________________________________________________________________________________________ 2015-2016 52,192 21,200,910 406.21 399.89 98.45 ____________________________________________________________________________________________________________
139

Percentage of Passengers Carried Class-Wise Out of 52,192,269 passengers carried during 2015-2016 69,808 (0.13%) travelled in
Air-conditioned sleeper, 154,772 (0.30%) in Air-conditioned sitter, 20,056(0.04%) in
First Class Sleeper, 550,235 (1.05%) in Air-conditioned (Standard) class, 49,733,307
(95.29%) in Economy class 467,791 (0.90 %) in the Second Class and 1,196,301
(2.29%) in Air-Conditioned Business Class. These are tabulated below:-
Air Condi-
Upper Class
( InThousand)
First Class Second Class
Third Class Total
Year.
tioned Class Rail-cars
No. % No. % No. % No. % No. % No.
1950-55 71 0.09 430 0.54 .. .. 3,612 4.58 74,829 94.8 78,942
Average 1955-60 84 0.08 490 0.48 .. .. 4,556 4.44 97,527 95.0 102,657
Average 1960-65 90 0.07 477 0.38 7 0.01 5,749 4.55 119,961 95.0 126,284
Average 1965-70 99 0.08 374 0.29 10 0.01 5,838 4.47 124.157 95.2 130,478
Average 1970-75 88 0.07 343 0.25 45 0.03 5.716 4.25 127,884 95.4 134,076
Average
1975-76 85 0.06 331 0.22 70 0.05 6,146 4.17 140,685 95.5 147,317
1976-77 72 0.05 293 0.21 75 0.05 4,937 3.46 137,184 96.2 142,561
Air-Conditioned Upper Class
First Class Second Class Total
Year.
Class Rail cars.
No. % No. % No. % No. % No.
1977-78 83 0.06 71 0.05 4,594 3.35 143,852 96.5 149,000
1978-79 97 0.07 71 0.05 5,360 3.67 140,470 96.5 145,998
Air-Conditioned Class First Class
Sitter
Second Class
Year.
Sleeper Sitter Sleeper Second Class Total
No. % No. % No. % No. % No. % No.
1979-80* 96 0.07 115 0.08 286 0.20 4,316 3.00 138,861 96.65 143,674
1980-85 92 0.08 166 0.14 528 0.47 3,051 2.68 109,633 96.63 113,470
Average
1985-88 84 0.10 179 0.22 601 0.74 2,011 2.48 77,893 96.43 8,077
Average
140

Air-Conditioned
(Thousand)
First Class
Air- Economy Second
Class
Sleeper
Sitter
Condi-
Class Class Total
Sleeper
Sitter
tioned
Year.
No. %
No.
%
No. %
Lower
No. % No.
No. % No. % No. %
1988-89 83 0.10 243 0.29 618 0.73 2,252 266 65 0.08 .. .. 81433 96.04 84694
1989-90 79 0.09 309 0.37 618 0.73 2,418 292 110 0.13 479 053 80580 95.23 84593
1990-95 65 0.09 243 0.41 590 0.81 1,471 212 363 0.52 9,459 2812 47680 67.98 59871
Average
1995-2000 76 0.11 258 0.38 624 0.95 Nil Nil 1268 1.88 30,100 44.54 35416 52.14 67964
Average
2000-2005 95 0.13 145 0.20 503 0.69 Nil Nil 1731 2.36 36,703 50.34 33650 46.25 72827
Average
2005-2006 74 0.9 312 0.38 197 0.24 Nil Nil 2384 2.92 45,477 55.84 32984 40.05 81428
2006-2007 88 0.10 287 0.34 176 0.21 Nil Nil 2662 3.17 50,086 59.70 30600 36.48 83899
Air-Conditioned First
Air-Conditioned
Economy Second
Class
Lower
Total
Average
Sitter
Class
Sleeper Sleeper Business Standard Class Class
Year. No. % No.
% No. %
No. %
No. % No. % No. % No.
2007-08 64 0.08 302 0.38 93 0.12 231 0.29 2184 2.73 50171 62.73 26,939 33.68 79,984
2008-09 65 0.08 270 0.33 65 0.08 464 0.56 1863 2.26 53162 64.41 26,653 32.29 82,542
2009-10 62 0.08 271 0.36 33 0.04 496 0.66 896 1.20 52324 69.83 20,851 27.83 74,933
2010-11 40 0.06 219 0.34 33 0.05 433 0.67 835 1.28 48,540 74.8 14,803 22.8 64,903
2011-12 30 0.07 121 0.30 18 0.04 330 0.08 436 1.06 37,347 90.88 2,814 6.85 41,097
2012-13 28 0.07 106 0.25 11 0.03 290 0.68 533 1.27 38,996 92.94 1,993 4.75 41,957
2013-14 53 0.11 94 0.20 21 0.05 642 1.35 351 0.74 45,491 95.39 1.038 2.18 47,690
2014-15 79 0.15 109 0.21 21 0.04 937 1.77 410 0.77 50,507 95.38 888 1.68 50,951
*2015-16 70 0.13 155 0.30 20 0.04 1196 2.29 550 1.05 49,733 95.29 468 0.90 52,192
*Provisional
141

FREIGHT WAGONS LOADED
243,794 freight wagons were loaded during 2015-2016 on the entire system.
These figures also include wagons received from foreign Railways.
Year-wise figures are given below :-
Year. Broad-Gauge Metre-Gauge Narrow-Gauge Total
(No.) (No.) (No.) (No.) ______________________________________________________________________________________________
1950-55 Average 806,919 54,944 20,402 882,265 ______________________________________________________________________________________________
1955-60 Average 922,484 55,402 18,627 996,513 ______________________________________________________________________________________________
1960-65 Average 1,092,091 52,849 14,692 1,159,632 ______________________________________________________________________________________________
1965-70 Average 1,101,489 37,357 16,626 1,155,472 ______________________________________________________________________________________________
1970-75 Average 919,347 24,180 13,512 957,039 ______________________________________________________________________________________________
1975-80 Average 671,019 7,003 2,674 680,696 ______________________________________________________________________________________________
1980-85 Average 593,765 2,632 998 597,395 ______________________________________________________________________________________________
1985-90 Average 582,447 1,570 356 584,373 ______________________________________________________________________________________________
1990-95 Average 413,577 350 38 413,966 ______________________________________________________________________________________________
1995-2000 Average 337,604 60 Nil 337,664 ______________________________________________________________________________________________
2000-2005 Average 307,871 Nil Nil 307,871 ______________________________________________________________________________________________
2005-2010 Average 32,5308 Nil Nil 325,308 ______________________________________________________________________________________________
2010-2011 126,987 Nil Nil 126,987 ______________________________________________________________________________________________
2011-2012 61,392 Nil Nil 61,392 ______________________________________________________________________________________________
2012-2013 46, 640 Nil Nil 46,640 ______________________________________________________________________________________________
2013-2014 76,307 Nil Nil 76,307 ____________________________________________________________________________________________________________
2014-2015 176,155 Nil Nil 176,155 _________________________________________________________________________________________________________
2015-2016 243,794 Nil Nil 243,794 ______________________________________________________________________________________________ Note.-Figures as per L.S.P.R.
146

COMMODITY-WISE (TONNES) FREIGHT CARRIED
(Figures in thousand).
S.
Name of commodities.
2011 2012 2013 2014 2015 No. 2012 2013 2014 2015 2016
1 Ballast and Stone 2 .. 7 15 17 2 Cement 427 159 160 255 283 3 Chemical manures (Fertilizers) 1 .. .. 58 107 4 Coal and Coke for the Public .. .. 161 596 881 5 Departmental Commodities
86 88 134 132 160 5a Coal, Coke and Patent fuel for Railways
5b (including H.S.D. and furnace oil)
398 436 618 608 661 Railway Material and Stores 6 Cotton Raw, unpressed and full pressed .. .. .. .. .. 7 Fire wood 6 5 4 6 3 8 Fruits and Vegetable fresh .. .. .. .. .. 9 Gross Dry .. .. .. .. ..
10 Gypsum .. .. 3 2 .. 11 Hides, Skin or pelts common .. .. .. .. .. 12 Iron and Steel Division "A" includes angle, .. .. .. .. ..
13 axles, sheets, girders etc.,
.. .. .. .. ..
Iron and Steel Division "B"
14 Iron and Steel Division "C" .. .. .. .. .. 15 Jagree
.. .. .. .. ..
16 Jute, manufactured
17 Live-stock .. .. .. .. .. 18 Machinery, electrical .. .. .. .. .. 19 Machinery, other than electrical .. .. .. .. .. 20 Molasses .. .. .. .. .. 21 Oil Division "D" includes vacuum refined 23 .. .. .. ..
22 edible oil
10 16 35 66 58 Oil Seeds 23 Ores, common .. .. .. .. .. 24 Other grains and pulses .. .. .. .. .. 25 Paddy and Rice 2 .. .. 17 35 26 Petroleum and other hydrocarbon oils non-
dangerous i.e., having flashing point at
above 76 Fahr. .. 1 .. .. ..
(a) Division "B" includes Diesel oil
27 (b) Division "C" includes furnace oil 19 114 305 668 857 Petroleum and other hydro-carbon oils .. .. .. .. ..
dangerous i.e., having a flashing point
28 below 76 Fahr. includes Petrol oil.
.. .. .. .. ..
Petroleum and other hydro-carbon oils
non-dangerous i.e., having a flashing point
below 76 Fahr. For Division "A" includes
29 Kerosene Oil etc.
.. .. .. .. ..
Piece-goods, cotton, woolen or artificial
30 silk etc.
13 21 16 11 ..
Salt 31 Sugar .. .. 1 .. .. 32 Sugarcane .. .. .. .. .. 33 Timber .. .. .. .. .. 34 Tobacco manufactured .. .. .. .. .. 35 Wheat .. .. .. .. .. 36 Wool .. .. .. .. .. 37 Miscellaneous 277 119 116 642 936 38 Container Traffic 61 57 50 524 1,003
Total
1,323 1,016 1,610 3,600 5001
150

COMMODITY-WISE TONNE KILOMETRES
(Figures in thousand).
S.
Name of commodities.
2011- 2012- 2013- 2014- 2015- No. 2012 2013 2014 2015 2016
1 Ballast and Stone 727 .. 2,622 5,308 4,184 2 Cement 36,375 25,809 22,018 311,219 353,843
3 Chemical manures (Fertilizers) ..
914 .. .. 55,527 77,002 4 Coal and Coke for the Public .. 205,708 741,768 1,050,401 5 Departmental Commodities
67,710 50,554 91,110 51,896 45,769 5a Coal, Coke and Patent fuel for Railways
5b (including H.S.D. and furnace oil)
111,635 155,788 218,704 205,356 204,792 Railway Material and Stores 6 Cotton Raw, unpressed and full pressed .. .. .. .. .. 7 Fire wood 3,979 2,885 3,653 5,492 2,688
8 Fruits and Vegetable fresh .. .. .. .. .. 9 Gross Dry ..
37 .. ..
521 ..
975 ..
10 Gypsum ..
.. .. ..
..
11 Hides, Skin or pelts common .. ..
12 Iron and Steel Division "A" includes .. .. .. .. ..
13 angle, axles, sheets, girders etc.,
..
..
..
..
..
Iron and Steel Division "B"
14 Iron and Steel Division "C" .. .. .. .. ..
15 Jagree ..
..
..
..
..
16 Jute, manufactured
17 Live-stock .. .. .. .. ..
18 Machinery, electrical .. .. .. .. ..
19 Machinery, other than electrical .. .. .. .. ..
20 Molasses .. 519
.. .. .. ..
21 Oil Division "D" includes vacuum re- .. .. .. ..
22 fined edible oil
259
368 18,351 54,496 40,299 Oil Seeds .. .. 23 Ores, common .. .. ..
24 Other grains and pulses .. .. .. .. ..
25 Paddy and Rice 1,895 .. .. 18,704 38,242 26 Petroleum and other hydrocarbon oils
non-dangerous i.e., having flashing
point at above 76 Fahr.
95
57 ..
..
..
(a) Division "B" includes Diesel oil
27 (b) Division "C" includes furnace oil 18,476 102,916 287,068 579,548 777,231 Petroleum and other hydro-carbon oils .. .. .. .. ..
dangerous i.e., having a flashing point
28 below 76 Fahr. includes Petrol oil.
..
..
..
..
..
Petroleum and other hydro-carbon oils
non-dangerous i.e., having a flashing
point below 76 Fahr. For Division "A"
29 includes Kerosene Oil etc.
..
..
..
..
..
Piece-goods, cotton, woolen or artifi-
30 cial silk etc.
2,744 4,073 2,763 4,536 1,098 Salt
31 Sugar ..
461 ..
188 ..
1 .. .. 32 Sugarcane
12 .. ..
33 Timber ..
.. .. .. ..
34 Tobacco manufactured .. .. .. ..
35 Wheat .. .. .. .. ..
36 Wool .. .. .. .. ..
37 Miscellaneous 85,216 12,367 180,228 666,158 1,031,247
38 Container Traffic 71,427 64,236 57,585 600,455 1,146,752
Total 402,481 419,2411,090,332 3,301,438 4,773,548
151
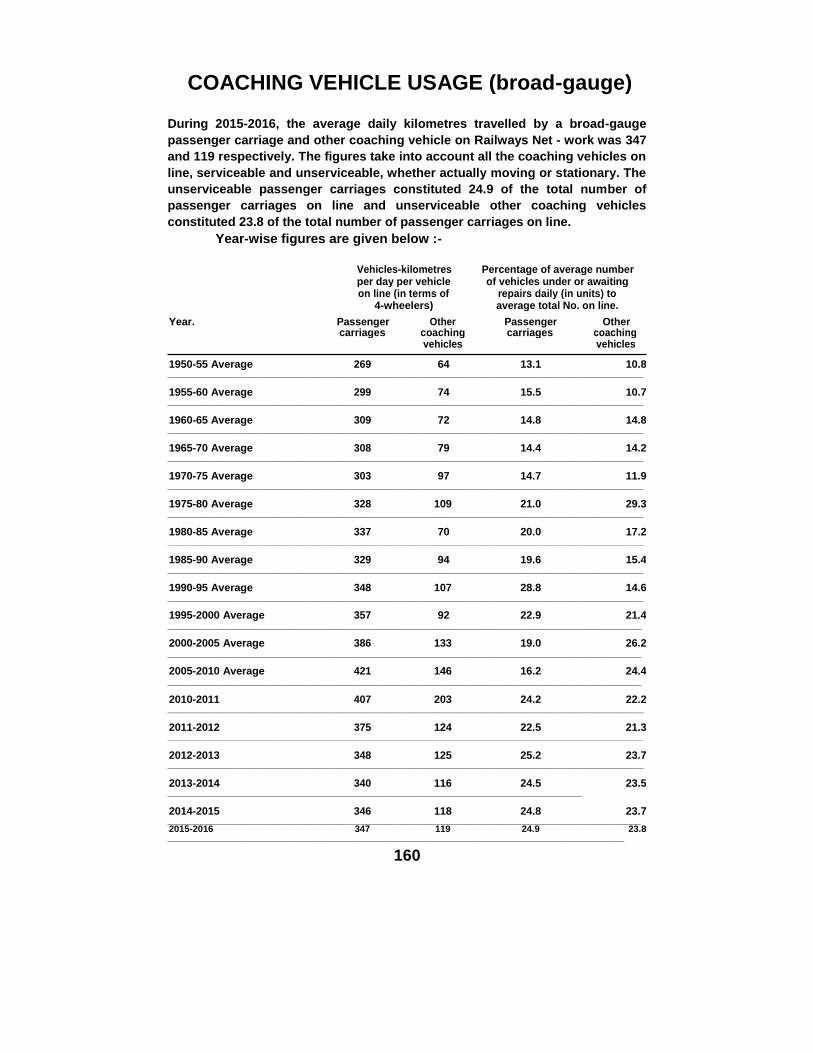
COACHING VEHICLE USAGE (broad-gauge)
During 2015-2016, the average daily kilometres travelled by a broad-gauge
passenger carriage and other coaching vehicle on Railways Net - work was 347
and 119 respectively. The figures take into account all the coaching vehicles on
line, serviceable and unserviceable, whether actually moving or stationary. The
unserviceable passenger carriages constituted 24.9 of the total number of
passenger carriages on line and unserviceable other coaching vehicles
constituted 23.8 of the total number of passenger carriages on line. Year-wise figures are given below :-
Vehicles-kilometres Percentage of average number per day per vehicle of vehicles under or awaiting on line (in terms of repairs daily (in units) to
Year.
4-wheelers) average total No. on line.
Passenger Other Passenger Other carriages coaching carriages coaching
1950-55 Average 269
vehicles vehicles
64 13.1 10.8 ______________________________________________________________________________________________
1955-60 Average 299 74 15.5 10.7 ______________________________________________________________________________________________
1960-65 Average 309 72 14.8 14.8 ______________________________________________________________________________________________
1965-70 Average 308 79 14.4 14.2 ______________________________________________________________________________________________
1970-75 Average 303 97 14.7 11.9 ______________________________________________________________________________________________
1975-80 Average 328 109 21.0 29.3 ______________________________________________________________________________________________
1980-85 Average 337 70 20.0 17.2 ______________________________________________________________________________________________
1985-90 Average 329 94 19.6 15.4 ______________________________________________________________________________________________
1990-95 Average 348 107 28.8 14.6 ______________________________________________________________________________________________
1995-2000 Average 357 92 22.9 21.4 _____________________________________________________________________________________________
2000-2005 Average 386 133 19.0 26.2 ______________________________________________________________________________________________
2005-2010 Average 421 146 16.2 24.4 ______________________________________________________________________________________________
2010-2011 407 203 24.2 22.2 ______________________________________________________________________________________________
2011-2012 375 124 22.5 21.3 ______________________________________________________________________________________________
2012-2013 348 125 25.2 23.7 ______________________________________________________________________________________________
2013-2014 340 116 24.5 23.5 ________________________________________________________________________________
2014-2015 346 118 24.8 23.7 _______________________________________________________________________________________________________ 2015-2016 347 119 24.9 23.8 _______________________________________________________________________________________________________
160
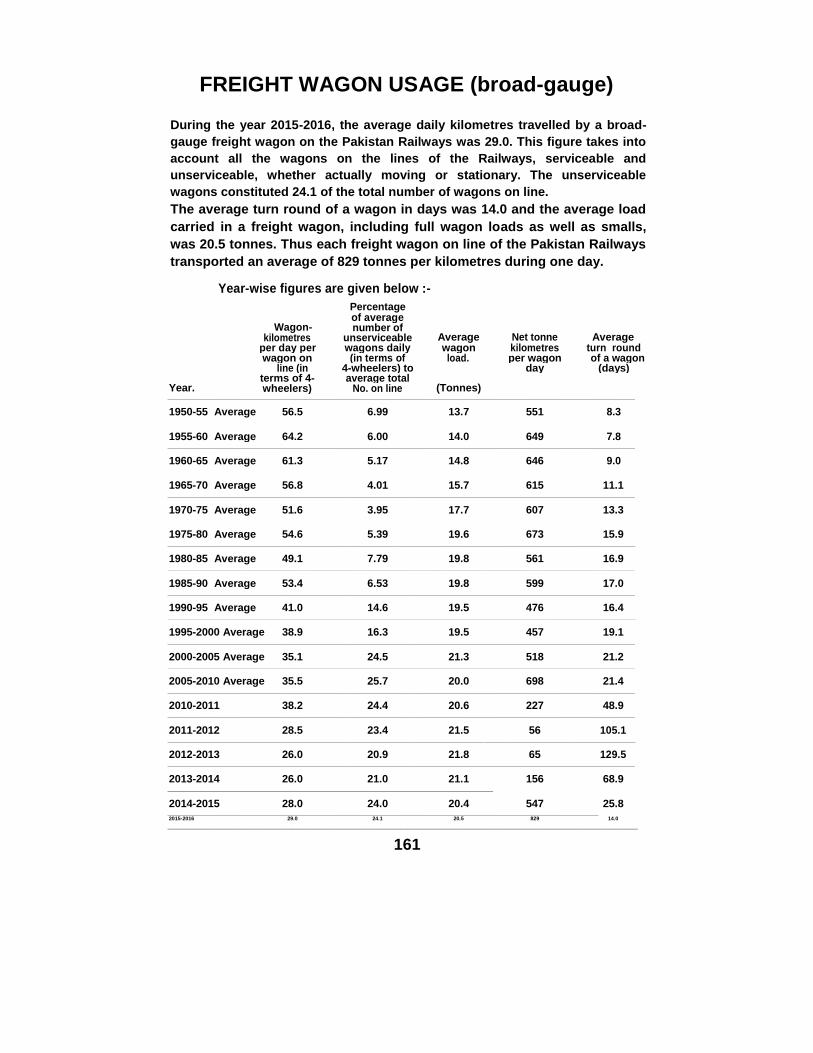
FREIGHT WAGON USAGE (broad-gauge)
During the year 2015-2016, the average daily kilometres travelled by a broad-
gauge freight wagon on the Pakistan Railways was 29.0. This figure takes into
account all the wagons on the lines of the Railways, serviceable and
unserviceable, whether actually moving or stationary. The unserviceable
wagons constituted 24.1 of the total number of wagons on line. The average turn round of a wagon in days was 14.0 and the average load
carried in a freight wagon, including full wagon loads as well as smalls,
was 20.5 tonnes. Thus each freight wagon on line of the Pakistan Railways
transported an average of 829 tonnes per kilometres during one day.
Year-wise figures are given below :- Percentage
Wagon- of average
number of Average Net tonne Average kilometres unserviceable
per day per wagons daily wagon kilometres turn round wagon on (in terms of load. per wagon of a wagon line (in 4-wheelers) to day (days)
Year. terms of 4- average total
(Tonnes)
wheelers) No. on line ___________________________________________________________________________________________________________________
1950-55 Average 56.5 6.99 13.7 551 8.3 ___________________________________________________________________________________________________________________
1955-60 Average 64.2 6.00 14.0 649 7.8 ___________________________________________________________________________________________________________________
1960-65 Average 61.3 5.17 14.8 646 9.0 ___________________________________________________________________________________________________________________
1965-70 Average 56.8 4.01 15.7 615 11.1 ___________________________________________________________________________________________________________________
1970-75 Average 51.6 3.95 17.7 607 13.3 ___________________________________________________________________________________________________________________
1975-80 Average 54.6 5.39 19.6 673 15.9 ___________________________________________________________________________________________________________________
1980-85 Average 49.1 7.79 19.8 561 16.9 ___________________________________________________________________________________________________________________
1985-90 Average 53.4 6.53 19.8 599 17.0 ___________________________________________________________________________________________________________________
1990-95 Average 41.0 14.6 19.5 476 16.4 ___________________________________________________________________________________________________________________
1995-2000 Average 38.9 16.3 19.5 457 19.1 ___________________________________________________________________________________________________________________
2000-2005 Average 35.1 24.5 21.3 518 21.2 ___________________________________________________________________________________________________________________
2005-2010 Average 35.5 25.7 20.0 698 21.4 ___________________________________________________________________________________________________________________
2010-2011 38.2 24.4 20.6 227 48.9 ___________________________________________________________________________________________________________________
2011-2012 28.5 23.4 21.5 56 105.1 ___________________________________________________________________________________________________________________
2012-2013 26.0 20.9 21.8 65 129.5 ___________________________________________________________________________________________________________________
2013-2014 26.0 21.0 21.1 156 68.9 ________________________________________________________________________________
2014-2015 28.0 24.0 20.4 547 25.8 __________________________________________________________________________________________________________ 2015-2016 29.0 24.1 20.5 829 14.0
__________________________________________________________________________________________________________
161

Percentage of Diesel and Electric Locomotive Usage (broad-gauge)
During the year 2015-2016, percentage of diesel locomotives in use to all
locomotives in use was 100.0 and the percentage of work done by diesel
locomotives to total work done was 100.0 and 100. 0 in terms of engine-
kilom etres, train-kilometres and gross tonne -kilometres respectively.
Figures year by year are given below :-
Percentage of work done by Diesel
locomotives to total work done.
Percentage of work done by Electric
locomotives to total work done.
Year. Engine Train Gross Engine Train Gross Kilo- Kilo- Tonne Kilo- Kilo- Tonne metres metres Kilome- metres metres Kilome- tres tres ______________________________________________________________________________________________
1950-55 Average .. .. .. .. .. .. ______________________________________________________________________________________________
1955-60 Average 30.4 34.9 42.1 .. .. .. ______________________________________________________________________________________________
1960-65 Average 46.5 53.5 62.1 .. .. .. ______________________________________________________________________________________________
1965-70 Average 56.4 64.1 73.0 .. .. .. ______________________________________________________________________________________________
1970-75 Average 63.9 71.2 79.3 5.05 6.36 7.09 ______________________________________________________________________________________________
1975-80 Average 70.3 78.3 84.4 6.08 7.60 7.67 ______________________________________________________________________________________________
1980-85 Average 74.1 80.8 86.6 5.16 6.37 7.11 ______________________________________________________________________________________________
1985-90 Average 86.3 89.0 91.2 4.23 5.00 5.92 ______________________________________________________________________________________________
1990-95 Average 92.8 93.1 94.4 3.51 4.15 4.53 ______________________________________________________________________________________________
1995-2000 Average 96.3 94.6 96.6 3.35 3.84 3.29 ______________________________________________________________________________________________
2000-2005 Average 98.3 97.0 97.6 1.95 3.00 2.37 ______________________________________________________________________________________________
2005-2010 Average 99.1 98.9 99.0 0.57 0.99 1.49 ______________________________________________________________________________________________
2010-2011 100.0 100.0 100.0 Nil Nil Nil ______________________________________________________________________________________________
2011-2012 100.0 100.0 100.0 Nil Nil Nil ______________________________________________________________________________________________
2012-2013 100.0 100.0 100.0 Nil Nil Nil ______________________________________________________________________________________________
2013-2014 100.0 100.0 100.0 Nil Nil Nil
2014-2015 100.0 100.0 100.0 Nil Nil Nil
2015-2016 100.0 100.0 100.0 Nil Nil Nil
162

FUEL CONSUMTION
During the year 2015- 2016 the Railways Net work consumed Nil tonnes of
coal, 663 tonnes of furnace oil and 139,487 Liters .H.S.D.oil. These
quantities comprise the entire fuel consumed on the Railways, i.e., on
locomotives, power houses, water pumps, workshops,etc. The average
price of these fuels at receiving points during the year was Rs.39600.05 per
M.T for the furnace oil and Rs.79.01 per liters all services for H.S.D. oil. The
cost of electric energy (including fuel surcharge) per unit was Rs.14.00. Quantities of these fuels for the various years are given below:-
COAL FURNACE OIL H.S.D. OIL Electric
(Tonnes)
(M.Tonnes)
(Liters Thousan) energy K.W.H.
Year.
Loco- Other than Loco - Other than Loco- Other than All motive locomotive motive locomotive motive locomo- services
purposes purposes purposes purposes pur- tive pur- (fig. in poses poses thousand.)
______________________________________________________________________________________________
1950-55 Average 270,133 51,279 426,076 23,479 7,647 138 .. ______________________________________________________________________________________________
1955-60 Average 123,706 49,386 461,936 32.197 35,750 79 .. ______________________________________________________________________________________________
1960-65 Average 66,832 36,783 482,371 38,923 80,108 783 .. ______________________________________________________________________________________________
1965-70 Average 27,710 21,010 496,506 45,572 117,235 1,265 .. ______________________________________________________________________________________________
1970-75 Average 19,639 7,479 343,430 30,675 126,013 2,322 .. ______________________________________________________________________________________________
1975-80 Average 1,668 4,605 286,194 23,957 139,588 1,898 .. ______________________________________________________________________________________________
1980-85 Average Nil 2,547 236,032 21,024 146,210 2,393 .. ______________________________________________________________________________________________
1985-90 Average Nil 1,965 115,320 8,909 163,498 3,714 37,402 ______________________________________________________________________________________________
1990-95 Average Nil 1,107 46,635 5,829 147,798 3,833 27,918 ______________________________________________________________________________________________
1995-2000 Average Nil 541 10,737 3,753 132,426 5,203 16,907 ______________________________________________________________________________________________
2000-2005 Average Nil 107.96 490 1,138 144,535 1,239 6,133 ______________________________________________________________________________________________
2010-2011 Nil 200.00 20.3 441.5 124,254 1,375 Nil ______________________________________________________________________________________________
2011-2012 Nil Nil 0.6 168.7 85,847 1,549 Nil ______________________________________________________________________________________________
2012-2013 Nil Nil Nil 363.7 80,758 1,664 Nil ______________________________________________________________________________________________
2013-2014 NIL NIl Nil 492.6 96,787 1,425 Nil _________________________________________________________________________________
2014-2015 Nil NIl Nil 561.9 120,465 1,371 Nil _________________________________________________________________________________
2015-2016 Nil Nil Nil 662.9 137.908 1,579 Nil _________________________________________________________________________________
163
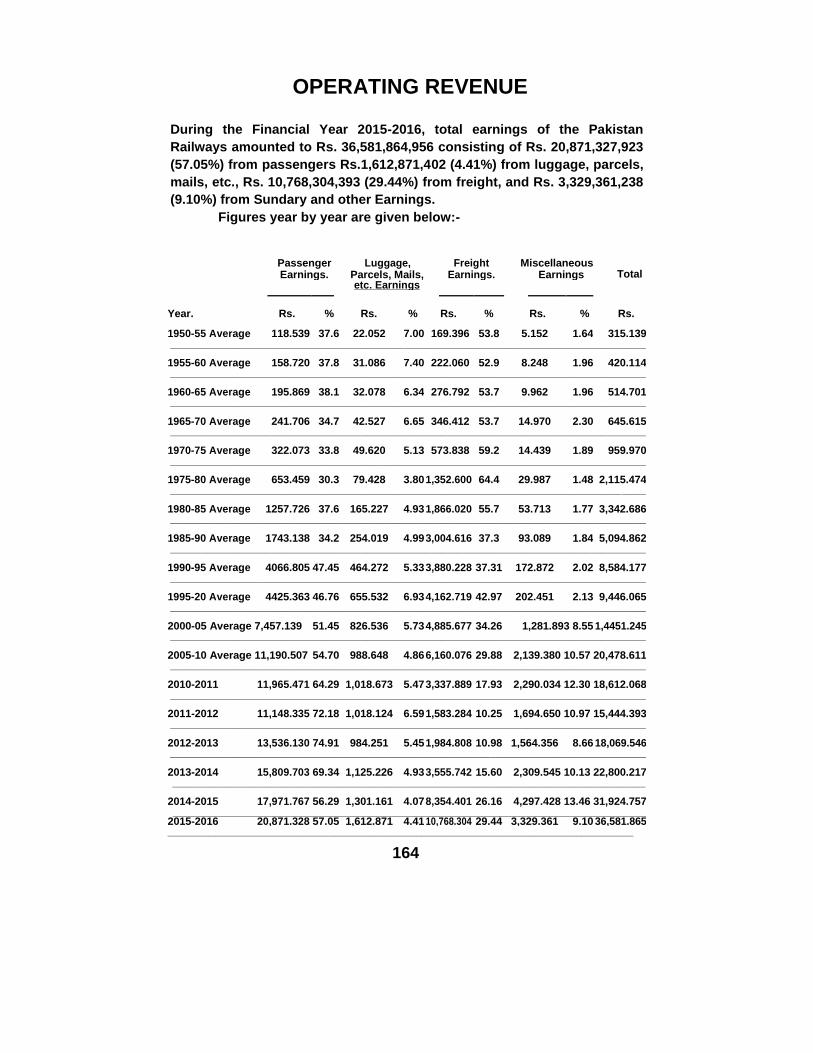
OPERATING REVENUE
During the Financial Year 2015-2016, total earnings of the Pakistan
Railways amounted to Rs. 36,581,864,956 consisting of Rs. 20,871,327,923
(57.05%) from passengers Rs.1,612,871,402 (4.41%) from luggage, parcels,
mails, etc., Rs. 10,768,304,393 (29.44%) from freight, and Rs. 3,329,361,238
(9.10%) from Sundary and other Earnings. Figures year by year are given below:-
Passenger Luggage, Freight Miscellaneous Total Earnings. Parcels, Mails, Earnings. Earnings
etc. Earnings
Year.
Rs. %
Rs. Rs. % Rs. % Rs. %
1950-55 Average 118.539 37.6 22.052 7.00 169.396 53.8 5.152 1.64 315.139 ____________________________________________________________________________________________________________________
1955-60 Average 158.720 37.8 31.086 7.40 222.060 52.9 8.248 1.96 420.114 ____________________________________________________________________________________________________________________
1960-65 Average 195.869 38.1 32.078 6.34 276.792 53.7 9.962 1.96 514.701 ____________________________________________________________________________________________________________________
1965-70 Average 241.706 34.7 42.527 6.65 346.412 53.7 14.970 2.30 645.615 ____________________________________________________________________________________________________________________
1970-75 Average 322.073 33.8 49.620 5.13 573.838 59.2 14.439 1.89 959.970 ____________________________________________________________________________________________________________________
1975-80 Average 653.459 30.3 79.428 3.80 1,352.600 64.4 29.987 1.48 2,115.474 ____________________________________________________________________________________________________________________
1980-85 Average 1257.726 37.6 165.227 4.93 1,866.020 55.7 53.713 1.77 3,342.686 ____________________________________________________________________________________________________________________
1985-90 Average 1743.138 34.2 254.019 4.99 3,004.616 37.3 93.089 1.84 5,094.862 ____________________________________________________________________________________________________________________
1990-95 Average 4066.805 47.45 464.272 5.33 3,880.228 37.31 172.872 2.02 8,584.177 ____________________________________________________________________________________________________________________
1995-20 Average 4425.363 46.76 655.532 6.93 4,162.719 42.97 202.451 2.13 9,446.065 ___________________________________________________________________________________________________________________
2000-05 Average 7,457.139 51.45 826.536 5.73 4,885.677 34.26 1,281.893 8.55 1,4451.245 ____________________________________________________________________________________________________________________
2005-10 Average 11,190.507 54.70 988.648 4.86 6,160.076 29.88 2,139.380 10.57 20,478.611 ____________________________________________________________________________________________________________________
2010-2011 11,965.471 64.29 1,018.673 5.47 3,337.889 17.93 2,290.034 12.30 18,612.068 ____________________________________________________________________________________________________________________
2011-2012 11,148.335 72.18 1,018.124 6.59 1,583.284 10.25 1,694.650 10.97 15,444.393 ____________________________________________________________________________________________________________________
2012-2013 13,536.130 74.91 984.251 5.45 1,984.808 10.98 1,564.356 8.66 18,069.546 ____________________________________________________________________________________________________________________
2013-2014 15,809.703 69.34 1,125.226 4.93 3,555.742 15.60 2,309.545 10.13 22,800.217 _________________________________________________________________________________________
2014-2015 17,971.767 56.29 1,301.161 4.07 8,354.401 26.16 4,297.428 13.46 31,924.757 __________________________________________________________________________________________
2015-2016 20,871.328 57.05 1,612.871 4.41 10,768.304 29.44 3,329.361 9.10 36,581.865 __________________________________________________________________________________________
164

PERCENTAGE OF EXPENDITURE TO
GROSS EARNINGS
During the year 2015-2016, Ordinary Operating Expenses of the Railways were
114.42% to total earnings. The expenditure on repairs and maintenance of
track, buildings, rolling -stock, etc., was 38.99%, operation fuel 30.14%,
operation staff 17.43%, operation other than staff and fuel 4.60% administration
22.81% and miscellaneous expenditure 0.45% to total earnings.
Repair & Opera- Opera- Opera- Adminis- Miscel- Total
Year. Mainte- tion ting tion tration. laneous. Ordinary nance. Fuel. Staff. other Working
than Expenses Staff & to Gross
% % %
Fuel.
% %
Earnings.
% % ______________________________________________________________________________________________
1950-55 Average 22.5 18.8 11.0 2.69 8.51 3.08 66.6 ______________________________________________________________________________________________
1955-60 Average 21.5 15.5 9.66 2.26 8.27 2.58 59.8 ______________________________________________________________________________________________
1960-65 Average 25.7 15.4 11.3 2.39 9.55 2.89 67.23 ______________________________________________________________________________________________
1965-70 Average 26.6 19.5 11.5 2.54 10.4 3.56 74.0 ______________________________________________________________________________________________
1970-75 Average 29.3 20.2 12.2 3.20 10.7 2.11 77.7 ______________________________________________________________________________________________
1975-80 Average 33.7 20.6 11.1 3.78 10.5 0.58 80.3 ______________________________________________________________________________________________
1980-85 Average 38.6 29.0 11.3 4.51 11.9 0.43 95.7 ______________________________________________________________________________________________
1985-90 Average 40.6 19.8 11.7 5.72 12.3 0.41 90.53 ______________________________________________________________________________________________
1990-95 Average 38.5 14.0 11.7 6.68 12.2 0.56 83.64 ______________________________________________________________________________________________
1995-2000 Average 45.50 17.39 12.79 10.68 14.15 0.70 101.21 ______________________________________________________________________________________________
2000-2005 Average 33.91 22.35 9.70 6.53 12.11 0.48 85.08 ______________________________________________________________________________________________
2005-2010 Average 40.03 40.22 11.68 5.76 15.56 0.58 113.83 ______________________________________________________________________________________________
2010-2011 63.63 53.32 20.76 4.47 25.92 0.94 169.04 ______________________________________________________________________________________________
2011-2012 77.55 55.11 29.37 6.06 35.05 0.45 203.59 ______________________________________________________________________________________________
2012-2013 70.06 48.23 28.43 11.33 35.23 1.08 194.36 ______________________________________________________________________________________________
2013-2014 59.07 48.18 24.55 10.93 30.98 0.83 174.54
*2014-2015 46.28 34.74 19.47 8.23 22.11 0.70 131.53
2015-2016 38.99 30.14 17.43 4.60 22.81 0.45 114.42 * Provisional
168

Mission Statement
To provide a competitive, safe,
reliable, market oriented, efficient
and environment-friendly
mode of transport.
With the
Compliments of the
CEO/Sr.General Manager
Pakistan Railways
Headquarters Office,
Lahore.

Mission Statement
To provide a competitive, safe,
reliable, market oriented, efficient
and environment-friendly
mode of transport.

Y.B.-1. Y.B.-2. Y.B.-3. Y.B.-4. Y.B.-5.
Y.B.-6. Y.B.-7. Y.B.-8. Y.B.-9. Y.B.-10.
Y.B.-11. Y.B.-12. Y.B.-13. Y.B.-14. Y.B.-15.
Y.B.-16. Y.B.-17. Y.B.-18. Y.B.-19. Y.B.-20.
Y.B.-21. Y.B.-22. Y.B.-23. Y.B.-24.
Y.B.-1. Y.B.-2. Y.B.-3. Y.B.-4. Y.B.-5.
Y.B.-6. Y.B.-7. Y.B.-8. Y.B.-9. Y.B.-10.
Y.B.-11. Y.B.-12. Y.B.-13. Y.B.-14. Y.B.-15.
Y.B.-16. Y.B.-17. Y.B.-18. Y.B.-19. Y.B.-20.
Y.B.-21. Y.B.-22. Y.B.-23. Y.B.-24.

1 2 3 4 5 6 7
8 9 10 11 12 13 14
15 16 17 18 19 20 21
22 22 23 24 25 26 27
28 29 30 31 32 33 34
35 36 37 38 39 40 41
41 42 43 44 45 46 47
48 49 50 51 52 53 54
55 56 57 58 59 60 61
62 63 64 65 66 67 68
69 70 71 72 73 74 75
76 77 78 79 80 81 82
83 84 85 86 87 88 89
90 91 92 93 94 95 96
97 98 99 100 101 102 103
104 105 106 107 108 109 110
111 112 113 114 115 116 117