c |k a volatility report 2017 - crist\|kolder · c. rist | k. older. associates. c. rist |k. older....
TRANSCRIPT

CRIST KOLDER|ASSOCIATES
CRIST|KOLDER ASSOCIATESVolatility Report 2017CRIST|KOLDER ASSOCIATES
Volatility Report 2017
CRIST KOLDER|ASSOCIATES
CRIST|KOLDER Volatility Report
Table of Contents
Methodology Page 2
Report Highlights Page 5
Location Page 6
Executive Turnover Page 9
C-Suite Career Paths Page 18
Diversity Landscape Page 37
Education Background Page 45
Crist|Kolder 2017 Volatility Report1
CRIST KOLDER|ASSOCIATES
The annual Crist|Kolder Volatility Report of America’s Leading Companiesexamines the backgrounds and measures the turnover of C-Suite executives in aportfolio of 673 of America’s leading companies from the Fortune 500 and the S&P500 Indexes.
Crist|Kolder Associates examines each of the portfolio companies individually,noting personnel and organizational changes in the CEO, CFO, and COO roles. Eachexecutive’s background is explored, including the path taken to get to their currentrole: industry background, functional experience, and education. This includesdemographic information such as age, gender, and race.
This is the fourteenth year of the Crist|Kolder Volatility Report, though informationfor the report goes back to 1995. This Summer 2017 release of the Crist|KolderVolatility Report contains data through August 1, 2017.
Methodology
2Crist|Kolder 2017 Volatility Report
CRIST KOLDER|ASSOCIATES
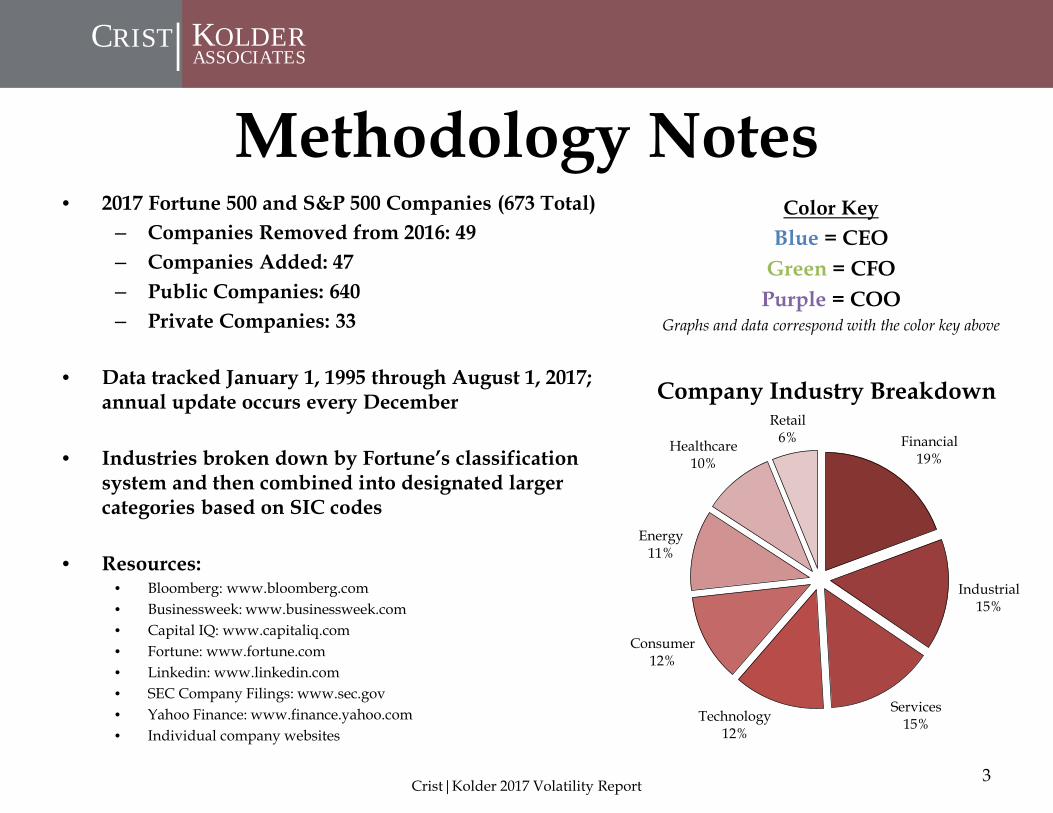
Methodology Notes• 2017 Fortune 500 and S&P 500 Companies (673 Total)
– Companies Removed from 2016: 49– Companies Added: 47– Public Companies: 640– Private Companies: 33
• Data tracked January 1, 1995 through August 1, 2017; annual update occurs every December
• Industries broken down by Fortune’s classification system and then combined into designated larger categories based on SIC codes
• Resources:• Bloomberg: www.bloomberg.com• Businessweek: www.businessweek.com• Capital IQ: www.capitaliq.com• Fortune: www.fortune.com• Linkedin: www.linkedin.com• SEC Company Filings: www.sec.gov• Yahoo Finance: www.finance.yahoo.com• Individual company websites
3Crist|Kolder 2017 Volatility Report
Financial19%
Industrial15%
Services15%Technology
12%
Consumer12%
Energy11%
Healthcare10%
Retail6%
Company Industry Breakdown
Color KeyBlue = CEO
Green = CFOPurple = COO
Graphs and data correspond with the color key above

CRIST KOLDER|ASSOCIATES
C-Suite: Limited to CEO, CFO, and COO roles
Volatility: Turnover is noted when the executive starts in the new role (as opposed to the date of announcement)
COO Role: The COO role is strictly limited to individuals with the title “Chief Operating Officer”
Internal change: An executive is promoted to a new role at the company where he/she is already employed
External change: An executive is recruited to a position at a company to which his/her previous position has no formal ties
Mergers: In a merger of equals, the combined company is considered a new entity. A change in leadership, therefore, is marked for all mergers. A change is internal if the executive was previously employed by either of the merging companies
Acquisitions: In the event an executive from the acquired company is appointed to a role in the acquiring company, it is an external change
Partial year: Designation indicates data gathered up to August 1, 2017, not a projection
Definitions
4Crist|Kolder 2017 Volatility Report

CRIST KOLDER|ASSOCIATES
Report Highlights• The increase in C-Suite turnover coincides with the recent peak in the S&P 500 Index (Page 11)
• The number of COOs continues to decrease (Page 16)
• Only 6% of sitting CEOs are promoted from the CFO role (Page 19)
• The Financial sector provides the most job security for CEOs and CFOs (Pages 29-30)
• 50% of current CEOs were age 50 or younger when appointed to the chair (Page 31)
• The average age of CEOs and CFOs has increased (Pages 32, 35)
• For the first time in eight years, diversity in the CEO role has decreased (Page 39)
• The number of female CFOs has doubled in 10 years and the female CEO count has reached an all time high (Pages 38, 42)
• International universities currently produce more sitting CEOs than any single U.S. conference (Page 46)
• The U.K. and France currently produce the most sitting CEOs out of all international countries in this study (Page 47)
• Big Ten universities currently produce the most sitting CFOs (Page 48)
• Over 65% of the CEOs in this study have an advanced degree ( Page 54)
• The path to the C-Suite runs through eight leading MBA programs (Page 56)
5Crist|Kolder 2017 Volatility Report

CRIST KOLDER|ASSOCIATES
Location
6Crist|Kolder 2017 Volatility Report

CRIST KOLDER|ASSOCIATES
7Crist|Kolder 2017 Volatility Report
Breakdown of companies by headquarters
2017 Fortune 500 and S&P 500 (673 Companies)
*Non-shaded (white) states have no company headquarters located within that state

CRIST KOLDER|ASSOCIATES
Breakdown of companies by industry within each geographical region
2017 Fortune 500 and S&P 500 (673 Companies)
8
Regions: Northeast, Midwest, South, and West as determined by the United States Census Bureau
Consumer Energy Financial Healthcare Industrial Retail Services TechnologyNortheast 29.9% 14.1% 36.5% 43.3% 27.8% 14.6% 29.2% 19.0%Midwest 33.8% 15.5% 27.0% 23.3% 37.1% 31.7% 15.6% 6.3%South 22.1% 60.6% 18.3% 16.7% 27.8% 36.6% 35.4% 25.3%West 14.3% 9.9% 18.3% 16.7% 7.2% 17.1% 19.8% 49.4%
0%
10%
20%
30%
40%
50%
60%
70%
80%
90%
100%
Crist|Kolder 2017 Volatility Report
CRIST KOLDER|ASSOCIATES
Executive Turnover
9Crist|Kolder 2017 Volatility Report
CRIST KOLDER|ASSOCIATES
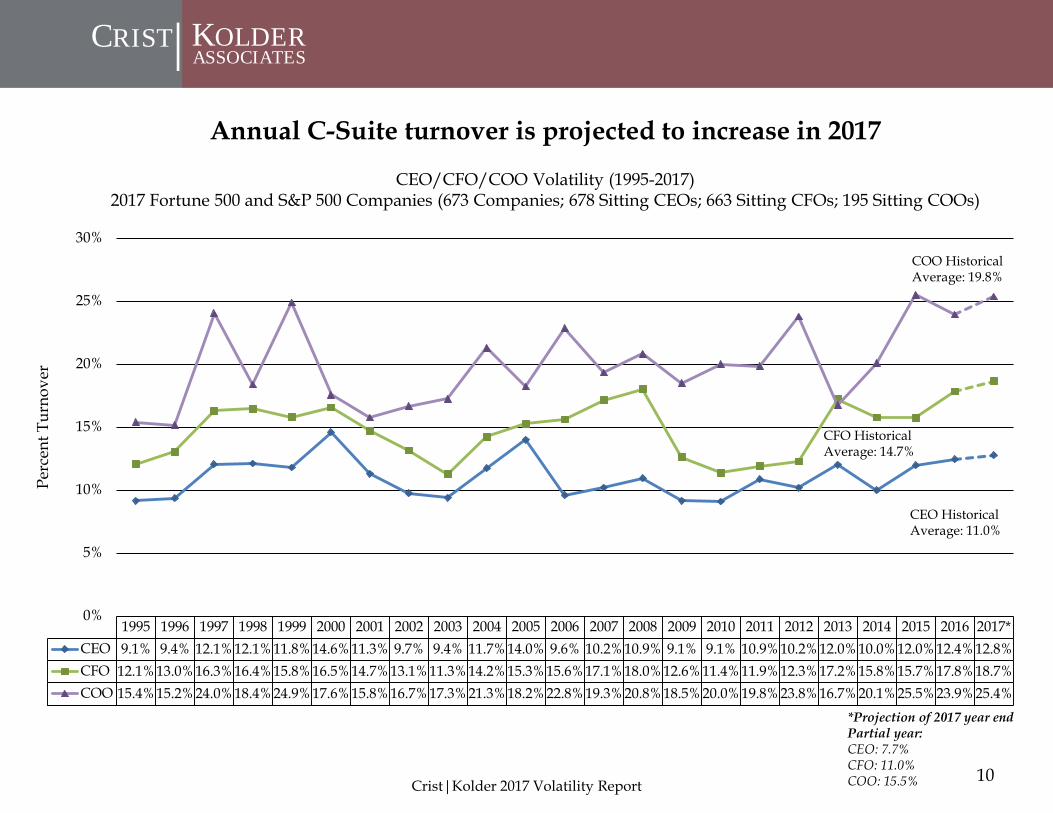
Annual C-Suite turnover is projected to increase in 2017
CEO/CFO/COO Volatility (1995-2017)2017 Fortune 500 and S&P 500 Companies (673 Companies; 678 Sitting CEOs; 663 Sitting CFOs; 195 Sitting COOs)
Crist|Kolder 2017 Volatility Report
1995 1996 1997 1998 1999 2000 2001 2002 2003 2004 2005 2006 2007 2008 2009 2010 2011 2012 2013 2014 2015 2016 2017*CEO 9.1% 9.4% 12.1% 12.1% 11.8% 14.6% 11.3% 9.7% 9.4% 11.7% 14.0% 9.6% 10.2% 10.9% 9.1% 9.1% 10.9% 10.2% 12.0% 10.0% 12.0% 12.4% 12.8%CFO 12.1% 13.0% 16.3% 16.4% 15.8% 16.5% 14.7% 13.1% 11.3% 14.2% 15.3% 15.6% 17.1% 18.0% 12.6% 11.4% 11.9% 12.3% 17.2% 15.8% 15.7% 17.8% 18.7%COO 15.4% 15.2% 24.0% 18.4% 24.9% 17.6% 15.8% 16.7% 17.3% 21.3% 18.2% 22.8% 19.3% 20.8% 18.5% 20.0% 19.8% 23.8% 16.7% 20.1% 25.5% 23.9% 25.4%
0%
5%
10%
15%
20%
25%
30%
Perc
ent T
urno
ver
CEO Historical Average: 11.0%
COO Historical Average: 19.8%
CFO Historical Average: 14.7%
10
*Projection of 2017 year endPartial year:CEO: 7.7%CFO: 11.0%COO: 15.5%

CRIST KOLDER|ASSOCIATES
The increase in C-Suite turnover coincides with the recent peak in the S&P 500 Index
Overall Volatility and S&P 500 Index** (1995-2017)2017 Fortune 500 and S&P 500 (673 Companies)
11
1995 1996 1997 1998 1999 2000 2001 2002 2003 2004 2005 2006 2007 2008 2009 2010 2011 2012 2013 2014 2015 2016 2017*S&P 500 Index 551.62 679.47 883.75 1098.2 1333.8 1424 1191.2 990.98 966.02 1130.3 1206.8 1307.2 1475.5 1241.2 937.92 1133 1268.2 1379.4 1580 2092.9 2100.9 2035 2269.5CEO/CFO/COO 12.2% 12.5% 17.5% 15.6% 17.5% 16.2% 13.9% 13.2% 12.6% 15.8% 15.8% 16.0% 15.6% 16.6% 13.4% 13.5% 14.2% 15.4% 15.3% 15.3% 17.7% 18.1% 18.9%
0%
2%
4%
6%
8%
10%
12%
14%
16%
18%
20%
0
500
1000
1500
2000
2500
C-S
uite
Tur
nove
r
S&P
500
Inde
x
Crist|Kolder 2017 Volatility Report
CEO/CFO/COO Historical Average: 15.2%
S&P 500 Historical Average: 1273.06
*Projection of 2017 year end**Average Daily ClosePartial year:S&P 500 (8/1/17): 2476.4C-Suite: 11.4%

CRIST KOLDER|ASSOCIATES
12
Based on historical averages, CFO volatility is nearly double that of CEOs
Percentage of CEOs/CFOs Recruited from Outside the Company (1995-2017)2017 Fortune 500 and S&P 500 Companies (673 Companies; 678 Sitting CEOs; 663 Sitting CFOs)
*Projection of 2017 year endPartial year:CEO: 23.1%CFO: 35.6%
Crist|Kolder 2017 Volatility Report
CEO Historical Average: 19.1%
CFO Historical Average: 37.4%
1995 1996 1997 1998 1999 2000 2001 2002 2003 2004 2005 2006 2007 2008 2009 2010 2011 2012 2013 2014 2015 2016 2017*CEO 10.9% 14.6% 17.2% 12.1% 18.5% 18.3% 23.1% 14.0% 18.2% 21.4% 25.6% 28.3% 12.5% 26.1% 20.7% 17.2% 20.0% 25.8% 30.4% 16.7% 17.5% 10.7% 25.6%CFO 42.4% 36.9% 39.3% 35.6% 37.6% 39.6% 31.7% 56.8% 34.4% 35.4% 34.4% 38.3% 43.3% 40.9% 37.7% 22.9% 36.5% 42.9% 32.1% 36.3% 33.3% 34.7% 39.2%
0%
10%
20%
30%
40%
50%
60%
% E
xter
nally
Rec
ruite
d

CRIST KOLDER|ASSOCIATES
• The Coca-Cola Company• Honeywell International, Inc.• Reynolds American, Inc.• Caterpillar, Inc.• Ford Motor Company• General Mills, Inc.• United States Steel Corporation• Ralph Lauren Corporation• Starbucks Corp.• CSX Corp.
Year to date, the Retail sector has the lowest CEO turnover
CEO Volatility by Industry2017 Fortune 500 and S&P 500 (673 Companies)
Retail4% Energy
10%
Financial10%
Healthcare10%
Technology13%
Services15%
Industrial15%
Consumer23%
Notable CEO Consumer, Industrial, and Service Sector
Changes in 2017
Crist|Kolder 2017 Volatility Report13

CRIST KOLDER|ASSOCIATES
• The Goldman Sachs Group, Inc.• Tesla, Inc.• The Charles Schwab Corporation• State Street Corp.• PPG Industries, Inc.• Roper Technologies, Inc.• Rockwell Automation, Inc.• Citizens Financial Group, Inc.• News Corp.• Discovery Communications, Inc.
Year to date, the Retail sector has the lowest CFO turnover
CFO Volatility by Industry2017 Fortune 500 and S&P 500 (673 Companies)
Retail6%
Healthcare10%
Energy11%
Consumer12%
Technology12%
Services15%
Industrial15%
Financial19%
Notable CFO Financial, Industrial, and Services Sector
Changes in 2017
Crist|Kolder 2017 Volatility Report14
CRIST KOLDER|ASSOCIATES
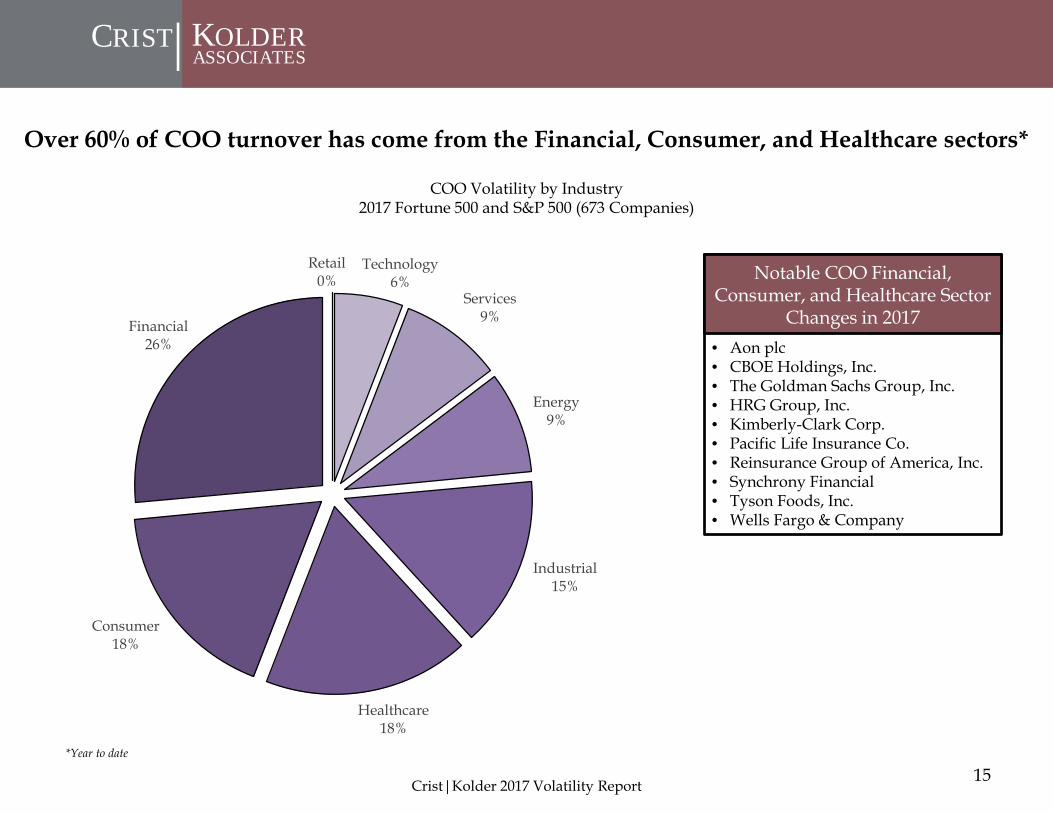
COO Volatility by Industry2017 Fortune 500 and S&P 500 (673 Companies)
Retail0%
Technology6%
Services9%
Energy9%
Industrial15%
Healthcare18%
Consumer18%
Financial26%
Notable COO Financial, Consumer, and Healthcare Sector
Changes in 2017• Aon plc• CBOE Holdings, Inc.• The Goldman Sachs Group, Inc.• HRG Group, Inc.• Kimberly-Clark Corp.• Pacific Life Insurance Co.• Reinsurance Group of America, Inc.• Synchrony Financial• Tyson Foods, Inc.• Wells Fargo & Company
Crist|Kolder 2017 Volatility Report
Over 60% of COO turnover has come from the Financial, Consumer, and Healthcare sectors*
15*Year to date

CRIST KOLDER|ASSOCIATES
The number of COOs continues to decline
Percentage of Companies with a COO (2000-2017)2017 Fortune 500 and S&P 500 (673 Companies; 195 Sitting COOs)
Crist|Kolder 2017 Volatility Report
2000 2001 2002 2003 2004 2005 2006 2007 2008 2009 2010 2011 2012 2013 2014 2015 2016 2017% w/COO 48.0% 44.7% 45.5% 44.9% 44.4% 43.9% 43.8% 46.0% 44.3% 42.2% 41.6% 41.5% 39.6% 36.3% 36.0% 33.6% 29.5% 29.0%
0%
10%
20%
30%
40%
50%
60%
16
CRIST KOLDER|ASSOCIATES
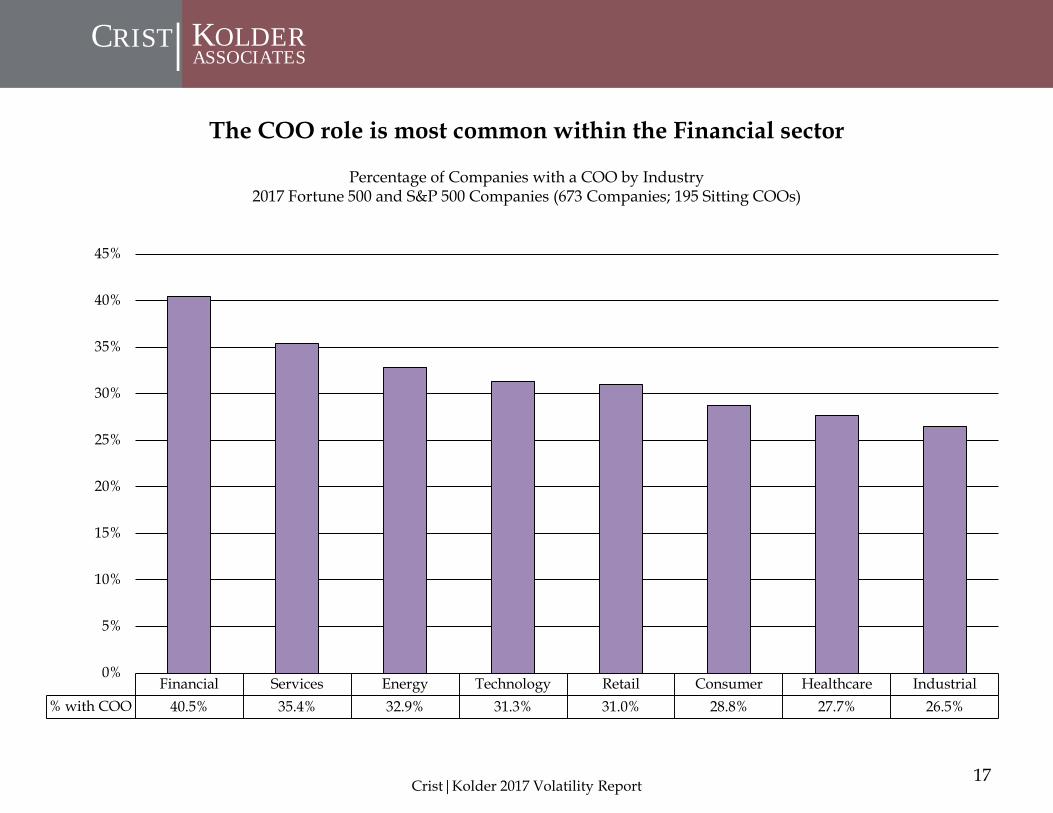
The COO role is most common within the Financial sector
Percentage of Companies with a COO by Industry2017 Fortune 500 and S&P 500 Companies (673 Companies; 195 Sitting COOs)
17
Financial Services Energy Technology Retail Consumer Healthcare Industrial% with COO 40.5% 35.4% 32.9% 31.3% 31.0% 28.8% 27.7% 26.5%
0%
5%
10%
15%
20%
25%
30%
35%
40%
45%
Crist|Kolder 2017 Volatility Report
CRIST KOLDER|ASSOCIATES
C-Suite Career Paths
18Crist|Kolder 2017 Volatility Report

CRIST KOLDER|ASSOCIATES
Only 6% of sitting CEOs are promoted from the CFO role
Percentage of Sitting CEOs by Immediate Previous Position2017 Fortune 500 and S&P 500 (673 Companies; 678 Sitting CEOs)
19
• Other: i.e. government role, private equity, management consulting, chairman• Operating Executive: VP/SVP/EVP of Operations
Crist|Kolder 2017 Volatility Report
President/COO DivisionalPresident CEO CFO Other Founder Operating
Executive% from Position 47.5% 28.9% 6.7% 6.2% 4.7% 4.1% 1.9%
0%
5%
10%
15%
20%
25%
30%
35%
40%
45%
50%
CRIST KOLDER|ASSOCIATES
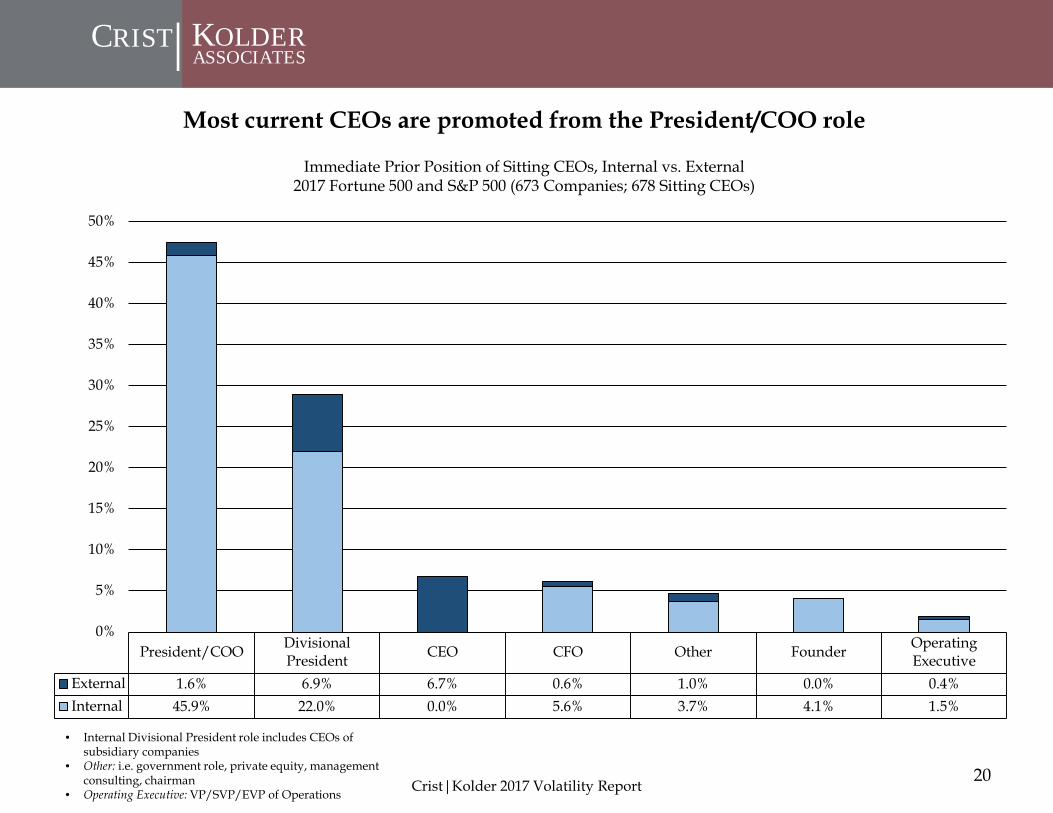
Most current CEOs are promoted from the President/COO role
Immediate Prior Position of Sitting CEOs, Internal vs. External2017 Fortune 500 and S&P 500 (673 Companies; 678 Sitting CEOs)
20
• Internal Divisional President role includes CEOs of subsidiary companies
• Other: i.e. government role, private equity, management consulting, chairman
• Operating Executive: VP/SVP/EVP of Operations Crist|Kolder 2017 Volatility Report
President/COO DivisionalPresident CEO CFO Other Founder Operating
ExecutiveExternal 1.6% 6.9% 6.7% 0.6% 1.0% 0.0% 0.4%Internal 45.9% 22.0% 0.0% 5.6% 3.7% 4.1% 1.5%
0%
5%
10%
15%
20%
25%
30%
35%
40%
45%
50%
CRIST KOLDER|ASSOCIATES
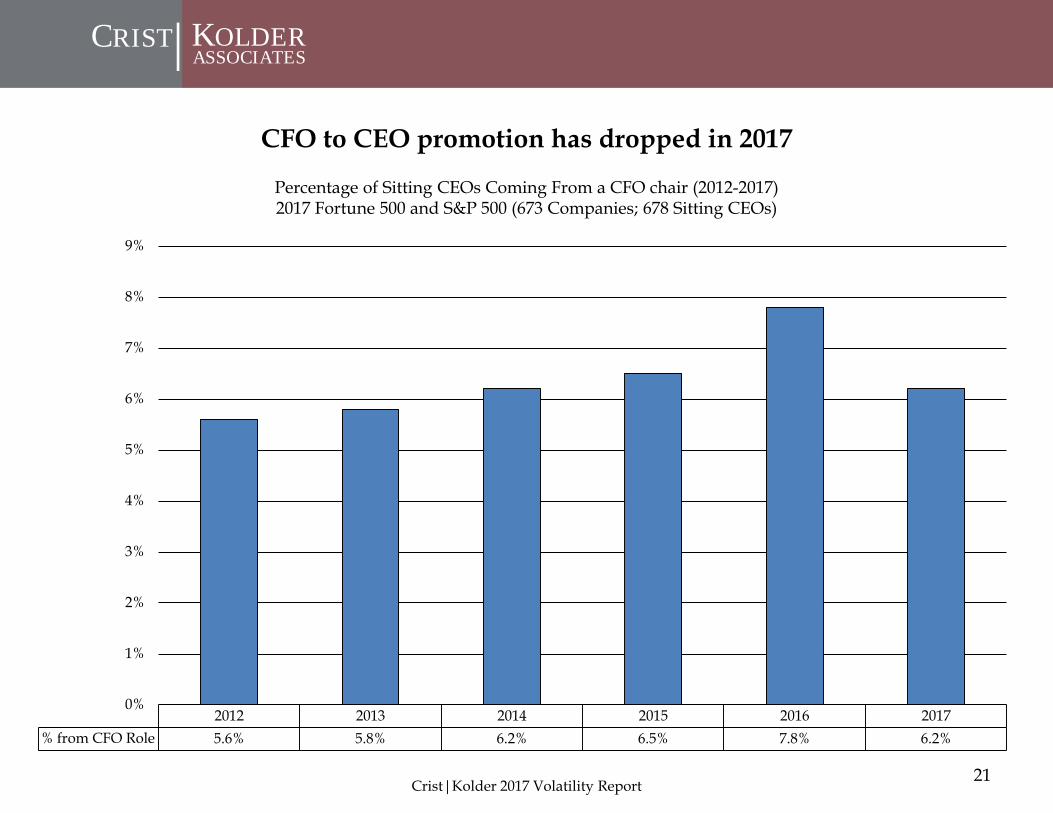
CFO to CEO promotion has dropped in 2017
Percentage of Sitting CEOs Coming From a CFO chair (2012-2017)2017 Fortune 500 and S&P 500 (673 Companies; 678 Sitting CEOs)
Crist|Kolder 2017 Volatility Report
2012 2013 2014 2015 2016 2017% from CFO Role 5.6% 5.8% 6.2% 6.5% 7.8% 6.2%
0%
1%
2%
3%
4%
5%
6%
7%
8%
9%
21

CRIST KOLDER|ASSOCIATES
Promotion from CFO to CEO occurs most often in the Financial sector
Percentage of Sitting CEOs Coming From a CFO Chair by Industry2017 Fortune 500 and S&P 500 (673 Companies; 678 Sitting CEOs; 42 Total CEOs from a CFO chair)
22
Financial Industrial Services Energy Technology Consumer Retail Healthcare% from CFO 28.6% 21.4% 14.3% 11.9% 9.5% 9.5% 4.8% 0.0%
0%
5%
10%
15%
20%
25%
30%
Crist|Kolder 2017 Volatility Report

CRIST KOLDER|ASSOCIATES
CEOs in the Financial sector are more likely to hold the Chairman title than in other sectors
Sitting CEOs That Are Also Chairman*2017 Fortune 500 and S&P 500 (673 Companies; 678 Sitting CEOs; 308 Sitting CEO & Chairman)
23Crist|Kolder 2017 Volatility Report
Financial Industrial Services Energy Consumer Healthcare Technology RetailCEO & Chairman 63 52 49 36 34 34 26 14
0
10
20
30
40
50
60
70
CEO
s Tha
t Are
Als
o C
hair
man
* Sitting Chairman of their current company
CRIST KOLDER|ASSOCIATES
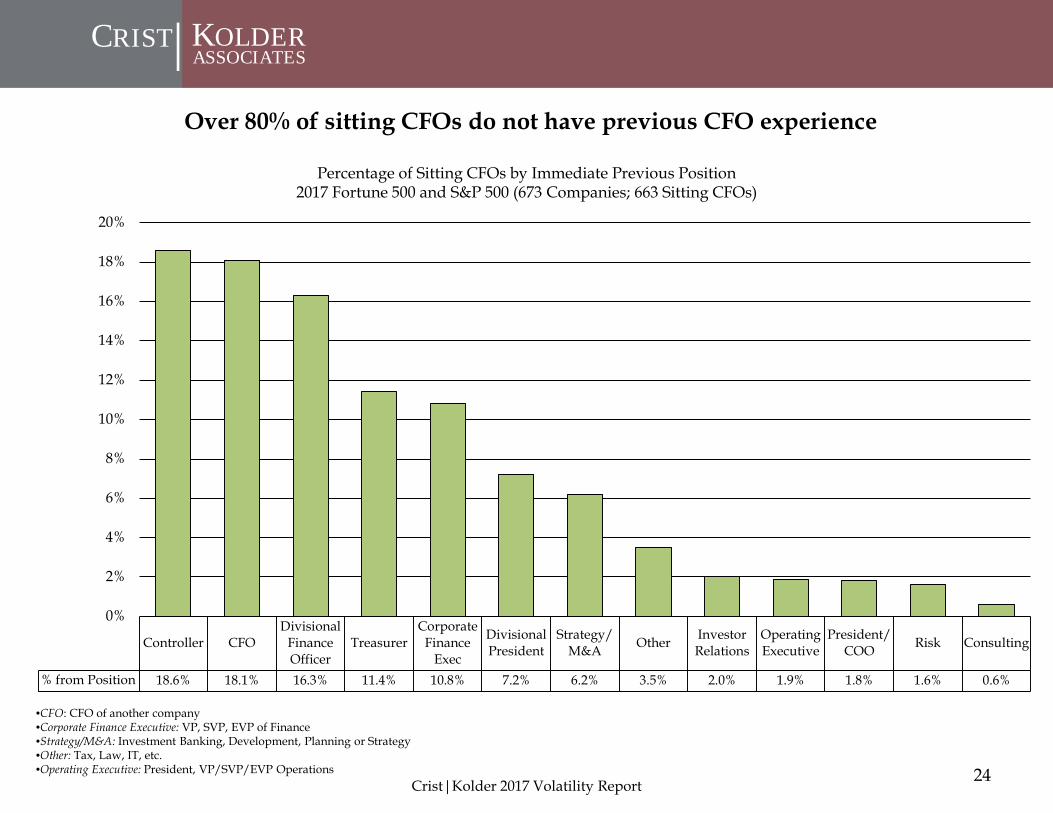
Over 80% of sitting CFOs do not have previous CFO experience
Percentage of Sitting CFOs by Immediate Previous Position2017 Fortune 500 and S&P 500 (673 Companies; 663 Sitting CFOs)
Crist|Kolder 2017 Volatility Report
•CFO: CFO of another company•Corporate Finance Executive: VP, SVP, EVP of Finance•Strategy/M&A: Investment Banking, Development, Planning or Strategy•Other: Tax, Law, IT, etc.•Operating Executive: President, VP/SVP/EVP Operations 24
Controller CFODivisional
FinanceOfficer
TreasurerCorporate
FinanceExec
DivisionalPresident
Strategy/M&A Other Investor
RelationsOperatingExecutive
President/COO Risk Consulting
% from Position 18.6% 18.1% 16.3% 11.4% 10.8% 7.2% 6.2% 3.5% 2.0% 1.9% 1.8% 1.6% 0.6%
0%
2%
4%
6%
8%
10%
12%
14%
16%
18%
20%
CRIST KOLDER|ASSOCIATES
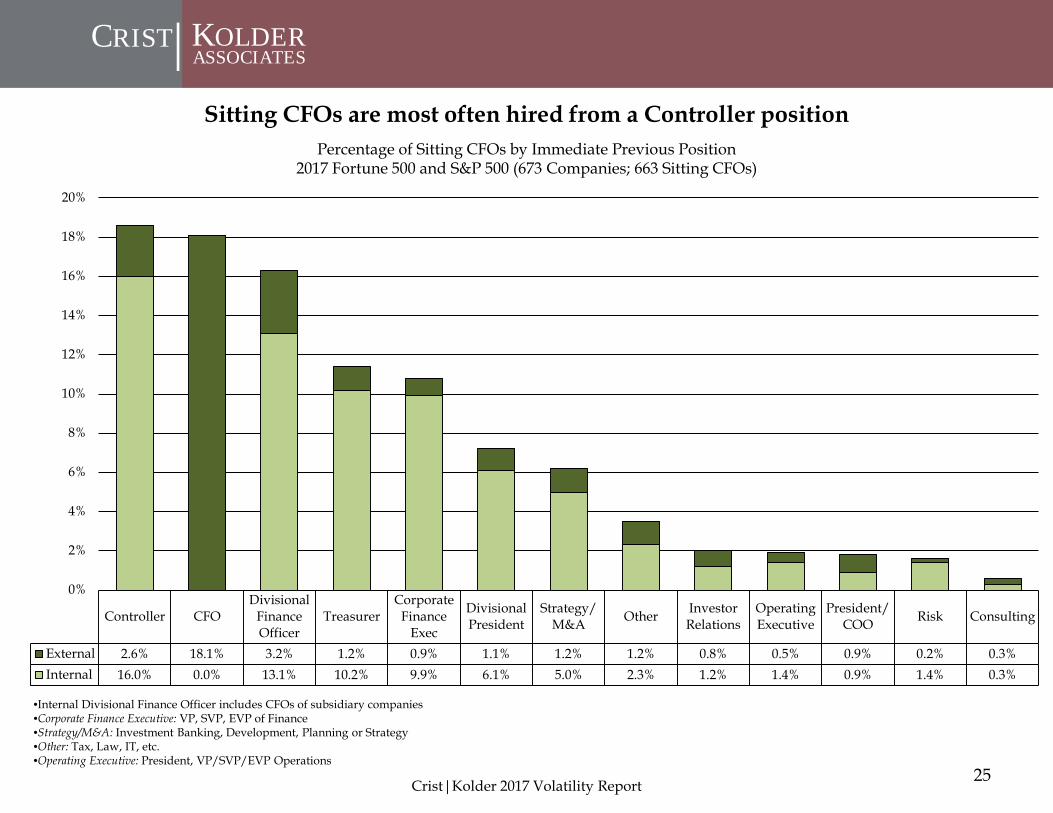
Sitting CFOs are most often hired from a Controller position
25
•Internal Divisional Finance Officer includes CFOs of subsidiary companies •Corporate Finance Executive: VP, SVP, EVP of Finance•Strategy/M&A: Investment Banking, Development, Planning or Strategy•Other: Tax, Law, IT, etc.•Operating Executive: President, VP/SVP/EVP Operations
Percentage of Sitting CFOs by Immediate Previous Position2017 Fortune 500 and S&P 500 (673 Companies; 663 Sitting CFOs)
Crist|Kolder 2017 Volatility Report
Controller CFODivisional
FinanceOfficer
TreasurerCorporate
FinanceExec
DivisionalPresident
Strategy/M&A Other Investor
RelationsOperatingExecutive
President/COO Risk Consulting
External 2.6% 18.1% 3.2% 1.2% 0.9% 1.1% 1.2% 1.2% 0.8% 0.5% 0.9% 0.2% 0.3%Internal 16.0% 0.0% 13.1% 10.2% 9.9% 6.1% 5.0% 2.3% 1.2% 1.4% 0.9% 1.4% 0.3%
0%
2%
4%
6%
8%
10%
12%
14%
16%
18%
20%

CRIST KOLDER|ASSOCIATES
The CFO position is the only C-Suite position with external hires in each sector
Percentage of External Hires by Industry2017 Fortune 500 and S&P 500 Companies (673 Companies; 678 CEOs; 663 CFOs; 195 COOs)
CEO CFO COOTechnology 25.0% 3.8% 0.0%Services 16.7% 7.7% 0.0%Retail 8.3% 15.4% 0.0%Industrial 16.7% 3.8% 0.0%Healthcare 8.3% 15.4% 50.0%Financial 8.3% 23.1% 0.0%Energy 0.0% 15.4% 50.0%Consumer 16.7% 15.4% 0.0%
Consumer Consumer
Energy EnergyFinancial
Financial
Healthcare
Healthcare
Healthcare
Industrial
Industrial
Retail
Retail
Services
ServicesTechnology
Technology
0%
10%
20%
30%
40%
50%
60%
70%
80%
90%
100%
26Crist|Kolder 2017 Volatility Report

CRIST KOLDER|ASSOCIATES
66
49
34
33
33
0 10 20 30 40 50 60 70
Only 32% of sitting CFOs have a Big Five public accounting background
2017 CFOs with Public Accounting Backgrounds2017 Fortune 500 and S&P 500 (673 Companies; 254 CFOs Represented**)
*Multiple CFOs have worked at multiple public accounting firms**There are CFOs in this study that have worked at other public accounting firms that are not displayed
27
PricewaterhouseCoopers (PwC)
Ernst & Young (EY)
Arthur Andersen
KPMG
Crist|Kolder 2017 Volatility Report
Deloitte

CRIST KOLDER|ASSOCIATES
12% of CFOs have an investment banking background
2017 CFOs with Investment Banking Backgrounds2017 Fortune 500 and S&P 500 (673 Companies; 79 CFOs Represented*)
*Multiple CFOs have worked for more than one investment bank**There are CFOs in this study that have worked at other investment banks that are not displayed 28
17
16
12
10
7
5
0 2 4 6 8 10 12 14 16 18
Goldman Sachs
Merrill Lynch (Bank of America)
J.P. Morgan Chase & Co.
Morgan Stanley
Deutsche Bank
UBS
Crist|Kolder 2017 Volatility Report

CRIST KOLDER|ASSOCIATES
Financial sector CEOs have the most job security
Average Tenure in Years of Sitting CEOs by Industry2017 Fortune 500 and S&P 500 (673 Companies; 678 Sitting CEOs)
29
5.05.4
5.6
6.8 6.9
7.6
9.0 9.1
0
1
2
3
4
5
6
7
8
9
10
Energy Industrial Consumer Services Healthcare Technology Retail Financial
Tenu
re (Y
ears
)
Average CEO Tenure: 6.9 years
Crist|Kolder 2017 Volatility Report
Leslie Wexner –L Brands, Inc. (54.6 Years)
Longest Tenured CEO

CRIST KOLDER|ASSOCIATES
The average tenure of a CFO is under five years
Average Tenure in Years of Sitting CFOs by Industry2017 Fortune 500 and S&P 500 (673 Companies; 663 Sitting CFOs)
30
3.8
4.34.5
4.7 4.8
5.3 5.4
5.8
0
1
2
3
4
5
6
7
Healthcare Consumer Technology Energy Services Industrial Retail Financial
Tenu
re (Y
ears
)
Average CFO Tenure: 4.9 years
Crist|Kolder 2017 Volatility Report
Jeffrey Julien –Raymond James Financial, Inc. (30.3 Years)
Longest Tenured CFO

CRIST KOLDER|ASSOCIATES
50% of current CEOs were age 50 or younger when appointed to the chair
Age at Hire of Sitting CEOs2017 Fortune 500 and S&P 500 Companies (673 Companies; 670 Known CEO Ages at Hire)
31
0
10
20
30
40
50
60
18 19 20 21 22 23 24 25 26 27 28 29 30 31 32 33 34 35 36 37 38 39 40 41 42 43 44 45 46 47 48 49 50 51 52 53 54 55 56 57 58 59 60 61 62 63 64 65 66 67 68 69 70 71 72 73
Age
Male Female
Crist|Kolder 2017 Volatility Report
Youngest Male: Mark Zuckerberg –Facebook, Inc. (18)
Oldest Male: Stefano Pessina –Walgreens Boots Alliance, Inc. (73)
Youngest Female: Deborah Cafaro –Ventas, Inc. (40)
Oldest Female: Kathryn Marinello –Hertz Global Holdings, Inc. (60)
Age at Hire of Sitting CEOs

CRIST KOLDER|ASSOCIATES
Crist|Kolder 2017 Volatility Report
The average age at hire of CEOs has increased
Average CEO Age at Hire (2012-2017)2017 Fortune 500 and S&P 500 (673 Companies; 678 sitting CEOs)
639
579
2012 2013 2014 2015 2016 2017CEO 45 45 48 50 50 50
42
43
44
45
46
47
48
49
50
51
Ave
rage
Age
at H
ire
32
CRIST KOLDER|ASSOCIATES
0
10
20
30
40
50
60
33 34 35 36 37 38 39 40 41 42 43 44 45 46 47 48 49 50 51 52 53 54 55 56 57 58 59 60 61 62 63 64 65 66 67 68 69 70 71 72 73 74 75 76 77 78 79 80 81 82 83 84 85 86
Age
Male Female
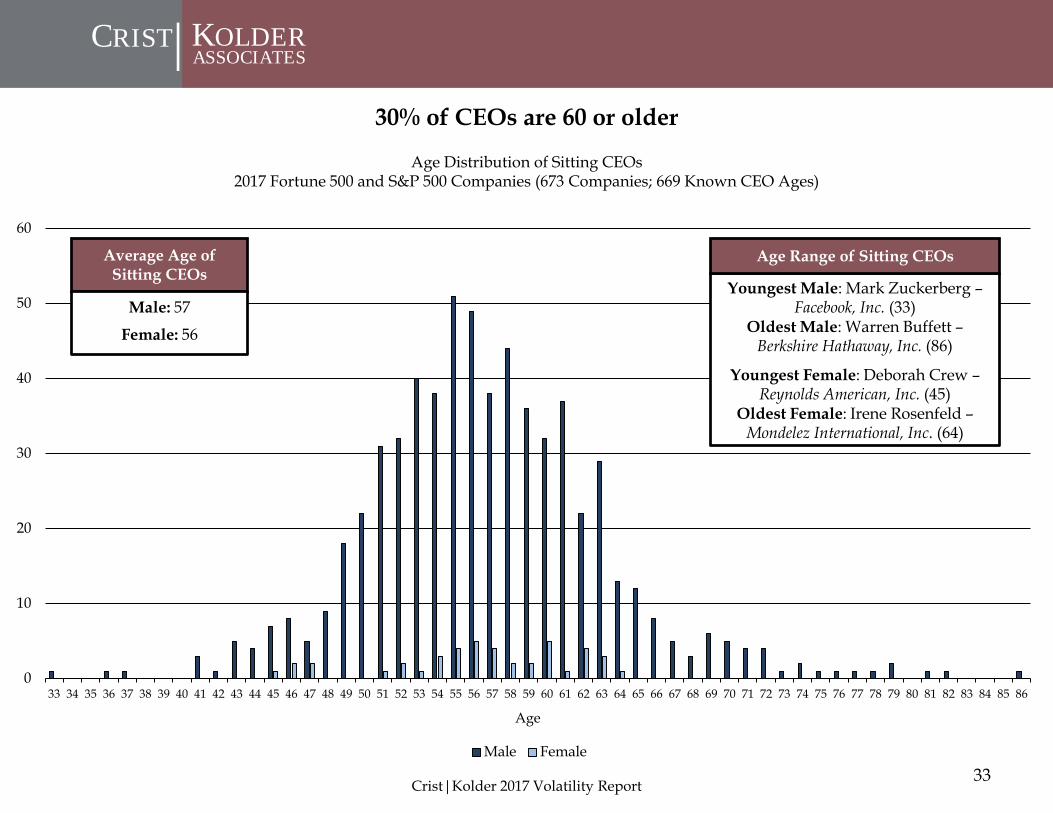
30% of CEOs are 60 or older
Age Distribution of Sitting CEOs2017 Fortune 500 and S&P 500 Companies (673 Companies; 669 Known CEO Ages)
Average Age of Sitting CEOs
Male: 57
Female: 56
Youngest Male: Mark Zuckerberg –Facebook, Inc. (33)
Oldest Male: Warren Buffett –Berkshire Hathaway, Inc. (86)
Youngest Female: Deborah Crew –Reynolds American, Inc. (45)
Oldest Female: Irene Rosenfeld –Mondelez International, Inc. (64)
Age Range of Sitting CEOs
33Crist|Kolder 2017 Volatility Report

CRIST KOLDER|ASSOCIATES
0
5
10
15
20
25
30
35
40
45
50
29 30 31 32 33 34 35 36 37 38 39 40 41 42 43 44 45 46 47 48 49 50 51 52 53 54 55 56 57 58 59 60 61 62 63 64 65 66 67 68 69 70 71
Age
Male Female
Over 90% of current CFOs were 55 or younger when named CFO
Age at Hire of Sitting CFOs2017 Fortune 500 and S&P 500 Companies (673 Companies; 653 Known CFO Ages at Hire)
34Crist|Kolder 2017 Volatility Report
Youngest Male: David Phillips –Publix Super Markets, Inc. (29)
Oldest Male: Joseph Macnow –Vornado Realty Trust (71)
Youngest Female: Karla Lewis –Reliance Steel & Aluminum Co. (32)
Oldest Female: Claire Gulmi –Envision Healthcare Corp. (62)
Age at Hire of Sitting CFOs
CRIST KOLDER|ASSOCIATES
Crist|Kolder 2017 Volatility Report
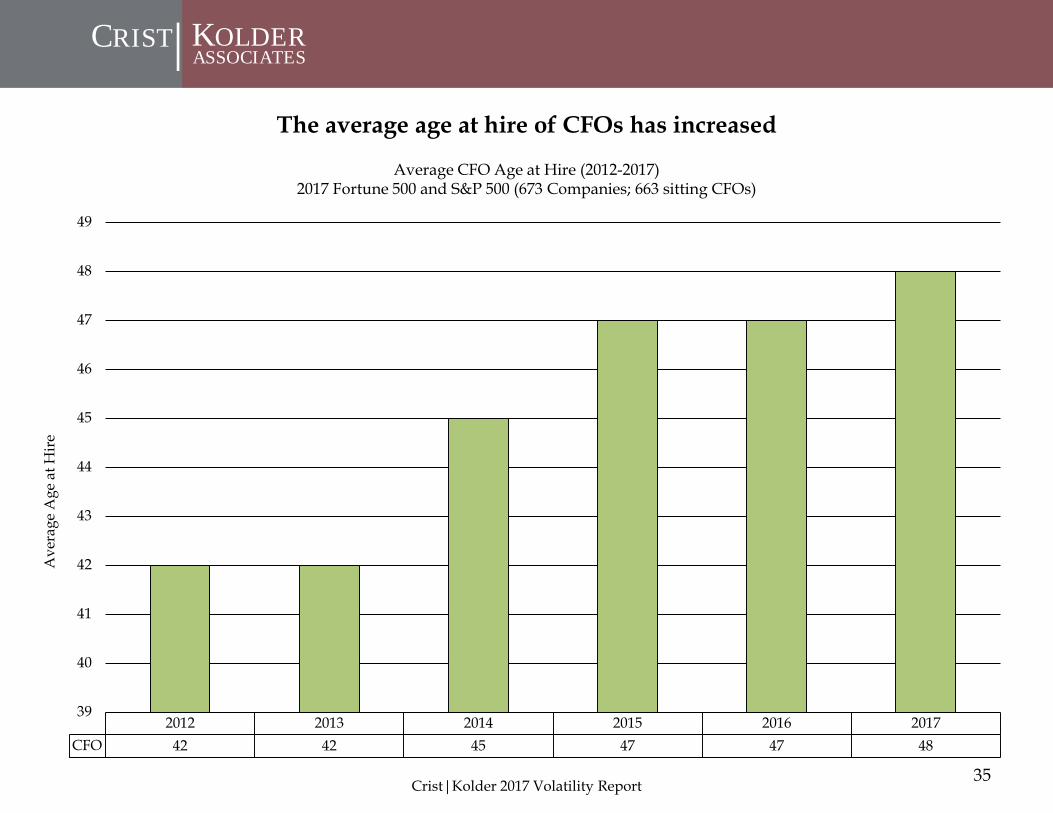
The average age at hire of CFOs has increased
Average CFO Age at Hire (2012-2017)2017 Fortune 500 and S&P 500 (673 Companies; 663 sitting CFOs)
639
579
2012 2013 2014 2015 2016 2017CFO 42 42 45 47 47 48
39
40
41
42
43
44
45
46
47
48
49
Ave
rage
Age
at H
ire
35

CRIST KOLDER|ASSOCIATES
0
10
20
30
40
50
60
37 38 39 40 41 42 43 44 45 46 47 48 49 50 51 52 53 54 55 56 57 58 59 60 61 62 63 64 65 66 67 68 69 70 71 72 73 74
Age
Male Female
Less than 10% of CFOs are over 60 years of age
Age Distribution of Sitting CFOs2017 Fortune 500 and S&P 500 Companies (675 Companies; 653 Known CFO Ages)
36
Average Age of Sitting CFOs
Male: 52
Female: 52
Age Range of CFOs
Youngest Male: Andrew Power –Digital Realty Trust, Inc. (37)
Oldest Male: Walter Berman –Ameriprise Financial, Inc. (74)
Youngest Female: Jacky Lo –Yum China Holdings, Inc. (40)
Oldest Female(s): Claire Gulmi –Envision Healthcare Corp. (63)
Crist|Kolder 2017 Volatility Report
CRIST KOLDER|ASSOCIATES
Diversity Landscape
37Crist|Kolder 2017 Volatility Report
CRIST KOLDER|ASSOCIATES
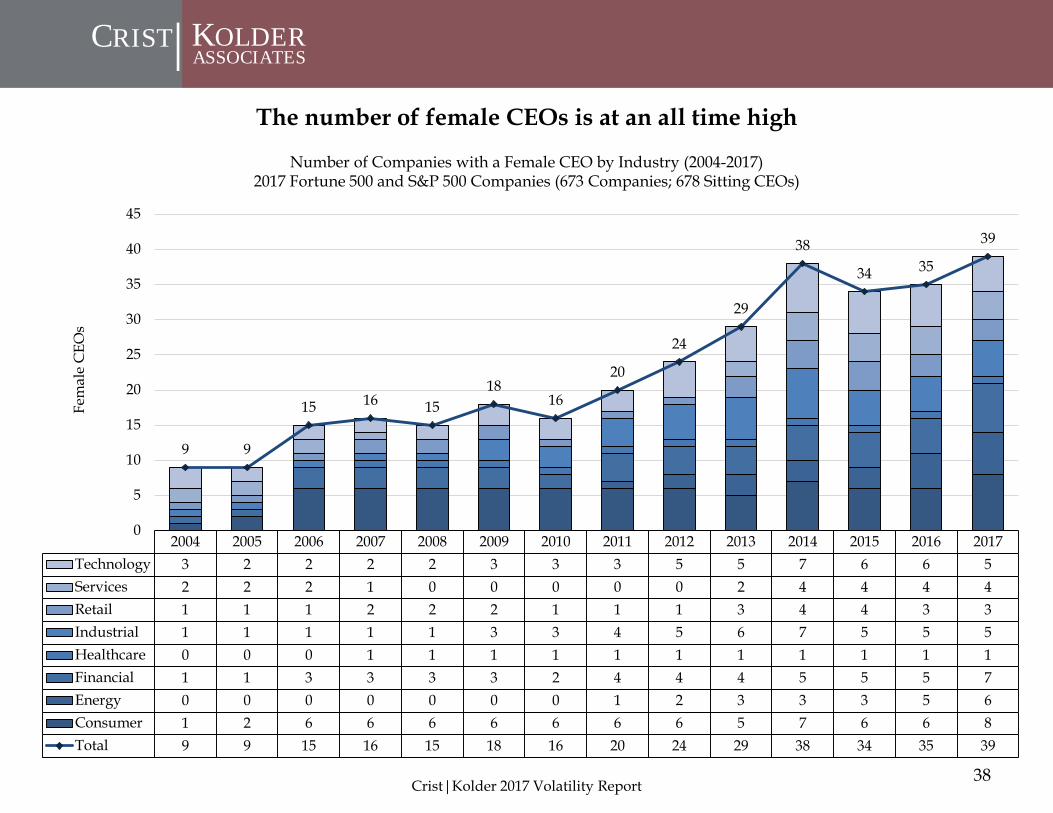
The number of female CEOs is at an all time high
Number of Companies with a Female CEO by Industry (2004-2017)2017 Fortune 500 and S&P 500 Companies (673 Companies; 678 Sitting CEOs)
38Crist|Kolder 2017 Volatility Report
2004 2005 2006 2007 2008 2009 2010 2011 2012 2013 2014 2015 2016 2017Technology 3 2 2 2 2 3 3 3 5 5 7 6 6 5Services 2 2 2 1 0 0 0 0 0 2 4 4 4 4Retail 1 1 1 2 2 2 1 1 1 3 4 4 3 3Industrial 1 1 1 1 1 3 3 4 5 6 7 5 5 5Healthcare 0 0 0 1 1 1 1 1 1 1 1 1 1 1Financial 1 1 3 3 3 3 2 4 4 4 5 5 5 7Energy 0 0 0 0 0 0 0 1 2 3 3 3 5 6Consumer 1 2 6 6 6 6 6 6 6 5 7 6 6 8Total 9 9 15 16 15 18 16 20 24 29 38 34 35 39
9 9
15 16 1518
16
20
24
29
38
34 35
39
0
5
10
15
20
25
30
35
40
45
Fem
ale
CEO
s

CRIST KOLDER|ASSOCIATES
For the first time in eight years, diversity in the CEO role has decreasedNumber of Companies with Ethnically and Racially Diverse CEOs (2004-2017)
2017 Fortune 500 and S&P 500 (673 Companies; 678 Sitting CEOs)
39Crist|Kolder 2017 Volatility Report
2004 2005 2006 2007 2008 2009 2010 2011 2012 2013 2014 2015 2016 2017Asian/Indian 10 12 13 16 16 14 15 17 17 16 21 25 26 26African American 5 4 5 6 6 6 5 6 6 7 6 6 7 6Hispanic/Latino 6 5 4 5 6 6 6 7 8 11 10 11 14 13Total 21 21 22 27 28 26 26 30 31 34 37 42 47 45
21 21 22
27 2826 26
30 3134
37
42
4745
0
5
10
15
20
25
30
35
40
45
50
Ethn
ical
ly a
nd R
acia
lly D
iver
se C
EOs

CRIST KOLDER|ASSOCIATES
For over 10 years, the Technology sector has had the most ethnically and racially diverse CEOs
Number of Companies with Ethnically and Racially Diverse CEOs by Industry (2004-2017)2017 Fortune 500 and S&P 500 (673 Companies; 678 Sitting CEOs)
40Crist|Kolder 2017 Volatility Report
2004 2005 2006 2007 2008 2009 2010 2011 2012 2013 2014 2015 2016 2017Technology 7 7 7 8 8 8 8 9 10 10 12 12 13 13Services 2 4 4 5 4 4 4 4 4 5 4 5 7 6Retail 0 0 0 0 0 0 0 0 0 0 0 1 1 1Industrial 0 0 0 0 0 0 0 0 0 0 1 2 4 4Healthcare 3 2 3 3 3 3 2 4 5 6 6 6 6 6Financial 4 3 3 4 6 4 5 7 7 7 7 7 6 6Energy 1 1 1 1 1 1 1 0 0 0 1 2 3 3Consumer 4 4 4 6 6 6 6 6 5 6 6 7 7 6Total 21 21 22 27 28 26 26 30 31 34 37 42 47 45
21 21 22
27 2826 26
30 3134
37
42
4745
0
5
10
15
20
25
30
35
40
45
50
Ethn
ical
ly a
nd R
acia
lly D
iver
se C
EOs

CRIST KOLDER|ASSOCIATES
Female presence in the C-Suite continues to steadily climb
Percentages of Companies with Female CEOs or CFOs (2004-2017)2017 Fortune 500 and S&P 500 (673 Companies; 678 Sitting CEOs; 663 Sitting CFOs)
41Crist|Kolder 2017 Volatility Report
2004 2005 2006 2007 2008 2009 2010 2011 2012 2013 2014 2015 2016 2017Female CEOs 1.4% 1.4% 2.3% 2.4% 2.2% 2.7% 2.4% 3.0% 3.6% 4.3% 5.6% 5.0% 5.2% 5.8%Female CFOs 5.0% 6.2% 6.0% 6.5% 6.6% 7.4% 7.2% 8.5% 9.0% 10.1% 10.9% 12.0% 12.5% 12.6%
0%
2%
4%
6%
8%
10%
12%
14%

CRIST KOLDER|ASSOCIATES
The number of female CFOs has doubled over the last 10 years
Number of Companies with a Female CFO by Industry (2004-2017)2017 Fortune 500 and S&P 500 Companies (673 Companies; 663 Sitting CFOs)
42Crist|Kolder 2017 Volatility Report
2004 2005 2006 2007 2008 2009 2010 2011 2012 2013 2014 2015 2016 2017Technology 7 10 9 10 8 7 7 8 9 11 10 10 8 10Services 5 5 6 7 9 8 7 7 9 10 11 12 13 16Retail 3 4 3 3 3 4 3 3 4 5 7 8 9 9Industrial 5 5 5 7 6 6 6 8 8 10 9 12 9 8Healthcare 4 4 2 3 4 5 5 4 4 4 6 5 7 6Financial 3 4 4 2 7 9 10 11 10 9 10 12 13 14Energy 2 3 5 5 4 6 6 8 8 7 7 6 7 5Consumer 3 5 5 6 3 4 4 8 8 12 13 15 18 16Total 32 40 39 43 44 49 48 57 60 68 73 80 84 84
32
40 3943 44
49 48
5760
6873
8084 84
0
10
20
30
40
50
60
70
80
90
Fem
ale
CFO
s

CRIST KOLDER|ASSOCIATES
The number of ethnically and racially diverse CFOs has more than doubled over the last five years
43
Number of Companies with Ethnically and Racially Diverse CFOs (2004-2017)2017 Fortune 500 and S&P 500 (673 Companies; 663 Sitting CFOs)
Crist|Kolder 2017 Volatility Report
2004 2005 2006 2007 2008 2009 2010 2011 2012 2013 2014 2015 2016 2017Asian/Indian 8 10 8 9 11 9 9 10 10 14 16 20 21 24African American 4 4 4 5 7 6 6 6 5 5 6 6 8 10Hispanic/Latino 4 4 4 4 4 4 6 7 7 5 8 10 10 12Total Diverse CFOs 16 18 16 18 22 19 21 23 22 24 30 36 39 46
1618
1618
2219
2123 22
24
30
3639
46
0
5
10
15
20
25
30
35
40
45
50
Ethn
ical
ly a
nd R
acia
lly D
iver
se C
FOs

CRIST KOLDER|ASSOCIATES
Ethnic and racial diversity in the CFO role has doubled over the last five years
Number of Companies with Ethnically and Racially Diverse CFOs by Industry2017 Fortune 500 and S&P 500 (675 Companies; 663 Sitting CFOs)
44Crist|Kolder 2017 Volatility Report
2004 2005 2006 2007 2008 2009 2010 2011 2012 2013 2014 2015 2016 2017Technology 1 2 2 4 3 2 2 2 3 3 6 8 8 9Services 4 4 3 3 3 2 3 4 3 4 4 4 4 4Retail 0 0 0 0 0 0 0 0 0 0 0 0 0 1Industrial 1 1 1 1 1 1 1 1 2 3 3 4 5 8Healthcare 3 3 3 3 5 5 5 5 5 5 5 5 5 6Financial 5 4 4 4 4 3 3 4 3 3 5 6 7 7Energy 0 1 1 1 2 1 2 2 2 2 3 5 4 5Consumer 2 3 2 2 4 5 5 5 4 4 4 4 6 6Total 16 18 16 18 22 19 21 23 22 24 30 36 39 46
1618
1618
2219
2123 22
24
30
3639
46
0
5
10
15
20
25
30
35
40
45
50
Ethn
ical
ly a
nd R
acia
lly D
iver
se C
FOs

CRIST KOLDER|ASSOCIATES
Education Background
45Crist|Kolder 2017 Volatility Report

CRIST KOLDER|ASSOCIATES
International universities currently produce the most sitting CEOsSitting CEO Undergraduate University Conference Affiliation
2017 Fortune 500 and S&P 500 Companies (678 Sitting CEOs; 646 Known Education Backgrounds)
46
76
74
70
42
38
34
25
21
18
16
16
0 10 20 30 40 50 60 70 80
Crist|Kolder 2017 Volatility Report
International
Ivy League
Big Ten
Southeastern Conference
Atlantic Coast Conference
Pacific 12
Patriot League
Big 12
Mid-American
NESCAC
Big East
Harvard University
University of Pennsylvania
Cornell University
University of Michigan
Mass. Institute of Technology
Princeton University
Top Schools CEOs
17
13
11
11
10
10

CRIST KOLDER|ASSOCIATES
10
10
9
7
7
0 2 4 6 8 10 12
The United Kingdom and France currently produce the most sitting CEOs out of all international countries in this study
Top Five International Undergraduate Degree Producing Countries for Sitting CEOs2017 Fortune 500 and S&P 500 Companies (678 Sitting CEOs; 76 International Degrees)
Crist|Kolder 2017 Volatility Report
India
Australia
Canada
France
United Kingdom
47
CRIST KOLDER|ASSOCIATES
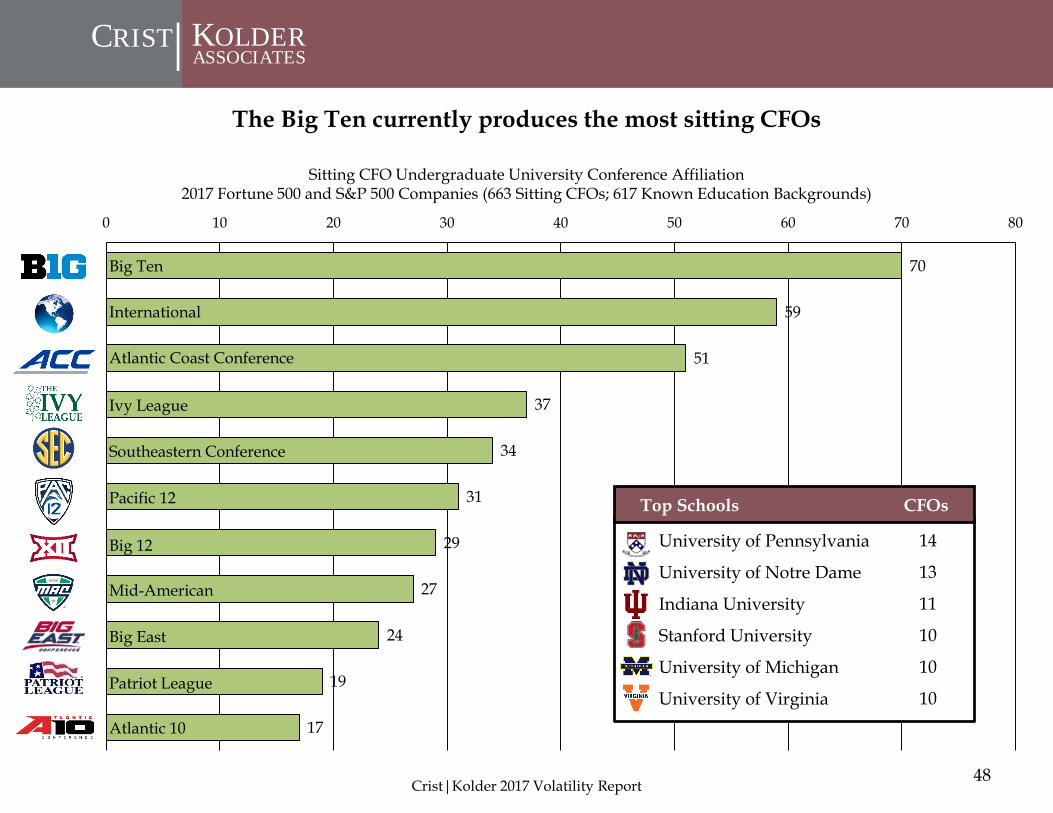
The Big Ten currently produces the most sitting CFOs
Sitting CFO Undergraduate University Conference Affiliation2017 Fortune 500 and S&P 500 Companies (663 Sitting CFOs; 617 Known Education Backgrounds)
48
70
59
51
37
34
31
29
27
24
19
17
0 10 20 30 40 50 60 70 80
Crist|Kolder 2017 Volatility Report
Big Ten
International
Atlantic Coast Conference
Ivy League
Southeastern Conference
Pacific 12
Big 12
Mid-American
Big East
Patriot League
Atlantic 10
University of Pennsylvania
University of Notre Dame
Indiana University
Stanford University
University of Michigan
University of Virginia
Top Schools CFOs
14
13
11
10
10
10

CRIST KOLDER|ASSOCIATES
15
12
6
5
4
0 2 4 6 8 10 12 14 16
Canada currently produces the most sitting CFOs out of all international countries in this study
Top Five International Undergraduate Degree Producing Countries for Sitting CFOs2017 Fortune 500 and S&P 500 Companies (663 Sitting CEOs; 59 International Degrees)
Crist|Kolder 2017 Volatility Report
Canada
United Kingdom
India
France
Germany
49

CRIST KOLDER|ASSOCIATES
50
Public343
Private292
University of Michigan
Michigan State University
Texas A&M University
University of Virginia
Indiana University
Top Public Schools CEOs
Harvard University
University of Pennsylvania
Cornell University
Mass. Institute of Technology
Princeton University
Top Private Schools CEOs
Public universities currently produce the most sitting CEOs
Sitting CEO Undergraduate University2017 Fortune 500 and S&P 500 Companies (678 Sitting CEOs; 646 Known Education Backgrounds)
17
12
11
10
10
11
8
8
6
6
Crist|Kolder 2017 Volatility Report
CRIST KOLDER|ASSOCIATES
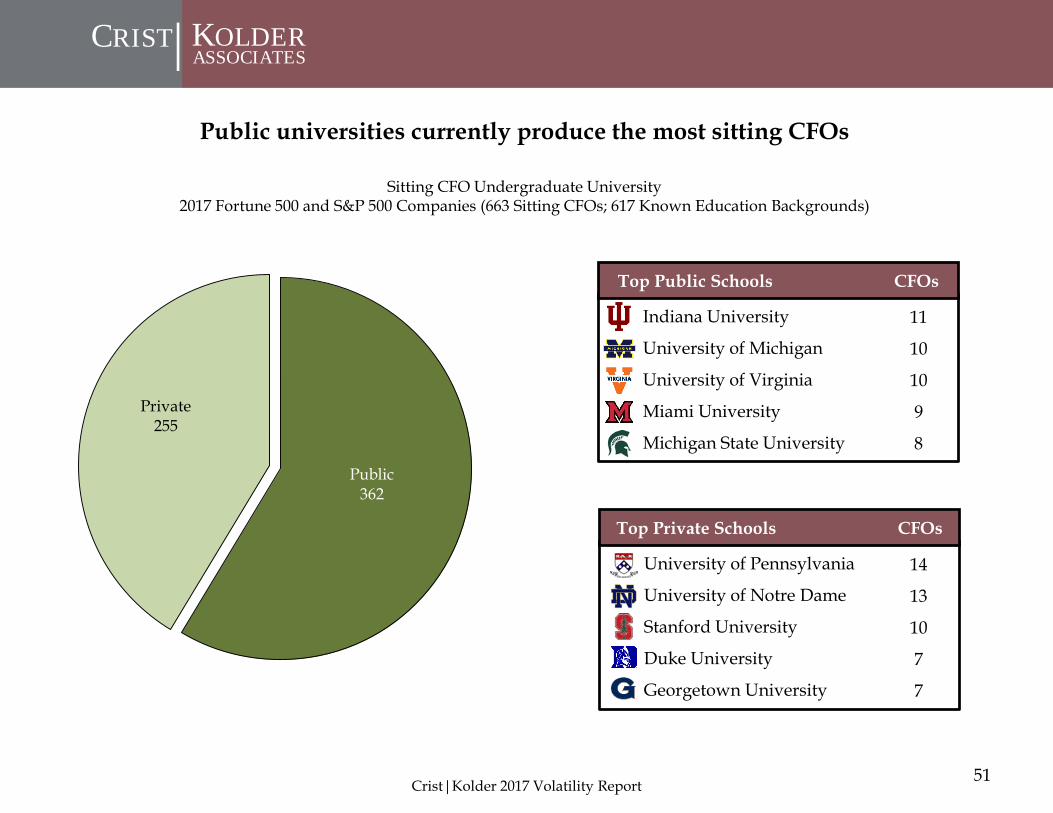
51
Public362
Private255
Indiana University
University of Michigan
University of Virginia
Miami University
Michigan State University
Top Public Schools CFOs
University of Pennsylvania
University of Notre Dame
Stanford University
Duke University
Georgetown University
Top Private Schools CFOs
Public universities currently produce the most sitting CFOs
Sitting CFO Undergraduate University2017 Fortune 500 and S&P 500 Companies (663 Sitting CFOs; 617 Known Education Backgrounds)
Crist|Kolder 2017 Volatility Report
14
13
10
7
7
11
10
10
9
8

CRIST KOLDER|ASSOCIATES
60% of CEOs have a Business or Engineering degree
Percentages of CEOs from Each Educational Background 2017 Fortune 500 and S&P 500 (673 Companies; 678 Sitting CEOs)
EngineeringEconomics Business Administration Accounting Finance
Top Majors CEOs
52
*Economics is included in Liberal Arts**Mathematics is included in Sciences***Marketing, International Business, Commerce, Logistics
Sciences***7.7%
Dual8.6%
Liberal Arts**23.5%
Engineering27.4%
Business*32.7%
Business Administration
39.7%
Accounting28.2%
Finance18.4%
Other****13.8%
Crist|Kolder 2017 Volatility Report
14670694932
CRIST KOLDER|ASSOCIATES
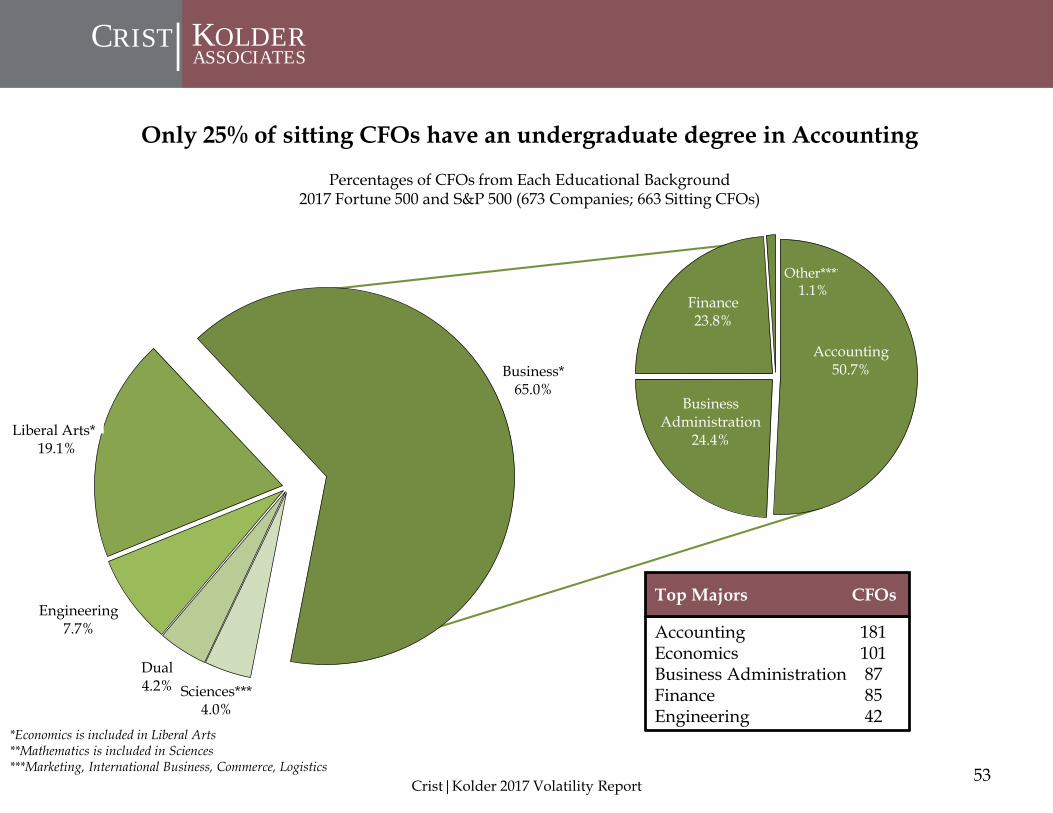
Only 25% of sitting CFOs have an undergraduate degree in Accounting
Percentages of CFOs from Each Educational Background 2017 Fortune 500 and S&P 500 (673 Companies; 663 Sitting CFOs)
AccountingEconomics Business Administration Finance Engineering
Top Majors CFOs
53
*Economics is included in Liberal Arts**Mathematics is included in Sciences***Marketing, International Business, Commerce, Logistics
Sciences***4.0%
Dual4.2%
Engineering7.7%
Liberal Arts**19.1%
Business*65.0%
Accounting50.7%
Business Administration
24.4%
Finance23.8%
Other****1.1%
Crist|Kolder 2017 Volatility Report
181101878542

CRIST KOLDER|ASSOCIATES
Over 65% of CEOs have an advanced degree
CEO Terminal Degree Educational Background2017 Fortune 500 and S&P 500 (673 Companies; 678 Sitting CEOs)
54Crist|Kolder 2017 Volatility Report
Consumer Energy Financial Healthcare Industrial Retail Services TechnologyBachelor 38.0% 36.2% 28.6% 19.0% 32.3% 51.4% 46.8% 33.8%Master 9.9% 5.8% 8.7% 11.1% 7.1% 5.7% 5.3% 15.0%JD 2.8% 2.9% 12.7% 7.9% 5.1% 8.6% 10.6% 2.5%MBA 46.5% 49.3% 47.6% 47.6% 52.5% 34.3% 37.2% 40.0%PhD 2.8% 5.8% 2.4% 14.3% 3.0% 0.0% 0.0% 8.8%
Bach
elor
Bach
elor
Bach
elor
Bach
elor
Bach
elor
Bach
elor
Bach
elor
Bach
elor
MBA M
BA
MBA
MBA
MBA
MBA M
BA MBA
0%
10%
20%
30%
40%
50%
60%
*Advanced degree is any degree past a bachelor

CRIST KOLDER|ASSOCIATES
Over 60% of CFOs have an advanced degreeCFO Terminal Degree Educational Background
2017 Fortune 500 and S&P 500 (673 Companies; 663 Sitting CFOs)
55Crist|Kolder 2017 Volatility Report
Consumer Energy Financial Healthcare Industrial Retail Services TechnologyBachelor 34.7% 31.9% 43.9% 39.3% 42.7% 42.9% 40.4% 32.9%Master 5.6% 7.2% 7.9% 9.8% 6.3% 0.0% 4.5% 11.4%JD 2.8% 2.9% 5.3% 1.6% 2.1% 0.0% 4.5% 3.8%MBA 55.6% 58.0% 40.4% 49.2% 49.0% 57.1% 49.4% 50.6%PhD 1.4% 0.0% 2.6% 0.0% 0.0% 0.0% 1.1% 1.3%
Bach
elor
Bach
elor
Bach
elor
Bach
elor
Bach
elor
Bach
elor
Bach
elor
Bach
elor
MBA M
BA
MBA
MBA
MBA
MBA
MBA MBA
0%
10%
20%
30%
40%
50%
60%
70%
*Advanced degree is any degree past a bachelor

CRIST KOLDER|ASSOCIATES
The path to the C-Suite runs through eight leading MBA programs
Top MBA Schools2017 Fortune 500 and S&P 500 (673 Companies; 646 CEO and 617 CFO Known Education Backgrounds)
56
48
17
16
14
10
7
7
6
25
16
13
18
32
7
13
12
0 10 20 30 40 50 60
Number of CEOs Number of CFOs
Harvard University
Stanford University
Northwestern University
University of Chicago
University of Pennsylvania
New York University
University of Michigan
Columbia University
Crist|Kolder 2017 Volatility Report