c i ー・イュゥウウゥッョ ッヲ tィ・ iョウエゥエオエゥッョ ッヲ …
TRANSCRIPT

c© IET. tィゥウ ゥウ エィ・ 。オエィッイウ カ・イウゥッョ ッヲ エィ・ キッイォN iエ ゥウ ーッウエ・、 ィ・イ・ 「ケー・イュゥウウゥッョ ッヲ tィ・ iョウエゥエオエゥッョ ッヲ eョァゥョ・・イゥョァ@。ョ、@t・」ィョッャッァケ HietI@ヲッイ ー・イウッョ。ャオウ・N nッエ ヲッイ イ・、ゥウエイゥ「オエゥッョ ッイ 」ッュュ・イ」ゥ。ャ オウ・N tィ・ 、・ ョゥエゥカ・ カ・イウゥッョ ゥウ 。カ。ゥャM。「ャ・ 。エ ィエエーウZOO、ゥァゥエ。ャMャゥ「イ。イケNエィ・ゥ・エNッイァON

Chapter 9
Robustness of finger-vein recognition
Christof Kauba1 and Andreas Uhl1
9.1 Introduction
One of the big issues in biometric recognition is robustness of recognition accuracy
against sample signal quality degradation. The performance of a biometric recog-
nition system is usually heavily affected by sample signal quality. A wide variety of
factors potentially influence the quality of acquired biometric samples.
The different types of features that can be extracted from biometric samples
influence the impact of quality degradations on recognition performance in various
ways. Moreover, there is interplay among different types of feature extraction and
acquisition technology/conditions such that it is not clear a priori which type of
feature extraction is favourable under which conditions. Therefore, it is essential to
provide reliable methodology to comparatively assess biometric recognition
robustness under varying conditions.
Fingerprint recognition is a prominent biometric field in which robustness of
recognition accuracy against sample image quality degradation is a central issue
[1,2]. The quality of fingerprint images is influenced by skin conditions (e.g. dry-
ness, moisture, dirt, age, cuts, and bruises), sensor conditions (e.g. dirt, noise, and
size), and other acquisition conditions like user cooperation or crime scene pre-
servation in forensic settings, etc. Some of these factors are inevitable, and some of
them change over time. Poor quality images often result in spurious and missed
features, therefore decreasing the recognition accuracy of the overall system.
In fingerprint recognition, this issue is classically tackled from two sides: First,
benchmarking frameworks have been established, which facilitate a common
evaluation basis with standardised protocols for various fingerprint recognition
algorithms, see e.g. the fingerprint verification contests (FVC [2]) as well as
independent suggestions like [3] and the BioSecure evaluation framework [1]. Sec-
ond, usually these frameworks rely on the establishment of test data which are used
to compare the different algorithms on a common basis. A very good example,
specifically focusing onto the robustness issue, is the FVC datasets. FVC2002 (only
(i) and (iv)) and FVC2004 data have been acquired in a way to introduce higher
1Department of Computer Sciences, University of Salzburg, Austria
Drahansky-6990351 2 March 2018; 12:50:47

intra-class variation by (i) putting the finger at slightly different vertical position,
(ii) applying low or high pressure against the sensor, (iii) exaggerating skin distortion
and rotation, and (iv) drying or moistening fingers. For FVC2006, the population was
chosen to be more heterogeneous, including manual workers and elderly people.
While the availability of these and similar datasets is a significant achieve-
ment, the data collection and database establishment are tedious works. Moreover,
if additional acquisition conditions should be considered which have not been
included into the original dataset, re-enrolment is required, involving complicated
procedures for getting the original people back to enrolment. Also, it is hard to
compare the different quality degradations from dataset to dataset (e.g. FVC,
MCYT, BIOMET, and MSU), since usually, there is no standardised manner to
generate the acquisition conditions applied. Therefore, the experimental results of
recognition algorithms in case applied to different datasets are hardly comparable,
and the results shown in many papers are difficult to interpret.
A strategy to cope with the various problems of generating natural datasets is
to generate synthetic fingerprints, the SFinGe [4] being the most well-known tool
for doing this. The generated fingerprints have proven to be highly realistic and
serve as a sensible tool to generate large datasets for benchmarking. While SFinGe
also allows to apply some manipulations to the images, e.g. noise insertion, trans-
lations, rotations, and uses a skin deformation model, a simulation of specific
sensor types is not foreseen. In related work, we have proposed the watermarking
robustness assessment toolkit StirMark [5] to be used as standardised tool in fin-
gerprint recognition robustness assessment [6,7], which is able to simulate a wide
class of acquisition conditions, applicable to any given (natural) dataset. We have
also applied a simulation of sensor ageing to natural image datasets to assess sensor
ageing robustness of fingerprint recognition systems [8].
However, for hand- and finger-vein recognition systems, there are neither
natural benchmark datasets focussing on robustness issues nor corresponding
robustness evaluation results available. Also, robustness evaluations on simulated
datasets are limited to our own previous work on
● hand-vein recognition, where we assess
– the impact of simulated sensor ageing and StirMark-based distortions on
the recognition performance of hand-vein recognition [9], and
● finger-vein recognition, where we assess
– the impact of simulated sensor ageing [10] and
– the impact of ISO lossy compression standards on the recognition per-
formance of finger-vein recognition [11].
For finger-vein recognition, the data available so far on sensor ageing and com-
pression robustness [10,11] is restricted to a single dataset only (with unknown
generalisation to different datasets/sensors), and for compression robustness
assessment, results only include equal error rate (EER) data and a single com-
pression scenario (both probe and gallery compressed). StirMark-based distortions,
simulating various acquisition conditions, have not yet been investigated for their
impact on this modality at all. We will tackle these issues by providing more
194 Hand-based biometrics: methods and technology
Drahansky-6990351 2 March 2018; 12:50:47

complete experimental results to provide a better understanding of finger-vein
recognition techniques’ robustness in this chapter.
In Section 9.2, we describe the finger-vein recognition algorithms applied and
the datasets used. Section 9.3 deals with the simulation of varying acquisition
conditions using the StirMark toolkit and corresponding impact on recognition
accuracy. In Section 9.4, we describe the impact of applying four different lossy
compression algorithms on recognition discriminating two different application
scenarios. Section 9.5 presents results on sensor-ageing robustness considering
artificially aged datasets. Finally, Section 9.6 concludes this chapter.
9.2 Finger-vein recognition and datasets
9.2.1 Finger-vein recognition algorithms
Pre-processing can be grouped into methods to align the finger position and to
improve the low contrast and image quality. For finger alignment, we use a method
adopted from Lee et al. [12] (LeeRegion) which simply masks out background
pixels (setting them to 0). This is followed by a normalisation step, i.e. rotation
compensation as done in [13].
For image enhancement, we apply Contrast Limited Adaptive Histogram
Equalisation (CLAHE) [14] as the final stage of high frequency emphasis (HFE)
filtering which was originally proposed for hand vein image enhancement [15].
Also, CLAHE is used to post-process a filtering using a Circular Gabor Filter
(CGF) as proposed by Zhang and Yang [16].
To foster reproducible research, we have only included feature extraction
techniques in this study for which basic implementations are available as open-
source software. The first scheme discussed aims to extract the vein pattern from
the background resulting in a binary image, followed by a comparison of these
binary images using a correlation measure.
Maximum curvature (MC [17]) aims to emphasise only the centre lines of the
veins and is therefore insensitive to varying vein width. The first step is the
extraction of the centre positions of the veins. Therefore, the local MC in the cross-
sectional profiles, based on the first and second derivatives, is determined. After-
wards, each profile is classified as being concave or convex where only local
maxima in concave profiles indicate valid centre positions of the veins. Then a
score according to the width and curvature of the vein region is assigned to each
centre position, which is recorded in a matrix called locus space. Due to noise or
other distortions, some pixels may not have been classified correctly at the first
step; thus the centre positions of the veins are connected using a filtering operation.
Finally, binarisation is done by thresholding using the median of the locus space.
For matching the binary feature images, we adopted the approach in [17,18].
As the input images are not registered to each other and only coarsely aligned
(rotation is compensated), the correlation between the input image and in x- and
y-direction shifted versions of the reference image is calculated. The maximum of
these correlation values is normalised and then used as final matching score.
Robustness of finger-vein recognition 195
Drahansky-6990351 2 March 2018; 12:50:48
In contrast to MC, the Scale Invariant Feature Transform (SIFT) keypoint [19]
based technique uses information from the most discriminative points as well as
considering the neighbourhood and context information of these points by extracting
key points and assigning a descriptor to each key point. We employ an additional key
point filtering as described in [20], where keypoints close to the finger/background
boundary are discarded in addition to eventual background keypoints.
SIFT matching is done using the keypoint descriptors – the keypoint with the
smallest distance to the reference keypoint is the matched one if the distance is below
a threshold, otherwise there is no match. To resolve the problem with ambiguous
matches (i.e. one keypoint may have small distances to more than one other point),
the classical ratio threshold scheme is used: A match is only valid if the distance of
the best point match is at least k (threshold) times smaller than to all other points.
For MC, LeeRegion, Normalisation, and CGF pre-processing has been applied
(MC software of B.T. Ton1 is used), while for SIFT feature extraction, LeeRegion,
Resize, CGF, and HFE pre-processing has been used (SIFT feature extraction and
matching software is used as provided by VL_Feat SIFT2). For more details on the
used pre-processing and feature-extraction methods, the interested readers are
referred to [20].
9.2.2 Datasets
For experimental evaluations in this chapter, we use the following two publicly
available finger-vein datasets:
● UTFVP: University of Twente Finger Vascular Pattern (UTFVP) Database
[21], consisting of a total of 1,440 images, taken from 60 subjects, 6 fingers per
subject and 4 images per finger. The images have a resolution of 672 � 380
pixel with 8-b greyscale depth.
● SDUMLA-HMT: This multi-modal dataset was collected during the summer of
2010 at Shandong University, Jinan, China. 106 subjects, including 61 males and
45 females with age between 17 and 31, participated in the data-collecting process,
in which all the five biometric traits� face, finger vein, gait, iris, and fingerprint
are collected for each subject [22]. SDUMLA-HMT is available at http://mla.sdu.
edu.cn/sdumla-hmt.html. The finger-vein dataset consists of 6 fingers per subject,
6 images per finger, 3,816 images, 320 � 240 pixel with 8-b grey level.
The test procedure of the FVC2004 [23] was adopted to determine the EER. For the
genuine matches (to determine False Non-Match Rate (FNMR)), each image of
each finger is compared with all remaining images of the same finger, no sym-
metric matches are performed. For the impostor matches (to determine False Match
Rate (FMR)), the first image of each finger is compared against the corresponding
first image of the same finger of all remaining subjects, again no symmetric mat-
ches are performed.
1Publicly available on MATLAB Central: http://www.mathworks.nl/matlabcentral/fileexchange/
authors/57311.2http://www.vlfeat.org/.
196 Hand-based biometrics: methods and technology
Drahansky-6990351 2 March 2018; 12:50:48
9.3 StirMark distortion robustness: modellingacquisition conditions
Petitcolas et al. [24] developed a benchmark test in the context of robustness eva-
luation for digital image watermarking methods, called StirMark.3 The basic idea
behind their benchmark test is that a digital watermark embedded inside an image
can be attacked by introducing different small image manipulations to the water-
marked image. The specific types of perturbations are pre-defined, and their
intensity can be adjusted via a given set of parameters for each type of perturbation.
Utilising StirMark to generate datasets for robustness evaluations has several
advantages. First of all, the tests are reproducible if their parameters are known and
the test dataset is available. Moreover, it is possible to systematically simulate
different strengths of distortions corresponding to different levels of external
influence during the capturing process. This is hardly possible to achieve using real
data because one would have to create many different acquisition conditions and
ensure stable acquisition conditions during the whole acquisition process across all
of the test subjects. In addition, it becomes a tedious and very time-consuming
work to establish such datasets for a broad variety of different acquisition condi-
tions in combination with different levels of strength. Finally, it may be impossible
to isolate specific external influences from others if there is the need to investigate
the impact of a specific type of influence only.
In the following, we describe the StirMark image manipulations which are
chosen to be appropriate for finger-vein images and used during the experiments.
Not all manipulations provided by StirMark are suitable to simulate natural
acquisition conditions. Thus, only a subset of the complete range of image
manipulations provided by StirMark is used. For each manipulation, the relation to
realistic finger-vein capturing scenarios which could be modelled thereby is out-
lined. Moreover, the way it is defined is described as well as how it is parametrised
to achieve varying strengths. The example images shown have been generated by
applying the respective StirMark manipulation.
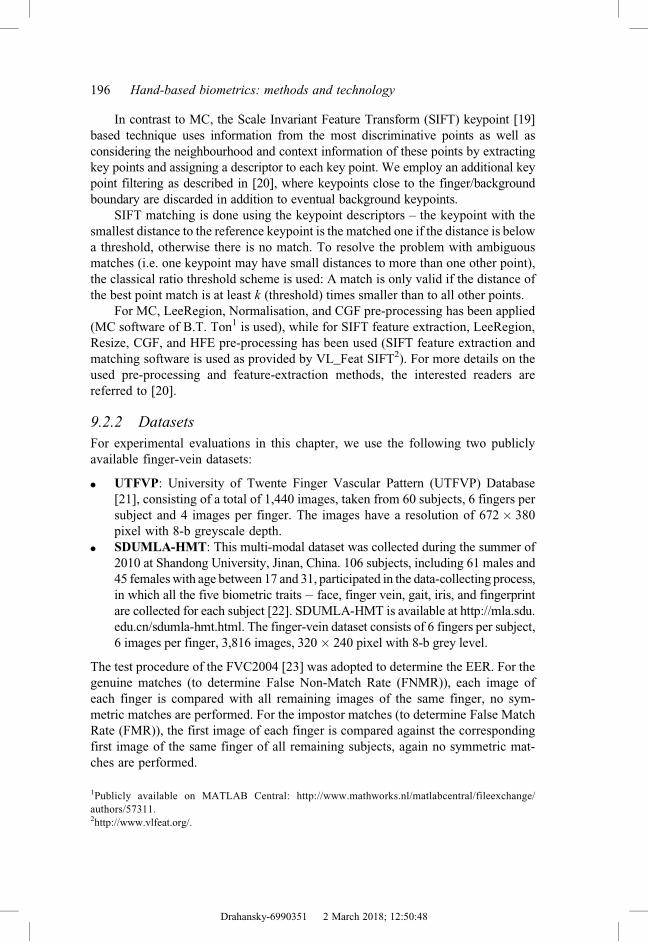
Median filtering results in a kind of blur to the image, additionally corrupting
the clarity of the vein structure. This corresponds to small finger movements during
the acquisition of the image (motion blur) or defocus and in general blurry vein
structures due to the interaction of the infrared light with different types of tissue
inside the finger. The size of the filter mask can be set (height and width of the
mask). Figure 9.1(a) shows an example of maximal filter size used.
Remove lines corresponds to errors in finger-vein images resulting either from
transmission/processing or errors of the scanner while reading the finger-vein
image itself (might not be able to read the entire finger and miss or skip some lines)
can be simulated. This manipulation removes lines from the input image the
amount of which can be adjusted by a single parameter k which corresponds to
the frequency of removing lines, where k means ‘remove 1 line in every k lines’.
3Currently version 4.0 of the toolkit is available at http: //www.petitcolas.net/fabien/watermarking/
stirmark/.
Robustness of finger-vein recognition 197
Drahansky-6990351 2 March 2018; 12:50:49
Of course, the output image is reduced in its size while applying this manipulation.
An example image with maximal value k can be seen in Figure 9.1(b).
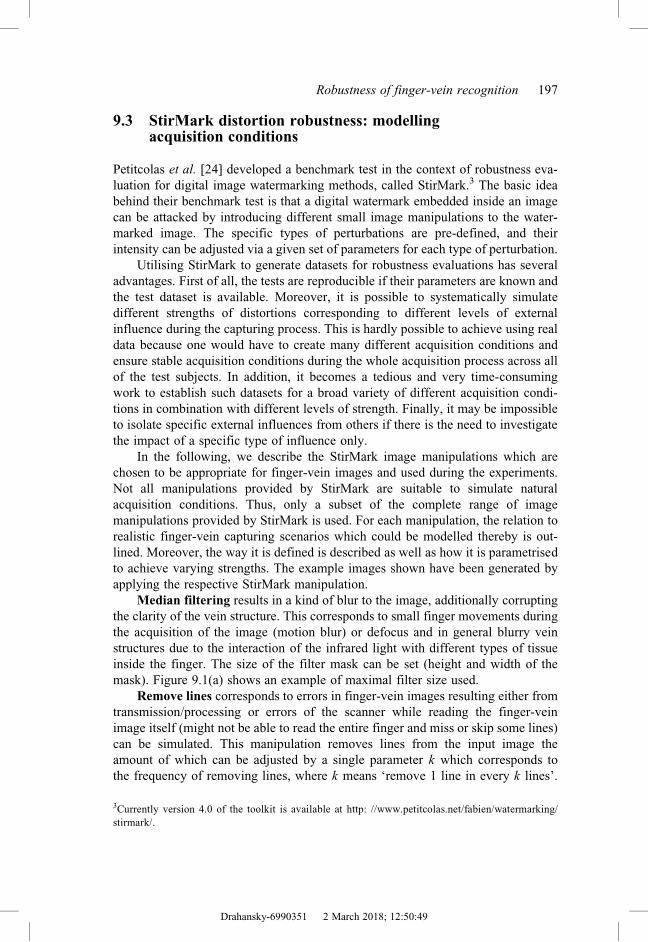
Rotation and cropping corresponds to rotated positioning of the finger on the
sensor, with subsequent image cropping to retain image size. Rotation is a very
typical, not to say – omnipresent – challenge for finger-vein matching, as in very
few cases, a finger will be presented twice in exactly the same orientation to the
sensing area during image acquisition. An example image with maximal rotation
value used can be seen in Figure 9.2(a).
Embedding watermark Watermarks have been intensively discussed to
enhance certain properties of biometric systems [25]. In case robust embedding
techniques are being used, impact on recognition accuracy may be expected [26].
StirMark internal watermarks are embedded with increasing strength, resulting in
decreasing peak signal-to-noise ration (PSNR). An example image with maximal
watermark embedding strength used can be seen in Figure 9.2(b).
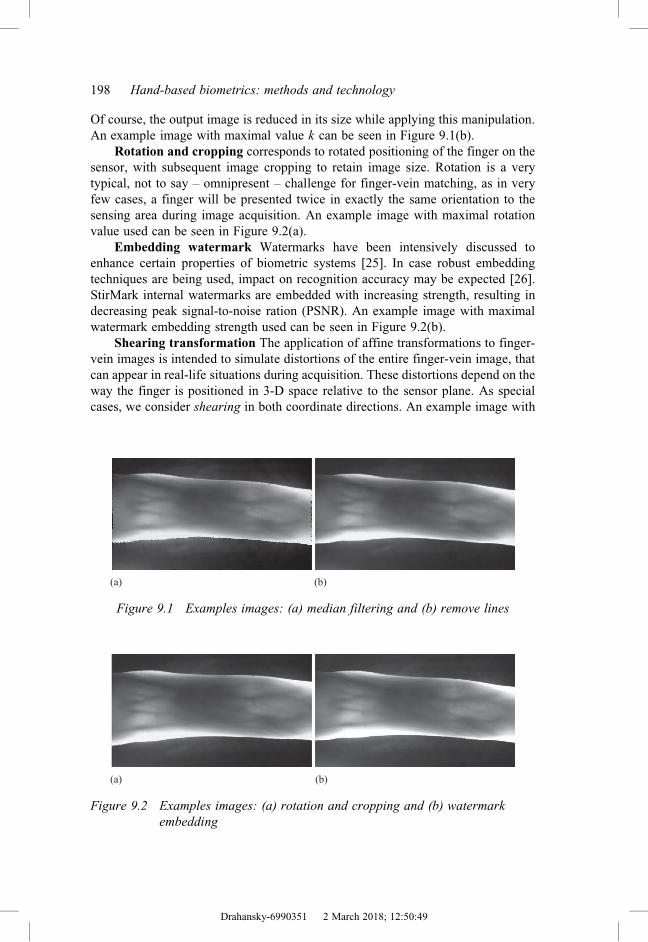
Shearing transformation The application of affine transformations to finger-
vein images is intended to simulate distortions of the entire finger-vein image, that
can appear in real-life situations during acquisition. These distortions depend on the
way the finger is positioned in 3-D space relative to the sensor plane. As special
cases, we consider shearing in both coordinate directions. An example image with
(a) (b)
Figure 9.1 Examples images: (a) median filtering and (b) remove lines
(b)(a)
Figure 9.2 Examples images: (a) rotation and cropping and (b) watermark
embedding
198 Hand-based biometrics: methods and technology
Drahansky-6990351 2 March 2018; 12:50:49
maximal shearing strength used can be seen in Figure 9.3(a) where a lesser extent
of bending of the finger in y-direction can be observed due to the shearing.
Small random distortions These are usually termed The StirMark Test. Being
a combination of several basic manipulations (i.e. random minor geometric dis-
tortion followed by resampling and interpolation, a transfer function to emulate
analogue/digital converter imperfections, global ‘bending’, high frequency dis-
placement, and JPEG compression), this test originally aims to simulate a resam-
pling process, i.e. the errors introduced when printing an image and then scanning it
again. The involved image warping is performed both on a global, as well as on a
very local level. For the finger-vein scenario, this test can be seen as modelling a
very generic, diffuse form of distortion. An example image with maximal strength
used can be seen in Figure 9.3(b) where contrasting to most other visual example,
the impact of the distortion can easily be observed.
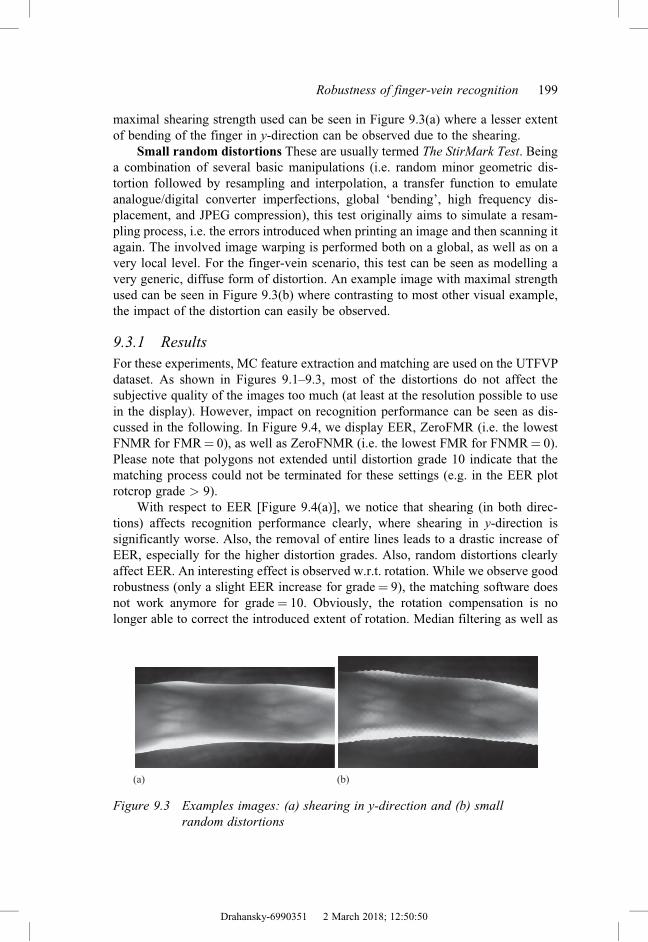
9.3.1 Results
For these experiments, MC feature extraction and matching are used on the UTFVP
dataset. As shown in Figures 9.1–9.3, most of the distortions do not affect the
subjective quality of the images too much (at least at the resolution possible to use
in the display). However, impact on recognition performance can be seen as dis-
cussed in the following. In Figure 9.4, we display EER, ZeroFMR (i.e. the lowest
FNMR for FMR ¼ 0), as well as ZeroFNMR (i.e. the lowest FMR for FNMR ¼ 0).
Please note that polygons not extended until distortion grade 10 indicate that the
matching process could not be terminated for these settings (e.g. in the EER plot
rotcrop grade > 9).
With respect to EER [Figure 9.4(a)], we notice that shearing (in both direc-
tions) affects recognition performance clearly, where shearing in y-direction is
significantly worse. Also, the removal of entire lines leads to a drastic increase of
EER, especially for the higher distortion grades. Also, random distortions clearly
affect EER. An interesting effect is observed w.r.t. rotation. While we observe good
robustness (only a slight EER increase for grade ¼ 9), the matching software does
not work anymore for grade ¼ 10. Obviously, the rotation compensation is no
longer able to correct the introduced extent of rotation. Median filtering as well as
(b)(a)
Figure 9.3 Examples images: (a) shearing in y-direction and (b) small
random distortions
Robustness of finger-vein recognition 199
Drahansky-6990351 2 March 2018; 12:50:50
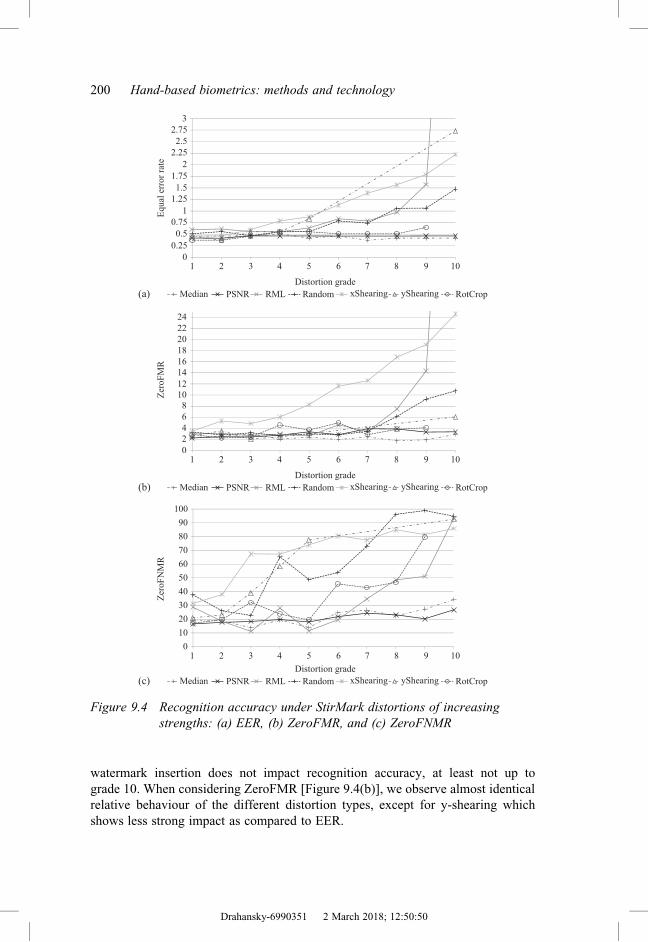
watermark insertion does not impact recognition accuracy, at least not up to
grade 10. When considering ZeroFMR [Figure 9.4(b)], we observe almost identical
relative behaviour of the different distortion types, except for y-shearing which
shows less strong impact as compared to EER.
3
24
22
20
18
16
14
12
10
100
90
80
70
60
50
Zer
oF
NM
RZ
eroF
MR
Equal
err
or
rate
40
30
20
10
0
8
6
4
2
0
2.75
2.5
2.25
1.75
1.5
1.25
1
0.75
0.5
0.25
01 2 3 4 5 6 7 8 9 10
1 2 3 4 5 6 7 8 9 10
1 2
Median PSNR RML Random xShearing
Distortion grade
yShearing RotCrop
Median PSNR RML Random xShearing
Distortion grade
yShearing RotCrop
Median(a)
(b)
(c)
PSNR RML Random xShearing
Distortion grade
yShearing RotCrop
3 4 5 6 7 8 9 10
2
Figure 9.4 Recognition accuracy under StirMark distortions of increasing
strengths: (a) EER, (b) ZeroFMR, and (c) ZeroFNMR
200 Hand-based biometrics: methods and technology
Drahansky-6990351 2 March 2018; 12:50:50

ZeroFNMR as shown in Figure 9.4(c) shows slightly different behaviour.
While Median Filtering and Watermark Insertion do not create significantly more
false positive matches when increasing their distortion strength, we see small ran-
dom distortion taking ‘the lead’ (worst FMR) for high distortion grades and also
rotation getting more problematic as observed with EER and ZeroFMR.
Summarising, we may state that different distortion types have a very different
impact to MC finger-vein recognition accuracy, and also we have to differentiate
between the creation of false positive (higher FMR) or false negative (higher
FNMR) matches for different distortion types.
9.4 Compression robustness
Contrasting and in addition to the first and only work on compression robustness of
finger-vein recognition [11], we consider an additional non-standardised recent still
image compression scheme, we extend the analysis to ZeroFMR (instead of only
considering EER), and we consider two datasets (instead of a single one in order to
be able to judge generalisation potential of our results). Furthermore, a systematic
consideration of compression employment scenarios is conducted.
The certainly most relevant standard for compressing image data relevant in
biometric systems is the International Organization for Standardization/International
Electrotechnical Commission (ISO/IEC) 19794 standard suite on Biometric Data
Interchange Formats where in the most recently published version (ISO/IEC
19794-9:2011 for vascular data), JPEG, JPEG_LS, and JPEG2000 are included for
lossy compression (see clause 8.3.13). The ANSI/NIST-ITL 1-2011 standard
on ‘Data Format for the Interchange of Fingerprint, Facial & Other Biometric
Information’ (former ANSI/NIST-ITL 1-2007) only supports JPEG2000 for
applications tolerating lossy compression.
In this chapter, we consider three different ISO/IEC (lossy) image compression
standards and a non-standardised technique for increasing compression rates
(i.e. ratio between original file size and file size after compression) up to 110 using
the respective default configurations unless stated otherwise:
1. JPEG (JPG): The well-known (ISO/IEC IS 10918-1) Discrete Cosine Transform
(DCT)-based image compression method. By adjusting the divisors in the
quantisation phase, different compression ratios can be achieved. We adjust the
quality parameter iteratively to achieve a file size closest to the desired com-
pression rate. The MATLAB� implementation is used.
2. JPEG 2000 (J2K): The wavelet-based image compression standard (ISO/IEC
IS 15444-1) can operate at higher compression ratios as well. J2K is also a part
of the Digital Imaging and Communications in Medicine (DICOM) standard
where it replaced lossless JPEG compression. Results typically do not generate
block-based artefacts as the original DCT-based JPG standard. J2K facilitates
explicit rate control, i.e. target bitrates are met with high accuracy. We use
JJ2000 version 5.1 available at https://code.google.com/p/jj2000/. For J2K, we
additionally employ three variants of region of interest coding (Region of
Robustness of finger-vein recognition 201
Drahansky-6990351 2 March 2018; 12:50:50
Interest (ROI), i.e. the pixels corresponding to the finger): first, the classical
variant where all the ROI data is coded into the bitstream before the back-
ground data; second, where also resolution Level 0 of the background is
encoded together with the ROI data; and third, where the first four resolution
levels of the background is encoded with the ROI data.
3. JPEG-XR (JXR): This compression standard based on Microsoft’s HD Photo is
known to produce higher quality than JPEG but provides faster compression
than JPEG 2000. In the default configuration, the Photo Overlay/Overlap
Transformation is only applied to high pass coefficients prior to the Photo Core
Transformation (ISO/IEC IS 29199-2). We adjust quantisation levels itera-
tively to achieve a target bitrate closest to the desired one. Software available
at https://jxrlib.codeplex.com/ is used in experiments.
4. BPG: The ‘Better Portable Graphics’ algorithm is based on a subset of the
H.265 (HEVC, ISO/IEC 23008-2) video compression standard. We adjust
quantisation levels iteratively to achieve a target bitrate closest to the desired
one. The employed software can be downloaded from https://bellard.org/bpg/.
The classical scenario to employ compression in biometric systems is a distributed
architecture, where the sensor for authentication sample-data acquisition is dis-
located from the biometric matching module. Thus, sample data (the probe) is
compressed to facilitate efficient transmission. On the other hand, also enrolment
sample data might be kept to enable a change of the template representation
without the need for re-enrolment, and if done so, data is certainly compressed (and
encrypted) for storage (the gallery). Thus, we have two scenarios how compression
may be applied: First, only one sample is compressed (before template generation),
i.e. either probe or gallery data (scenario 1-compressed). And second, both samples
involved in matching have been compressed before template extraction (scenario
2-compressed). Depending on the results we obtain, we may give a recommenda-
tion which of the two options should be applied in case we have at least one sample
being subjected to compression in mandatory manner (because we may decide if
the second sample should be compressed or not depending on the results).
In the experiments, we use both datasets described in Section 9.2, and also
the outcome of both recognition schemes (i.e. MC and SIFT) will be compared.
Figure 9.5 shows compressed UTFVP images.
It can be clearly seen that JPEG compression is already beyond its limits for
sensible operation at a compression ratio of 70 for these type of image data. At
compression ratio 110, compression artefacts are clearly visible for JXR and BPG,
while J2K subjectively provides the best visual quality.
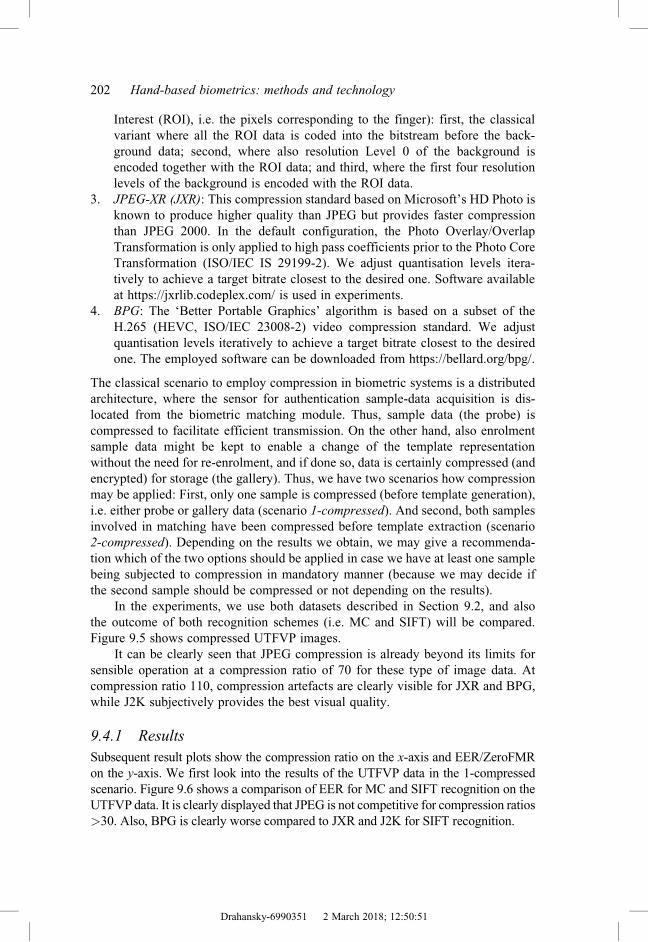
9.4.1 Results
Subsequent result plots show the compression ratio on the x-axis and EER/ZeroFMR
on the y-axis. We first look into the results of the UTFVP data in the 1-compressed
scenario. Figure 9.6 shows a comparison of EER for MC and SIFT recognition on the
UTFVP data. It is clearly displayed that JPEG is not competitive for compression ratios
>30. Also, BPG is clearly worse compared to JXR and J2K for SIFT recognition.
202 Hand-based biometrics: methods and technology
Drahansky-6990351 2 March 2018; 12:50:51

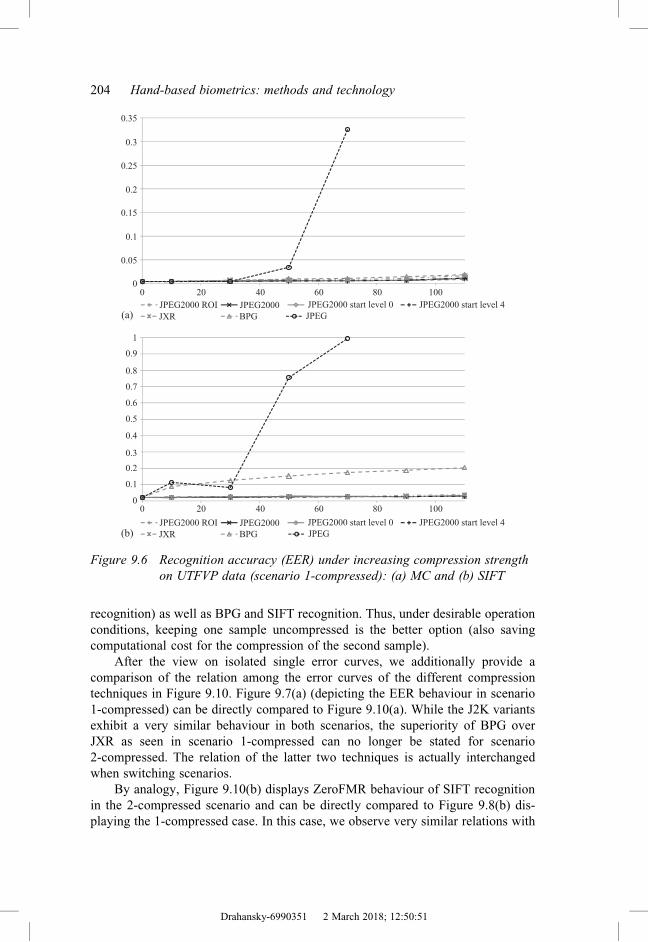
More details hidden by the superimposed polygons in Figure 9.6 are shown in
Figure 9.7. For MC recognition, the various J2K options are clearly the best, with
the ‘pure’ ROI coding variant being the best option. JXR is clearly inferior, while
BPG is the worst option in this detailed view [Figure 9.7(a)]. For SIFT, the different
J2K options are pretty close, while JXR is the worst option for most compression
ratios.
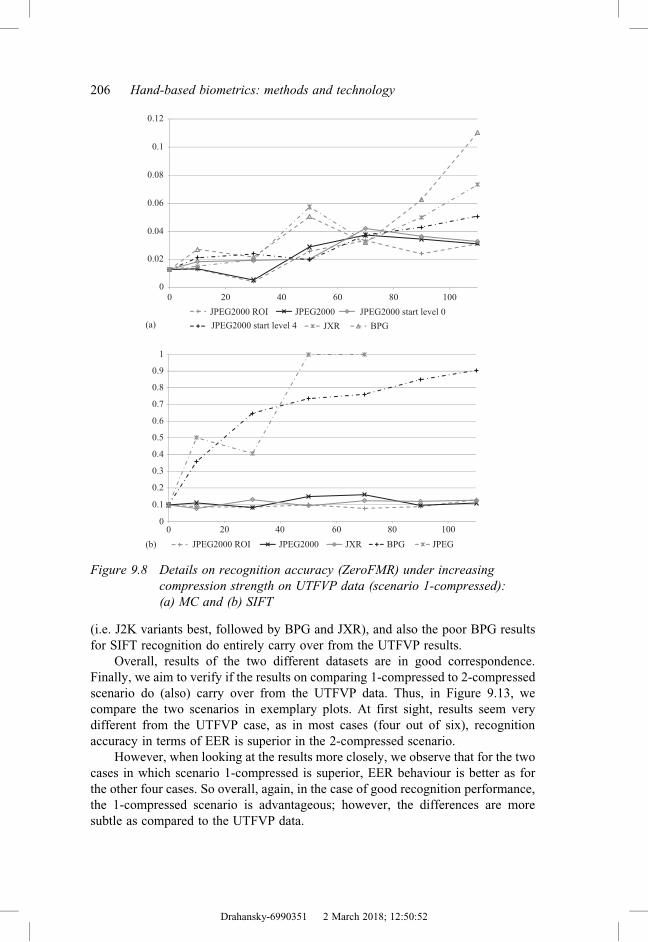
Figure 9.8 shows results on ZeroFMR. For MC recognition [Figure 9.8(a)],
JPEG turns out to lead to very poor results (which are not shown), while the J2K
variants are clearly better than BPG and JXR (where again the ‘pure’ ROI coding is
best in most cases). BPG is worst for high compression ratios. For SIFT recognition
[Figure 9.8(b)], JPEG and BPG give very poor results, while J2K, J2K ROI, and
JXR are rather close in performance.
When comparing the trend for EER and ZeroFMR, we see similar overall
trends, while in some details, differences are found: for SIFT, JPEG, and BPG,
performance is rather close for ZeroFMR, while in terms of EER BPG is much
better. For MC recognition, JXR and BPG exhibit surprisingly good values for
compression ratio 70 in terms of ZeroFMR, while this is not visible in terms
of EER.
In Figure 9.9, we compare the two scenarios in exemplary plots. Interestingly,
in most cases (four out of six), recognition accuracy in terms of EER is superior in
the 1-compressed scenario.
When looking more closely to the cases with opposite behaviour, we notice
that better results for the 2-compressed scenario are only observed in cases with
overall very low EER, i.e. JPEG for high compression ratios (both MC and SIFT
(a) (b)
(c) (d)
Figure 9.5 Compressed UTFVP images: (a) JPEG, ratio ¼ 70; (b) BPG,
ratio ¼ 110; (c) J2K, ratio ¼ 110; and (d) JXR, ratio ¼ 110
Robustness of finger-vein recognition 203
Drahansky-6990351 2 March 2018; 12:50:51
recognition) as well as BPG and SIFT recognition. Thus, under desirable operation
conditions, keeping one sample uncompressed is the better option (also saving
computational cost for the compression of the second sample).
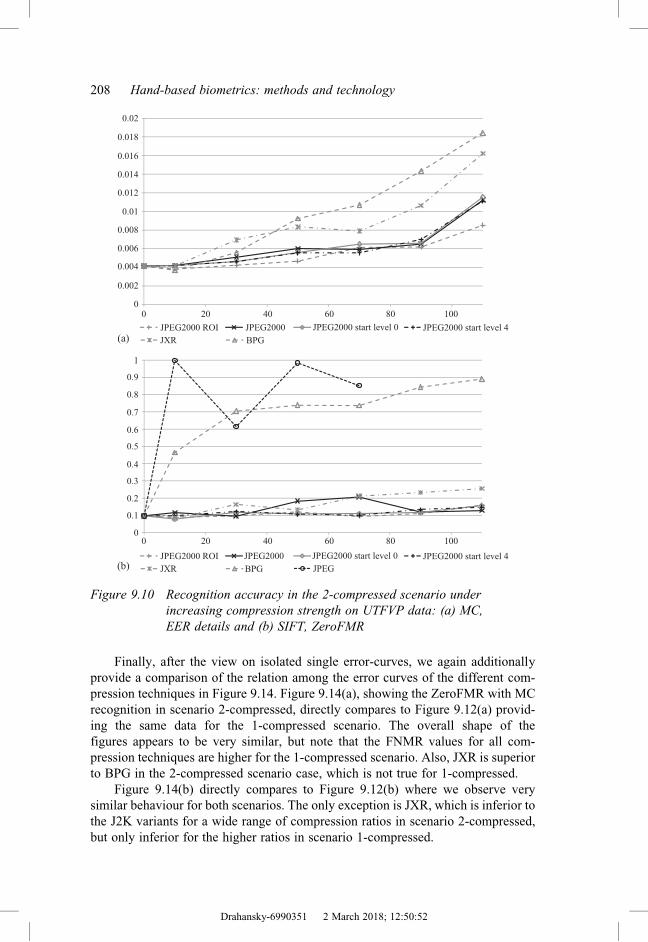
After the view on isolated single error curves, we additionally provide a
comparison of the relation among the error curves of the different compression
techniques in Figure 9.10. Figure 9.7(a) (depicting the EER behaviour in scenario
1-compressed) can be directly compared to Figure 9.10(a). While the J2K variants
exhibit a very similar behaviour in both scenarios, the superiority of BPG over
JXR as seen in scenario 1-compressed can no longer be stated for scenario
2-compressed. The relation of the latter two techniques is actually interchanged
when switching scenarios.
By analogy, Figure 9.10(b) displays ZeroFMR behaviour of SIFT recognition
in the 2-compressed scenario and can be directly compared to Figure 9.8(b) dis-
playing the 1-compressed case. In this case, we observe very similar relations with
0.35
0.3
0.25
0.2
0.15
0.1
0.05
1
0.9
0.8
0.7
0.6
0.5
0.4
0.3
0.2
0.1
0
00 20
(a)
(b)
40 60 80 100
0 20 40 60 80 100
JPEG2000 ROI JPEG2000 JPEG2000 start level 0 JPEG2000 start level 4
JXR BPG JPEG
JPEG2000 ROI JPEG2000 JPEG2000 start level 0 JPEG2000 start level 4
JXR BPG JPEG
Figure 9.6 Recognition accuracy (EER) under increasing compression strength
on UTFVP data (scenario 1-compressed): (a) MC and (b) SIFT
204 Hand-based biometrics: methods and technology
Drahansky-6990351 2 March 2018; 12:50:51
the major difference that JXR gets clearly inferior to the J2K variants for higher
compression ratios.
In the following, we investigate if the observed results do indeed carry over to
the second dataset, i.e. the SDUMLA-HMT data. Again, JPEG results are by far
worst, and JPEG is only able to compress the images up to compression ratio 50
(due to the lower resolution of the SDUMLA-HMT data as compared to UTFVP).
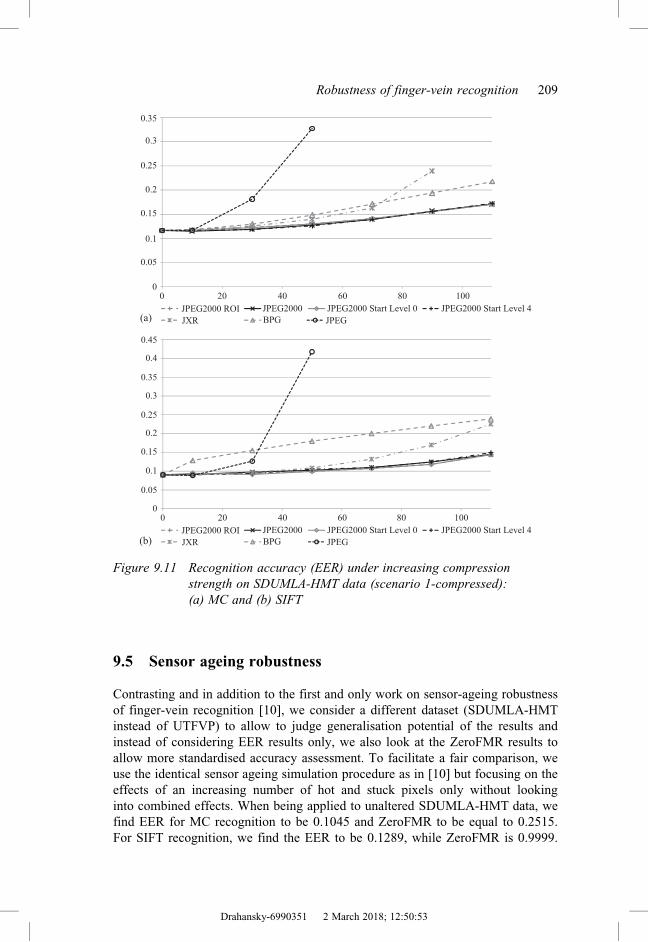
Figure 9.11 displays EER for the 1-compressed scenario for MC and SIFT recog-
nition, respectively. We again observe for both recognition schemes that the J2K
variants are very close and give clearly better behaviour as compared to JXR. BPG
behaviour is also quite similar to the UTFVP case – while being close to JXR for MC
recognition, the results for SIFT recognition are clearly inferior to J2K and JXR.
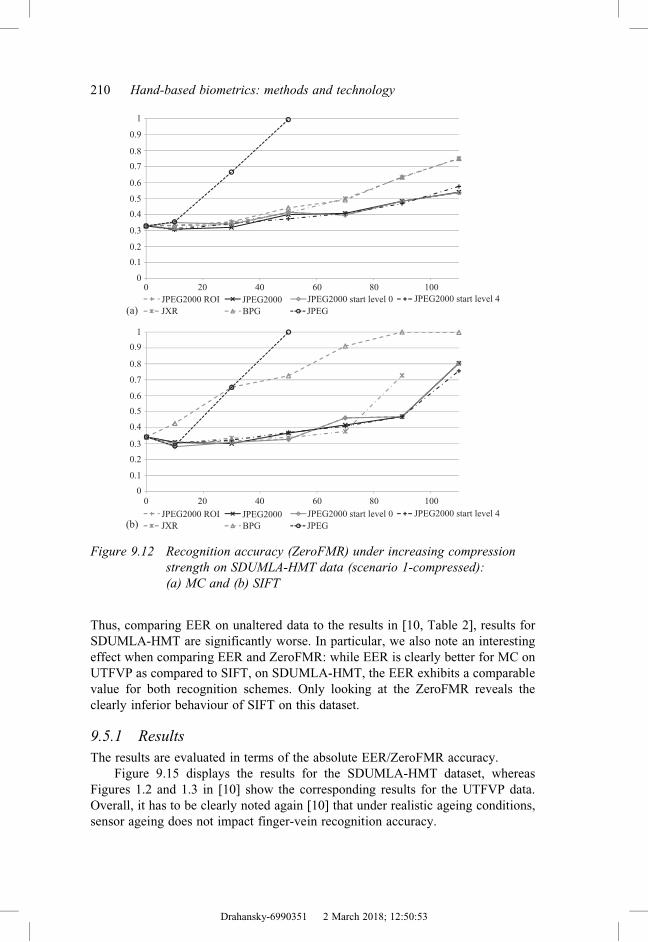
ZeroFMR results as shown in Figure 9.12 correspond even better to the
expectations. For MC recognition, the clear ranking is identical to the UTFVP data
0.04
0.035
0.03
0.025
0.02
0.015
0.01
0.05
00 20 40 60 80 100
0 20 40 60 80 100
JPEG2000 JPEG2000 start level 0
JPEG2000 start level 4
JPEG2000 start level 4
(a)
(b)
JPEG2000 ROI
JXR BPG
0.02
0.018
0.016
0.014
0.012
0.01
0.008
0.006
0.004
0.002
0
JPEG2000 ROI JPEG2000 JPEG2000 start level 0
JXR
Figure 9.7 Details on recognition accuracy (EER) under increasing
compression strength on UTFVP data (scenario 1-compressed):
(a) MC and (b) SIFT
Robustness of finger-vein recognition 205
Drahansky-6990351 2 March 2018; 12:50:52
(i.e. J2K variants best, followed by BPG and JXR), and also the poor BPG results
for SIFT recognition do entirely carry over from the UTFVP results.
Overall, results of the two different datasets are in good correspondence.
Finally, we aim to verify if the results on comparing 1-compressed to 2-compressed
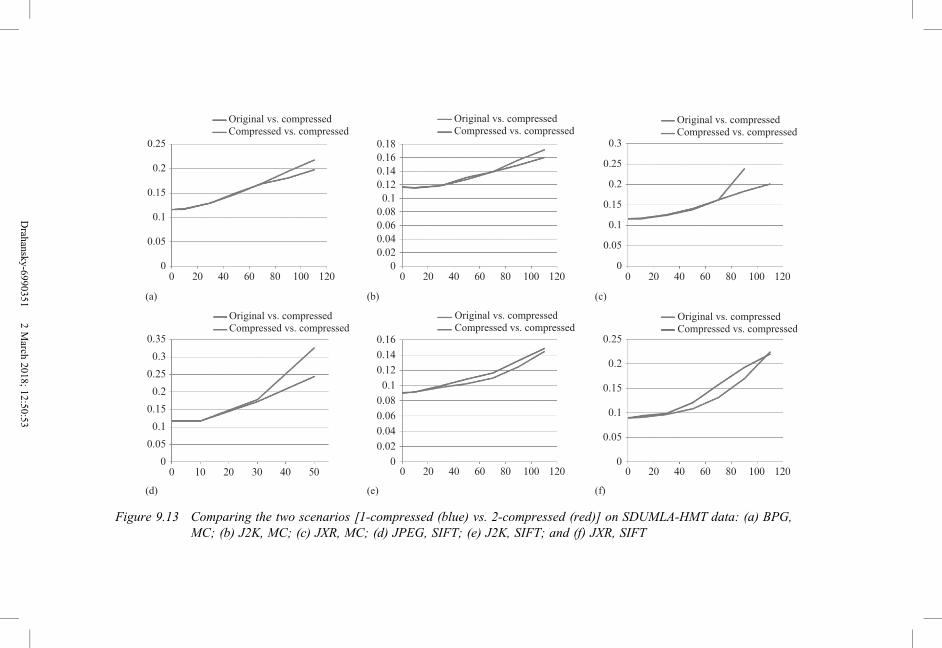
scenario do (also) carry over from the UTFVP data. Thus, in Figure 9.13, we
compare the two scenarios in exemplary plots. At first sight, results seem very
different from the UTFVP case, as in most cases (four out of six), recognition
accuracy in terms of EER is superior in the 2-compressed scenario.
However, when looking at the results more closely, we observe that for the two
cases in which scenario 1-compressed is superior, EER behaviour is better as for
the other four cases. So overall, again, in the case of good recognition performance,
the 1-compressed scenario is advantageous; however, the differences are more
subtle as compared to the UTFVP data.
JPEG2000 ROI JPEG2000 JPEG2000 start level 0
JPEG2000 start level 4 JXR BPG
0 20 40 60 80 100
0.12
1
0.9
0.8
0.7
0.6
0.5
0.4
0.3
0.2
0.1
00 20 40
JPEG2000JPEG2000 ROI
(a)
(b) JXR BPG JPEG
60 80 100
0.1
0.08
0.06
0.04
0.02
0
Figure 9.8 Details on recognition accuracy (ZeroFMR) under increasing
compression strength on UTFVP data (scenario 1-compressed):
(a) MC and (b) SIFT
206 Hand-based biometrics: methods and technology
Drahansky-6990351 2 March 2018; 12:50:52

0.35
0.3
0.25
0.2
0.15
0.1
0.05
0
1.2
1
0.8
0.6
0.4
0.2
0
0.25
0.2
0.15
0.1
0.05
0
0.07
0.06
0.05
0.04
0.03
0.01
0.02
0
0.014
0.012
0.01
0.008
0.006
0.004
0.002
0
0.02
0.018
0.016
0.014
0.012
0.01
0.008
0.006
0.004
0.002
00 20 40
Original vs. compressed
Compressed vs. compressed
Original vs. compressed
Compressed vs. compressed
Original vs. compressed
Compressed vs. compressed
Original vs. compressed
Compressed vs. compressed
Original vs. compressed
Compressed vs. compressed
Original vs. compressed
Compressed vs. compressed
60 80
0 20 40 60 80 0 20 40 60 80 100 120
0 20 40 60 80 100 120 0 20 40 60 80 100 120
0 20 40 60 80 100 120
(a) (b) (c)
(d) (e) (f)
Figure 9.9 Comparing the two scenarios [1-compressed (light grey) vs. 2-compressed (dark grey)] on UTFVP data: (a) JPEG, MC;
(b) J2K, MC; (c) JXR, MC; (d) JPEG, SIFT; (e) BPG, SIFT; and ( f ) JXR, SIFT
Drah
ansk
y-6
990351
2M
arch2018;
12:5
0:5
2
Finally, after the view on isolated single error-curves, we again additionally
provide a comparison of the relation among the error curves of the different com-
pression techniques in Figure 9.14. Figure 9.14(a), showing the ZeroFMR with MC
recognition in scenario 2-compressed, directly compares to Figure 9.12(a) provid-
ing the same data for the 1-compressed scenario. The overall shape of the
figures appears to be very similar, but note that the FNMR values for all com-
pression techniques are higher for the 1-compressed scenario. Also, JXR is superior
to BPG in the 2-compressed scenario case, which is not true for 1-compressed.
Figure 9.14(b) directly compares to Figure 9.12(b) where we observe very
similar behaviour for both scenarios. The only exception is JXR, which is inferior to
the J2K variants for a wide range of compression ratios in scenario 2-compressed,
but only inferior for the higher ratios in scenario 1-compressed.
0.02
0.018
0.016
0.014
0.012
0.01
0.008
0.006
0.004
0.002
1
0.9
0.8
0.7
0.6
0.5
0.4
0.3
0.2
0.1
0
00 20 40 60 80 100
0 20 40 60 80 100
(a)
(b)
JPEG2000 ROI JPEG2000 JPEG2000 start level 0 JPEG2000 start level 4
JXR BPG
JPEG2000 ROI JPEG2000 JPEG2000 start level 0 JPEG2000 start level 4
JXR BPG JPEG
Figure 9.10 Recognition accuracy in the 2-compressed scenario under
increasing compression strength on UTFVP data: (a) MC,
EER details and (b) SIFT, ZeroFMR
208 Hand-based biometrics: methods and technology
Drahansky-6990351 2 March 2018; 12:50:52
9.5 Sensor ageing robustness
Contrasting and in addition to the first and only work on sensor-ageing robustness
of finger-vein recognition [10], we consider a different dataset (SDUMLA-HMT
instead of UTFVP) to allow to judge generalisation potential of the results and
instead of considering EER results only, we also look at the ZeroFMR results to
allow more standardised accuracy assessment. To facilitate a fair comparison, we
use the identical sensor ageing simulation procedure as in [10] but focusing on the
effects of an increasing number of hot and stuck pixels only without looking
into combined effects. When being applied to unaltered SDUMLA-HMT data, we
find EER for MC recognition to be 0.1045 and ZeroFMR to be equal to 0.2515.
For SIFT recognition, we find the EER to be 0.1289, while ZeroFMR is 0.9999.
0.35
0.3
0.25
0.2
0.15
0.1
0.05
00
(a)
(b)
0.45
0.4
0.35
0.3
0.25
0.2
0.15
0.1
0.05
0
JPEG2000 ROI JPEG2000 JPEG2000 Start Level 0 JPEG2000 Start Level 4
JXR BPG JPEG
20 40 60 80 100
0 20 40 60 80 100
JPEG2000 ROI JPEG2000 JPEG2000 Start Level 0 JPEG2000 Start Level 4
JXR BPG JPEG
Figure 9.11 Recognition accuracy (EER) under increasing compression
strength on SDUMLA-HMT data (scenario 1-compressed):
(a) MC and (b) SIFT
Robustness of finger-vein recognition 209
Drahansky-6990351 2 March 2018; 12:50:53
Thus, comparing EER on unaltered data to the results in [10, Table 2], results for
SDUMLA-HMT are significantly worse. In particular, we also note an interesting
effect when comparing EER and ZeroFMR: while EER is clearly better for MC on
UTFVP as compared to SIFT, on SDUMLA-HMT, the EER exhibits a comparable
value for both recognition schemes. Only looking at the ZeroFMR reveals the
clearly inferior behaviour of SIFT on this dataset.
9.5.1 Results
The results are evaluated in terms of the absolute EER/ZeroFMR accuracy.
Figure 9.15 displays the results for the SDUMLA-HMT dataset, whereas
Figures 1.2 and 1.3 in [10] show the corresponding results for the UTFVP data.
Overall, it has to be clearly noted again [10] that under realistic ageing conditions,
sensor ageing does not impact finger-vein recognition accuracy.
JPEG2000 start level 0 JPEG2000 start level 4JPEG2000 ROI JPEG2000
JXR BPG JPEG
JPEG2000 start level 0 JPEG2000 start level 4JPEG2000 ROI JPEG2000
JXR BPG JPEG
1
0.9
0.8
0.7
0.6
0.5
0.4
0.3
0.2
0.1
1
0.9
0.8
0.7
0.6
0.5
0.4
0.3
0.2
0.1
0
00 20 40 60 80 100
0 20 40 60 80 100
(a)
(b)
Figure 9.12 Recognition accuracy (ZeroFMR) under increasing compression
strength on SDUMLA-HMT data (scenario 1-compressed):
(a) MC and (b) SIFT
210 Hand-based biometrics: methods and technology
Drahansky-6990351 2 March 2018; 12:50:53
(a) (b) (c)
(d) (e) (f)
0 20 40 60 80 100
0
0 0 0
0.05
0.1
0.15
0.2
0.25
0.02
0.04
0.06
0.08
0.1
0.12
0.14
0.16
0.05
0.1
0.15
0.2
0.25
0.3
0.35
10 20 30 40 50
120 0 20 40 60 80 100 120 0 20 40 60 80 100 120
0 20 40 60 80 100 120 0 20 40 60 80 100 120
0
Original vs. compressed
Compressed vs. compressed
Original vs. compressed
Compressed vs. compressedOriginal vs. compressed
Compressed vs. compressed
Original vs. compressed
Compressed vs. compressed
Original vs. compressed
Compressed vs. compressedOriginal vs. compressed
Compressed vs. compressed
0
0.05
0.1
0.15
0.2
0.25
0.3
0.05
0.1
0.15
0.2
0.25
0
0.02
0.04
0.06
0.08
0.1
0.12
0.14
0.16
0.18
Figure 9.13 Comparing the two scenarios [1-compressed (blue) vs. 2-compressed (red)] on SDUMLA-HMT data: (a) BPG,
MC; (b) J2K, MC; (c) JXR, MC; (d) JPEG, SIFT; (e) J2K, SIFT; and (f) JXR, SIFT
Drah
ansk
y-6
990351
2M
arch2018;
12:5
0:5
3
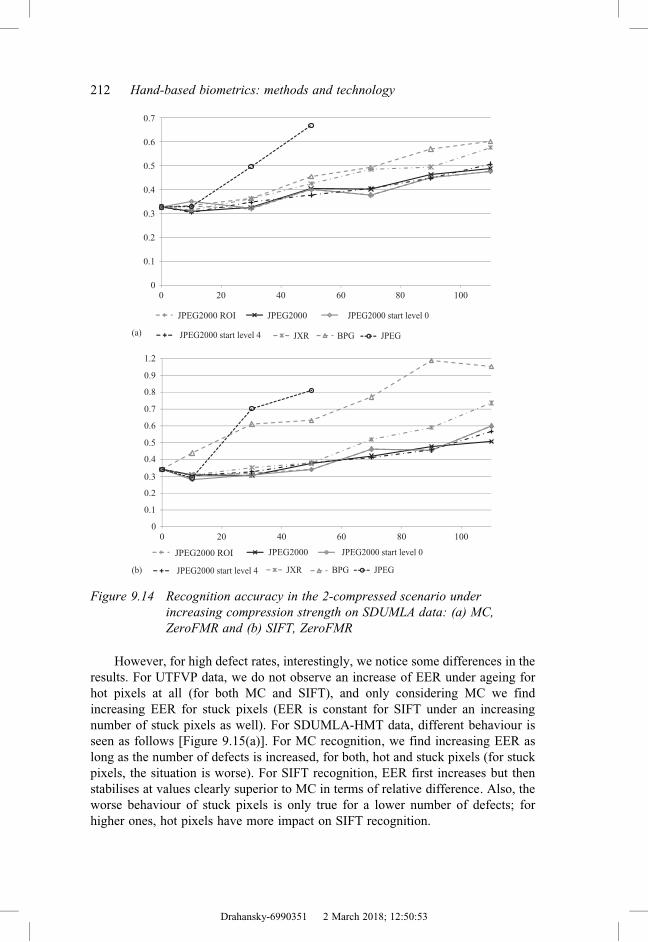
However, for high defect rates, interestingly, we notice some differences in the
results. For UTFVP data, we do not observe an increase of EER under ageing for
hot pixels at all (for both MC and SIFT), and only considering MC we find
increasing EER for stuck pixels (EER is constant for SIFT under an increasing
number of stuck pixels as well). For SDUMLA-HMT data, different behaviour is
seen as follows [Figure 9.15(a)]. For MC recognition, we find increasing EER as
long as the number of defects is increased, for both, hot and stuck pixels (for stuck
pixels, the situation is worse). For SIFT recognition, EER first increases but then
stabilises at values clearly superior to MC in terms of relative difference. Also, the
worse behaviour of stuck pixels is only true for a lower number of defects; for
higher ones, hot pixels have more impact on SIFT recognition.
00
1.2
0.9
0.8
0.7
0.6
0.5
0.4
0.3
0.2
0.1
00 20 40 60 80 100
20 40 60 80 100
0.1
0.2
0.3
0.4
0.5
0.6
0.7
JPEG2000 ROI
JPEG2000 ROI
JPEG2000
JPEG2000
JPEG2000 start level 0
JPEG2000 start level 0
JPEG2000 start level 4(a)
(b) JPEG2000 start level 4
JXR
JXR
BPG
BPG
JPEG
JPEG
Figure 9.14 Recognition accuracy in the 2-compressed scenario under
increasing compression strength on SDUMLA data: (a) MC,
ZeroFMR and (b) SIFT, ZeroFMR
212 Hand-based biometrics: methods and technology
Drahansky-6990351 2 March 2018; 12:50:53

ZeroFMR results, not being considered in [10] [Figure 9.15(b)], do not indicate
any change of the SIFT results for an increasing number of defects. This is due to
the already catastrophic FNMR values which cannot increase any more. For MC
recognition, we find significantly increasing FNMR for increasing defect numbers,
more pronounced for stuck pixels at high defect numbers and more pronounced for
hot pixels at lower defect numbers.
9.6 Conclusion
For the three different aspects of robustness, we reach the following conclusions:
● Acquisition conditions: Incorrect finger placement in 3-D space relative to the
sensor plane as modelled by shearing turns out to be highly problematic for
recognition performance. Also, an excessive line loss or rotation significantly
(a)
(b)
0
2
4
6
8
10
12
14
16
18
20
No. of defects
EE
RZ
eroF
MR
00
10
20
30
40
50
60
70
80
90
100
500 1,000 1,500
No. of defects
2,000 2,500 3,000
SIFT hot SIFT stuck MC hot MC stuck
SIFT hot SIFT stuck MC hot MC stuck
0 500 1,000 1,500 2,000 2,500 3,000
Figure 9.15 Relative recognition accuracy (MC and SIFT algorithms,
respectively) under simulated sensor ageing of increasing
strength: (a) EER and (b) ZeroFMR
Robustness of finger-vein recognition 213
Drahansky-6990351 2 March 2018; 12:50:54

impacts on recognition accuracy. On the other hand, it turns out that watermark
insertion and median filtering (used to model motion blur or defocus) does not
affect finger-vein recognition accuracy too much. It is also interesting to
observe that different types of distortions tend to generate different amounts
of false positives and false negatives, changing the ranking among distortion
types clearly.
● Lossy compression: Result correspondence between the two datasets con-
sidered is very good; thus, we may assume that our findings also do carry over
to other finger-vein data (i.e. sensors). Also, results do carry over from EER-
based rankings to ZeroFMR ones; however, differences are more pronounced
in some cases for ZeroFMR. With respect to compression scenarios, we have
found that in the case of higher recognition accuracy, it is beneficial to have
one template being derived from uncompressed sample data, while for situa-
tions with lower overall recognition accuracy, it is of advantage to compute
both templates involved in matching from compressed data. In terms of com-
pression schemes, JPEG is clearly not useful in medium and high compression
ratio settings. On the other hand, JPEG2000 robustly delivers the best perfor-
mance of all compression schemes; however, the ROI coding option hardly
improves over the non-ROI baseline compression technique. Obviously, the
image background does not play an important role due to its low information
content. BPG, being competitive to the ISO still image compression standards
for MC recognition, provides much worse behaviour for SIFT recognition. So
it seems that the usefulness of BPG is highly dependent on the used recognition
scheme.
● Sensor ageing: In usual sensor operation conditions, sensor ageing does not
pose a problem for finger-vein recognition accuracy. However, when increas-
ing sensor defects to surpass ‘natural’ levels, we find partially significant
dataset dependencies in the results. Thus, we recommend to experimentally
identify the most appropriate feature extraction and pre-processing schemes
given specific data sets and ageing conditions.
Acknowledgements
We acknowledge and highly appreciate the dedicated work of the students
Christian Barthel, Tamara Lipowski, Babak Maser, Simone Oblasser, and Elaheh
Yousefiamiri for generating experimental data for this chapter in the context of the
Media Data Formats Lab at the University of Salzburg.
References
[1] F. Alonso-Fernandes, J. Bigun, J. Fierrez, H. Fronthaler, K. Kollreider, and
J. Ortega-Garcia. Fingerprint recognition. In D. Petrovska-Delacretaz,
G. Chollet, and B. Dorizzi, editors, Guide to Biometric Reference Systems
and Performance Evaluation, pages 51–88. Springer-Verlag, 2009.
214 Hand-based biometrics: methods and technology
Drahansky-6990351 2 March 2018; 12:50:54
[2] D. Maltoni, D. Maio, A. K. Jain, and S. Prabhakar. Handbook of Fingerprint
Recognition (2nd Edition). Springer-Verlag, 2009.
[3] A. Noviyanto and R. Pulungan. A comparison framework for fingerprint
recognition methods. In Proceedings of the 6th SEAMS-UGM Conference
(Computer, Graph and Combinatorics), pages 601–614, 2011.
[4] R. Cappelli. Synthetic fingerprint generation. In D. Maltoni, D. Maio,
A.K. Jain, and S. Prabhakar, editors, Handbook of Fingerprint Recognition
(2nd Edition), pages 271–302. Springer-Verlag, 2009.
[5] M. Kutter and F. A. P. Petitcolas. Fair evaluation methods for image
watermarking systems. Journal of Electronic Imaging, 9(4):445–455,
October 2000.
[6] J. Hammerle-Uhl, M. Pober, and A. Uhl. Towards standardised fingerprint
matching robustness assessment: The stirmark toolkit – cross-feature type
comparisons. In Proceedings of the 14th IFIP International Conference on
Communications and Multimedia Security (CMS’13), volume 8099 of
Springer Lecture Notes on Computer Science, pages 3–17, Magdeburg,
Germany, September 2013.
[7] J. Hammerle-Uhl, M. Pober, and A. Uhl. Towards standardised fingerprint
matching robustness assessment: The stirmark toolkit – cross-database
comparisons with minutiae-based matching. In Proceedings of the 1st ACM
Workshop on Information Hiding and Multimedia Security (IH&MMSec’13),
pages 111–116, Montpellier, France, June 2013.
[8] C. Kauba and A. Uhl. Fingerprint recognition under the influence of sensor
ageing. In Proceedings of the 4th International Workshop on Biometrics and
Forensics (IWBF’16), pages 1–6, Limassol, Cyprus, 2016.
[9] C. Kauba and A. Uhl. Robustness evaluation of hand vein recognition sys-
tems. In Proceedings of the International Conference of the Biometrics
Special Interest Group (BIOSIG’15), pages 1–8, Darmstadt, Germany, 2015.
[10] C. Kauba and A. Uhl. Sensor ageing impact on finger-vein recognition. In
Proceedings of the 8th IAPR/IEEE International Conference on Biometrics
(ICB’15), pages 1–8, Phuket, Thailand, May 2015.
[11] V. Ablinger, C. Zenz, J. Hammerle-Uhl, and A. Uhl. Compression standards
in fingervein recognition. In Proceedings of the 9th IAPR/IEEE Interna-
tional Conference on Biometrics (ICB’16), pages 1–7, 2016.
[12] E. C. Lee, H. C. Lee, and K. R. Park. Finger vein recognition using
minutia-based alignment and local binary pattern-based feature extraction.
International Journal of Imaging Systems and Technology, 19(3):179–186,
2009.
[13] B. Huang, Y. Dai, R. Li, D. Tang, and W. Li. Finger-vein authentication based
on wide line detector and pattern normalization. In Pattern Recognition (ICPR),
2010 20th International Conference on, pages 1269–1272. IEEE, 2010.
[14] K. Zuiderveld. Contrast limited adaptive histogram equalization. In P. S.
Heckbert, editor, Graphics Gems IV, pages 474–485. Morgan Kaufmann, 1994.
[15] J. Zhao, H. Tian, W. Xu, and X. Li. A new approach to hand vein image
enhancement. In Intelligent Computation Technology and Automation, 2009.
Robustness of finger-vein recognition 215
Drahansky-6990351 2 March 2018; 12:50:56

ICICTA’09. Second International Conference on, volume 1, pages 499–501.
IEEE, 2009.
[16] J. Zhang and J. Yang. Finger-vein image enhancement based on combination
of gray-level grouping and circular gabor filter. In Information Engineering
and Computer Science, 2009. ICIECS 2009. International Conference on,
pages 1–4. IEEE, 2009.
[17] N. Miura, A. Nagasaka, and T. Miyatake. Extraction of finger-vein patterns
using maximum curvature points in image profiles. IEICE Transactions on
Information and Systems, 90(8):1185–1194, 2007.
[18] N. Miura, A. Nagasaka, and T. Miyatake. Feature extraction of finger-vein
patterns based on repeated line tracking and its application to personal
identification. Machine Vision and Applications, 15(4):194–203, 2004.
[19] D. G. Lowe. Object recognition from local scale-invariant features. In
Proceedings of the Seventh IEEE International Conference on Computer
Vision (CVPR’99), volume 2, pages 1150–1157. IEEE, 1999.
[20] C. Kauba, J. Reissig, and A. Uhl. Pre-processing cascades and fusion in
finger vein recognition. In Proceedings of the International Conference of
the Biometrics Special Interest Group (BIOSIG’14), Darmstadt, Germany,
September 2014.
[21] B. T. Ton and R. N. J. Veldhuis. A high quality finger vascular pattern
dataset collected using a custom designed capturing device. In International
Conference on Biometrics, ICB 2013. IEEE, 2013.
[22] Y. Yin, L. Liu, and X. Sun. SDUMLA-HMT: A multimodal biometric
database. In The 6th Chinese Conference on Biometric Recognition (CCBR
2011), volume 7098 of Springer Lecture Notes on Computer Science, pages
260–268, 2011.
[23] D. Maio, D. Maltoni, R. Cappelli, J. L. Wayman, and A. K. Jain. FVC2004:
Third fingerprint verification competition. In ICBA, volume 3072 of LNCS,
pages 1–7. Springer Verlag, 2004.
[24] F. A. P. Petitcolas, R. J. Anderson, and M. G. Kuhn. Attacks on copyright
marking systems. In D. Aucsmith, editor, Information Hiding: Second Inter-
national Workshop, volume 1525 of Lecture Notes in Computer Science, pages
218–238, Portland, OR, USA, April 1998. Springer Verlag, Berlin, Germany.
[25] J. Hammerle-Uhl, K. Raab, and A. Uhl. Watermarking as a means to
enhance biometric systems: A critical survey. In T. Filler, T. Pevny,
S. Craver, and A. Ker, editors, Proceedings of the 2011 Information Hiding
Conference (IH’11), volume 6958 of Springer LNCS, pages 238–254,
Prague, Czech Republic, 2011.
[26] J. Hammerle-Uhl, K. Raab, and A. Uhl. Experimental study on the impact of
robust watermarking on iris recognition accuracy (best paper award, appli-
cations track). In Proceedings of the 25th ACM Symposium on Applied
Computing, pages 1479–1484, 2010.
216 Hand-based biometrics: methods and technology
Drahansky-6990351 2 March 2018; 12:51:5