by: randy fields july 2010 consumer driven sales … statement. ... • haagen dazs up 16%, ben...
TRANSCRIPT

Park City Group: VisionConsumer Driven Sales Optimization™
Investor Presentation
By: Randy FieldsJuly 2010
OTCBB: PCYGwww.parkcitygroup.com
2
Forward-Looking StatementStatements in this presentation that relate to Park City Group's future plans, objectives,expectations, performance, events and the like are "forward-looking statements" withinthe meaning of the Private Securities Litigation Reform Act of 1995 and the SecuritiesExchange Act of 1934. Future events, risks and uncertainties, individually or in theaggregate, could cause actual results to differ materially from those expressed orimplied in these statements. Those factors could include changes in economicconditions that may change demand for the Company's products and services andother factors discussed in the "forward-looking information" section and the "risk factor"section of the management's discussion and analysis included in the Company's reporton Form 10-K and 10-Q or current reports on Form 8-K filed with the Securities andExchange Commission. This presentation is comprised of interrelated information thatmust be interpreted in the context of all of the information provided and care should beexercised not to consider portions of this presentation out of context. Park City Groupuses paid services of investor relations organizations to promote the Company to theinvestment community. Investments in any company should be considered speculativeand prior to acquisition, should be thoroughly researched. Park City Group does notintend to update these forward-looking statements prior to announcement of quarterlyor annual results.
Our Business
Park City Group is a Software-as-a-Service (“SaaS”) provider that brings unique visibility to the consumer goods supply chain, delivering actionable information that ensures product is on the shelf when the consumer expects it. Our service increases our customers’ sales and profitability while enabling lower inventory levels for both retailers and their suppliers.
3
2010 Anticipated Performance
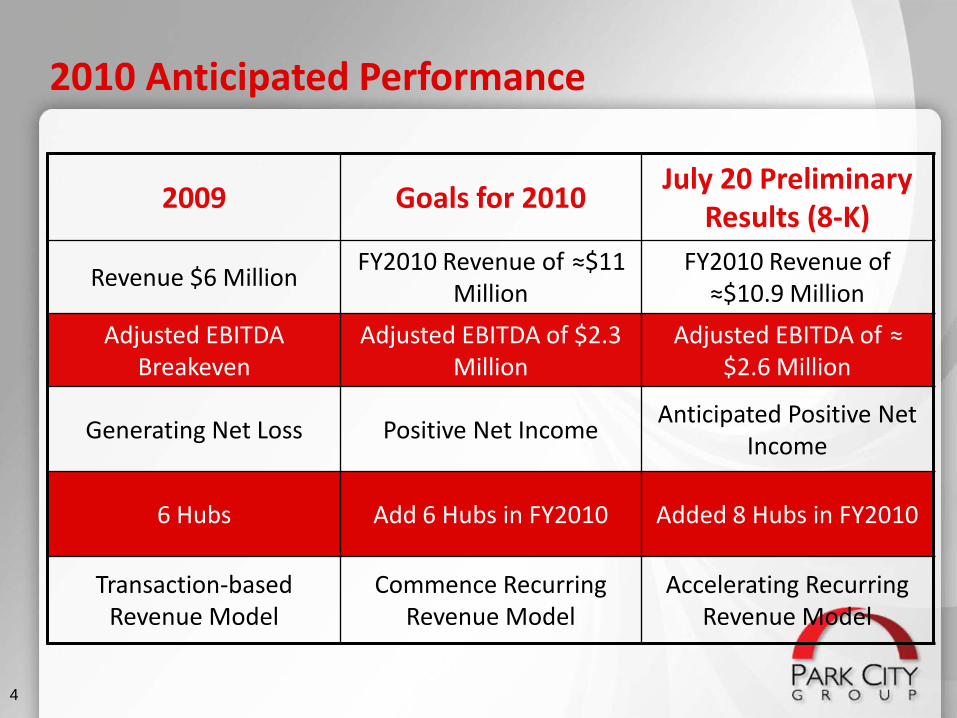
2009 Goals for 2010 July 20 Preliminary Results (8-K)
Revenue $6 Million FY2010 Revenue of ≈$11 Million
FY2010 Revenue of ≈$10.9 Million
Adjusted EBITDA Breakeven
Adjusted EBITDA of $2.3 Million
Adjusted EBITDA of ≈ $2.6 Million
Generating Net Loss Positive Net Income Anticipated Positive Net Income
6 Hubs Add 6 Hubs in FY2010 Added 8 Hubs in FY2010
Transaction-based Revenue Model
Commence Recurring Revenue Model
Accelerating Recurring Revenue Model
4
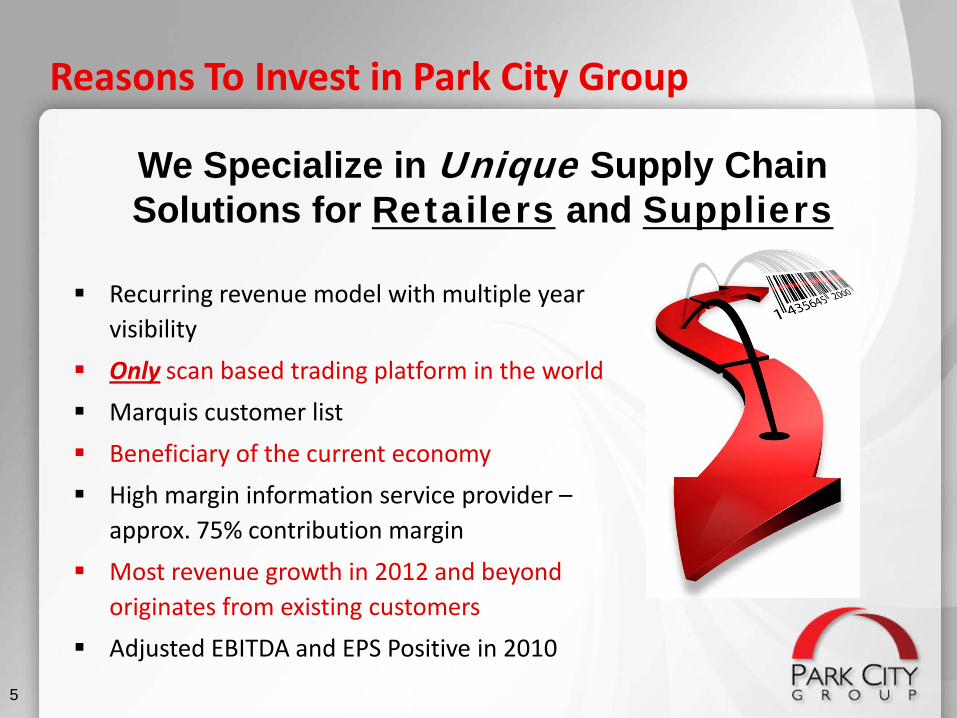
We Specialize in Unique Supply Chain Solutions for Retailers and Suppliers
Reasons To Invest in Park City Group
Recurring revenue model with multiple year visibility
Only scan based trading platform in the world Marquis customer list Beneficiary of the current economy High margin information service provider –
approx. 75% contribution margin Most revenue growth in 2012 and beyond
originates from existing customers Adjusted EBITDA and EPS Positive in 2010
5
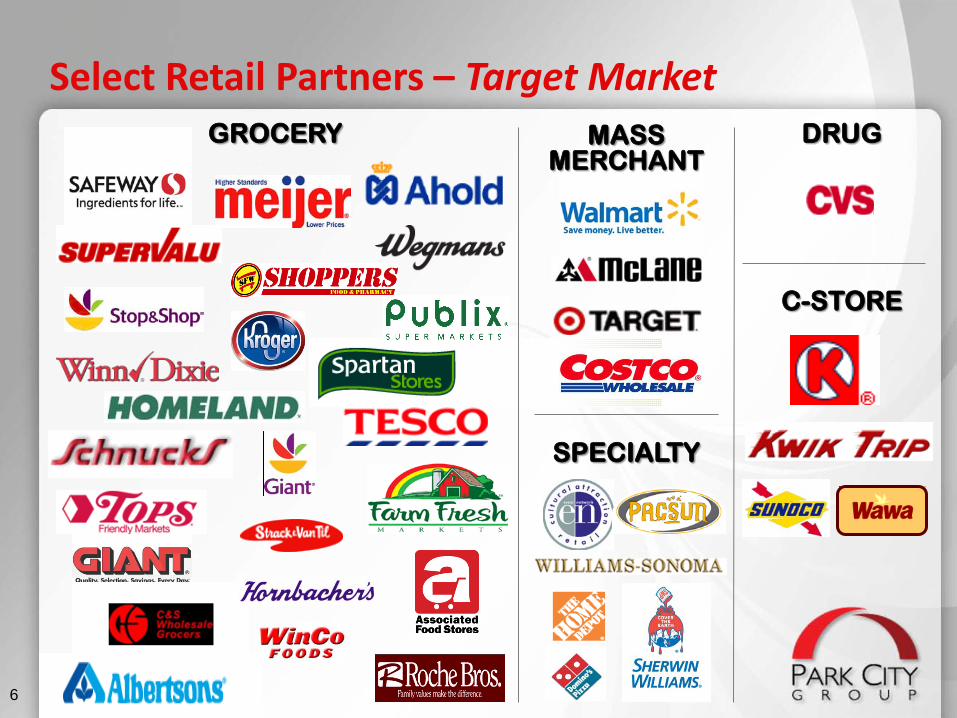
Select Retail Partners – Target MarketGROCERY DRUG
C-STORE
MASS MERCHANT
SPECIALTY
6
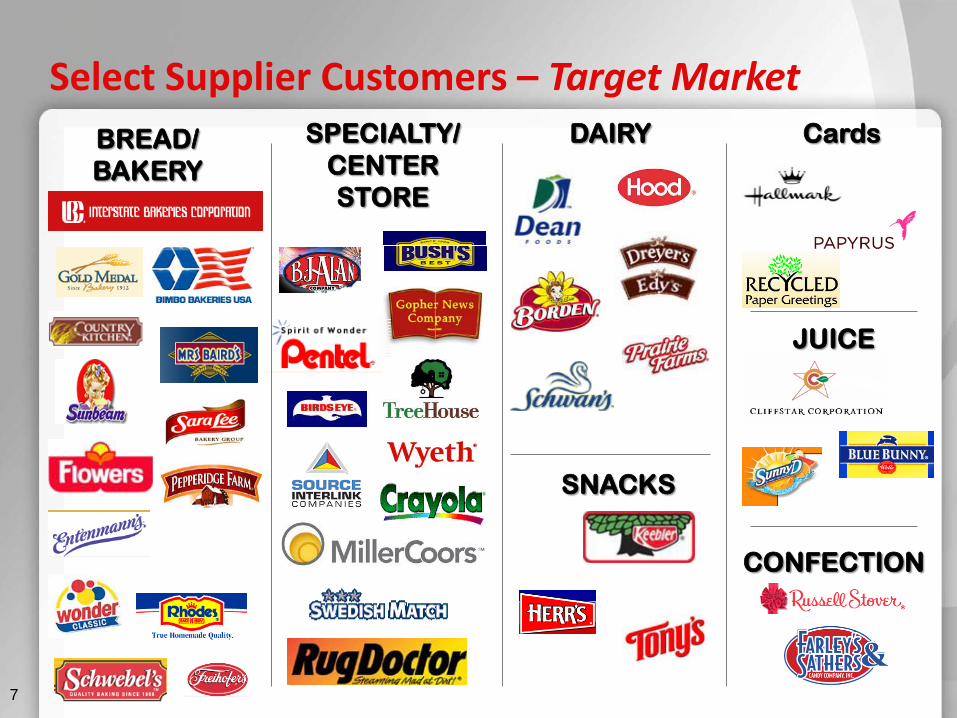
BREAD/BAKERY
Cards
JUICE
DAIRY
SNACKS
SPECIALTY/CENTER STORE
CONFECTION
Select Supplier Customers – Target Market
7
Randy Fields, Chairman & CEO - Co-founder, Mrs. Fields Cookies
Robert Allen – former CEO of Southern Belle Dairy and EVP of Borden, Inc.
Peter Brennan – private brand authority and Vice Chairman of Daymon Worldwide
James Gillis - Co-CEO of Source Interlink Companies, Inc., a marketing and fulfillment company of entertainment products
Bob Hermanns – Director of Food Industry Programs at the University of Southern California and former CEO of Associated Grocers
Manly Molpus – President of The Molpus Advisory Group and former CEO of Grocery Manufacturers Association
Richard Krause –CEO of New England Confectionery Company
Impactful Board of Directors
Industry Experts & Access to Customers
8
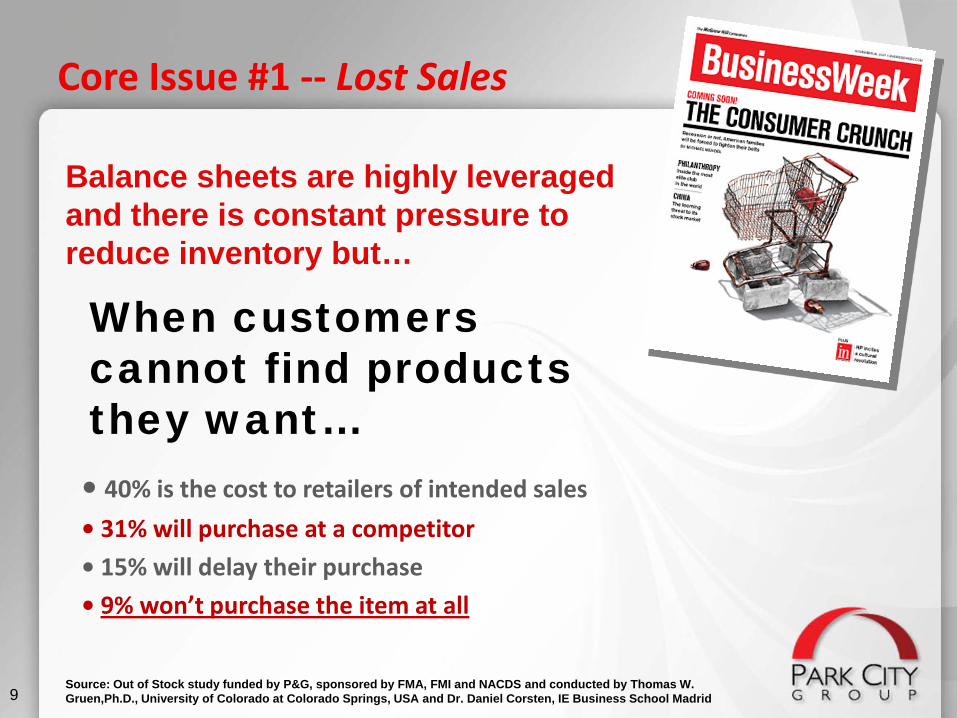
Core Issue #1 -- Lost Sales
• 40% is the cost to retailers of intended sales• 31% will purchase at a competitor• 15% will delay their purchase• 9% won’t purchase the item at all
Source: Out of Stock study funded by P&G, sponsored by FMA, FMI and NACDS and conducted by Thomas W. Gruen,Ph.D., University of Colorado at Colorado Springs, USA and Dr. Daniel Corsten, IE Business School Madrid
When customers cannot find products they want…
9
Balance sheets are highly leveraged and there is constant pressure to reduce inventory but…
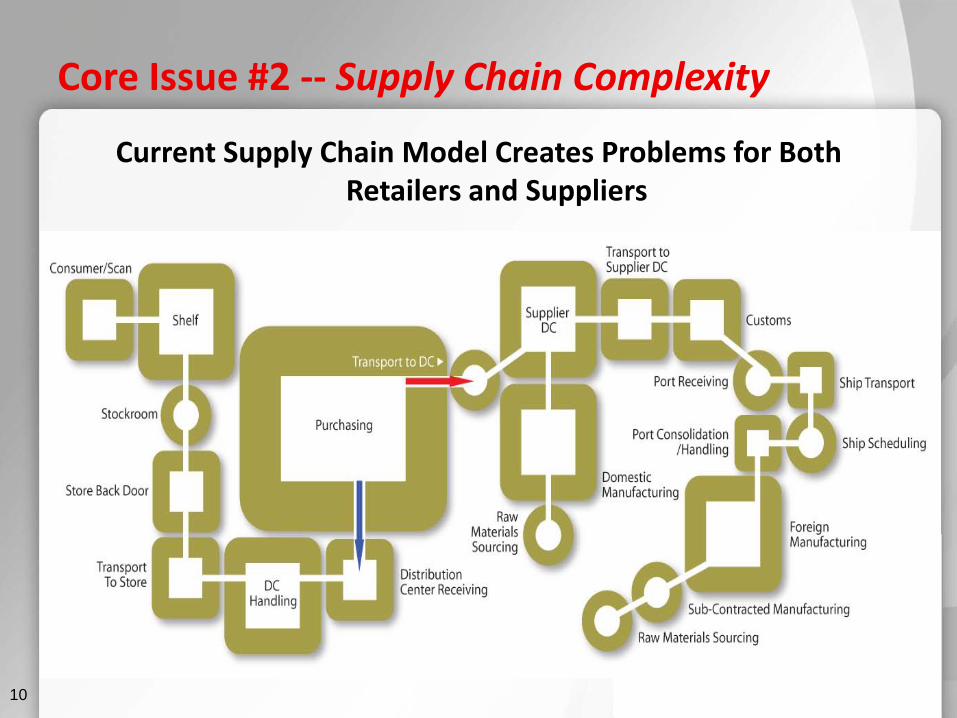
Core Issue #2 -- Supply Chain Complexity
Current Supply Chain Model Creates Problems for Both Retailers and Suppliers
10
11
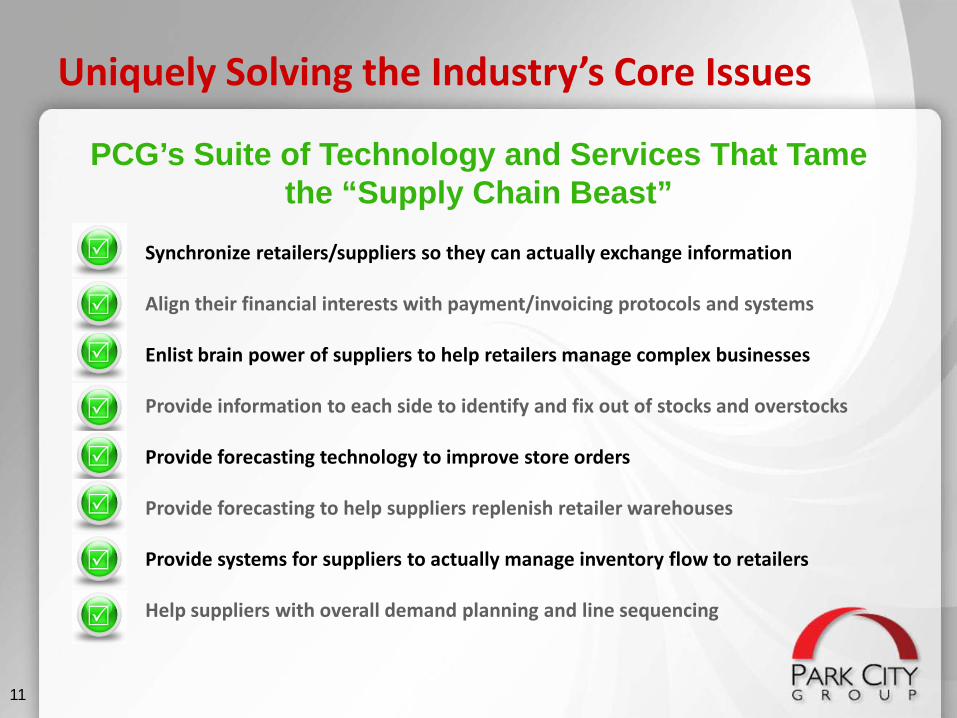
Uniquely Solving the Industry’s Core Issues
Synchronize retailers/suppliers so they can actually exchange information
Align their financial interests with payment/invoicing protocols and systems
Enlist brain power of suppliers to help retailers manage complex businesses
Provide information to each side to identify and fix out of stocks and overstocks
Provide forecasting technology to improve store orders
Provide forecasting to help suppliers replenish retailer warehouses
Provide systems for suppliers to actually manage inventory flow to retailers
Help suppliers with overall demand planning and line sequencing
PCG’s Suite of Technology and Services That Tame the “Supply Chain Beast”
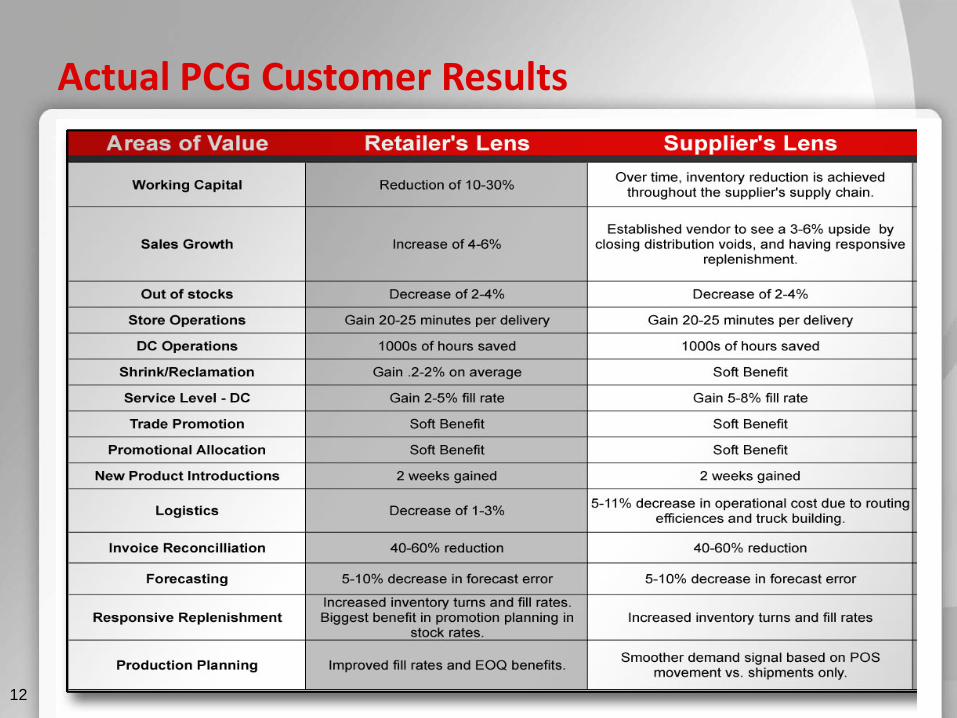
Actual PCG Customer Results
12
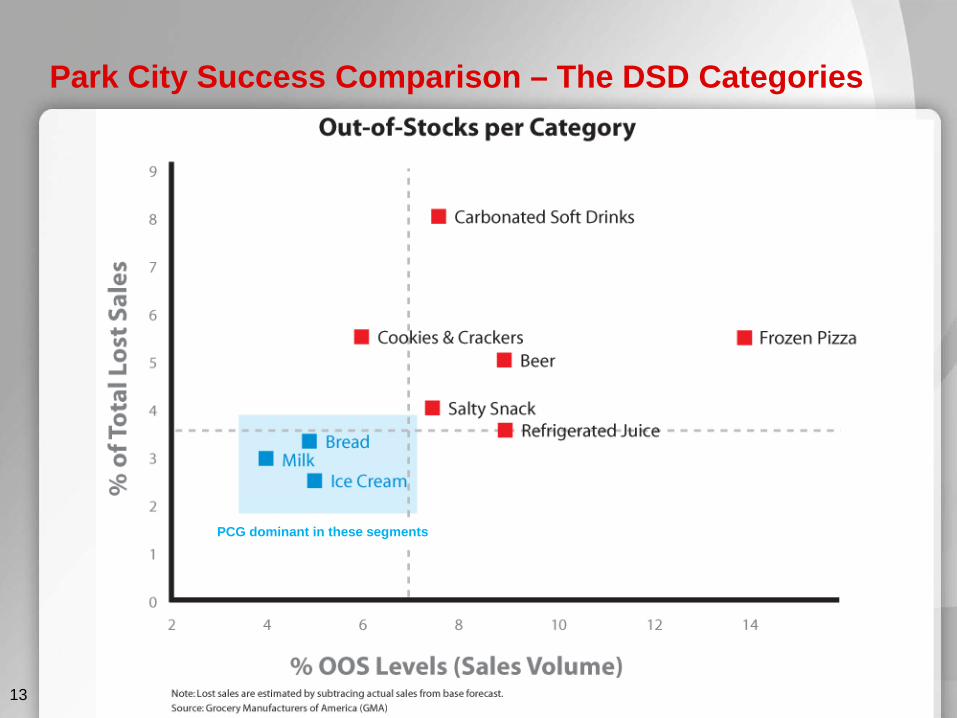
Park City Success Comparison – The DSD Categories
PCG dominant in these segments
13
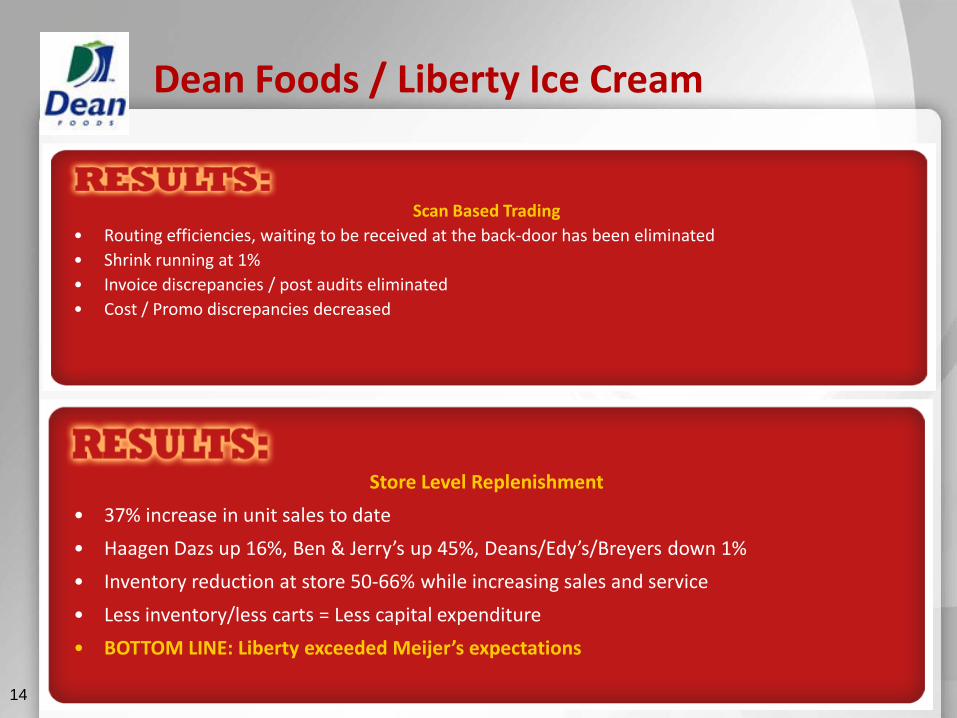
Scan Based Trading• Routing efficiencies, waiting to be received at the back-door has been eliminated• Shrink running at 1%• Invoice discrepancies / post audits eliminated• Cost / Promo discrepancies decreased
Store Level Replenishment• 37% increase in unit sales to date• Haagen Dazs up 16%, Ben & Jerry’s up 45%, Deans/Edy’s/Breyers down 1%• Inventory reduction at store 50-66% while increasing sales and service• Less inventory/less carts = Less capital expenditure• BOTTOM LINE: Liberty exceeded Meijer’s expectations
Dean Foods / Liberty Ice Cream
14
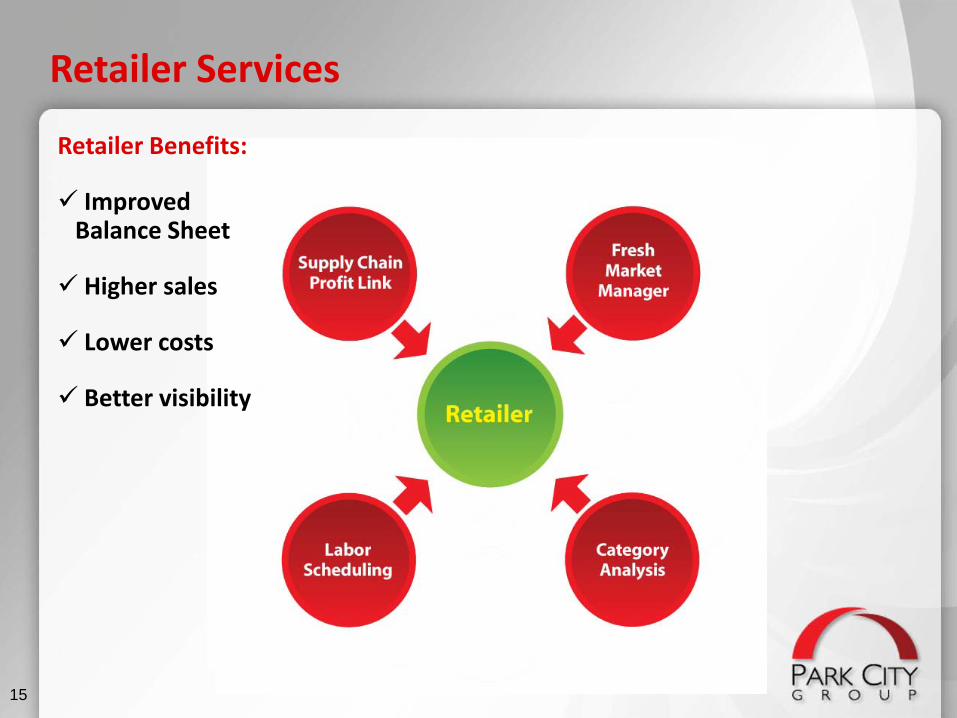
Retailer Services
Retailer Benefits:
Improved Balance Sheet
Higher sales
Lower costs
Better visibility
15
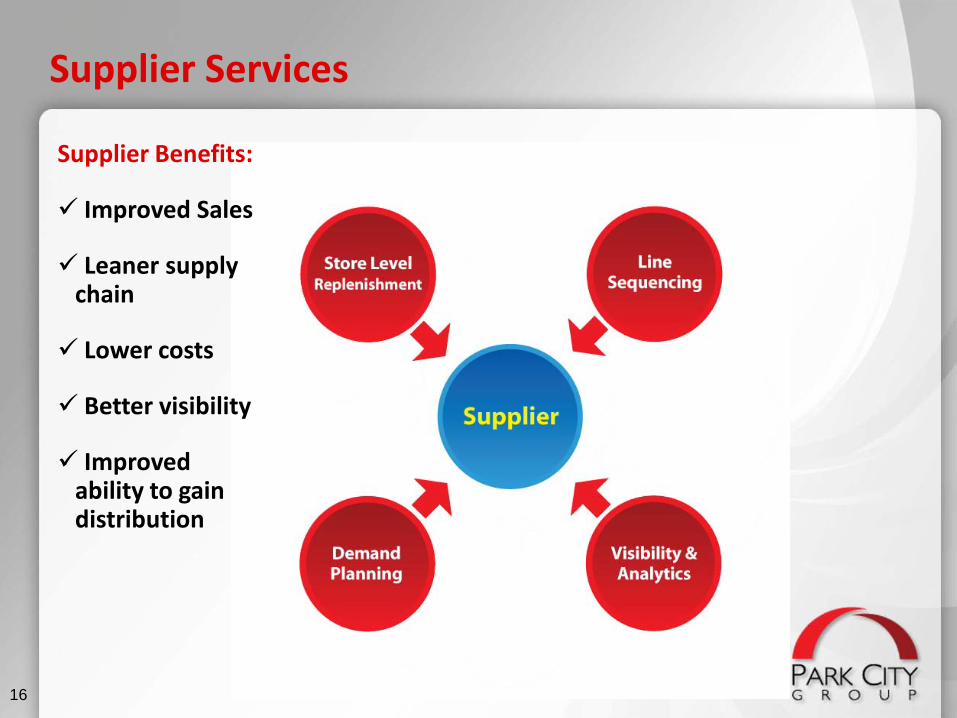
Supplier Services
Supplier Benefits:
Improved Sales
Leaner supply chain
Lower costs
Better visibility
Improved ability to gain distribution
16
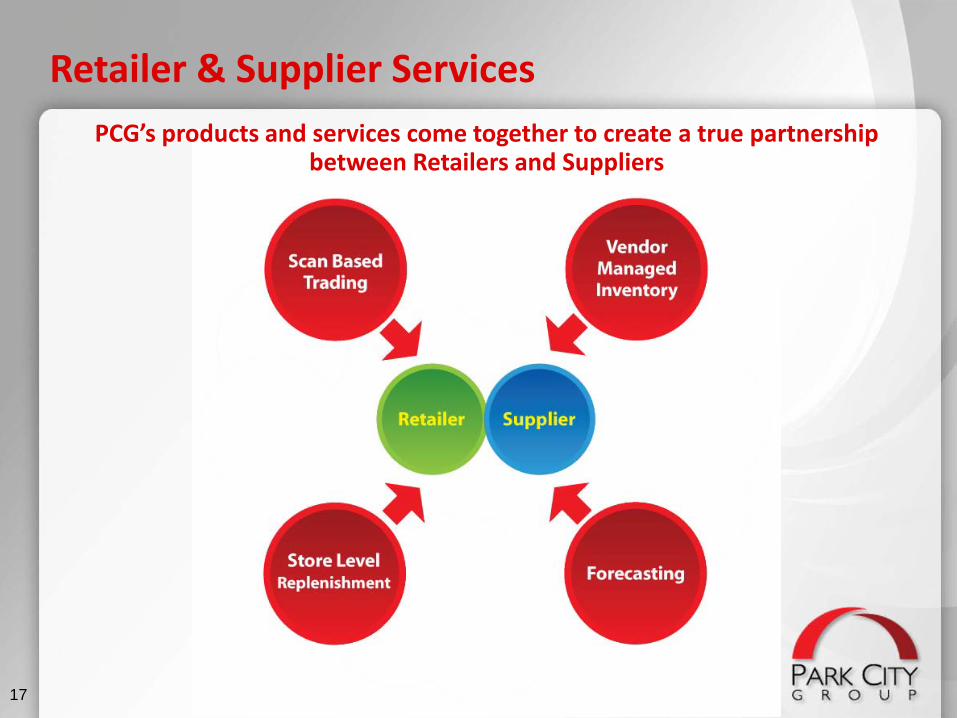
Retailer & Supplier ServicesPCG’s products and services come together to create a true partnership
between Retailers and Suppliers
17
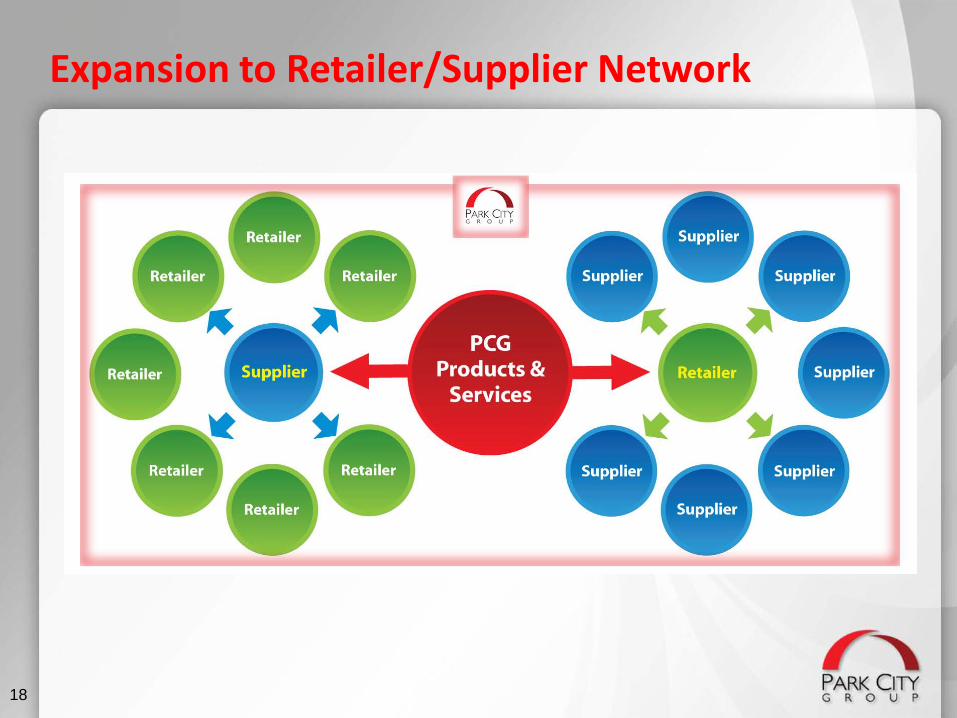
Expansion to Retailer/Supplier Network
18
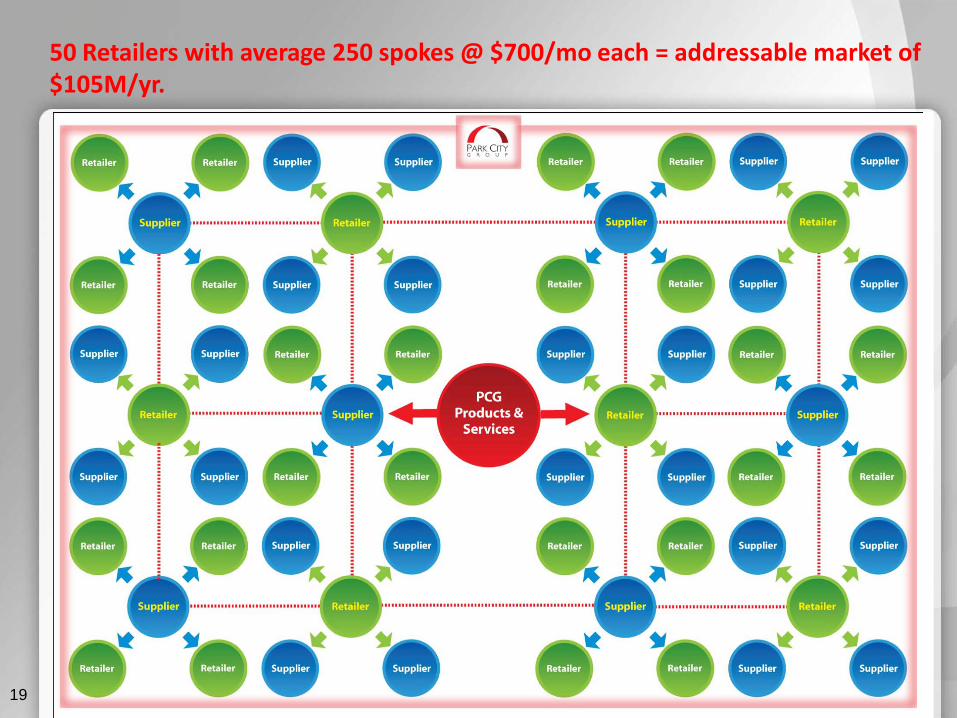
50 Retailers with average 250 spokes @ $700/mo each = addressable market of $105M/yr.
19
20
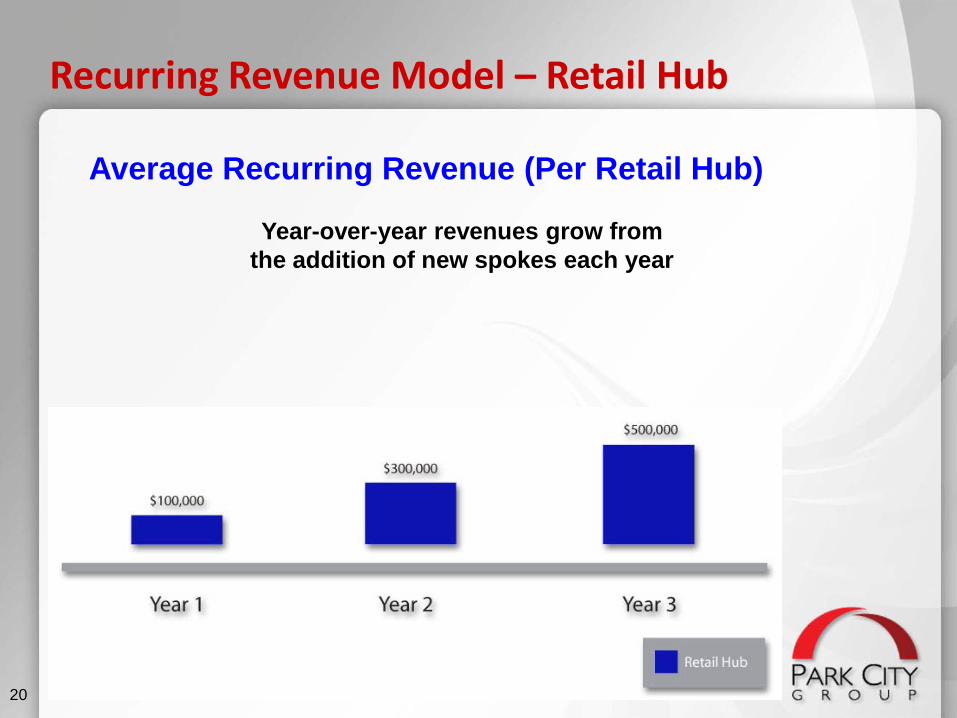
Recurring Revenue Model – Retail Hub
Average Recurring Revenue (Per Retail Hub)
Year-over-year revenues grow from the addition of new spokes each year
21
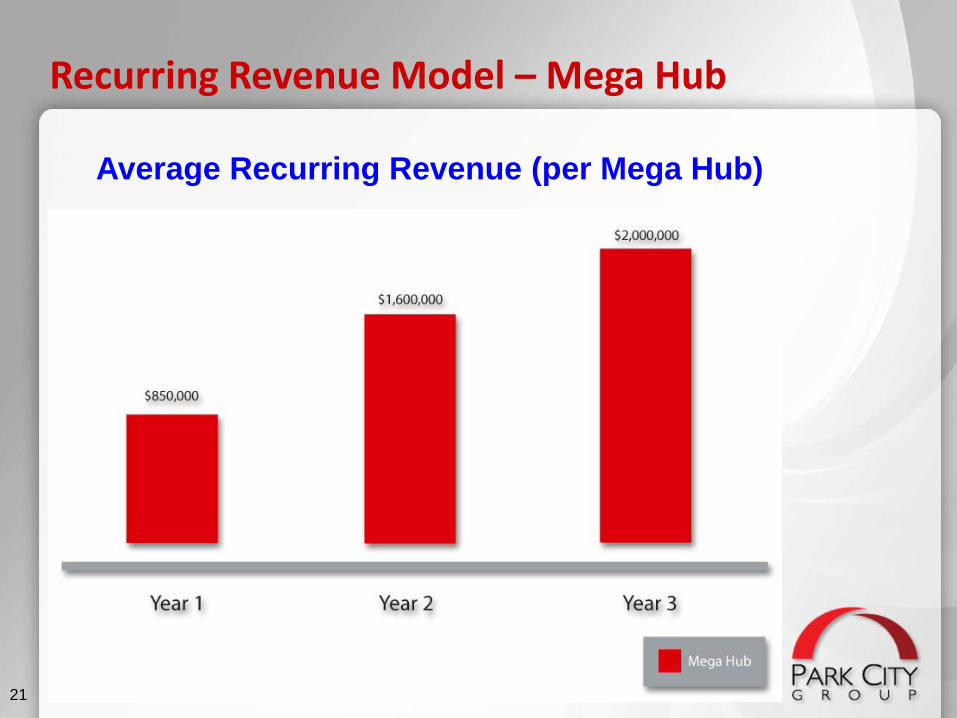
Recurring Revenue Model – Mega Hub
Average Recurring Revenue (per Mega Hub)

Financial Impact of Retail Hub Growth
3 Year Retail Hub Cumulative Growth Model
22
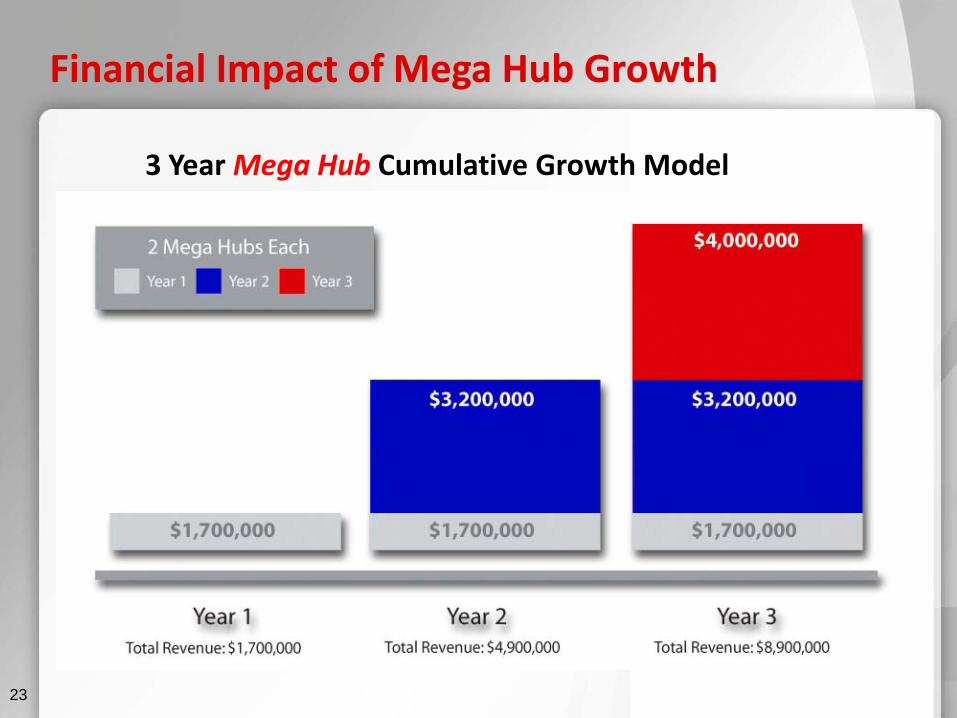
Financial Impact of Mega Hub Growth
3 Year Mega Hub Cumulative Growth Model
23
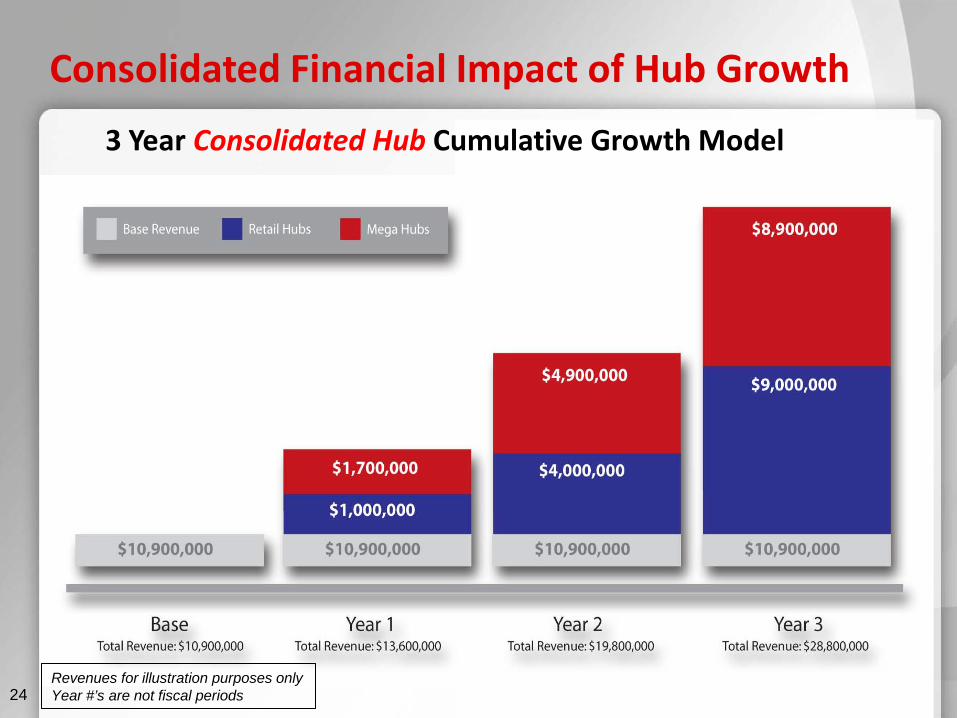
Consolidated Financial Impact of Hub Growth
3 Year Consolidated Hub Cumulative Growth Model
Revenues for illustration purposes onlyYear #’s are not fiscal periods24
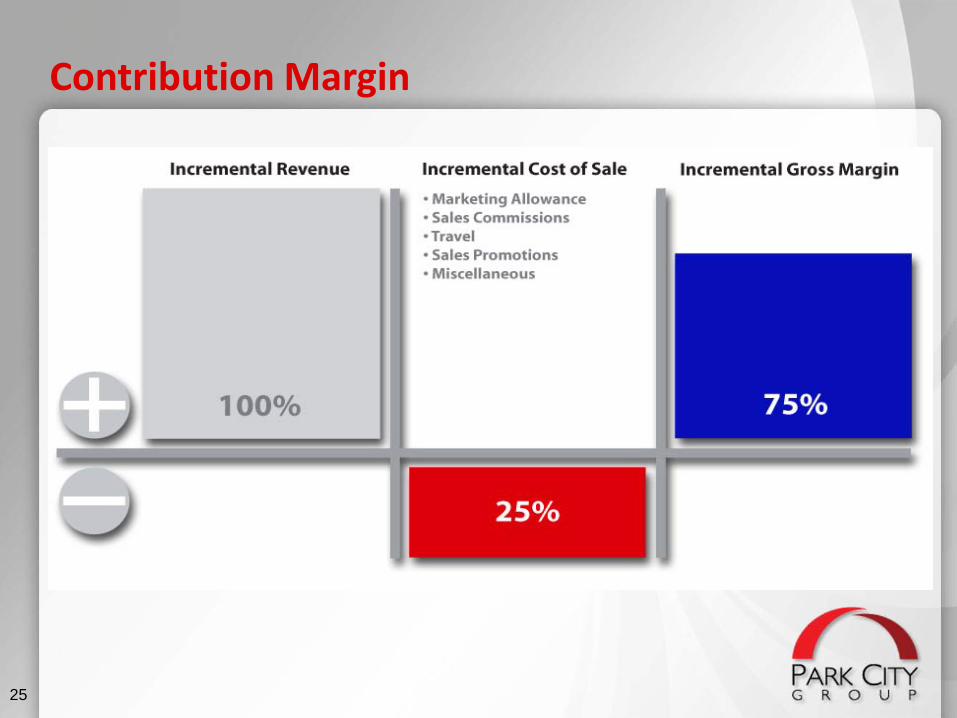
Contribution Margin
25
26
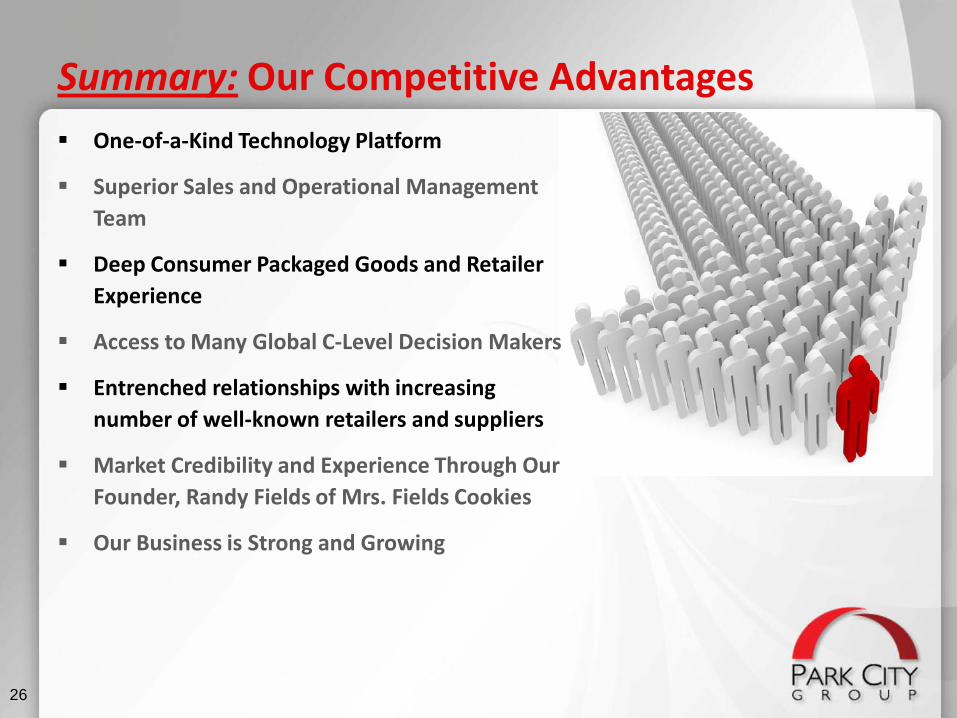
One-of-a-Kind Technology Platform
Superior Sales and Operational Management Team
Deep Consumer Packaged Goods and Retailer Experience
Access to Many Global C-Level Decision Makers
Entrenched relationships with increasing number of well-known retailers and suppliers
Market Credibility and Experience Through Our Founder, Randy Fields of Mrs. Fields Cookies
Our Business is Strong and Growing
Summary: Our Competitive Advantages
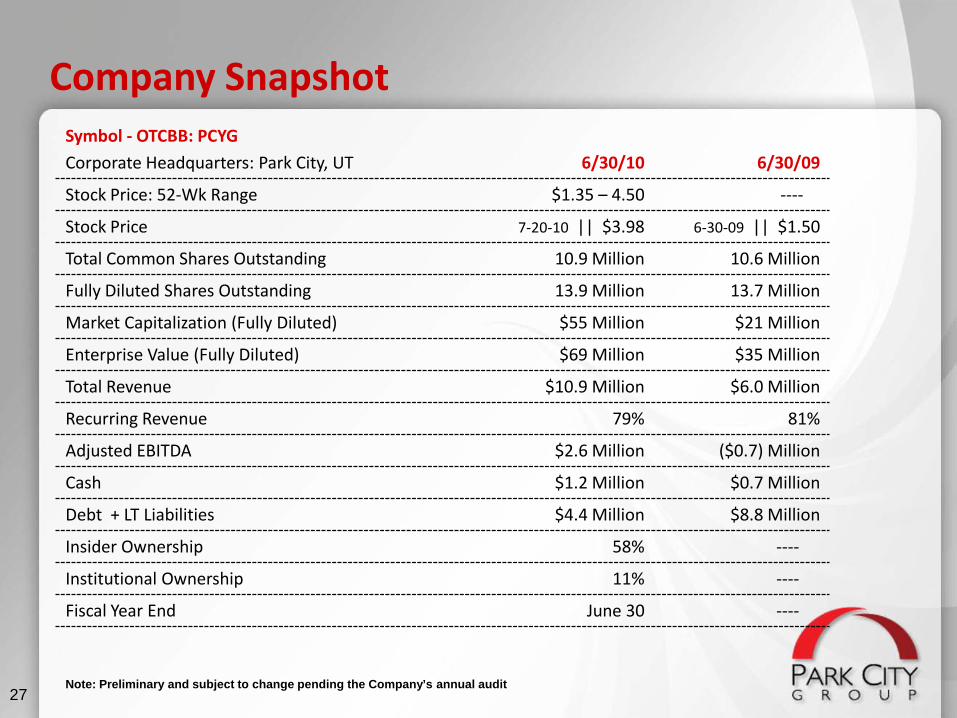
Company SnapshotSymbol - OTCBB: PCYGCorporate Headquarters: Park City, UT 6/30/10 6/30/09
Stock Price: 52-Wk Range $1.35 – 4.50 ----
Stock Price 7-20-10 || $3.98 6-30-09 || $1.50
Total Common Shares Outstanding 10.9 Million 10.6 Million
Fully Diluted Shares Outstanding 13.9 Million 13.7 Million
Market Capitalization (Fully Diluted) $55 Million $21 Million
Enterprise Value (Fully Diluted) $69 Million $35 Million
Total Revenue $10.9 Million $6.0 Million
Recurring Revenue 79% 81%
Adjusted EBITDA $2.6 Million ($0.7) Million
Cash $1.2 Million $0.7 Million
Debt + LT Liabilities $4.4 Million $8.8 Million
Insider Ownership 58% ----
Institutional Ownership 11% ----
Fiscal Year End June 30 ----
27Note: Preliminary and subject to change pending the Company’s annual audit

Park City Group: VisionConsumer Driven Sales Optimization™
Thank You
OTCBB: PCYGwww.parkcitygroup.com