by multi-frequency epr spectroscopy determination of helix ... file4 2.2 peldor at x-, q- and g-band...
TRANSCRIPT
1
Determination of helix orientations in a flexible DNA by multi-frequency EPR spectroscopy
C. M. Grytz,a,b,† S. Kazemi,b,c,d,† A. Marko,a,b P. Cekan,e P. Güntert,b,c,f,g
S. Th. Sigurdsson*,e and T. F. Prisner*,a,b
a. Institute of Physical and Theoretical Chemistry, Goethe University, Max-von-Laue-Str. 7, 60438 Frankfurt am Main, Germany.
b. Center of Biomolecular Magnetic Resonance, Goethe University, Max-von-Laue-Str. 9, 60438 Frankfurt am Main, Germany.
c. Institute of Biophysical Chemistry, Goethe University, Max-von-Laue-Str. 9, 60438 Frankfurt am Main, Germany.
d. Frankfurt Institute for Advanced Studies, Ruth-Moufang-Str. 1, 60438 Frankfurt am Main, Germanye. University of Iceland, Department of Chemistry, Science Institute, Dunhaga 3, 107 Reykjavik, Icelandf.Laboratory of Physical Chemistry, ETH Zürich, Vladimir-Prelog-Weg 2, 8093 Zürich, Switzerlandg. Graduate School of Science, Tokyo Metropolitan University, 1-1 Minami-ohsawa, Hachioji, Tokyo 192-0397, Japan
Table of Contents
1 Thermal denaturation experiments 22 Experimental details 22.1 Continuous-wave EPR at X-band frequencies .................................................................22.2 PELDOR at X-, Q- and G-band frequencies....................................................................4
2.2.1 Reproducibility of the modulation depth 53 Original experimental PELDOR time traces 74 Data analysis with respect to distance distribution 85 Simulations and fit to the experimental PELDOR data 85.1 PELDOR data simulation.................................................................................................85.2 Details to structure calculations .......................................................................................85.3 Details about the EPR/NMR-based approach for ensemble determination .....................95.4 Determination of a structural ensemble using a geometric model and PELDOR data..115.5 Calculation of the helix axis...........................................................................................145.6 Prediction of high-field PELDOR data ..........................................................................145.7 Simultaneous fit to all experimental PELDOR data ......................................................166 References 18
Electronic Supplementary Material (ESI) for Physical Chemistry Chemical Physics.This journal is © the Owner Societies 2017
2
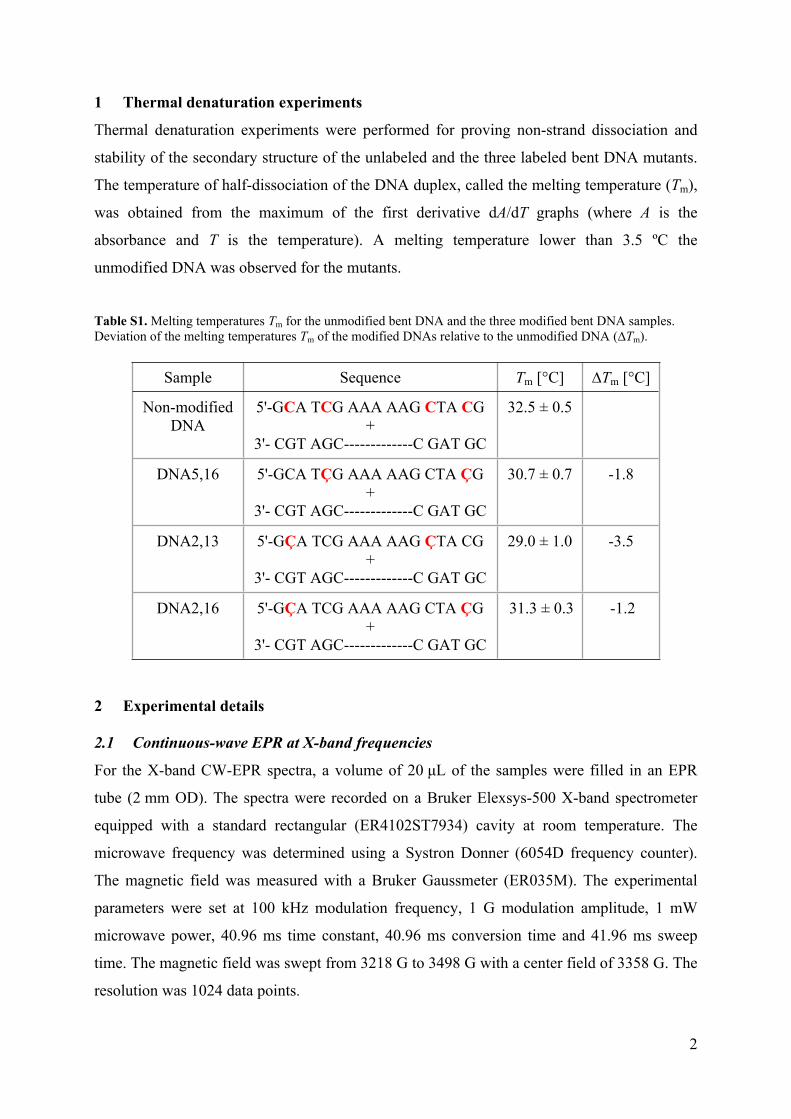
1 Thermal denaturation experiments
Thermal denaturation experiments were performed for proving non-strand dissociation and
stability of the secondary structure of the unlabeled and the three labeled bent DNA mutants.
The temperature of half-dissociation of the DNA duplex, called the melting temperature (Tm),
was obtained from the maximum of the first derivative dA/dT graphs (where A is the
absorbance and T is the temperature). A melting temperature lower than 3.5 ºC the
unmodified DNA was observed for the mutants.
Table S1. Melting temperatures Tm for the unmodified bent DNA and the three modified bent DNA samples. Deviation of the melting temperatures Tm of the modified DNAs relative to the unmodified DNA (∆Tm).
Sample Sequence Tm [°C] ∆Tm [°C]
Non-modified DNA
5'-GCA TCG AAA AAG CTA CG+
3'- CGT AGC-------------C GAT GC
32.5 ± 0.5
DNA5,16 5'-GCA TÇG AAA AAG CTA ÇG+
3'- CGT AGC-------------C GAT GC
30.7 ± 0.7 -1.8
DNA2,13 5'-GÇA TCG AAA AAG ÇTA CG+
3'- CGT AGC-------------C GAT GC
29.0 ± 1.0 -3.5
DNA2,16 5'-GÇA TCG AAA AAG CTA ÇG+
3'- CGT AGC-------------C GAT GC
31.3 ± 0.3 -1.2
2 Experimental details
2.1 Continuous-wave EPR at X-band frequencies
For the X-band CW-EPR spectra, a volume of 20 μL of the samples were filled in an EPR
tube (2 mm OD). The spectra were recorded on a Bruker Elexsys-500 X-band spectrometer
equipped with a standard rectangular (ER4102ST7934) cavity at room temperature. The
microwave frequency was determined using a Systron Donner (6054D frequency counter).
The magnetic field was measured with a Bruker Gaussmeter (ER035M). The experimental
parameters were set at 100 kHz modulation frequency, 1 G modulation amplitude, 1 mW
microwave power, 40.96 ms time constant, 40.96 ms conversion time and 41.96 ms sweep
time. The magnetic field was swept from 3218 G to 3498 G with a center field of 3358 G. The
resolution was 1024 data points.
3
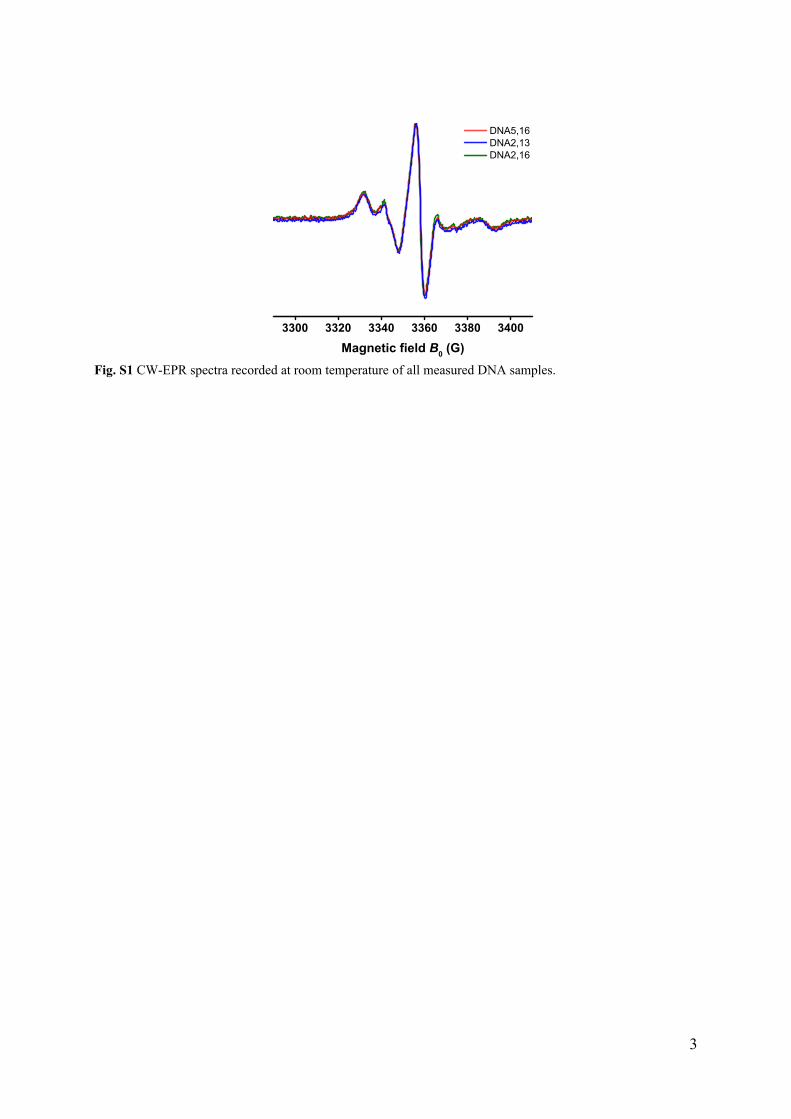
3300 3320 3340 3360 3380 3400Magnetic field B0 (G)
DNA5,16 DNA2,13 DNA2,16
Fig. S1 CW-EPR spectra recorded at room temperature of all measured DNA samples.

4
2.2 PELDOR at X-, Q- and G-band frequencies
Fig. S2 Echo-detected field swept EPR spectra of Ç-spin labeled bent DNA recorded at 40 K and corresponding 14N stick diagram for (A) X-, (B) Q- and (C) G-band frequencies, respectively. Arrows indicate pump and probe frequencies with varied detection positions Δν ranging from 40 to 90 MHz at X-band frequencies. At Q-band frequencies the pump pulse was set to the maximum absorption position and the probe pulses 50 and 90 MHz below. At G-band frequencies, arrows mark the detection positions. The pump frequency was set at a constant offset Δν of 60 MHz below or above (positions G and H marked with *) the detection frequency. The magnetic field was not calibrated.

5
2.2.1 Reproducibility of the modulation depth In order to demonstrate the variance in the modulation depth from experiment to experiment
of the PELDOR time traces recorded at G-band frequencies, we obtained experimental
independently recorded PELDOR time traces. For each measurement the same experimental
parameters were used. Two different positions were measured: First, the detection was set at
the maximum of the nitroxide spectra (position D in Fig. S2C, Fig. S3A). Second, the
magnetic field position was set half way between the low field edge and the maximum of the
EPR spectra (position C in Fig. S2C, Fig. S3B). As can be seen in Fig. S3 the shapes of the
PELDOR time traces are identical within the signal to noise whereas the modulation depths
vary from experiment to experiment.
Fig. S3 (A) Left: Experimental PELDOR time traces measured at the maximum of the nitroxide spectra (position D in Fig. S2) and the corresponding background function of DNA2,13. Right: Experimental background-divided PELDOR time traces. (B) Left: Experimental PELDOR time traces measured -30 G away from the maximum of the nitroxide spectra (position C in Fig. S2) and the corresponding background function of DNA2,13. Right: Experimental background-divided PELDOR time traces.
For the calculation of the reproducibility of the modulation depth parameter λ, we used the
Student’s t-distribution. The t-coefficient tα,υ with the degree of freedom υ = n – 1 (n number
of measurement values) and the probability 1 – α, that the true measurement value will be less
than tα,υ, can be taken from a t-distribution quantiles table. In this study, we repeated the

6
measurements 3 times resulting in υ = 2. The errors were calculated with a 95% confidence.
Therefore, the t-coefficient was t0.95,2 = 2.92. The confidence interval for the mean modulation
depth parameter λ was calculated by using the formula . At 95% confidence, the ,t n
true modulation depth parameter λ is expected to be within λ1 = 0.005 ± 0.0037 (74%)
(Fig. S3A) and λ2 = 0.0049 ± 0.0019 (39%) (Fig. S3B).
Table S2. Error estimation of the modulation depth parameter. Mean value and standard deviation with its percentage amount, mean value and standard deviation under use of a Student’s t-distribution.time traces
recorded at (%)
0.95,2 3t (%)3
0.95,2 3St
position D in
Fig. S2C
0.0050 ± 0.0022 44 0.0050 ± 0.0037 74
position C in
Fig. S2C
0.0049 ± 0.0011 22 0.0049 ± 0.0019 39
In summary, the reproducibility of the modulation depth is within 39–74% with a
confidence of 95% using Student’s t-distribution (further information can be found in the
Supporting Information, Fig. S3). This is due to variations in the experimental conditions. The
B1-Field was not always consistent and reproducible.

7
3 Original experimental PELDOR time traces
Fig. S4 Experimental PELDOR time traces measured at frequency offsets Δν from 40 to 90 MHz at (A) X-, (B) Q- and (C) G-band frequencies for all spin-labeled DNAs. The background function is shown in red. The field positions A-H are marked in Fig. S2C.
8
4 Data analysis with respect to distance distribution
For distance determinations, a single time trace with reduced influence of orientation effects
was generated by summing up the X-band PELDOR time traces over all measured frequency
offsets Δν.1-2 Prior to summing up, an exponential background was fitted to the last 2/3 of the
PELDOR time traces and the PELDOR trace was then divided by this background function
using the software DeerAnalysis20113 and DeerAnalysis2013 for the time traces recorded at
X- and Q-band and at G-band frequencies, respectively. Data points at the end of the time
trace were cut off to avoid artefacts at tmax caused by the overlap between the pump pulse and
the second π-pulse of the probe-channel. Distribution functions of the distance R connecting
the two Ç spin labels for all DNA samples were obtained from the averaged time traces using
DeerAnalysis with a Tikhonov regularization4. The L-curve criterion was applied to estimate
the optimal regularization parameter α, which was set to 100.
5 Simulations and fit to the experimental PELDOR data
5.1 PELDOR data simulation
For PELDOR data simulation, the following magnetic parameters were used for both
nitroxides:
g-tensor: gxx = 2.0090, gyy = 2.0066, gzz = 2.0027
A-tensor: Axx = 5 G, Ayy = 5 G, Azz = 36 G
The line broadening was set to 4.7 G. The pulse lengths, flip angles, magnetic field positions,
pump and probe frequencies were chosen the same as in the experiment. All equations
necessary for PELDOR data simulation can be found in the following references.2, 5-7
5.2 Details to structure calculations
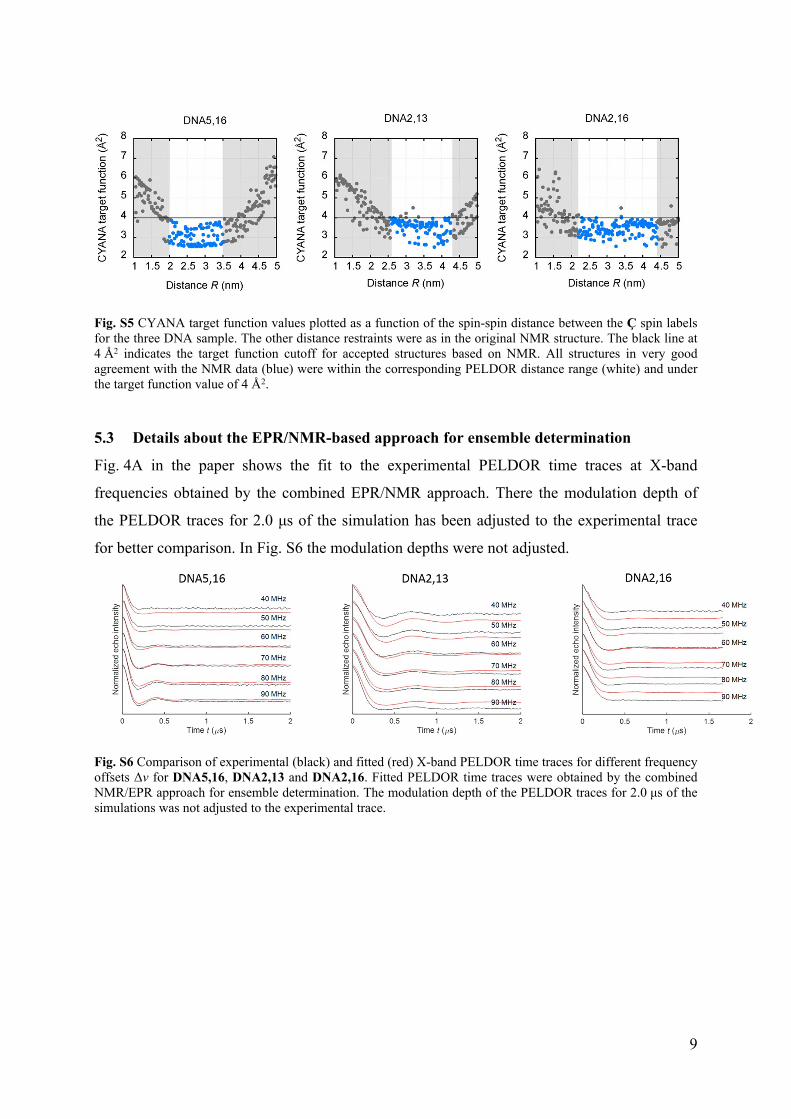
Fig. S5 shows the CYANA target function values from individual structure calculations as a
function of the systematically varied PELDOR spin-spin distance restraint. This demonstrates
that only extreme distance bounds for the PELDOR distance restraints lead to a significant
rise of the CYANA target function.
9
Fig. S5 CYANA target function values plotted as a function of the spin-spin distance between the Ç spin labels for the three DNA sample. The other distance restraints were as in the original NMR structure. The black line at 4 Å2 indicates the target function cutoff for accepted structures based on NMR. All structures in very good agreement with the NMR data (blue) were within the corresponding PELDOR distance range (white) and under the target function value of 4 Å2.
5.3 Details about the EPR/NMR-based approach for ensemble determination
Fig. 4A in the paper shows the fit to the experimental PELDOR time traces at X-band
frequencies obtained by the combined EPR/NMR approach. There the modulation depth of
the PELDOR traces for 2.0 μs of the simulation has been adjusted to the experimental trace
for better comparison. In Fig. S6 the modulation depths were not adjusted.
Fig. S6 Comparison of experimental (black) and fitted (red) X-band PELDOR time traces for different frequency offsets Δν for DNA5,16, DNA2,13 and DNA2,16. Fitted PELDOR time traces were obtained by the combined NMR/EPR approach for ensemble determination. The modulation depth of the PELDOR traces for 2.0 μs of the simulations was not adjusted to the experimental trace.
10
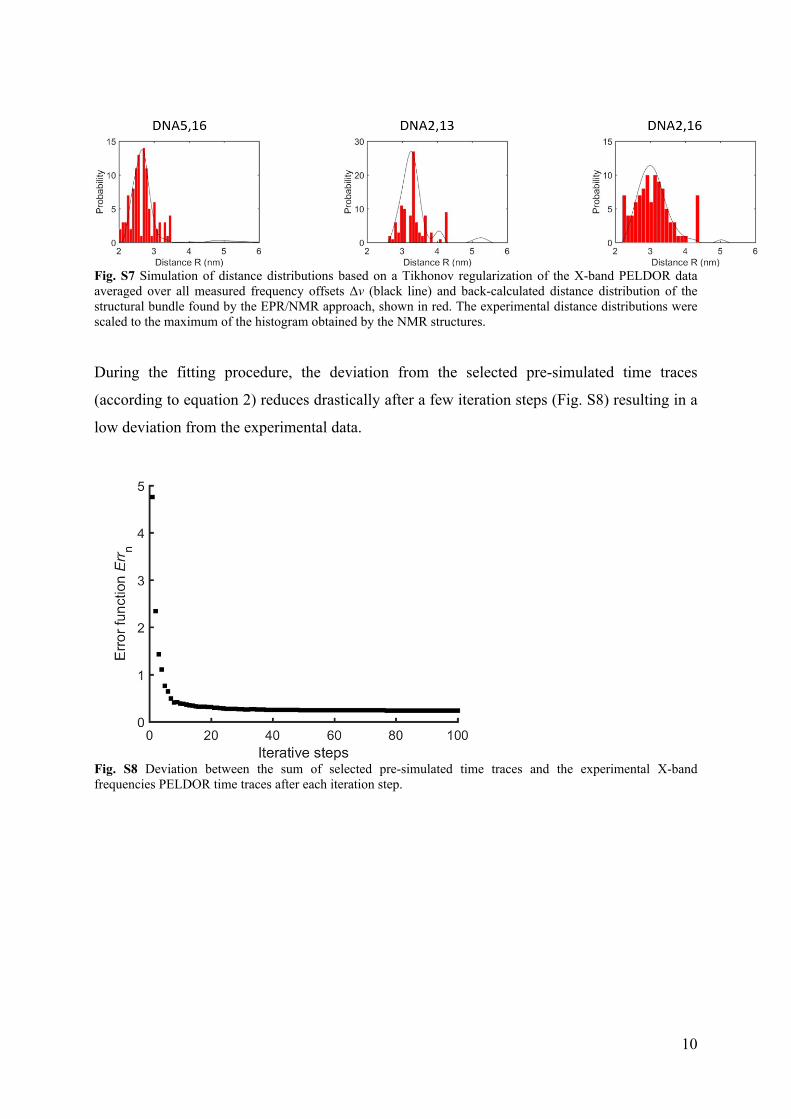
Fig. S7 Simulation of distance distributions based on a Tikhonov regularization of the X-band PELDOR data averaged over all measured frequency offsets Δν (black line) and back-calculated distance distribution of the structural bundle found by the EPR/NMR approach, shown in red. The experimental distance distributions were scaled to the maximum of the histogram obtained by the NMR structures.
During the fitting procedure, the deviation from the selected pre-simulated time traces
(according to equation 2) reduces drastically after a few iteration steps (Fig. S8) resulting in a
low deviation from the experimental data.
Fig. S8 Deviation between the sum of selected pre-simulated time traces and the experimental X-band frequencies PELDOR time traces after each iteration step.

11
5.4 Determination of a structural ensemble using a geometric model and PELDOR
data
In principle, a library of possible conformers can be generated without the NMR data.
Therefore, we compared the fitting results using the library generated with NMR data and the
library without the NMR data.
When fitting the X-band PELDOR data sets without the NMR restraints we used a simple
geometric model (Fig. S9). The model consists of two rigid helices linked by an on-axis hinge
with a variable distance from the helix. Fig. 5 shows that the conformational space obtained
by this procedure differs from the one obtained by including the NMR data despite the fact
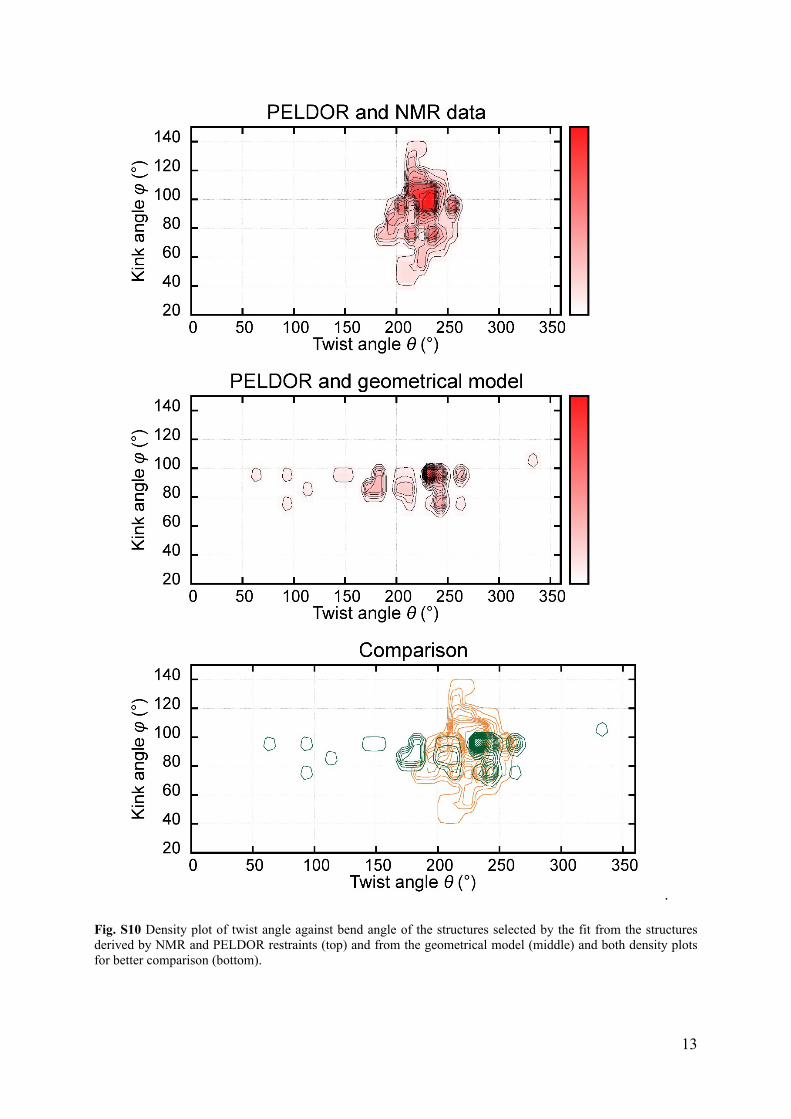
that both approaches identify the most populated conformers. Specifically, we observe
structures with twist angles (Fig. S10) below 180° when omitting the NMR data. However,
these twist angles are located outside the allowed region of the structural library (Fig. 5B).
Thus, these structures are not in agreement with the NMR data and PELDOR distance
regions, indicating that they probably contains non-native structures.
This result can be rationalized because the solution obtained with the EPR and NMR
restraints contains conformers where the two double-helical axis do not cross, in contrast to
the model with PELDOR restraints only. This is consistent with a somewhat lower quality of
the fit of the time domain PELDOR sets when the NMR data is omitted (Fig. S9). Fitting
without any additional restraints would give perfect fits but include physical impossible
arrangements between the two helices. Of course, more elaborate models of the molecule
could be used for fitting, but we believe that our approach, based on experimental data from
NMR and PELDOR is superior to such approaches.

12
Fig. S9 Experimental X-band (black) and fitted PELDOR time traces of all DNA samples. Left: Fit from the structures derived by NMR and PELDOR restraints shown without offset correction. Right: Fit from the geometrical model.
13
.
Fig. S10 Density plot of twist angle against bend angle of the structures selected by the fit from the structures derived by NMR and PELDOR restraints (top) and from the geometrical model (middle) and both density plots for better comparison (bottom).

14
5.5 Calculation of the helix axis
For the calculation of the DNA helix axis, the principal component of the positions of the
heavy atoms N2, N1 O6, N4, N3, O2, N1, N6, N3, and O4 (in PDB nomenclature) involved
in base pairing hydrogen bonds are used. For stem 1 these atoms were selected from the bases
2–6 and 124–128 and for stem 2 from the bases 12–16 and 119–123 (leaving out the terminal
base pairs). The second axis of the helix was set orthogonal to the helix axis using the
reference atom C1’ from (the arbitrary chosen) residue 4 for stem 1 and from residue 14 for
stem 2, respectively. The calculation of the kink angle φ and the twist angle θ were done as
described by Wozniak et al.8 Since the base sequence is not the same for the DNA helixes, the
twist angle θ cannot be compared with the twist angles obtained by FRET. The phase of the θ
angle depends on an arbitrarily selected reference atom defining the x-axis of the axis system
and thus is reliant on the base sequence of the considered structure (Fig. 5C).
5.6 Prediction of high-field PELDOR data
For validation of the EPR/NMR structural ensemble found by using the X-band frequencies
data, we recorded PELDOR time traces at Q-band and G-band frequencies and predicted
these data using the EPR/NMR structural ensemble (Fig. S11 and Fig. S12, respectively).
Fig. S11 (A) Experimental Q-Band PELDOR time traces (black) and simulated Q-Band PELDOR time traces from the structures derived by NMR and PELDOR restraints of all DNA samples (blue). The modulation depth of the PELDOR traces of the simulation has been adjusted to the experimental trace for better comparison (red). (B) Distance distributions based on a Tikhonov regularization of the Q-band PELDOR data averaged over all measured frequency offsets Δν.

15
Fig. S12 Experimental G-Band PELDOR time traces (black) and simulated G-Band PELDOR time traces from the structures derived by NMR and PELDOR restraints of DNA2,13 and DNA2,16 (blue). The modulation depth of the PELDOR traces of the simulation has been adjusted to the experimental trace for better comparison (red). The field positions A-H are marked in Figure S2C.

16
5.7 Simultaneous fit to all experimental PELDOR data
To test the accuracy of the results, we used simultaneously all our PELDOR time traces
recorded at several magnetic field strengths (at X-, Q-, and G-band frequencies) for an overall
fit. The reproducibility of the modulation depth at G-band frequencies is within 39-74%
(Fig. S3). Therefore, the modulation depth was completely neglected during the fitting
process. Due to the small modulation depth of time traces recorded at G-band frequencies
(maximal 5%) in comparison to X-band (about 40%), or Q-band (about 20-30%) frequencies
data, the deviation of experimental and simulated time traces could be large. Therefore, we
consider the error function Errn of the time traces recorded at G-band frequencies 20 times
more than the time traces recorded at X- or G-band frequencies.

17
Fig. S13 Experimental G-Band PELDOR time traces (black) and simulated G-Band PELDOR time traces from a simultaneous fit to all experimental data of DNA5,16, DNA2,13 and DNA2,16 (blue). The modulation depth of the PELDOR traces 2.0 μs of the simulation has been adjusted to the experimental trace for better comparison (red). (A) X-band (B) Q-band (C) G-band. The field positions A-H are marked in Fig. S2C. (D) Density plot of twist angle against bend angle of the structures selected by a simultaneous fit to all experimental data recorded at multiple magnetic field strengths.

18
6 References
1. Godt, A.; Schulte, M.; Zimmermann, H.; Jeschke, G., How flexible are poly(para-phenyleneethynylene)s? Angew. Chem.-Int. Edit. 2006, 45 (45), 7560-7564.2. Prisner, T. F.; Marko, A.; Sigurdsson, S. T., Conformational dynamics of nucleic acid molecules studied by PELDOR spectroscopy with rigid spin labels. J. Magn. Reson. 2015, 252, 187-198.3. Jeschke, G.; Chechik, V.; Ionita, P.; Godt, A.; Zimmermann, H.; Banham, J.; Timmel, C. R.; Hilger, D.; Jung, H., DeerAnalysis2006 - a comprehensive software package for analyzing pulsed ELDOR data. Appl. Magn. Reson. 2006, 30 (3-4), 473-498.4. Tikhonov, A. N., Numerical Methods for the Solution of Ill-posed Problems. Kluwer Academic Publishers: Dordrecht: Bosten, 1995.5. Marko, A.; Prisner, T. F., An algorithm to analyze PELDOR data of rigid spin label pairs. Phys. Chem. Chem. Phys. 2013, 15 (2), 619-627.6. Marko, A.; Margraf, D.; Yu, H.; Mu, Y.; Stock, G.; Prisner, T., Molecular orientation studies by pulsed electron-electron double resonance experiments. J. Chem. Phys. 2009, 130 (6), 064102-1-064102-9.7. Endeward, B.; Marko, A.; Denysenkov, V. P.; Sigurdsson, S. T.; Prisner, T. F., Advanced EPR methods for studying conformational dynamics of nucleic acids. Methods Enzymol., eds. Qin PZ, Warncke K 2015, 564, 403-425.8. Woźniak, A. K.; Schröder, G. F.; Grubmüller, H.; Seidel, C. A. M.; Oesterhelt, F., Single-molecule FRET measures bends and kinks in DNA. Proc. Natl. Acad. Sci. U. S. A. 2008, 105, 18337-18342.