by karin burk busby
TRANSCRIPT
TEXAS SCIENCE TEACHER CHARACTERISTICS AND CONCEPTUAL
UNDERSTANDING OF NEWTON’S LAWS OF MOTION
by
Karin Burk Busby
APPROVED BY SUPERVISORY COMMITTEE:
___________________________________________
Mary Urquhart, Chair
___________________________________________
Jim McConnell
___________________________________________
Stephanie Taylor

Copyright 2017
Karin Burk Busby
All Rights Reserved

To my family, who has always supported me,
my husband David, my parents Larry and Joan Burk,
and my children, Michael, Anastasia, Alexander, and the two in my tummy.
TEXAS SCIENCE TEACHER CHARACTERISTICS AND CONCEPTUAL
UNDERSTANDING OF NEWTON’S LAWS OF MOTION
by
KARIN BURK BUSBY, BA, MED
THESIS
Presented to the Faculty of
The University of Texas at Dallas
in Partial Fulfillment
of the Requirements
for the Degree of
MASTER OF ARTS IN TEACHING IN
SCIENCE EDUCATION
THE UNIVERSITY OF TEXAS AT DALLAS
May 2017
v
ACKNOWLEDGMENTS
I would like to express my profound respect and gratitude to my committee chair Dr. Mary
Urquhart. You saw the value in my work and helped me through the worst. Your dedication to
the art of science education has helped me become both a better teacher and a better scholar. I
would also like to thank the members of my thesis committee, Dr. Jim McConnell and Dr.
Stephanie Taylor. You both gave me your time and resources in order to improve this research
and I am deeply humbled. To Dr. Homer Montgomery, thank you for always pushing me to
produce the best body of work possible and to not accept good enough from myself. To Georgia
Stuart, whose statistical knowledge and gracious heart helped produced a statistically sound
piece of work. This research is a testament to all of your dedication to science education.
A special thank you to the TRC and Dr. Carol Fletcher for allowing me to work with your
archival data. To the two school districts who allowed me to conduct research, thank you. I will
keep your anonymity but know this body of research comes from your trust.
Finally, thank you to the people behind the scenes who stood by me and pushed me when I was
ready to quit. To my late father, Larry C. Burk, who taught me how to write and how to question;
those skills created this piece of work. To my mother, Joan B. Burk, your life has been a
dedication to the craft of education and I am humbled to follow in your footsteps. To my
husband, David M. Busby, thank you for stepping up as a single parent so many nights so I could
write. To my children, I hope one day you see this thesis and know that anything is possible, no
matter how difficult it looks to be.
April 2017
vi
TEXAS SCIENCE TEACHER CHARACTERISTICS AND CONCEPTUAL
UNDERSTANDING OF NEWTON’S LAWS OF MOTION
Karin Burk Busby, MAT
The University of Texas at Dallas, 2017
ABSTRACT
Supervising Professor: Mary Urquhart
Misconceptions of Newtonian mechanics and other physical science concepts are well
documented in primary and pre-service teacher populations (Burgoon, Heddle, & Duran, 2009;
Allen & Coole, 2012; Kruger, Summers, & Palacio, 1990; Ginns & Watters, 1995; Trumper,
1999; Asikainen & Hirovonen, 2014). These misconceptions match the misconceptions held by
students, leaving teachers ill-equipped to rectify these concepts in the classroom (Kind, 2014;
Kruger et al., 1990; Cochran & Jones, 1998). Little research has been devoted to misconceptions
held by in-service secondary teachers, the population responsible for teaching Newtonian
mechanics. This study focuses on Texas in-service science teachers in middle school and high
school science, specifically sixth grade science, seventh grade science, eighth grade science,
integrated physics and chemistry, and physics teachers.
This study utilizes two instruments to gauge conceptual understanding of Newton’s laws of
motion: the Force Concept Inventory [FCI] (Hestenes, Wells, & Swackhamer, 1992) and a
custom instrument developed for the Texas Regional Collaboratives for Excellence in Science
and Mathematics Teaching (Urquhart, M., e-mail, April 4, 2017). Use of each instrument had its
vii
strengths and limitations. In the initial work of this study, the FCI was given to middle and high
school teacher volunteers in two urban school districts in the Dallas- Fort Worth area to assess
current conceptual understanding of Newtonian mechanics. Along with the FCI, each participant
was asked to complete a demographic survey. Demographic data collected included participant’s
sex, years of service in teaching position, current teaching position, degrees, certification type,
and current certifications for science education. Correlations between variables and overall
average on the FCI were determined by t-tests and ANOVA tests with a post-hoc Holm-
Bonferroni correction test. Test questions pertaining to each of Newton’s three laws of motion
were extrapolated to determine any correlations. The sample size for this study was small (n=24),
requiring a second study investigate potential correlations to teacher characteristics.
The second study was conducted using the 2013-2014 school year participants in the Texas
Regional Collaboratives for Excellence in Science and Mathematics Teaching [TRC] (Texas
Regional Collaborative for Excellence in Science and Mathematics Teaching, 2013), a statewide
program led by The University of Texas at Austin Center for STEM Education (Texas Regional
Collaborative for Excellence in Science and Mathematics Teaching, 2013). Participants
completed a demographic survey and took the TRC Physics Assessment instrument developed
for the TRC to determine current conceptual understanding of Newtonian mechanics as defined
by the Texas Essential Knowledge and Skills. The TRC also collected demographic data
including Texas Educational Agency region, participant’s sex, years of service in teaching,
current teaching position, level of highest degree earned, whether or not the participant had a
STEM degree, and certification type. Correlations were determined between overall average and
conceptual force questions only. The sample size was substantial (n=368) but due to time
viii
constraints in its development, the TRC Physics Assessment was unable to undergo reliability or
validity testing before implementation. Test question pertaining to each of Newton’s three laws
of motion were extrapolated to determine any correlations. A significance value of p= 0.05 was
used for all tests.
Both content assessments indicated that, on average, teacher-participants had a considerable
misunderstanding of Newtonian mechanics with Newton’s third law questions especially
difficult for the populations. Teachers’ current teaching assignment was statistically significant
for most tests, suggesting that high school physics teachers have more conceptual understanding
of Newtonian mechanics than middle school teachers but have not necessarily mastered
Newtonian mechanics. STEM majors and participant’s sex were significant only for the TRC
Physics Assessment.
One outcome of this study is a recommendation that the Texas teacher certification process for
middle school science change to include a general science test that includes physical science.
Also, in-service science teachers responsible for teaching Newton’s laws of motion should
participate in specific professional development from a physics content educational expert to
address misconceptions. Additional recommendations include that physics teachers take a
mentoring role to help other teachers in physical science concepts and that middle school
curriculum provide assistance to teachers for addressing misconceptions of Newton’s third law.
ix
TABLE OF CONTENTS
ACKNOWLEDGMENTS ………………………………………………………………………. v
ABSTRACT ……………………………………………………………………………………. vi
LIST OF TABLES ……………………………………………………………………………… xi
LIST OF FIGURES ……………………………………………………………………………. xv
CHAPTER 1 INTRODUCTION ………………………………………………………………... 1
CHAPTER 2 BACKGROUND ………………………………………………………………... 12
CHAPTER 3 METHODOLOGY ……………………………………………………………… 22
CHAPTER 4 RESULTS ……………………………………………………………………….. 33
CHAPTER 5 CONCLUSIONS AND RECOMMENDATIONS ……………………………… 82
APPENDIX A ………………………………………………………………………………….. 88
APPENDIX B ………………………………………………………………………………….. 91
APPENDIX C ………………………………………………………………………………… 99
APPENDIX D ………………………………………………………………………………… 102
APPENDIX E ………………………………………………………………………………… 105
APPENDIX F ………………………………………………………………………………… 106
APPENDIX G ……………………………………...…………………………………………. 113
APPENDIX H…………………………………………………………………………………. 117
APPENDIX I …………………………………………………………………………………. 120
APPENDIX J …………………………………………………………………………………. 124
APPENDIX K ……………………………………………………………………………….... 126
APPENDIX L ………………………………………………………………………………… 197
x
APPENDIX M………………………………………………………………………………… 204
REFERENCES ……………………………………………………………………………….. 205
BIOGRAPHICAL SKETCH …………………………………………………………………. 210
CURRICULUM VITAE
xi
LIST OF TABLES
2.1 Types of Certification for each subject…………………………………………………… 20
3.1 FCI question breakdown by Newton’s laws ……………………………….………...…... 25
3.2 TEKS identified as low performing ……………………………………………………… 26
3.3 TRC Physics Assessment question breakdown by conceptual force and Newton’s laws
questions ………………………………………………………………………….……… 28
4.1 Descriptive statistics for FCI overall averages …………………………………...……… 33
4.2 FCI overall averages by knowledge threshold ……………………………………...…… 34
4.3 Descriptive statistics for FCI Newton’s first law questions ……………………………... 34
4.4 FCI Newton’s first law questions by knowledge threshold …………………………..….. 35
4.5 Descriptive statistics for FCI Newton’s second law questions …………………………... 35
4.6 FCI Newton’s second law questions by knowledge threshold ……………………….….. 36
4.7 Descriptive statistics for FCI Newton’s third law questions …………………………….. 37
4.8 FCI Newton’s third law questions by knowledge threshold ……………………………... 38
4.9 ANOVA of grade level FCI overall averages ……………………………………...…….. 38
4.10 Descriptive statistics of grade level FCI overall averages ……………………………….. 39
4.11 ANOVA of grade level taught for Newton's third law question of the FCI ……………... 40
4.12 Descriptive statistics of grade level taught for Newton's third law question of the FCI … 41
4.13 Results of Chi-square test and descriptive statistics for knowledge threshold by grade level
taught for FCI Newton's third law…………………………………………………………41
4.14 FCI statistical test with adjusted p-values > 0.05 ……………………………..………..... 42
4.15 Descriptive statistics for TRC Physics Assessment overall ………………………..…….. 43
4.16 Descriptive statistics for TRC Physics Assessment conceptual force questions ………… 44
xii
4.17 Descriptive statistics for TRC Physics Assessment Newton's first law questions ………. 44
4.18 Descriptive statistics for TRC Physics Assessment Newton's second law questions ……. 45
4.19 Descriptive statistics for TRC Physics Assessment Newton's third law ………………… 46
4.20 ANOVA of region for TRC Physics Assessment overall average …………………..…... 48
4.21 Descriptive statistics of regions for TRC Physics Assessment overall averages ……........ 49
4.22 ANOVA of region type for TRC Physics Assessment overall average ………….…......... 50
4.23 Descriptive statistics of region type for TRC Physics Assessment overall averages ……. 50
4.24 Descriptive statistics of participant’s sex for TRC Physics Assessment overall averages.. 51
4.25 t-Test: Two-sample assuming unequal variances of sex for TRC Physics Assessment
overall averages .…………………………………………………………………………. 51
4.26 Descriptive statistics of STEM major for TRC Physics Assessment overall averages ….. 52
4.27 Two-sample assuming unequal variances of STEM major for TRC Physics Assessment
overall averages ….………………………………………………………………………..52
4.28 ANOVA of grades taught (MS vs HS) for TRC Physics Assessment overall averages …. 53
4.29 Descriptive statistics of grades taught (MS vs HS) for TRC Physics Assessment overall
averages ……………………………………………………………………….…………. 54
4.30 ANOVA of grades taught (Eighth Grade vs HS) for TRC Physics Assessment overall
averages ..……………………………………………………………….………………… 55
4.31 Descriptive statistics of grades taught (Eighth Grade vs HS) for TRC Physics Assessment
overall averages ..………………………………………………………………………… 55
4.32 ANOVA of grades taught for TRC Physics Assessment overall average ……………….. 56
4.33 Descriptive statistics of grades taught for TRC Physics Assessment overall averages …. 57
4.34 ANOVA of region for TRC Physics Assessment conceptual force questions ………....... 58
4.35 Descriptive statistics of region for TRC Physics Assessment conceptual force questions . 59
xiii
4.36 Descriptive statistics of participants’ sex for TRC Physics Assessment conceptual force
questions …………………………………………………………………………………. 60
4.37 t-Test: Two-sample assuming unequal variances of sex for TRC Physics Assessment
conceptual force questions ...……………………………………………………………... 60
4.38 Descriptive statistics of STEM degree for TRC Physics Assessment .…………………... 61
4.39 t-Test: Two-sample assuming unequal variances of STEM degree for TRC Physics
Assessment conceptual force questions ...………………………………………………... 61
4.40 ANOVA of grades taught (MS vs HS) for TRC Physics Assessment conceptual force
questions …………………………………………………………………………………. 62
4.41 Descriptive statistics of grades taught (MS vs HS) for TRC Physics Assessment conceptual
force questions …………….……………………………………………………………... 63
4.42 ANOVA of grades taught (Eighth vs HS) for TRC Physics Assessment conceptual force
questions …………………………………………………………………………………. 64
4.43 Descriptive statistics of grades taught (Eighth vs HS) for TRC Physics Assessment
conceptual force questions …………….…………………………………………………. 64
4.44 ANOVA of grades taught for TRC Physics Assessment conceptual force questions……. 65
4.45 Descriptive statistics of grades taught for TRC Physics Assessment conceptual force
questions …………………………………………………………………………………. 66
4.46 Descriptive statistics of STEM degree for TRC Physics Assessment Newton's first law
questions …………………………………………………………………………………. 67
4.47 t-Test: Two-sample assuming unequal variances of STEM degree for TRC Physics
Assessment Newton's first law questions ……………………………………………....... 68
4.48 ANOVA of grades taught (MS vs HS) for TRC Physics Assessment Newton's first law
questions …………………………………………………………………………………. 69
4.49 Descriptive statistics of grades taught (MS vs HS) for TRC Physics Assessment Newton's
first law questions ...……………………………………………………………………… 69
4.50 ANOVA of grades taught for TRC Physics Assessment Newton’s first law questions …. 70
4.51 Descriptive Statistics of Grades Taught for TRC Physics Assessment Newton’s first law
questions …………………………………………………………………………………. 71
xiv
4.52 ANOVA of grades taught (MS vs HS) for TRC Physics Assessment Newton's second law
questions …….…………………………………………………………………………… 72
4.53 Descriptive statistics of grades taught (MS vs HS) for TRC Physics Assessment Newton's
second law questions ..…………………………………………………………………… 73
4.54 ANOVA of grades taught (Eighth vs HS) for TRC Physics Assessment Newton's second
law questions ………..……………………………………………………………………. 74
4.55 Descriptive statistics of grades taught (Eighth vs HS) for TRC Physics Assessment
Newton's second law questions ...………………………………………………………… 74
4.56 ANOVA of grades taught for TRC Physics Assessment Newton's second law questions . 75
4.57 Descriptive statistics of grades taught for TRC Physics Assessment Newton's second law
questions …………………………………………………………………………………. 76
4.58 ANOVA of rural regions for TRC Physics Assessment Newton's third law questions ..... 78
4.59 Descriptive statistics of rural regions for TRC Physics Assessment Newton's third law
questions …………………………………………………………………………………. 78
4.60 Descriptive statistics of participants’ sex for TRC Physics Assessment Newton’s third law
questions ...……………………………………………………………………………….. 79
4.61 t-Test: Two-sample assuming unequal variances of sex for TRC Physics Assessment
Newton’s third law questions …………………………………………………………….. 79
4.62 TRC Physics Assessment statistical tests with adjusted p-values > 0.05 ………………... 80
xv
LIST OF FIGURES
1.1 Research Questions Flow Chart …………………………………………………………… 7
1.2 Hypotheses Flow Chart ……………………………………………………………………. 8
4.1 FCI distribution for overall averages …………………………………………………….. 33
4.2 FCI distribution for Newton’s first law questions ……………………………………...... 35
4.3 FCI distribution for Newton’s second law questions…………………………………...… 36
4.4 FCI distribution for Newton’s third law questions ………………………………………. 37
4.5 TRC Physics Assessment distribution for overall averages ……………………………... 43
4.6 TRC Physics Assessment distribution for conceptual force questions …………………... 44
4.7 TRC Physics Assessment distribution for Newton’s first law questions ………………... 45
4.8 TRC Physics Assessment distribution for Newton’s second law questions ……………... 46
4.9 TRC Physics Assessment distribution for Newton’s third law questions ……………….. 47
5.1 Results Flow Chart …..…………………………………………………………………... 82
1
CHAPTER 1
INTRODUCTION
Teacher knowledge directly influences student knowledge (Sadler, Sonnert, Coyle, Cook-
Smith, & Miller, 2013; Abell, 2007). Teacher knowledge is defined as both content knowledge,
referred to as CK in this study, and pedagogical content knowledge, referred to as PCK (Abell,
2007). The influence of CK versus PCK is mixed with some research showing teacher degrees in
formal education an influencing factor (Hill, Rowan, & Ball, 2005; Hashweh, 1987) and other
studies finding teacher experience more influential (Sanders, Borko, & Lockard, 1993; Deng,
2007). However, the research indicates that the most effective teachers are those who have both
strong CK and PCK (Abell, 2007; Etkina, 2010; Sadler et al., 2013).
Current research in physical science content knowledge has focused mainly on in-service
elementary science teachers (Burgoon, Heddle, & Duran, 2009; Allen & Coole, 2012; Kruger,
Summers, & Palacio, 1990; Ginns & Watters, 1995) and pre-service physics teachers (Trumper,
1999; Asikainen & Hirovonen, 2014). There are limited studies on physical science content
knowledge in secondary science in the United States (Sadler et al., 2013).
Middle school science teachers are responsible for teaching basic physical science
concepts including Newton’s three laws of motion (Next Generation Science Standards, 2013;
Texas Essential Knowledge and Skill [TEKS], 2010). Sadler’s et al. (2013) national US study
tested 181 current in-service middle school physical science teachers’ content knowledge using a
multiple choice pretest and posttest covering the grades five to eight physical science standards
of the National Science Education Standards [NSES]. Initially, they found teacher subject
2
knowledge of the physical science standards of the NSES was strong, but there were “noticeable
holes in their knowledge (p. 1043).” Yip, Chung, & Mak (1998) studied a similar population of
147 in-service middle school science teachers in Hong Kong using a true false physical science
competency test and found the teacher population’s content knowledge of physical science was
weak. Yip et al. emphasized that those teachers who majored in physics had stronger physical
science knowledge than teachers who did not major in physics, but they did not possess enough
physical science knowledge for mastery. Harrell (2010) studied 93 in-service eighth grade
science teachers described as highly qualified for the content by Texas certification. Using
undergraduate transcripts and the 8-12 science Texas Examination of Educator Standards
[TExES] diagnostic examination, she found physical science content knowledge for the
population as overall insufficient.
The American Association of Physics Teachers [AAPT] (1988) described the ideal
physics teacher as a teacher who majored in physics. However, Trumper’s (1999) study on 25
pre-service physics teachers in Israel using a multiple choice test determined the teachers still
had misconceptions about force and motion after completing a four year study in physical
science education. Asikainen and Hirvonen (2014) studied nine pre-service physics teachers and
18 in-service physics teachers in Israel. Using interviews and an open-ended test, they
ascertained that the population also had physical science misconceptions although this study
focused on quantum mechanics. Galil and Lehavi’s (2006) study tasked 75 in-service physics
teachers to define physics concepts. They determined that the resulting definitions were
insufficient, which alludes to conceptual misconceptions but is not definitive.
3
Little research in the United States has focused on secondary in-service teachers’ physical
science content knowledge and what characteristics correspond with misconceptions (Sadler et
al., 2013). Arzi and White (2007) found that formal education was forgotten and specific content
knowledge was retained as a teacher continued teaching through years of service. Similarly,
Sander et al. (1993) found that when teachers were forced to teach content outside their
knowledge base, expert teachers would overcome knowledge deficits without intervention but
the process would take time. Kind’s (2013) study of chemistry teachers found misconceptions
are more prevalent in teachers responsible for science subjects not related to their degrees.
However, teachers who majored in physics still have physical science misconceptions (Galili &
Lehavi, 2006). It is unclear how prevalent physical science misconceptions are in the current
teaching population.
This study focuses on Texas in-service secondary science teachers who are responsible
for teaching physical science content, specifically Newton’s three laws of motion. This study
identifies current population’s conceptual understanding of Newton’s three laws of motion and
identifies any correlations between teacher physical science content knowledge and teacher’s
characteristics, including educational background, certification, and years of service.
Statement of Problem
As previously noted, research has shown that teacher content knowledge affects student
knowledge. Current research cannot adequately describe how prevalent misconceptions about
Newton’s three laws of motion are within the physical science teacher population. Conflicting
research cannot clarify if teacher background, formal science education, or years of service
4
correlate with proper understanding of Newtonian mechanics (Kind, 2013; Sadler et al., 2013;
Galili & Lehavi, 2006; Trumper, 1999).
Purpose of Study
The purpose of this study is to identify current Texas sixth grade science teachers,
seventh grade science teachers, eighth grade science teachers, integrated physics and chemistry
teachers, and physics teachers’ conceptual understanding of Newton’s laws of motion and to
identify any correlations between teacher characteristics such as formal science education at the
undergraduate level, certification, and years of service with conceptual understanding of
Newtonian mechanics. According to the Texas science standards, the TEKS, these teachers
directly teach Newtonian mechanics to their students, so teacher misconceptions could pose an
issue for student learning (Sadler et al., 2013; Burgoon et al., 2009; Berg & Brouwer, 1991) (see
Appendix A for a full list of TEKS).
Research Questions
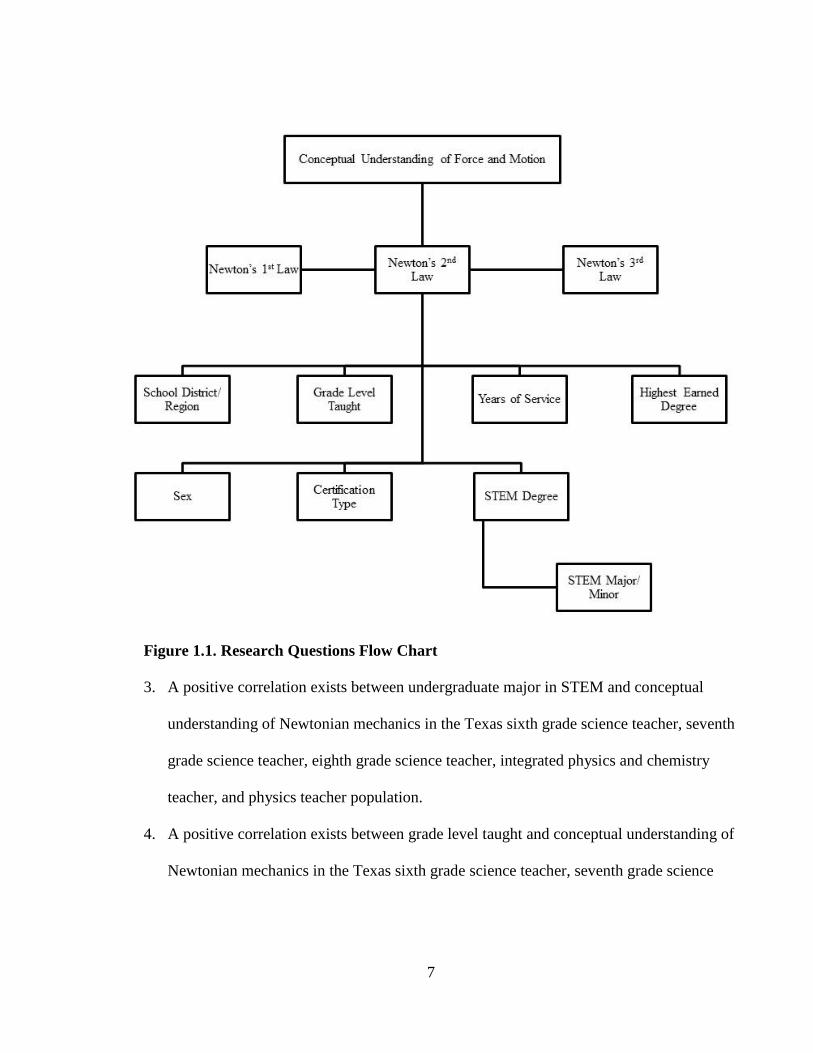
For the purpose of this study, the following questions were addressed (see Figure 1.1):
1. What is the overall conceptual understanding of Newtonian mechanics in the current
Texas sixth grade science teacher, seventh grade science teacher, eighth grade science
teacher, integrated physics and chemistry teacher, and physics teacher population?
2. What is the conceptual understanding of each of Newton’s three laws of motion in the
current Texas sixth grade science teacher, seventh grade science teacher, eighth grade
5
science teacher, integrated physics and chemistry teachers, and physics teacher
population?
3. Is there a correlation between the sex of the teacher and his or her conceptual
understanding of Newtonian mechanics in the current Texas sixth grade science teacher,
seventh grade science teacher, eighth grade science teacher, integrated physics and
chemistry teacher, and physics teacher population?
4. Is there a correlation between school district or region and conceptual understanding of
Newtonian mechanics in the current Texas sixth grade science teacher, seventh grade
science teacher, eighth grade science teacher, integrated physics and chemistry teacher,
and physics teacher population?
5. Is there a correlation between grade level taught and conceptual understanding of
Newtonian mechanics in the current Texas sixth grade science teacher, seventh grade
science teacher, eighth grade science teacher, integrated physics and chemistry teacher,
and physics teacher population?
6. Is there a correlation between years of service and conceptual understanding of
Newtonian mechanics in the current Texas sixth grade science teacher, seventh grade
science teacher, eighth grade science teacher, integrated physics and chemistry teacher,
and physics teacher population?
7. Is there a correlation between highest earned degree and conceptual understanding of
Newtonian mechanics in the current Texas sixth grade science teacher, seventh grade
science teacher, eighth grade science teacher, integrated physics and chemistry teacher,
and physics teacher population?
6
8. Is there a correlation between undergraduate major and conceptual understanding of
Newtonian mechanics in the current Texas sixth grade science teacher, seventh grade
science teacher, eighth grade science teacher, integrated physics and chemistry teacher,
and physics teacher population?
9. Is there a correlation between type of certification program and conceptual understanding
of Newtonian mechanics in the current Texas sixth grade science teacher, seventh grade
science teacher, eighth grade science teacher, integrated physics and chemistry teacher,
and physics teacher population?
10. Is there a correlation between the teacher subject certification and conceptual
understanding of Newtonian mechanics in the current Texas sixth grade science teacher,
seventh grade science teacher, eighth grade science teacher, integrated physics and
chemistry teacher, and physics teacher population?
Hypotheses
This investigation included the following hypotheses (see Figure 1.2):
1. Teacher misconceptions about Newtonian mechanics are significantly prevalent in the
Texas sixth grade science teacher, seventh grade science teacher, eighth grade science
teacher, integrated physics and chemistry teacher, and physics teacher population.
2. No correlation exists between sex of the teacher, school district, undergraduate major,
certification program, or type of teacher subject certification with conceptual
understanding of Newtonian mechanics in the Texas sixth grade science teacher, seventh
grade science teacher, eighth grade science teacher, integrated physics and chemistry
teacher, and physics teacher population.
7
Figure 1.1. Research Questions Flow Chart
3. A positive correlation exists between undergraduate major in STEM and conceptual
understanding of Newtonian mechanics in the Texas sixth grade science teacher, seventh
grade science teacher, eighth grade science teacher, integrated physics and chemistry
teacher, and physics teacher population.
4. A positive correlation exists between grade level taught and conceptual understanding of
Newtonian mechanics in the Texas sixth grade science teacher, seventh grade science
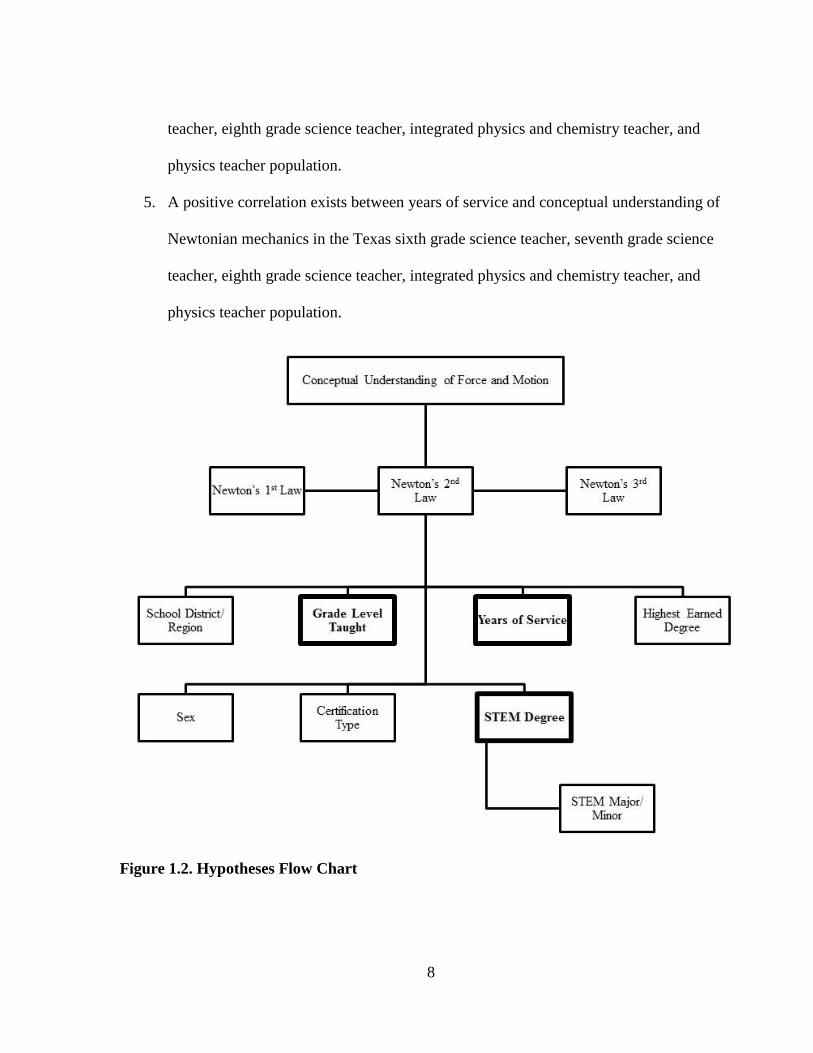
8
teacher, eighth grade science teacher, integrated physics and chemistry teacher, and
physics teacher population.
5. A positive correlation exists between years of service and conceptual understanding of
Newtonian mechanics in the Texas sixth grade science teacher, seventh grade science
teacher, eighth grade science teacher, integrated physics and chemistry teacher, and
physics teacher population.
Figure 1.2. Hypotheses Flow Chart
9
Definition of Terms
1. Significantly Prevalent- the target population exhibits >40 percent of Newtonian
misconceptions as defined by Hestenes and Halloun’s (1995) response to exploring the
Force Concept Inventory.
2. Grade level taught- the target’s current teaching position will only be considered. In the
case of split level teaching, target’s majority >50 percent of teaching time, will be
considered current teaching position as defined by the Texas Education Agency (2015).
3. Certification Program- the target’s type of program in which a teaching certificate was
earned, either defined as traditional certification program or alternative certification
program as determined by Texas Education Agency (2015).
4. School District- the target’s current school district at time of participation.
5. Undergraduate Degree- an undergraduate degree will be defined as a Bachelor of
Science, a Bachelor of Art, Bachelor of Fine Arts, and Bachelor of Business
Administration.
6. Years of Service- years of service will count upon the continuation of one academic year.
Targets who are in their first year of teaching will have earned 1 years of service.
Semester only years will not count.
7. Science Teacher Certificate- science teacher certificates are divided into three categories;
Generalist, Science Generalist, Specialized Science. Targets will choose all certifications,
but targets will be categorized by most specialized degree.
10
8. Generalist- a target whose certification is of the following; Generalist EC-6, Generalist 4-
8, Core Subject EC-6, and Core Subjects 4-8 or of similar type. (See Appendix B for full
description.)
9. Science Generalist- a target whose certification is of the following; Science 4-8; Science
7-12; Mathematics Science 4-8; or of a similar type. (See Appendix B for full
description)
10. Specialized Science- a target whose certification is of the following; Chemistry 7-12; Life
Science 7-12; Physical Science 6-12; Mathematics/Physical Science/Engineering 6-12;
Mathematics/Physical Science/Engineering 8-12; Physics/Mathematics 7-12, Physics/
Mathematics 8-12. (See Appendix B for full description)
11. Knowledge Threshold- the amount of knowledge a target has about conceptual physics
determined by the Force Concept Inventory (Hestenes & Halloun, 1995).
12. Content Knowledge- content knowledge is understanding of physical science principles
and theories
13. Pedagogical Content Knowledge- pedagogical content knowledge is understanding how
students learn a particular subject, underlying misconceptions students may have in that
subject, and how to relate subject content to students’ everyday life.
Study
This study is composed of two parts which both have considerable limitations. Study One
used the Force Concept Inventory [FCI] instrument to determine teacher physical science content
knowledge. The FCI is a valid and reliable instrument for assessing conceptual understanding of
force and motion. The sampling size for Study One was small (n=24) which limited any findings
11
as suggestive only. Demographic information was included at the end of the instrument to
identify teacher characteristics. Correlations were identified using t-Test and ANOVA when
appropriate. A Chi-squared contingency table was used to identify correlations in terms of
knowledge thresholds.
To support any suggestive findings in Study One, a second study was implemented. As
previously described, Study Two included the participants of the 2013-2014 Texas Regional
Collaboratives for Excellence in Science and Mathematics Teaching [TRC], a state-wide
professional development program supported by The University of Texas at Austin. The TRC
collects individual demographic data on all participants as part of the participant profile, which
was used to determine population characteristics. The professional development focus for 2013-
2014 school year was on physical science Texas Essential Knowledge and Skills [TEKS] (see
Appendix A). As part of the program, Dr. Mary Urquhart of The University of Texas at Dallas
was requested to develop the TRC Physics Assessment to align with TEKS for middle school
science force and motion over a period of two months. Due to the time constraints, the
instrument was unable to undergo validity and reliability testing before implementation. The
TRC Physics Assessment was administered twice, once as a pre-test and once as a post-test. This
study only analyzed pre-test data. Individual demographic data was uniquely linked to individual
pre-tests, allowing for the analysis in this study. The sample size for Study Two was substantial
(n=368) but not necessarily representative of the Texas teacher population due to self-selection
bias for participating in the 100 contract-hour TRC professional development program.
Correlations were identified using t-Test and ANOVA when appropriate. Both studies’ results
were compared to determine any trends in the data.
12
CHAPTER 2
BACKGROUND
Teacher knowledge, which includes CK and PCK, directly influences student knowledge
(Sadler et al., 2013; Abell, 2007; Etkina, 2010) however which is more influential is unresolved.
Teacher CK is influenced by misconceptions, which are resilient (Trumper, 1999; Kikas, 2002;
Viennot, 1979; Solomon 1983) lasting well beyond formal education. Teacher misconceptions in
physical science have been documented in pre-service high school physics teachers (Trumper,
1999; Asikainen & Hirovonen, 2014) and in-service elementary science teachers (Burgoon et al.,
2009; Kruger, Summers, & Palacio, 1990; Ginn & Watters, 1995). Research on middle school
and high school physical science teacher misconceptions are limited and mixed, with some
research showing prevalent misconceptions (Yip et. al, 1998) while other research finding
minimal (Sadler et al., 2013). Teacher misconceptions are more prevalent in those with science
degrees not related to their field of teaching (Kind, 2014), but misconceptions have been
documented in current physics teacher holding physics degrees (Galili & Lehavai, 2006).
Nature of Scientific Misconceptions
Students form an understanding of scientific process before any formal instruction,
(National Research Council [NRC], 2005). The NRC explained further that these pre-educational
constructs can be inaccurate or incomplete, developing misconceptions in student’s knowledge
before he or she is formally trained. A scientific misconception describes a science conception
that differs from currently accepted scientific knowledge as described by Burgoon’s et al. (2009)
study on 103 Ohio elementary teachers’ physical science knowledge and correlations between
13
teacher misconceptions and student misconceptions. Kikas’ (2004) study of 198 in-service
teacher understanding of object’s motion derived that misconceptions arise as people “attempt to
understand complicated knowledge” (p. 435) as determined by an evaluation and problem task
questionnaire. These misconceptions are vast and prevalent (Poutot & Blandin, 2015; Kikas,
2002; Trumper, 1999; Asikainen and Hirovonen, 2014; Galili & Lehavai, 2006). Student
misconceptions about scientific principles have been documented in all science subjects,
(American Association for the Advancement of Science [AAAS], 1993). Gönen (2008) found
that “regardless of students’ level of schooling, misconceptions are prevalent and resistant” (p.
79) in his study of 267 pre-service science and physics teacher’s understanding of mass and
gravity as determined by open-ended physical science questions. Similarly, Galili & Lehavai’s
(2006) study of high school physics teachers’ ability to define physics concept resulted in
inadequate definitions which is indicative of misconceptions although not conclusive.
Developed misconceptions are resistant to change; students revert back to previously held
notions even when presented with contradicting evidence. Allen and Coole (2012) studied 47
pre-service teachers in England and determined that when a student is presented with content that
disagrees with his or her own understanding, the student will first rely on his or her own
understanding before accepting the new scientific process indicated by pretest and posttest of
physical science concepts. Furthermore, after treatment to correct specific misconceptions, some
participants returned to prior held misconceptions after six weeks, dropping overall post-test
corrections. Secondary physics classes fail to make lasting impact on student understanding of
physical concepts (Viennot, 1979; Solomon, 1983; Driver and Oldham, 1986).
14
Teacher Knowledge
Teacher knowledge is multifaceted and more complex than simply knowing the content
being presented. Teachers must understand the content and relate it to students in engaging and
meaningful ways. As previously stated, this study will distinguish between two types of teacher
knowledge, content knowledge referred to as CK and pedagogical content knowledge referred to
as PCK. The influence of CK and PCK are seen by Sadler’s et al. (2013) study of 181 middle
school physical science teachers and 9,506 middle school students. Students made the highest
gains from teachers with both CK and PCK over teachers with only one of the knowledge types
as determined by pretest and posttest assessment of the physical science standards of the NSES.
Similar, Etkina (2010) argues that a teacher must have “deep content knowledge (p. 020110 2)”
in order to convey conceptual understanding to students in her study of pedagogical practices of
the Rutgers Physics/ Physical Science Teacher Preparation Program. She elaborated that a
teacher must understand the history of a concept, the nuances of the concepts, and the
relationship the concept has with other scientific knowledge to convey meaning to students. She
was careful to state that this breath of knowledge was not a standalone factor, but must be
integrated into pedagogical practice to be effective. Mantyla and Nousiainen (2013) argued for
content knowledge first “because to construct teaching approaches and plans in which content
knowledge is properly organized, the teacher needs to know how the concepts can be introduced
in teaching in a logically justified manner” (p. 1584) in their study of didactic reconstructions of
physical science content to support pre-service physics teachers. Similarly, Abell (2007)
reviewed research in science teacher knowledge determined that both CK and PCK are required
for teacher preparation, but PCK is not well defined nor formally taught. (p. 1115)
15
Student achievement cannot be mastered without teachers possessing both CK and PCK,
but as to which is more influential has not been determined by current research. Deng (2007)
suggested that to understand the nature of secondary science content, the pedagogical and
sociocultural dimensions of the subject are more essential to teaching than knowing the academic
discipline in his study of academic disciplines versus school subject in relation to teacher
knowledge. This in no way means that lack of CK will lead to student success, but that the PCK
is more important. Similarly, Sander et al. (1993) found that when teachers were forced to teach
content outside their knowledge base, expert teachers would overcome knowledge deficits
without intervention but the process would take time. Novice teachers were unable to overcome
the deficit and taught to a rudimentary understanding only.
In determining student achievement in mathematics, Hill et al. (2005) found teacher
content knowledge to be a significant factor in student gains in their study of student
achievement in mathematics in115 elementary schools as indicated by interviews and
achievement testing. Arzi and White’s (2007) longitudinal study of teacher content knowledge in
teachers from pre-service to 17 years of service found that “the absence of university background
cannot be readily compensated for on-the-job textbook learning” (p. 245), and teachers’ content
knowledge does not grow linearly over time. Furthermore, teachers were often asked to teach
outside their content expertise and had persistent difficulties in subjects in which they did not
have sufficient background knowledge. Sadler et al. (2013) had similar findings, where teachers
had expertise in specific areas, but overall subject knowledge was fragmented. This
fragmentation left holes that affected student achievement of particular concepts in the same
areas.
16
Misconceptions in Teachers
With teacher CK fragmented and misconceptions being resistant to change, it is
reasonable to expect misconceptions to persist in the teacher population. Teacher misconceptions
in fundamental science concepts were first documented in the late 1930’s (Ralya & Ralya, 1938).
A shift in educational research turned attention away from teacher CK and focused on PCK until
the late 1980s (Abell, 2007). Trumper (1999) studied 25 pre-service physics teachers in Israel.
He determined that 76 percent of the physics students in the pre-service teacher training program
still maintained their prior misconceptions about forces after completing a four year program.
Berg and Brouwer’s (1991) study of 20 senior high school physics teachers found that “over one
third of the teachers held one or more alternate conception themselves” (p. 16) by open-ended
questionnaire. Hashweh (1987) found similar results in his study of content knowledge in six
experienced science teachers. He found that “almost every teacher had pre-conceptions or
knowledge inaccuracies” (p. 112) as illustrated by a free response questionnaire. Ginns and
Watters’ (1995) study of 321 pre-service elementary teachers indicated “that many prospective
elementary teachers demonstrate a range of inaccurate scientific concepts in the areas of science
that form important components of elementary science curriculum” (p. 219) as seen by an open-
ended survey. Kruger, Palacio, and Summers studied England elementary science teacher’s
physical knowledge extensively after the implementation of the 1988 Education Act (Kruger, et
al., 1990; Kruger, et al. 1992; Kruger, Summers, & Palacio, 1990). They also found a significant
amount of teacher misconceptions within elementary in-service science teacher population
regardless to any secondary physics schooling.
17
Teacher and student misconceptions are often similar. Burgoon et al. (2009) found that
elementary science teachers demonstrated the same misconceptions held by students about
gravity, magnetism, and temperature. Similarly, Cochran and Jones (1998) determined
elementary teachers have similar concepts about physical phenomena as those held by primary
students in their review of research on the nature and development of subject matter knowledge
of pre-service teachers. Sadler et al. (2013) found that when a middle school teacher did not
know the science content, he or she most likely selected the dominant student misconception as
correct. Kruger et al. 1990 study of 20 elementary in-service teachers in England reasoned that
the misuse of scientific language by teachers observed correlates with the same “undifferentiated
ideas in children” (p. 394) as indicated by in depth interviews. Kind’s (2014) study of 265 United
Kingdom pre-service teachers’ chemistry science knowledge indicated that pre-service teachers’
misconceptions about chemistry matched those of high school students determined by a 28
question survey.
Although formal education does diminish teacher misconceptions, it does not eradicate
them with certainty. Allen and Coole (2012) suggested that primary teachers’ misconceptions
remain dominant due to a lack of formal scientific education. However Gönen (2008) found both
physics and general science teachers could not explain specific concepts, even after studying
those concepts in undergraduate programs. Kind (2014) determined that a science degree was
“not enough to correct teacher misconceptions about chemistry” (p. 1336). Kind and Kind (2011)
study of 150 pre-service teachers found prevailing chemical misconceptions from a chemical
concept questionnaire. They noted that the teachers studied were designated as well-qualified
and “almost all succeeded in becoming science teachers” (p. 2149). Trumper (1999) found that
18
pre-service physics teachers do not abandon their original physical science misconceptions about
physical misconceptions, even after four years of physical science study. Similarly, Yip et al.
(1998) found that physics majors “significantly outperformed teachers in other disciplines, [but]
their performance was by no means satisfactory” (p. 322). Arzi and White (2007) found that as
teachers continued to teach, formal content knowledge of a subject was forgotten while specific
knowledge to the current curriculum remained, i.e. a middle school science teacher would forget
the college level physics learned but retain physical science material pertinent to middle school
science. Similarly, Asikainen and Hirovonen’s (2014) study of nine pre-service and 18 in-service
physics teachers found similar misconceptions about quantum mechanics examined by paper-
and-pencil test and interviews.
Influence of Teacher Content Knowledge and Teacher Misconception on Student
Achievement
Teacher CK impacts student achievement in dynamic ways. Sadler et al. (2013) found
students scored higher on physical science content questions when a teacher had high CK. In a
related study, Wayne and Young’s (2003) review of research in teacher characteristics and
student achievement gains determined that high school mathematics students learned more from
teachers who have certification in mathematics, degrees related to mathematics, and mathematics
coursework, while student performance in lower grades were inconclusive. Hill et al. (2005)
found students achieved more from teachers with strong mathematical content knowledge.
Teacher misconceptions can negatively affect student achievement. Sadler et al. (2013)
determined students with low mathematical and reading ability made no significant gains if the
19
teacher did not have the required CK. Likewise, Burgoon et al. (2009) suggested teachers who
have the same misconception as their students will be unable to address and correct their own
students’ misunderstandings. Berg and Brouwer (1991) reasoned that some misconceptions had
been passed on to students directly because “teachers expressed frustration over the difficulty in
ridding their students of what they perceived to be incorrect conceptions, which were in fact
correct” (p. 16).
Teacher Profile Education
In the United States, the majority of secondary science teachers’ bachelors’ degrees are in
biology (Hill & Gruber, 2011). According to the American Association of Physics Teachers
[AAPT] (1988), “a teacher of high school physics course should have an undergraduate
preparation in physics, mathematics, and related science equivalent to a physics major” (p.
5). Neuschatz and McFarling (2000) study of the Nationwide Survey of High School Physics
Teachers found 33 percent of the physics teachers majored in physics or physics education, but
most teachers had taken at least one college level physics course. National Center for Education
Statistics (Snyder, deBrey, & Dillow, 2016) national school survey of 2012 found that overall, 79
percent of science teacher had a science degree, but only 46 teaching physics have a degree in
physics and only 38 percent were certified to teach it. The teaching population in the United
Kingdom is similar, with a larger proportion of biology degrees versus chemistry or physics
(Kind & Kind, 2011). Australia also mimics these standards, with 86 percent of senior biology
teachers majoring in biology while only 57 percent of senior physics teachers majoring in
physics as shown by Panizzon, Westwell, & Elliott’s (2010) study of 601 South Australian
20
secondary science teachers’ responses on a six question questionnaire. Kind and Kind (2011)
study of pre-service teacher knowledge of chemical concepts noted that pre-service teachers are
required to teach both within their scientific specialty and outside their scientific specialty (p.
2127). Hill and Gruber (2011) study of teacher certification and qualification in United Stated
public and charter schools found that 57 percent of physics teachers majored in physics while 42
percent majored in another subject.
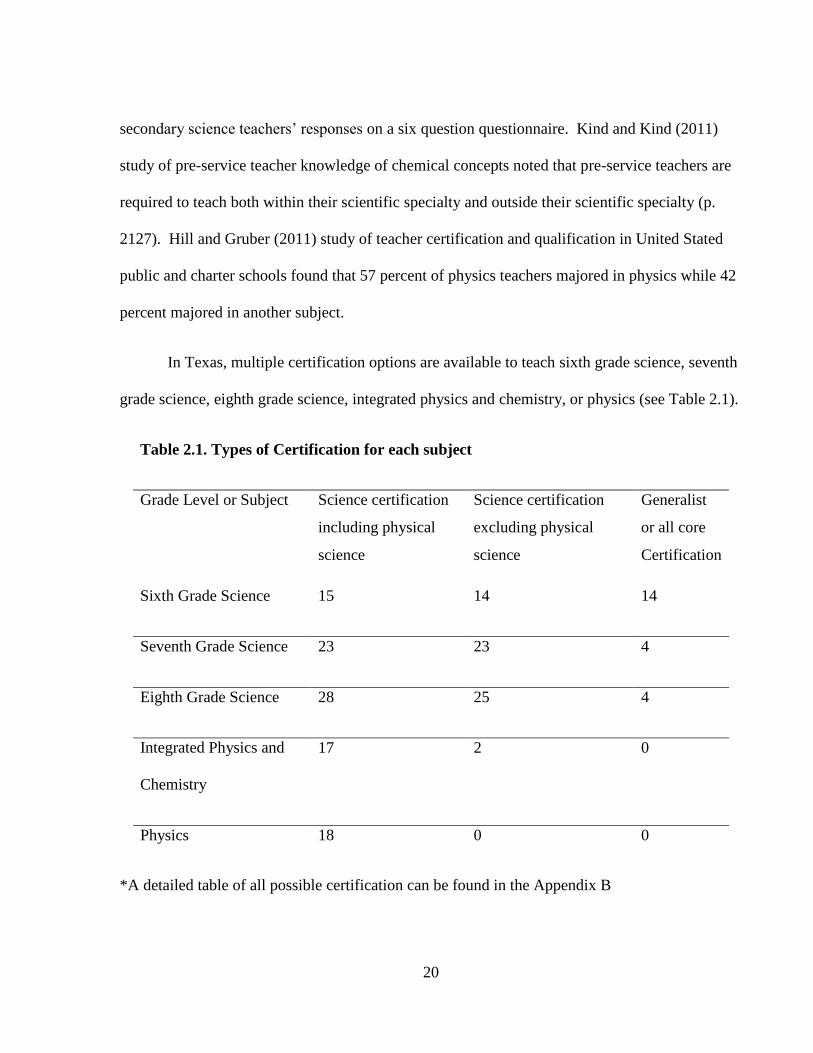
In Texas, multiple certification options are available to teach sixth grade science, seventh
grade science, eighth grade science, integrated physics and chemistry, or physics (see Table 2.1).
Table 2.1. Types of Certification for each subject
Grade Level or Subject Science certification
including physical
science
Science certification
excluding physical
science
Generalist
or all core
Certification
Sixth Grade Science 15 14 14
Seventh Grade Science 23 23 4
Eighth Grade Science 28 25 4
Integrated Physics and
Chemistry
17 2 0
Physics 18 0 0
*A detailed table of all possible certification can be found in the Appendix B
21
Since 2015, there are 43 different certifications that fulfill requirements to teach sixth grade
science, 51 certifications for seventh grade science, 58 certifications for eighth grade, 19
certifications for integrated physics and chemistry, and 18 certifications for physics (Texas
Education Agency [TEA], 2015). Sixth grade science, seventh grade science, and eighth grade
science teachers can be certified to teach science through a generalist or core subject
certification, which requires an overall passing score of all core subjects and does not require a
specific passing science subject score (TEA, 2015). Also, sixth grade science, seventh grade
science, eighth grade science, and integrated physics and chemistry have certification options
that do not include physical science (TEA, 2015). Harrell (2010) argues that the multiple
pathways to secondary science teacher certification in Texas creates loopholes that allow
teachers to be responsible for a content they are not adequately prepared to teach indicated by her
study of 93 in-service eighth grade science teacher and their transcripts and scores on the 8-12
science TExES diagnostic examination.
22
CHAPTER 3
METHODOLOGY
Research Design
Sampling
Study One
Seven school districts in Dallas- Fort Worth area and two school districts in Houston area
were selected to participate in the study. Two school districts in Dallas- Fort Worth area agreed
to participate and are designated as School District A and School District B. School District A
participated in April and May of 2015. School District A has a student population of 38,600 with
28.3 percent Caucasian, 21.6 percent African American, 40 percent Hispanic or Latino, 6.9
percent Asian, with the remaining population identified as American Indian, Pacific Islander, or
two or more races. Sixth grade is housed in the elementary campuses, middle school houses
seventh and eighth grades, and integrated physics and chemistry and physics is housed in the
high schools. There were 162 potential participants identified as teaching sixth grade, seventh
grade science, eighth grade science, integrated physics and chemistry, or physics. All participants
were contacted three times to participate, once at the beginning of the study, once one week after
the beginning of the study, and once during the final week of the study. Thirty-five participants
responded and 15 participants were included in data analysis. Thirteen participants were
excluded due to an incomplete instrument, five indicated they did not currently teach one of the
science grade levels, and four indicated they either are currently teaching or have taught AP
physics in the last five years. School District B participated in April and May of 2016. School
District B has a student population of 25,500 with 14.3 percent Caucasian, 16.7 percent African
23
American, 56.3 percent Hispanic or Latino, 10 percent Asian, and the remaining population
identifying as American Indian, Pacific Islander, or two or more races. Sixth, seventh, and eighth
grade are housed on the middle school campuses and integrated physics and chemistry and
physics are housed on the high school campuses. A total of 71 potential District B participants
were identified as teaching sixth grade science, seventh grade science, eighth grade science,
integrated physics and chemistry, or physics. All participants were contacted three times to
participate, once at the beginning of the study, once two weeks after the beginning of the study,
and once during the final week of the study. Twenty-seven participants responded and nine
participants were included in data analysis. Nine participants were excluded due to an incomplete
instrument, one indicated he did not currently teach one of the science grade levels, seven
indicated they have been the teacher of record for AP physics in the last five years, and one
indicated he had been the teacher of record for an IB course in the last five years. In total,
responses from 24 participants, 15 from District A plus nine from District B, were included in
data analysis.
Study Two
An optional professional development community is the Texas Regional Collaborative
for Excellence in Science and Mathematics Teaching, referred to as the TRC for the remainder of
this work. The TRC is a collaboration program developed and maintained through The
University of Texas at Austin STEM program. In 2013-2014 school year, the TRC had 30 TRC
Science Collaboratives that were housed primarily at either Texas Educational Region Service
Center offices or universities throughout the state. In order to participate in a Regional Science
24
Collaborative, in-service science teachers in public, charter, or private schools must agree to 100
hours of professional development offered through his or her Collaborative during the 15 month
grant term. Professional development must be approved by the TRC in the individual
Collaborative grant application process, and be aligned to the specific content TEKS identified
by the TRC in consultation with the Texas Education Agency (Texas Regional Collaborative for
Excellence in Science and Mathematics Teaching, 2013). For the 2013-2014 school year, the
TRC focus was physical science, including Newton’s three laws of motion. In 2013-2014 grant
year, there were 753 possible participants identified as teachers of record for sixth grade science,
seventh grade science, eighth grade science, integrated physics and chemistry, or physics
courses. Of the 753 identified participants, 368 participants were included in the study. Of the
participants excluded, 235 participants did not have any pre-test instrument information available
and 150 participants did not complete the pre-test instrument in its entirety.
Instrumentation
Study One
Content Knowledge Instrument One
The Force Concept Inventory (Hestenes, Wells, & Swackhamer, 1992), referred to as the
FCI for the remainder of this study, was administered to identify teacher content knowledge
(Jackson, 2016). The FCI is a vetted instrument to identify student conceptual knowledge of
physical science (Hestenes & Halloun, 1995). Sadler et al. (2013) suggested using similar tests
designed to determine student content knowledge as a more appropriate measure to determine
teacher knowledge than other measures like college course, GPA, degrees, or certifications. The
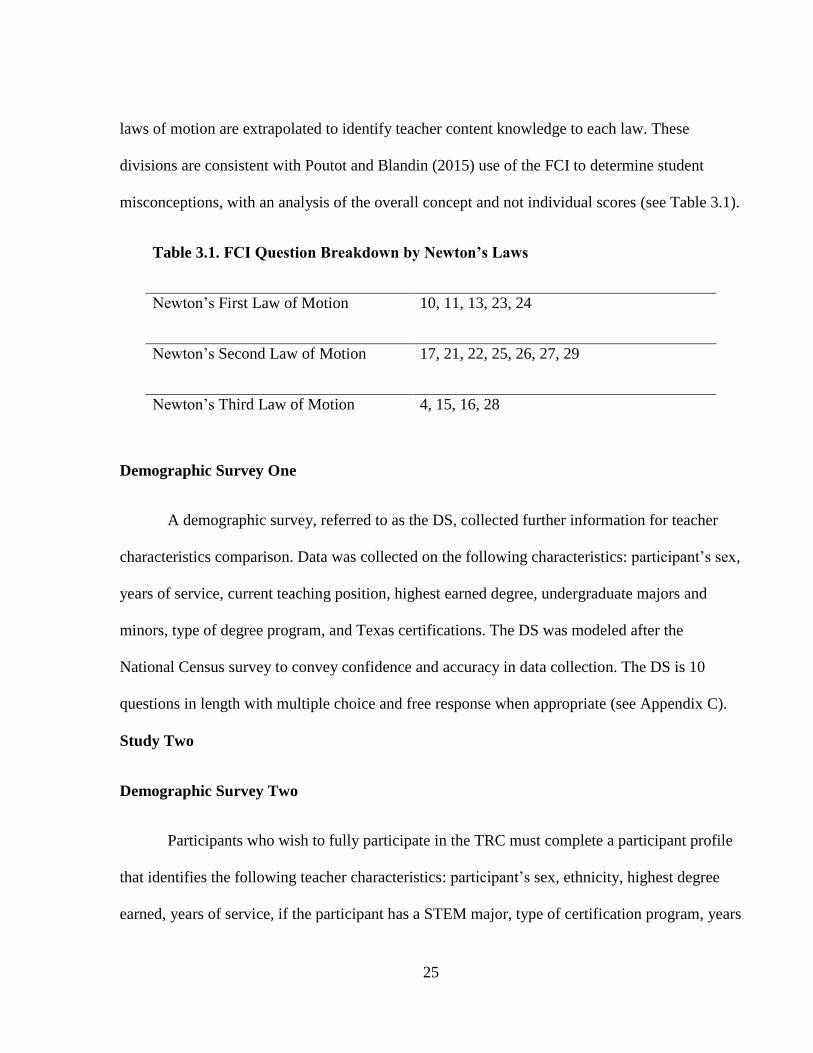
FCI is used in its entirety. FCI questions that identify conceptual knowledge of Newton’s three
25
laws of motion are extrapolated to identify teacher content knowledge to each law. These
divisions are consistent with Poutot and Blandin (2015) use of the FCI to determine student
misconceptions, with an analysis of the overall concept and not individual scores (see Table 3.1).
Table 3.1. FCI Question Breakdown by Newton’s Laws
Newton’s First Law of Motion 10, 11, 13, 23, 24
Newton’s Second Law of Motion 17, 21, 22, 25, 26, 27, 29
Newton’s Third Law of Motion 4, 15, 16, 28
Demographic Survey One
A demographic survey, referred to as the DS, collected further information for teacher
characteristics comparison. Data was collected on the following characteristics: participant’s sex,
years of service, current teaching position, highest earned degree, undergraduate majors and
minors, type of degree program, and Texas certifications. The DS was modeled after the
National Census survey to convey confidence and accuracy in data collection. The DS is 10
questions in length with multiple choice and free response when appropriate (see Appendix C).
Study Two
Demographic Survey Two
Participants who wish to fully participate in the TRC must complete a participant profile
that identifies the following teacher characteristics: participant’s sex, ethnicity, highest degree
earned, years of service, if the participant has a STEM major, type of certification program, years
26
of participation in the TRC, teaching position for the 2013-2014 school year, grades or subjects
taught by the participant in the 2013-2014 school year, and demographic information about the
student population taught by the participant. The TRC location is also recorded by region. For
this study, the following teacher characteristics were assessed: region, participant’s sex, highest
degree earned, years of service, STEM major, and grades or subjects taught by the participant.
Questions are multiple choice and free response when appropriate (see Appendix D).
Content Knowledge Instrument Two
The TRC requested that Dr. Mary Urquhart of The University of Texas at Dallas, A TRC
Science Collaborative Project Director and physics educator, create a pre/post assessment for
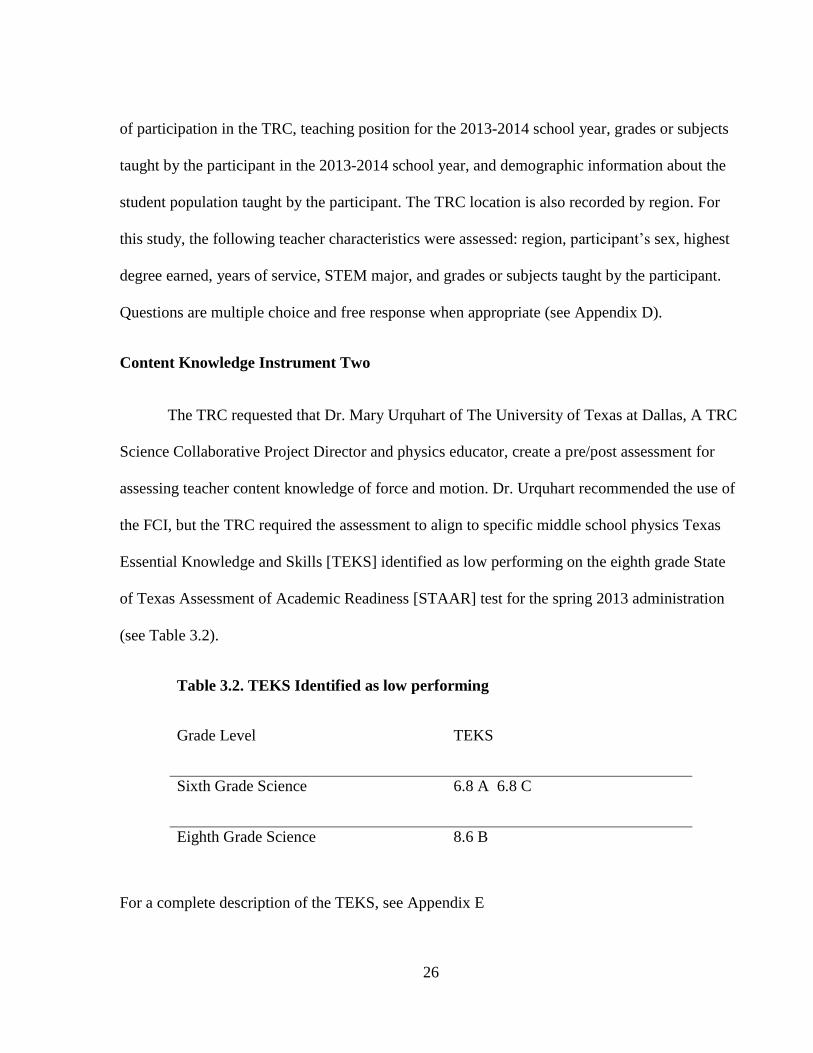
assessing teacher content knowledge of force and motion. Dr. Urquhart recommended the use of
the FCI, but the TRC required the assessment to align to specific middle school physics Texas
Essential Knowledge and Skills [TEKS] identified as low performing on the eighth grade State
of Texas Assessment of Academic Readiness [STAAR] test for the spring 2013 administration
(see Table 3.2).
Table 3.2. TEKS Identified as low performing
Grade Level TEKS
Sixth Grade Science 6.8 A 6.8 C
Eighth Grade Science 8.6 B
For a complete description of the TEKS, see Appendix E
27
Each of the TEKS had been identified by the Texas Education Agency as low performing on the
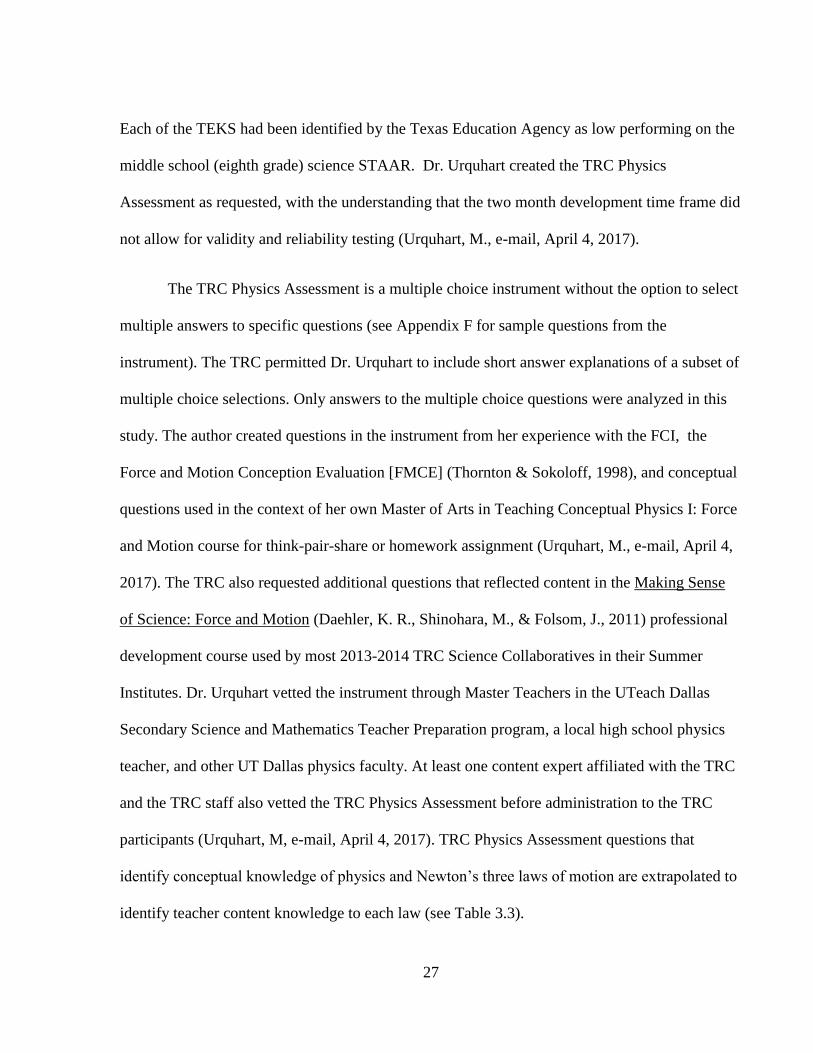
middle school (eighth grade) science STAAR. Dr. Urquhart created the TRC Physics
Assessment as requested, with the understanding that the two month development time frame did
not allow for validity and reliability testing (Urquhart, M., e-mail, April 4, 2017).
The TRC Physics Assessment is a multiple choice instrument without the option to select
multiple answers to specific questions (see Appendix F for sample questions from the
instrument). The TRC permitted Dr. Urquhart to include short answer explanations of a subset of
multiple choice selections. Only answers to the multiple choice questions were analyzed in this
study. The author created questions in the instrument from her experience with the FCI, the
Force and Motion Conception Evaluation [FMCE] (Thornton & Sokoloff, 1998), and conceptual
questions used in the context of her own Master of Arts in Teaching Conceptual Physics I: Force
and Motion course for think-pair-share or homework assignment (Urquhart, M., e-mail, April 4,
2017). The TRC also requested additional questions that reflected content in the Making Sense
of Science: Force and Motion (Daehler, K. R., Shinohara, M., & Folsom, J., 2011) professional
development course used by most 2013-2014 TRC Science Collaboratives in their Summer
Institutes. Dr. Urquhart vetted the instrument through Master Teachers in the UTeach Dallas
Secondary Science and Mathematics Teacher Preparation program, a local high school physics
teacher, and other UT Dallas physics faculty. At least one content expert affiliated with the TRC
and the TRC staff also vetted the TRC Physics Assessment before administration to the TRC
participants (Urquhart, M, e-mail, April 4, 2017). TRC Physics Assessment questions that
identify conceptual knowledge of physics and Newton’s three laws of motion are extrapolated to
identify teacher content knowledge to each law (see Table 3.3).
28
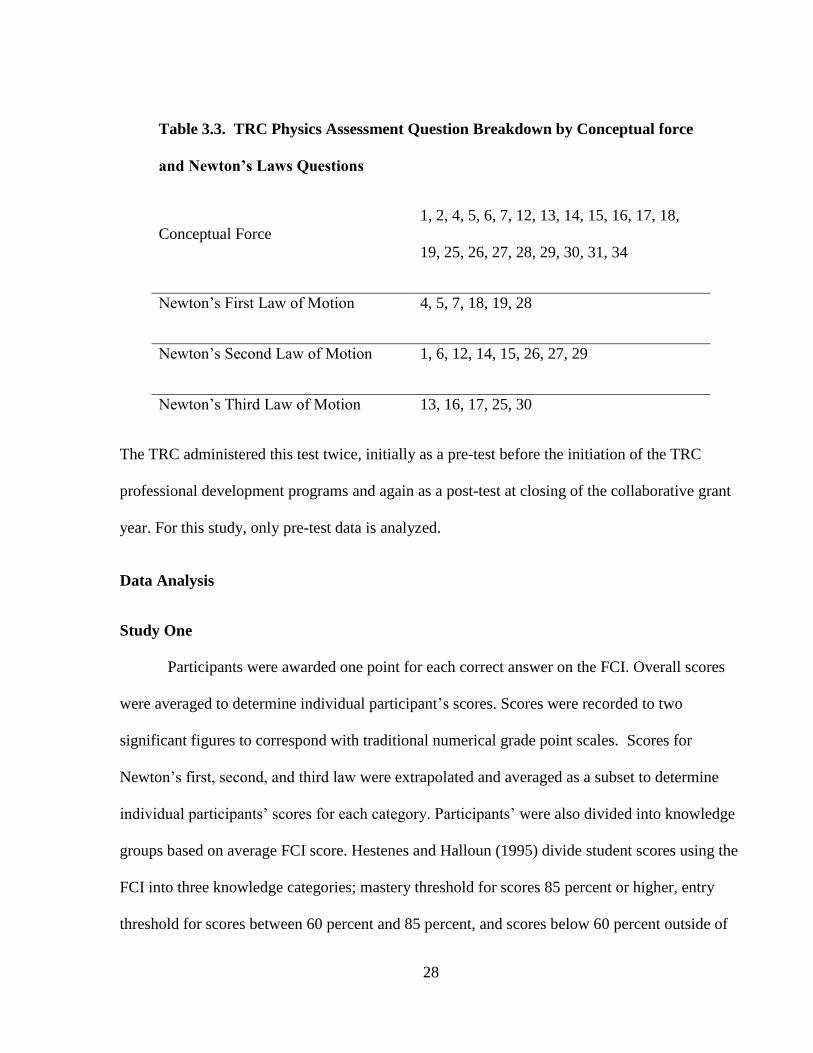
Table 3.3. TRC Physics Assessment Question Breakdown by Conceptual force
and Newton’s Laws Questions
Conceptual Force
1, 2, 4, 5, 6, 7, 12, 13, 14, 15, 16, 17, 18,
19, 25, 26, 27, 28, 29, 30, 31, 34
Newton’s First Law of Motion 4, 5, 7, 18, 19, 28
Newton’s Second Law of Motion 1, 6, 12, 14, 15, 26, 27, 29
Newton’s Third Law of Motion 13, 16, 17, 25, 30
The TRC administered this test twice, initially as a pre-test before the initiation of the TRC
professional development programs and again as a post-test at closing of the collaborative grant
year. For this study, only pre-test data is analyzed.
Data Analysis
Study One
Participants were awarded one point for each correct answer on the FCI. Overall scores
were averaged to determine individual participant’s scores. Scores were recorded to two
significant figures to correspond with traditional numerical grade point scales. Scores for
Newton’s first, second, and third law were extrapolated and averaged as a subset to determine
individual participants’ scores for each category. Participants’ were also divided into knowledge
groups based on average FCI score. Hestenes and Halloun (1995) divide student scores using the
FCI into three knowledge categories; mastery threshold for scores 85 percent or higher, entry
threshold for scores between 60 percent and 85 percent, and scores below 60 percent outside of
29
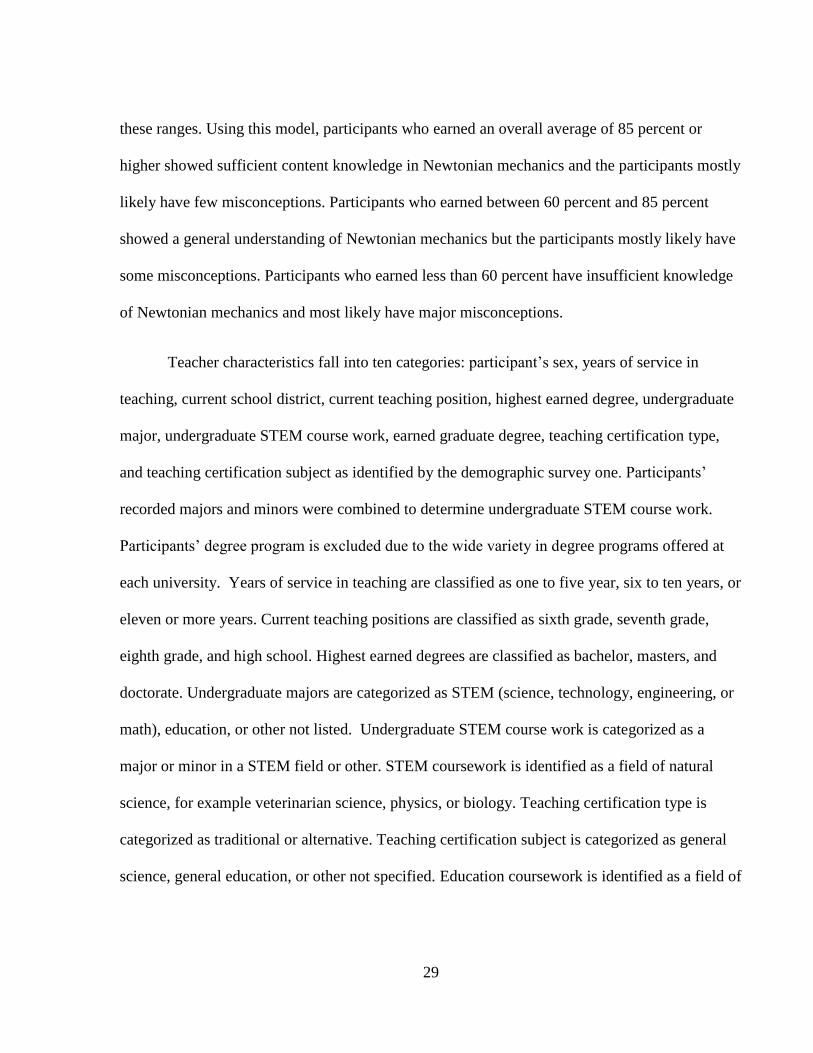
these ranges. Using this model, participants who earned an overall average of 85 percent or
higher showed sufficient content knowledge in Newtonian mechanics and the participants mostly
likely have few misconceptions. Participants who earned between 60 percent and 85 percent
showed a general understanding of Newtonian mechanics but the participants mostly likely have
some misconceptions. Participants who earned less than 60 percent have insufficient knowledge
of Newtonian mechanics and most likely have major misconceptions.
Teacher characteristics fall into ten categories: participant’s sex, years of service in
teaching, current school district, current teaching position, highest earned degree, undergraduate
major, undergraduate STEM course work, earned graduate degree, teaching certification type,
and teaching certification subject as identified by the demographic survey one. Participants’
recorded majors and minors were combined to determine undergraduate STEM course work.
Participants’ degree program is excluded due to the wide variety in degree programs offered at
each university. Years of service in teaching are classified as one to five year, six to ten years, or
eleven or more years. Current teaching positions are classified as sixth grade, seventh grade,
eighth grade, and high school. Highest earned degrees are classified as bachelor, masters, and
doctorate. Undergraduate majors are categorized as STEM (science, technology, engineering, or
math), education, or other not listed. Undergraduate STEM course work is categorized as a
major or minor in a STEM field or other. STEM coursework is identified as a field of natural
science, for example veterinarian science, physics, or biology. Teaching certification type is
categorized as traditional or alternative. Teaching certification subject is categorized as general
science, general education, or other not specified. Education coursework is identified as a field of
30
education including science education, for example middle school science education or bilingual
education.
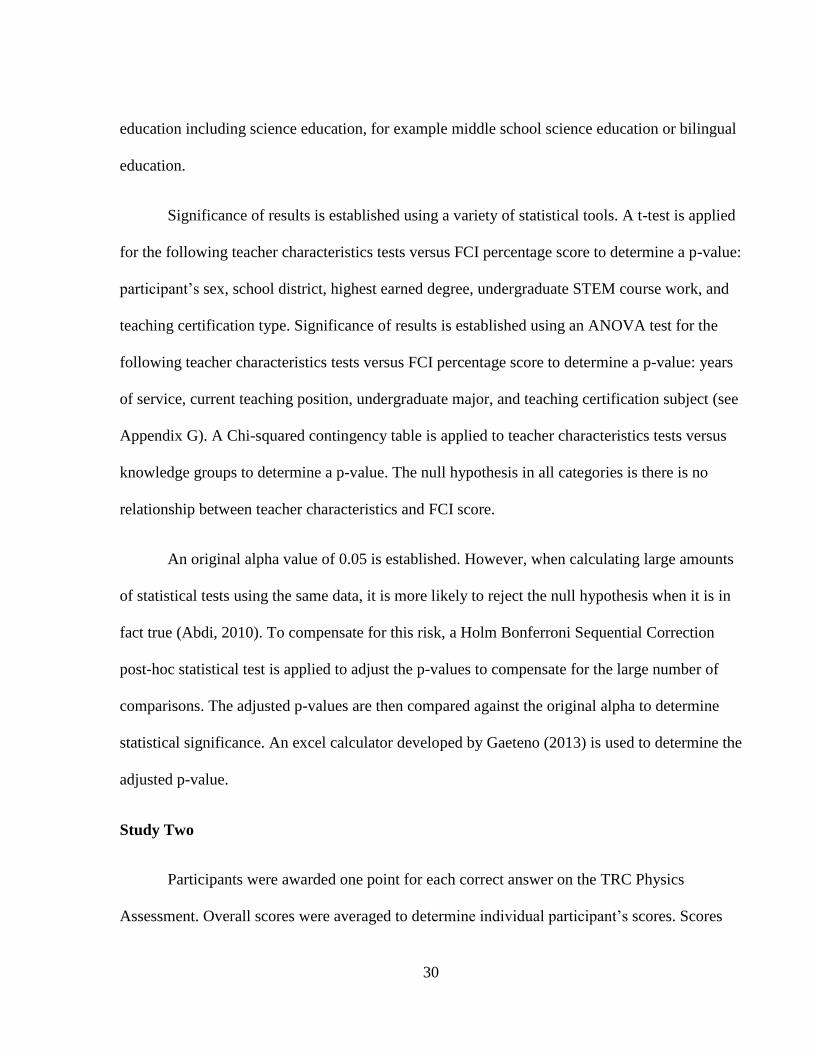
Significance of results is established using a variety of statistical tools. A t-test is applied
for the following teacher characteristics tests versus FCI percentage score to determine a p-value:
participant’s sex, school district, highest earned degree, undergraduate STEM course work, and
teaching certification type. Significance of results is established using an ANOVA test for the
following teacher characteristics tests versus FCI percentage score to determine a p-value: years
of service, current teaching position, undergraduate major, and teaching certification subject (see
Appendix G). A Chi-squared contingency table is applied to teacher characteristics tests versus
knowledge groups to determine a p-value. The null hypothesis in all categories is there is no
relationship between teacher characteristics and FCI score.
An original alpha value of 0.05 is established. However, when calculating large amounts
of statistical tests using the same data, it is more likely to reject the null hypothesis when it is in
fact true (Abdi, 2010). To compensate for this risk, a Holm Bonferroni Sequential Correction
post-hoc statistical test is applied to adjust the p-values to compensate for the large number of
comparisons. The adjusted p-values are then compared against the original alpha to determine
statistical significance. An excel calculator developed by Gaeteno (2013) is used to determine the
adjusted p-value.
Study Two
Participants were awarded one point for each correct answer on the TRC Physics
Assessment. Overall scores were averaged to determine individual participant’s scores. Scores
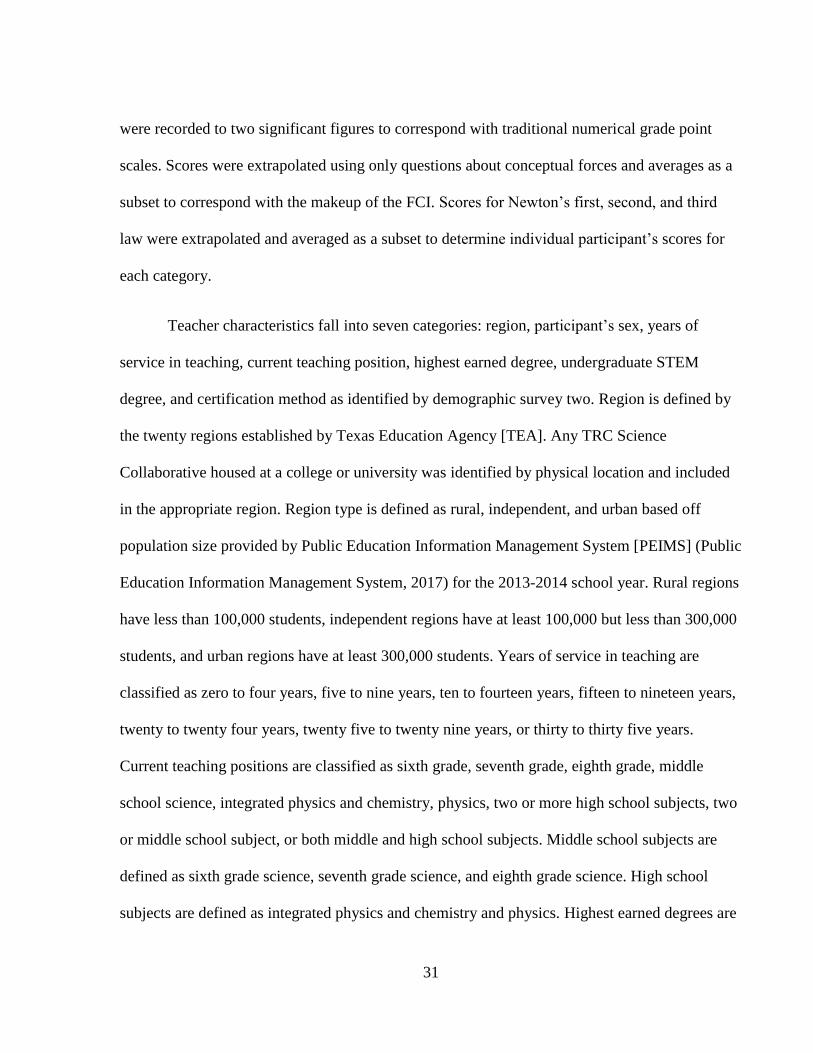
31
were recorded to two significant figures to correspond with traditional numerical grade point
scales. Scores were extrapolated using only questions about conceptual forces and averages as a
subset to correspond with the makeup of the FCI. Scores for Newton’s first, second, and third
law were extrapolated and averaged as a subset to determine individual participant’s scores for
each category.
Teacher characteristics fall into seven categories: region, participant’s sex, years of
service in teaching, current teaching position, highest earned degree, undergraduate STEM
degree, and certification method as identified by demographic survey two. Region is defined by
the twenty regions established by Texas Education Agency [TEA]. Any TRC Science
Collaborative housed at a college or university was identified by physical location and included
in the appropriate region. Region type is defined as rural, independent, and urban based off
population size provided by Public Education Information Management System [PEIMS] (Public
Education Information Management System, 2017) for the 2013-2014 school year. Rural regions
have less than 100,000 students, independent regions have at least 100,000 but less than 300,000
students, and urban regions have at least 300,000 students. Years of service in teaching are
classified as zero to four years, five to nine years, ten to fourteen years, fifteen to nineteen years,
twenty to twenty four years, twenty five to twenty nine years, or thirty to thirty five years.
Current teaching positions are classified as sixth grade, seventh grade, eighth grade, middle
school science, integrated physics and chemistry, physics, two or more high school subjects, two
or middle school subject, or both middle and high school subjects. Middle school subjects are
defined as sixth grade science, seventh grade science, and eighth grade science. High school
subjects are defined as integrated physics and chemistry and physics. Highest earned degrees are
32
classified as bachelor, masters, and doctorate. Teaching certification type is categorized as
traditional and alternative.
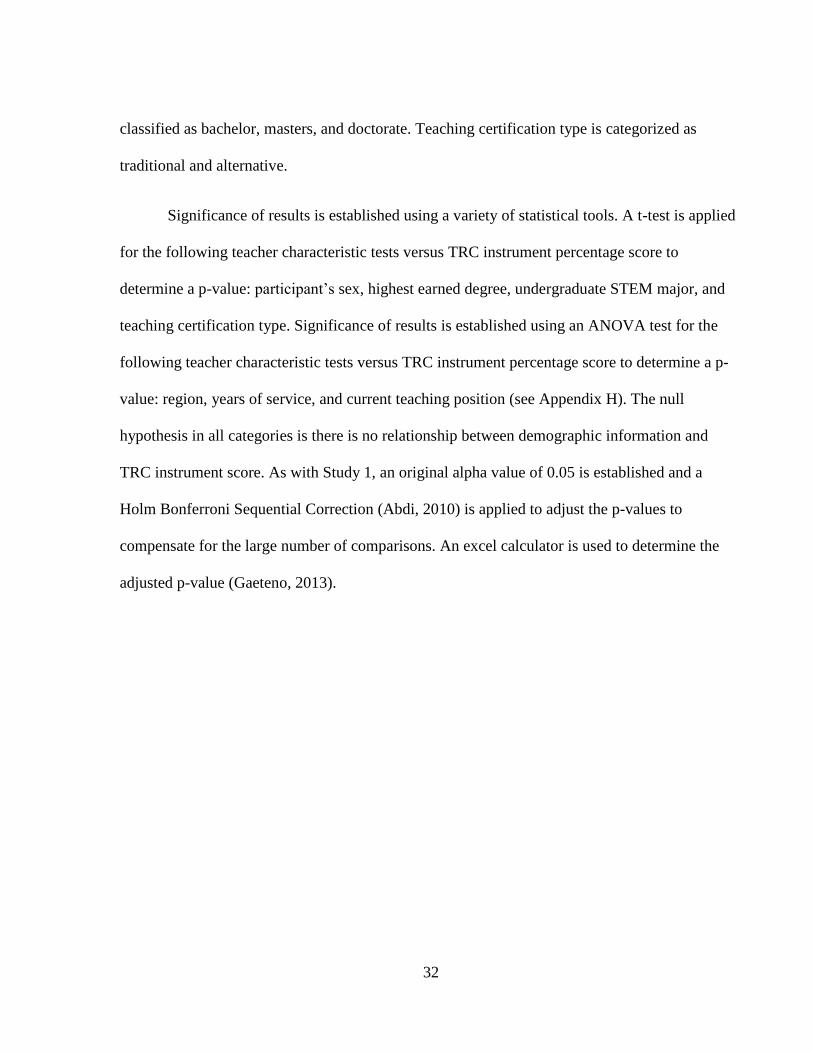
Significance of results is established using a variety of statistical tools. A t-test is applied
for the following teacher characteristic tests versus TRC instrument percentage score to
determine a p-value: participant’s sex, highest earned degree, undergraduate STEM major, and
teaching certification type. Significance of results is established using an ANOVA test for the
following teacher characteristic tests versus TRC instrument percentage score to determine a p-
value: region, years of service, and current teaching position (see Appendix H). The null
hypothesis in all categories is there is no relationship between demographic information and
TRC instrument score. As with Study 1, an original alpha value of 0.05 is established and a
Holm Bonferroni Sequential Correction (Abdi, 2010) is applied to adjust the p-values to
compensate for the large number of comparisons. An excel calculator is used to determine the
adjusted p-value (Gaeteno, 2013).
33
CHAPTER 4
RESULTS
Study One
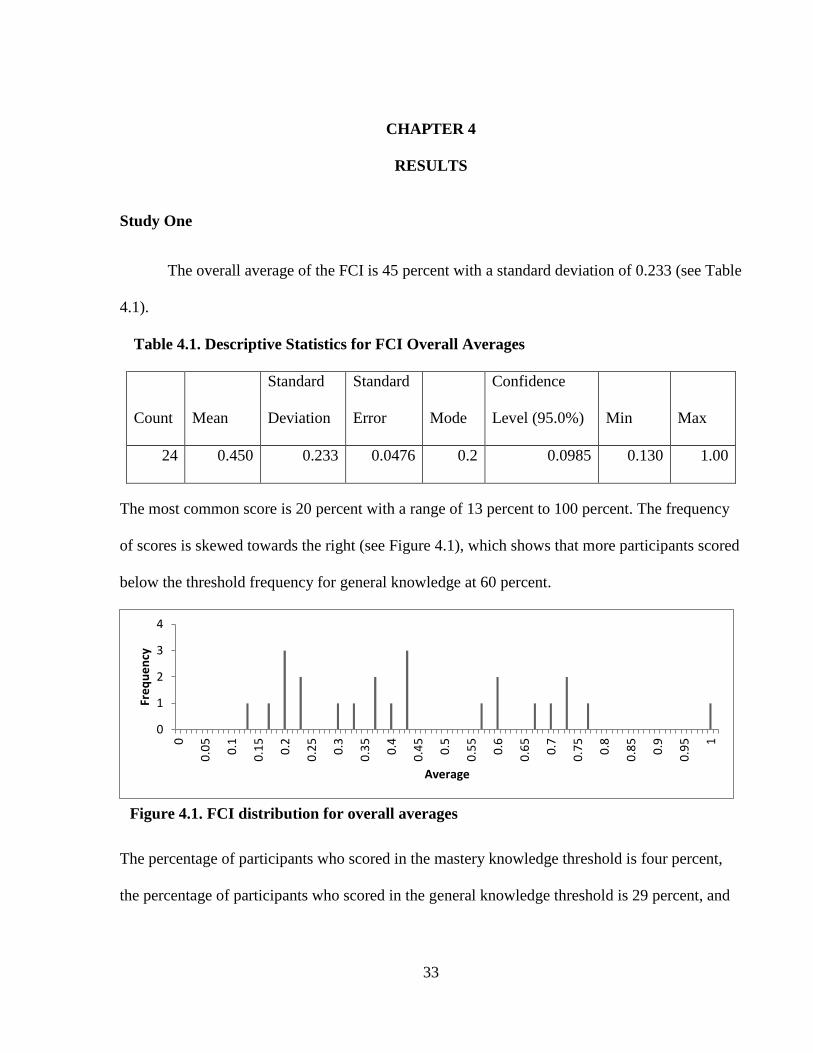
The overall average of the FCI is 45 percent with a standard deviation of 0.233 (see Table
4.1).
Table 4.1. Descriptive Statistics for FCI Overall Averages
Count Mean
Standard
Deviation
Standard
Error Mode
Confidence
Level (95.0%) Min Max
24 0.450 0.233 0.0476 0.2 0.0985 0.130 1.00
The most common score is 20 percent with a range of 13 percent to 100 percent. The frequency
of scores is skewed towards the right (see Figure 4.1), which shows that more participants scored
below the threshold frequency for general knowledge at 60 percent.
The percentage of participants who scored in the mastery knowledge threshold is four percent,
the percentage of participants who scored in the general knowledge threshold is 29 percent, and
Figure 4.1. FCI distribution for overall averages
0
1
2
3
4
0
0.0
5
0.1
0.1
5
0.2
0.2
5
0.3
0.3
5
0.4
0.4
5
0.5
0.5
5
0.6
0.6
5
0.7
0.7
5
0.8
0.8
5
0.9
0.9
5 1
Fre
qu
en
cy
Average
34
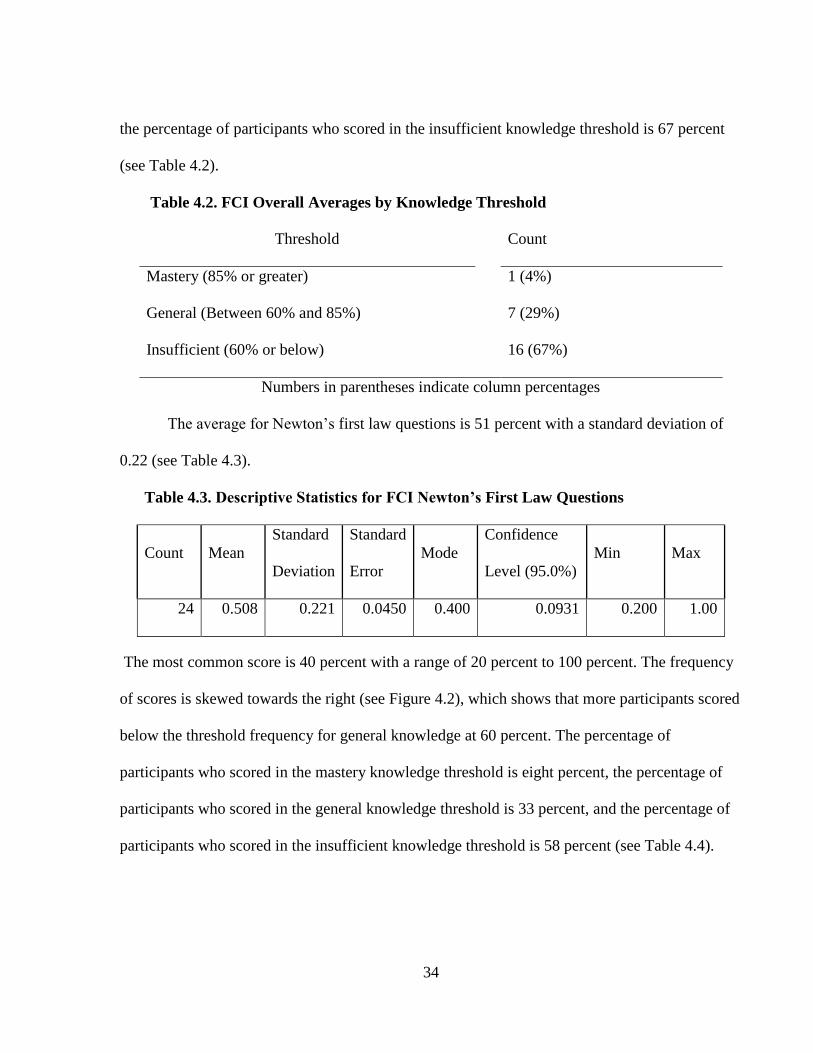
the percentage of participants who scored in the insufficient knowledge threshold is 67 percent
(see Table 4.2).
Table 4.2. FCI Overall Averages by Knowledge Threshold
Threshold
Count
Mastery (85% or greater) 1 (4%)
General (Between 60% and 85%) 7 (29%)
Insufficient (60% or below) 16 (67%)
Numbers in parentheses indicate column percentages
The average for Newton’s first law questions is 51 percent with a standard deviation of
0.22 (see Table 4.3).
Table 4.3. Descriptive Statistics for FCI Newton’s First Law Questions
Count Mean
Standard
Deviation
Standard
Error
Mode
Confidence
Level (95.0%)
Min Max
24 0.508 0.221 0.0450 0.400 0.0931 0.200 1.00
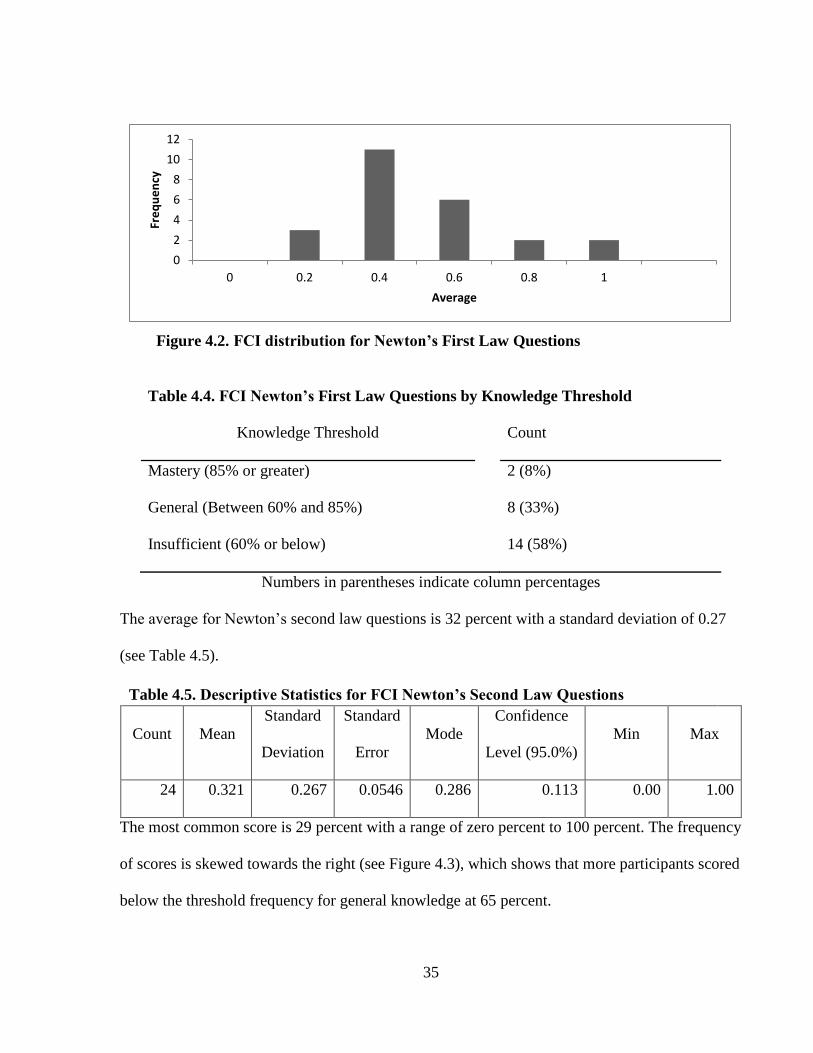
The most common score is 40 percent with a range of 20 percent to 100 percent. The frequency
of scores is skewed towards the right (see Figure 4.2), which shows that more participants scored
below the threshold frequency for general knowledge at 60 percent. The percentage of
participants who scored in the mastery knowledge threshold is eight percent, the percentage of
participants who scored in the general knowledge threshold is 33 percent, and the percentage of
participants who scored in the insufficient knowledge threshold is 58 percent (see Table 4.4).
35
Table 4.4. FCI Newton’s First Law Questions by Knowledge Threshold
Knowledge Threshold
Count
Mastery (85% or greater) 2 (8%)
General (Between 60% and 85%) 8 (33%)
Insufficient (60% or below) 14 (58%)
Numbers in parentheses indicate column percentages
The average for Newton’s second law questions is 32 percent with a standard deviation of 0.27
(see Table 4.5).
Table 4.5. Descriptive Statistics for FCI Newton’s Second Law Questions
Count Mean
Standard
Deviation
Standard
Error
Mode
Confidence
Level (95.0%)
Min Max
24 0.321 0.267 0.0546 0.286 0.113 0.00 1.00
The most common score is 29 percent with a range of zero percent to 100 percent. The frequency
of scores is skewed towards the right (see Figure 4.3), which shows that more participants scored
below the threshold frequency for general knowledge at 65 percent.
Figure 4.2. FCI distribution for Newton’s First Law Questions
0
2
4
6
8
10
12
0 0.2 0.4 0.6 0.8 1
Fre
qu
en
cy
Average
36
The percentage of participants who scored in the mastery knowledge threshold is eight percent,
the percentage of participants who scored in the general knowledge threshold is four percent, and
the percentage of participants who scored in the insufficient knowledge threshold is 88 percent
(see Table 4.6). More participants scored in the insufficient threshold for Newton’s Second Law
than any other category.
Table 4.6. FCI Newton’s Second Law Questions by Knowledge Threshold
Knowledge Threshold
Count
Mastery (85% or greater) 2 (8%)
General (Between 60% and 85%) 1 (4%)
Insufficient (60% or below) 21 (88%)
Numbers in parentheses indicate column percentages
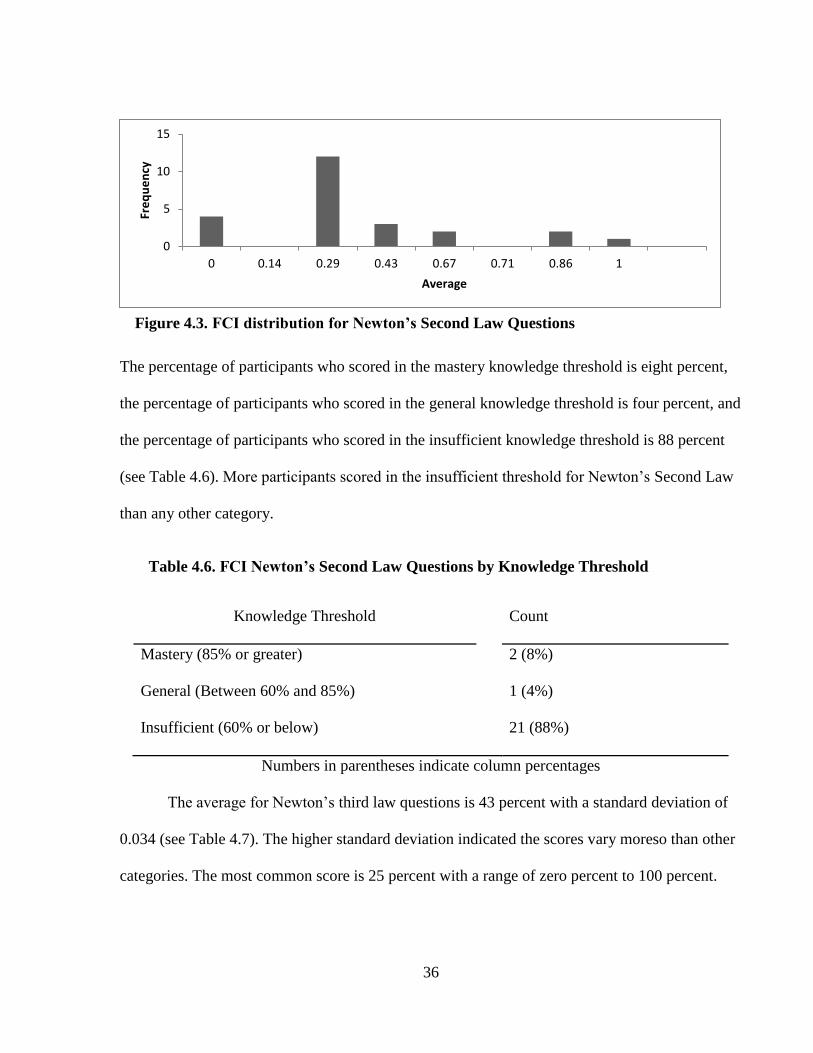
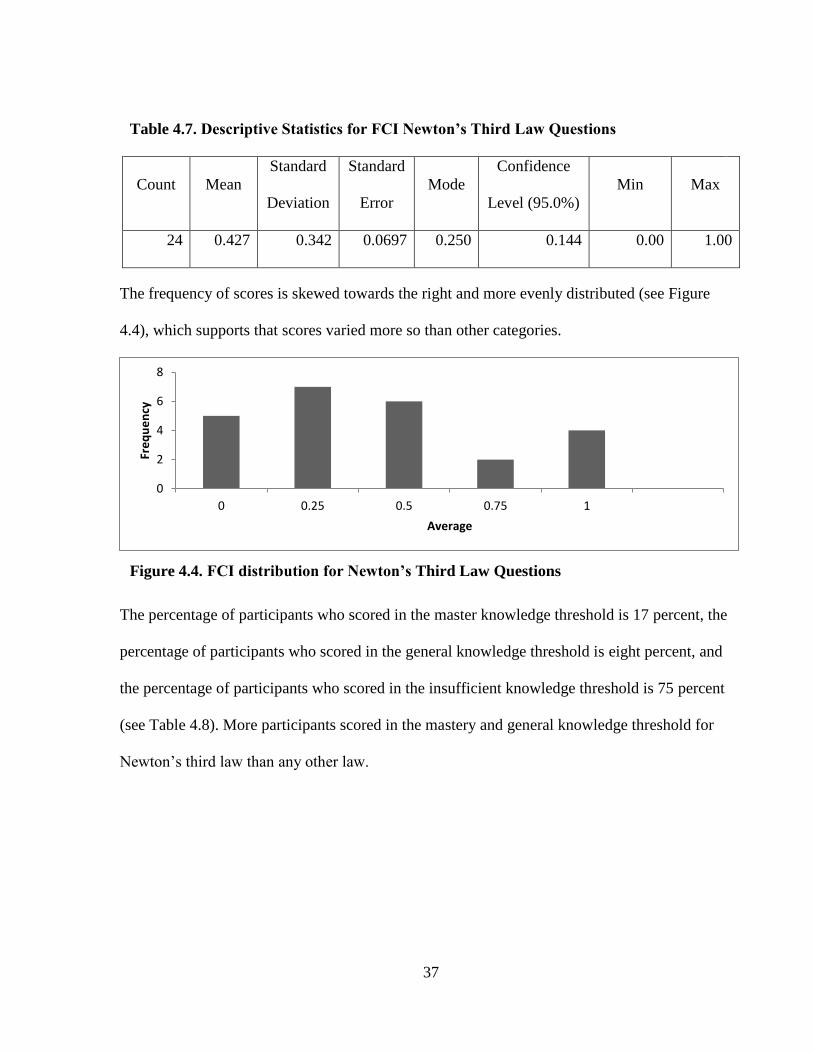
The average for Newton’s third law questions is 43 percent with a standard deviation of
0.034 (see Table 4.7). The higher standard deviation indicated the scores vary moreso than other
categories. The most common score is 25 percent with a range of zero percent to 100 percent.
Figure 4.3. FCI distribution for Newton’s Second Law Questions
0
5
10
15
0 0.14 0.29 0.43 0.67 0.71 0.86 1
Fre
qu
en
cy
Average
37
Table 4.7. Descriptive Statistics for FCI Newton’s Third Law Questions
Count Mean
Standard
Deviation
Standard
Error
Mode
Confidence
Level (95.0%)
Min Max
24 0.427 0.342 0.0697 0.250 0.144 0.00 1.00
The frequency of scores is skewed towards the right and more evenly distributed (see Figure
4.4), which supports that scores varied more so than other categories.
The percentage of participants who scored in the master knowledge threshold is 17 percent, the
percentage of participants who scored in the general knowledge threshold is eight percent, and
the percentage of participants who scored in the insufficient knowledge threshold is 75 percent
(see Table 4.8). More participants scored in the mastery and general knowledge threshold for
Newton’s third law than any other law.
Figure 4.4. FCI distribution for Newton’s Third Law Questions
0
2
4
6
8
0 0.25 0.5 0.75 1
Fre
qu
en
cy
Average
38
Table 4.8. FCI Newton’s Third Law Questions by Knowledge Threshold
Knowledge Threshold
Count
Mastery (85% or greater) 4 (17%)
General (Between 60% and 85%) 2 (8%)
Insufficient (60% or below) 18 (75%)
Numbers in parentheses indicate column percentages
The following statistical tests proved significant after the Holm Bonferroni Sequential
Correction: Overall FCI vs Grades Taught ANOVA, Newton’s third Law vs Grades Taught
ANOVA, and Newton’s Third Law vs Grades Taught Chi-squared Continencey Table.
A one-way between subjects ANOVA was conducted to compare the effect of grade level
taught on FCI overall average in sixth grade, seventh grade, eighth grade, and high school
conditions. There was a significant effect of grade level taught on FCI overall average at the p
<.05 level and adjusted by Holm-Bonferroni Sequential Correction for the four conditions [F (3,
12) = 11.9, p = 0.00107, p’ = 1.63E-6] (see Table 4.9).
Table 4.9. ANOVA of Grade Level FCI Overall Averages
Grade level taught
Sum of
Squares df
Mean
Square F Significance
Between Groups 0.800 3 0.267 11.9 0.000107
Within Groups 0.447 20 0.0223
Total 1.25 23
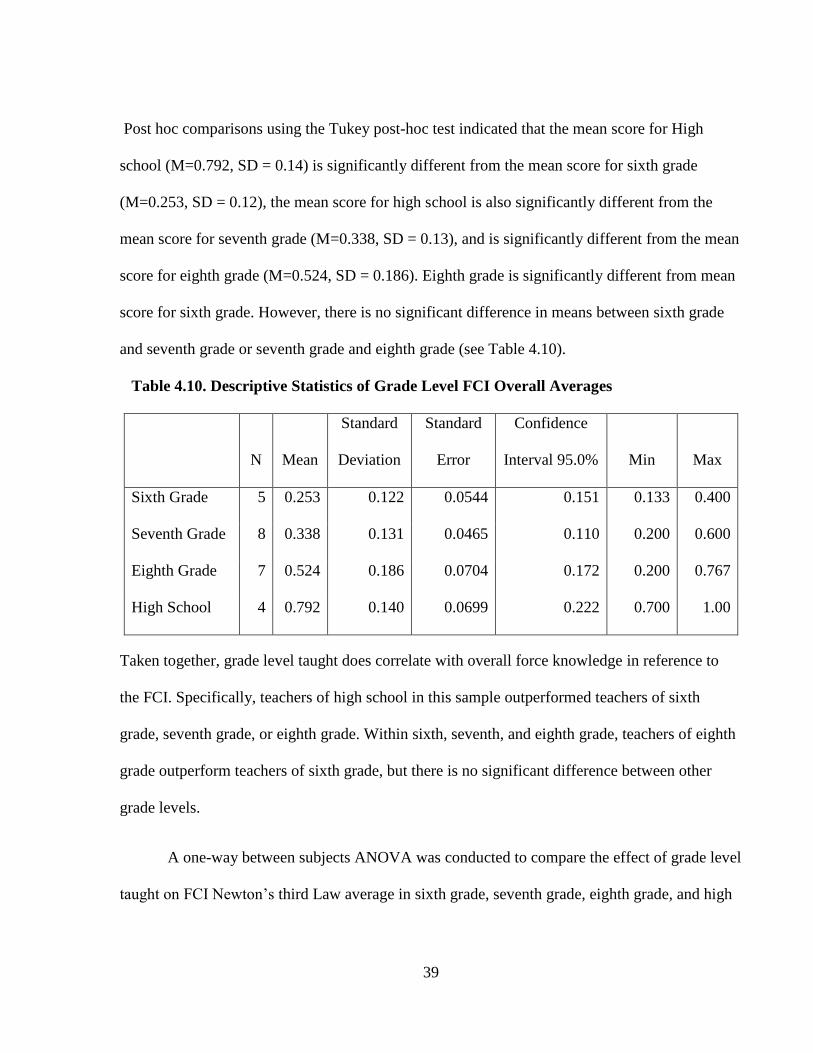
39
Post hoc comparisons using the Tukey post-hoc test indicated that the mean score for High
school (M=0.792, SD = 0.14) is significantly different from the mean score for sixth grade
(M=0.253, SD = 0.12), the mean score for high school is also significantly different from the
mean score for seventh grade (M=0.338, SD = 0.13), and is significantly different from the mean
score for eighth grade (M=0.524, SD = 0.186). Eighth grade is significantly different from mean
score for sixth grade. However, there is no significant difference in means between sixth grade
and seventh grade or seventh grade and eighth grade (see Table 4.10).
Table 4.10. Descriptive Statistics of Grade Level FCI Overall Averages
N Mean
Standard
Deviation
Standard
Error
Confidence
Interval 95.0% Min Max
Sixth Grade 5 0.253 0.122 0.0544 0.151 0.133 0.400
Seventh Grade 8 0.338 0.131 0.0465 0.110 0.200 0.600
Eighth Grade 7 0.524 0.186 0.0704 0.172 0.200 0.767
High School 4 0.792 0.140 0.0699 0.222 0.700 1.00
Taken together, grade level taught does correlate with overall force knowledge in reference to
the FCI. Specifically, teachers of high school in this sample outperformed teachers of sixth
grade, seventh grade, or eighth grade. Within sixth, seventh, and eighth grade, teachers of eighth
grade outperform teachers of sixth grade, but there is no significant difference between other
grade levels.
A one-way between subjects ANOVA was conducted to compare the effect of grade level
taught on FCI Newton’s third Law average in sixth grade, seventh grade, eighth grade, and high
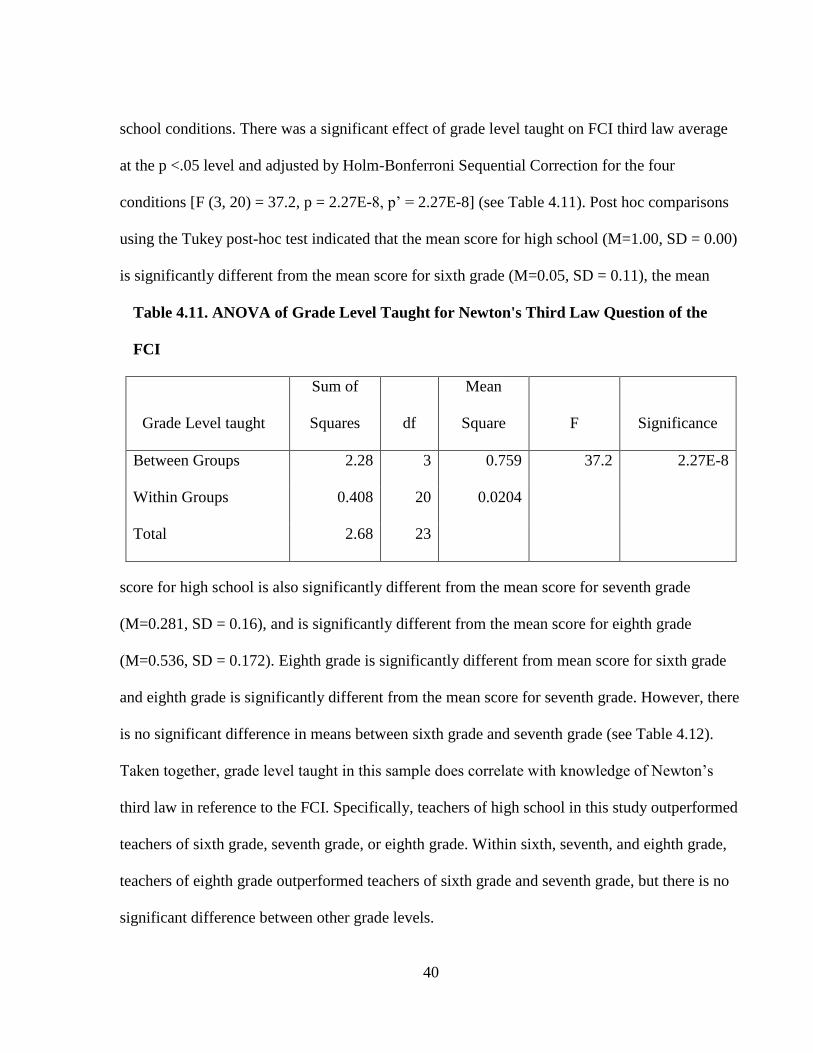
40
school conditions. There was a significant effect of grade level taught on FCI third law average
at the p <.05 level and adjusted by Holm-Bonferroni Sequential Correction for the four
conditions [F (3, 20) = 37.2, p = 2.27E-8, p’ = 2.27E-8] (see Table 4.11). Post hoc comparisons
using the Tukey post-hoc test indicated that the mean score for high school (M=1.00, SD = 0.00)
is significantly different from the mean score for sixth grade (M=0.05, SD = 0.11), the mean
Table 4.11. ANOVA of Grade Level Taught for Newton's Third Law Question of the
FCI
Grade Level taught
Sum of
Squares df
Mean
Square F Significance
Between Groups 2.28 3 0.759 37.2 2.27E-8
Within Groups 0.408 20 0.0204
Total 2.68 23
score for high school is also significantly different from the mean score for seventh grade
(M=0.281, SD = 0.16), and is significantly different from the mean score for eighth grade
(M=0.536, SD = 0.172). Eighth grade is significantly different from mean score for sixth grade
and eighth grade is significantly different from the mean score for seventh grade. However, there
is no significant difference in means between sixth grade and seventh grade (see Table 4.12).
Taken together, grade level taught in this sample does correlate with knowledge of Newton’s
third law in reference to the FCI. Specifically, teachers of high school in this study outperformed
teachers of sixth grade, seventh grade, or eighth grade. Within sixth, seventh, and eighth grade,
teachers of eighth grade outperformed teachers of sixth grade and seventh grade, but there is no
significant difference between other grade levels.
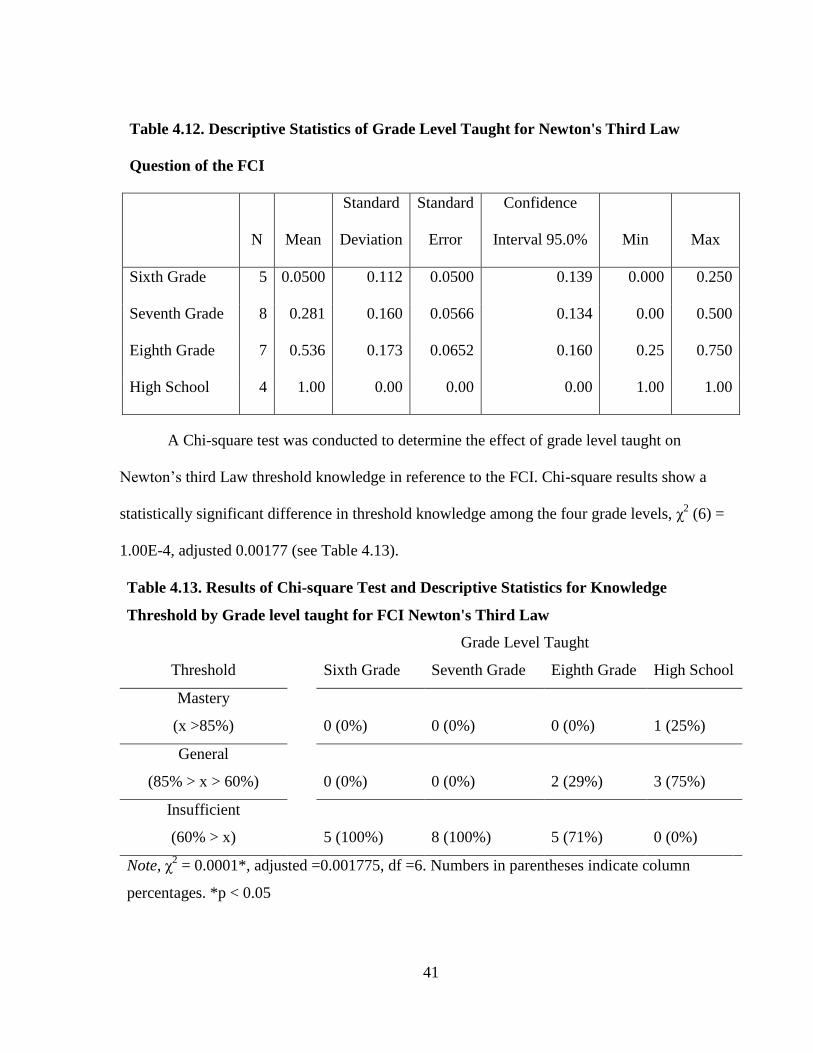
41
Table 4.12. Descriptive Statistics of Grade Level Taught for Newton's Third Law
Question of the FCI
N Mean
Standard
Deviation
Standard
Error
Confidence
Interval 95.0% Min Max
Sixth Grade 5 0.0500 0.112 0.0500 0.139 0.000 0.250
Seventh Grade 8 0.281 0.160 0.0566 0.134 0.00 0.500
Eighth Grade 7 0.536 0.173 0.0652 0.160 0.25 0.750
High School 4 1.00 0.00 0.00 0.00 1.00 1.00
A Chi-square test was conducted to determine the effect of grade level taught on
Newton’s third Law threshold knowledge in reference to the FCI. Chi-square results show a
statistically significant difference in threshold knowledge among the four grade levels, χ2 (6) =
1.00E-4, adjusted 0.00177 (see Table 4.13).
Table 4.13. Results of Chi-square Test and Descriptive Statistics for Knowledge
Threshold by Grade level taught for FCI Newton's Third Law
Grade Level Taught
Threshold
Sixth Grade Seventh Grade Eighth Grade High School
Mastery
(x >85%)
0 (0%) 0 (0%) 0 (0%) 1 (25%)
General
(85% > x > 60%)
0 (0%) 0 (0%) 2 (29%) 3 (75%)
Insufficient
(60% > x) 5 (100%) 8 (100%) 5 (71%) 0 (0%)
Note, χ2 = 0.0001*, adjusted =0.001775, df =6. Numbers in parentheses indicate column
percentages. *p < 0.05
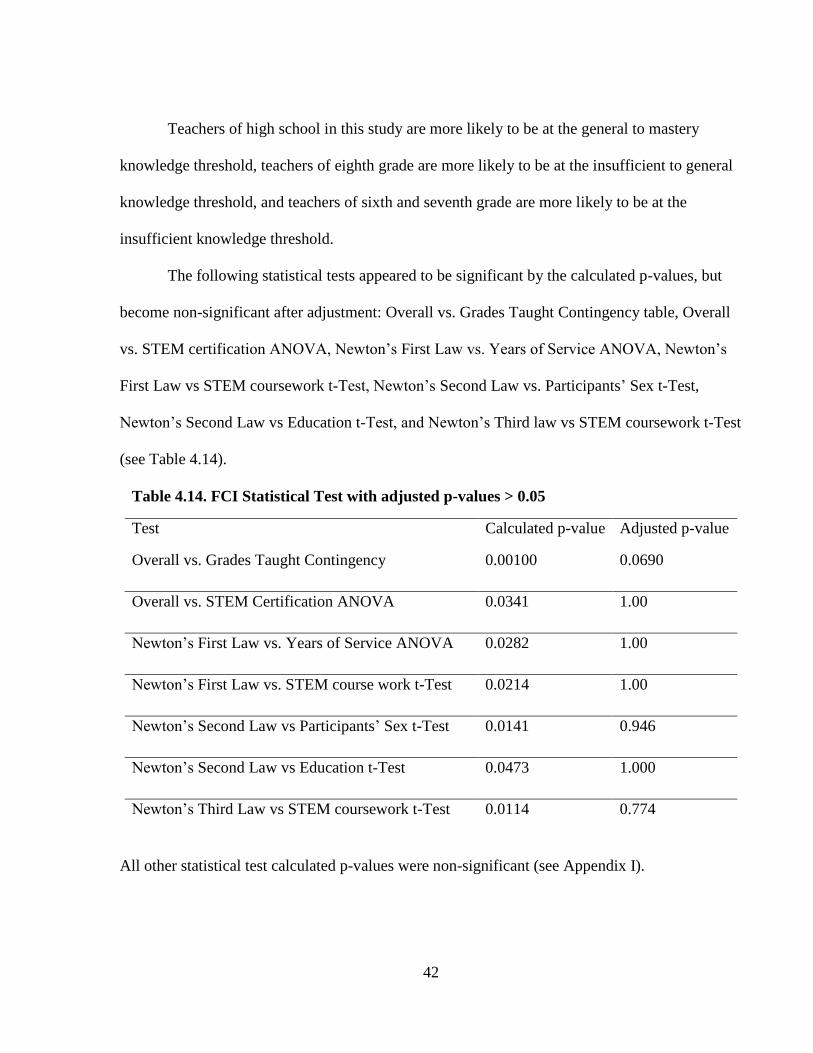
42
Teachers of high school in this study are more likely to be at the general to mastery
knowledge threshold, teachers of eighth grade are more likely to be at the insufficient to general
knowledge threshold, and teachers of sixth and seventh grade are more likely to be at the
insufficient knowledge threshold.
The following statistical tests appeared to be significant by the calculated p-values, but
become non-significant after adjustment: Overall vs. Grades Taught Contingency table, Overall
vs. STEM certification ANOVA, Newton’s First Law vs. Years of Service ANOVA, Newton’s
First Law vs STEM coursework t-Test, Newton’s Second Law vs. Participants’ Sex t-Test,
Newton’s Second Law vs Education t-Test, and Newton’s Third law vs STEM coursework t-Test
(see Table 4.14).
Table 4.14. FCI Statistical Test with adjusted p-values > 0.05
Test Calculated p-value Adjusted p-value
Overall vs. Grades Taught Contingency 0.00100 0.0690
Overall vs. STEM Certification ANOVA 0.0341 1.00
Newton’s First Law vs. Years of Service ANOVA 0.0282 1.00
Newton’s First Law vs. STEM course work t-Test 0.0214 1.00
Newton’s Second Law vs Participants’ Sex t-Test 0.0141 0.946
Newton’s Second Law vs Education t-Test 0.0473 1.000
Newton’s Third Law vs STEM coursework t-Test 0.0114 0.774
All other statistical test calculated p-values were non-significant (see Appendix I).
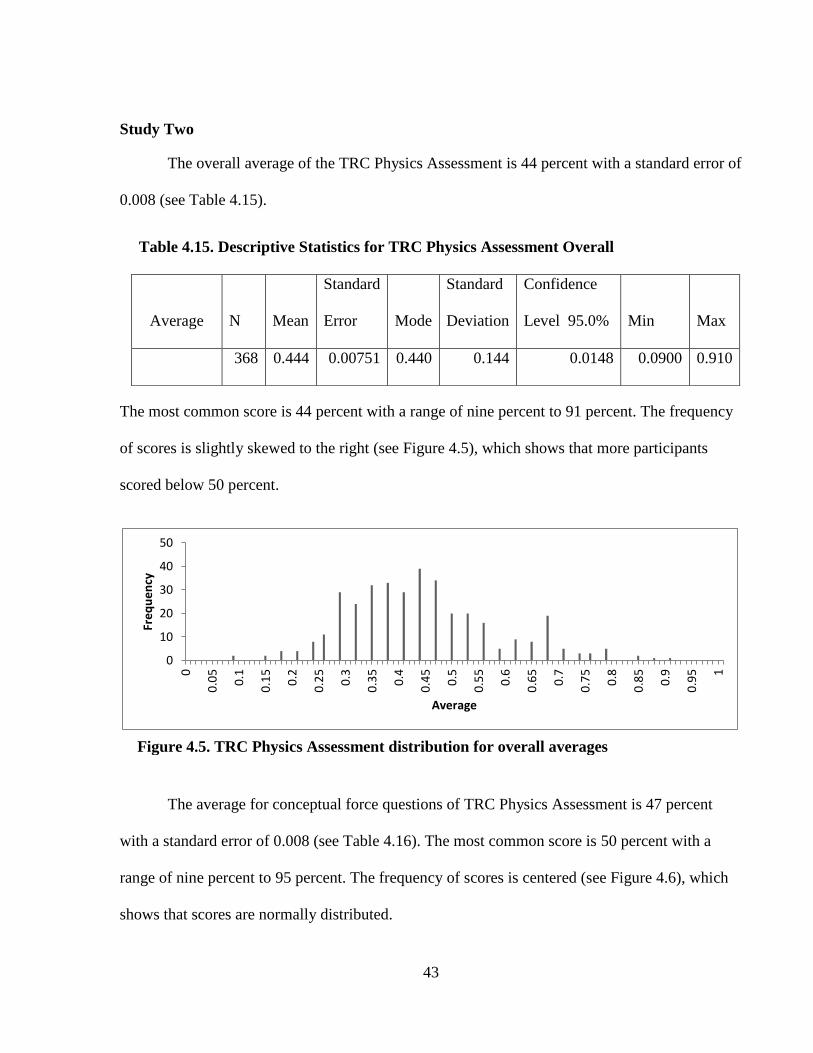
43
Study Two
The overall average of the TRC Physics Assessment is 44 percent with a standard error of
0.008 (see Table 4.15).
The most common score is 44 percent with a range of nine percent to 91 percent. The frequency
of scores is slightly skewed to the right (see Figure 4.5), which shows that more participants
scored below 50 percent.
The average for conceptual force questions of TRC Physics Assessment is 47 percent
with a standard error of 0.008 (see Table 4.16). The most common score is 50 percent with a
range of nine percent to 95 percent. The frequency of scores is centered (see Figure 4.6), which
shows that scores are normally distributed.
Table 4.15. Descriptive Statistics for TRC Physics Assessment Overall
Average N Mean
Standard
Error Mode
Standard
Deviation
Confidence
Level 95.0% Min Max
368 0.444 0.00751 0.440 0.144 0.0148 0.0900 0.910
0
10
20
30
40
50
0
0.0
5
0.1
0.1
5
0.2
0.2
5
0.3
0.3
5
0.4
0.4
5
0.5
0.5
5
0.6
0.6
5
0.7
0.7
5
0.8
0.8
5
0.9
0.9
5 1
Fre
qu
en
cy
Average
Figure 4.5. TRC Physics Assessment distribution for overall averages
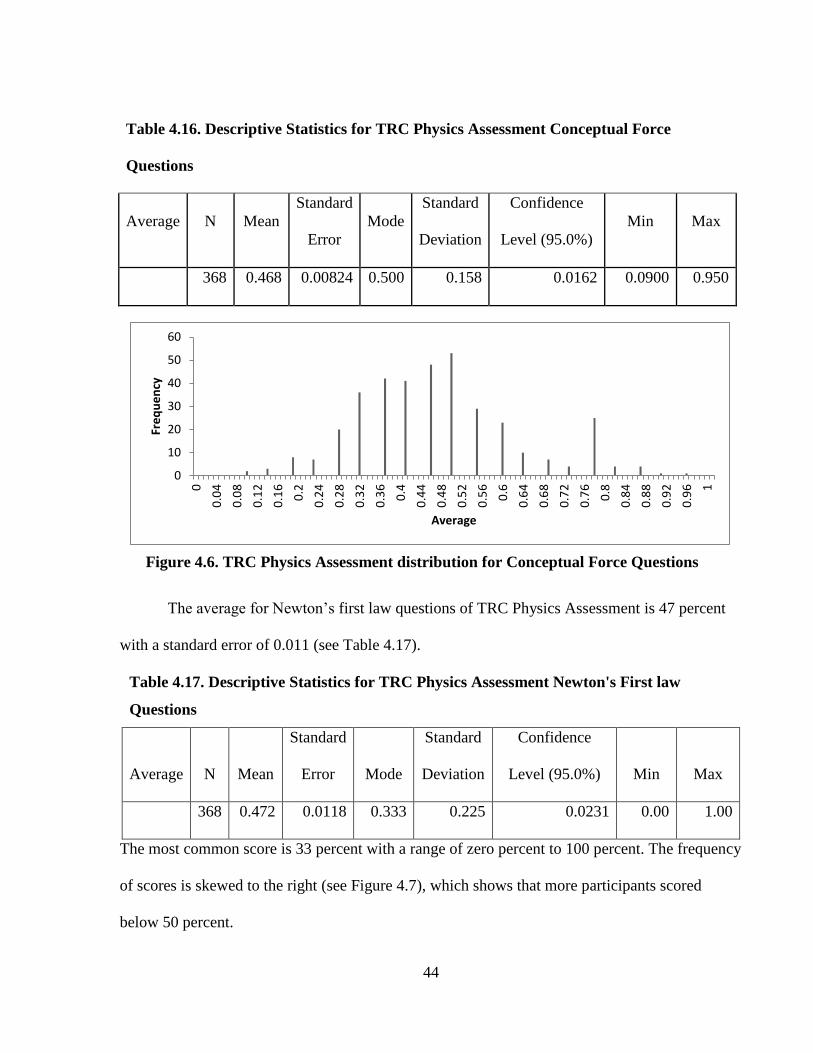
44
Table 4.16. Descriptive Statistics for TRC Physics Assessment Conceptual Force
Questions
Average N Mean
Standard
Error
Mode
Standard
Deviation
Confidence
Level (95.0%)
Min Max
368 0.468 0.00824 0.500 0.158 0.0162 0.0900 0.950
The average for Newton’s first law questions of TRC Physics Assessment is 47 percent
with a standard error of 0.011 (see Table 4.17).
Table 4.17. Descriptive Statistics for TRC Physics Assessment Newton's First law
Questions
Average N Mean
Standard
Error Mode
Standard
Deviation
Confidence
Level (95.0%) Min Max
368 0.472 0.0118 0.333 0.225 0.0231 0.00 1.00
The most common score is 33 percent with a range of zero percent to 100 percent. The frequency
of scores is skewed to the right (see Figure 4.7), which shows that more participants scored
below 50 percent.
0
10
20
30
40
50
60
0
0.0
4
0.0
8
0.1
2
0.1
6
0.2
0.2
4
0.2
8
0.3
2
0.3
6
0.4
0.4
4
0.4
8
0.5
2
0.5
6
0.6
0.6
4
0.6
8
0.7
2
0.7
6
0.8
0.8
4
0.8
8
0.9
2
0.9
6 1
Fre
qu
en
cy
Average
Figure 4.6. TRC Physics Assessment distribution for Conceptual Force Questions
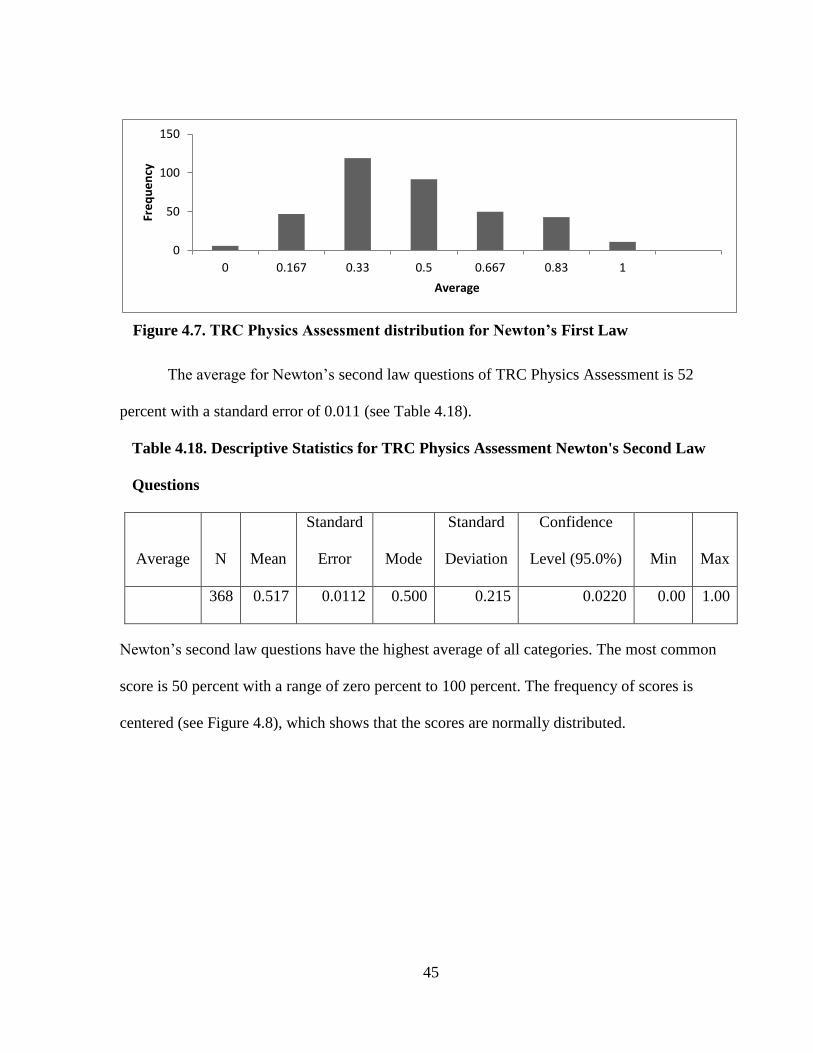
45
The average for Newton’s second law questions of TRC Physics Assessment is 52
percent with a standard error of 0.011 (see Table 4.18).
Table 4.18. Descriptive Statistics for TRC Physics Assessment Newton's Second Law
Questions
Average N Mean
Standard
Error Mode
Standard
Deviation
Confidence
Level (95.0%) Min Max
368 0.517 0.0112 0.500 0.215 0.0220 0.00 1.00
Newton’s second law questions have the highest average of all categories. The most common
score is 50 percent with a range of zero percent to 100 percent. The frequency of scores is
centered (see Figure 4.8), which shows that the scores are normally distributed.
0
50
100
150
0 0.167 0.33 0.5 0.667 0.83 1
Fre
qu
en
cy
Average
Figure 4.7. TRC Physics Assessment distribution for Newton’s First Law
Questions
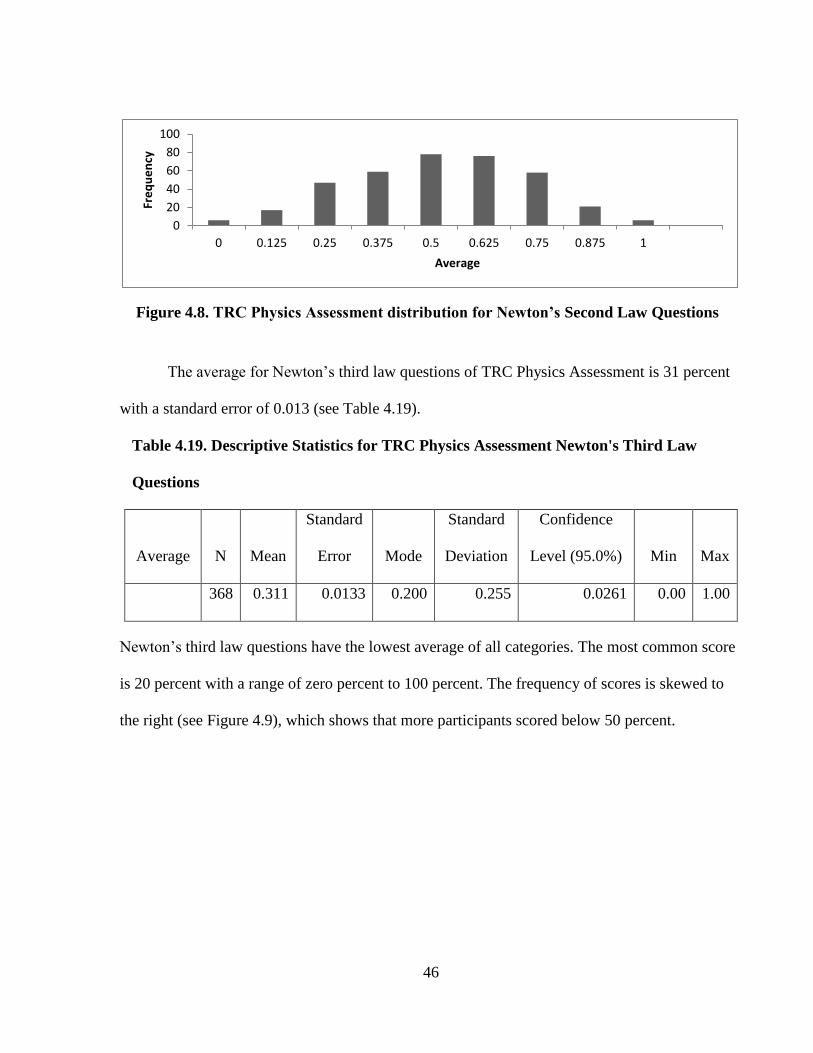
46
The average for Newton’s third law questions of TRC Physics Assessment is 31 percent
with a standard error of 0.013 (see Table 4.19).
Table 4.19. Descriptive Statistics for TRC Physics Assessment Newton's Third Law
Questions
Average N Mean
Standard
Error Mode
Standard
Deviation
Confidence
Level (95.0%) Min Max
368 0.311 0.0133 0.200 0.255 0.0261 0.00 1.00
Newton’s third law questions have the lowest average of all categories. The most common score
is 20 percent with a range of zero percent to 100 percent. The frequency of scores is skewed to
the right (see Figure 4.9), which shows that more participants scored below 50 percent.
0
20
40
60
80
100
0 0.125 0.25 0.375 0.5 0.625 0.75 0.875 1
Fre
qu
en
cy
Average
Figure 4.8. TRC Physics Assessment distribution for Newton’s Second Law Questions
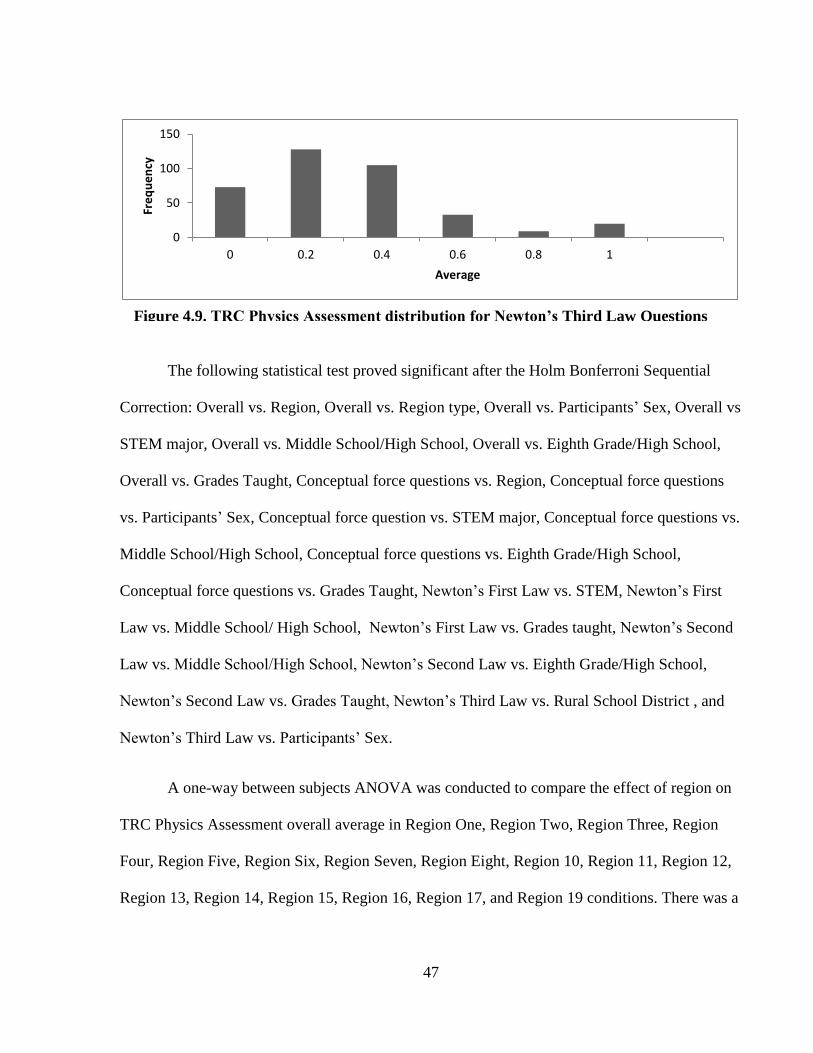
47
The following statistical test proved significant after the Holm Bonferroni Sequential
Correction: Overall vs. Region, Overall vs. Region type, Overall vs. Participants’ Sex, Overall vs
STEM major, Overall vs. Middle School/High School, Overall vs. Eighth Grade/High School,
Overall vs. Grades Taught, Conceptual force questions vs. Region, Conceptual force questions
vs. Participants’ Sex, Conceptual force question vs. STEM major, Conceptual force questions vs.
Middle School/High School, Conceptual force questions vs. Eighth Grade/High School,
Conceptual force questions vs. Grades Taught, Newton’s First Law vs. STEM, Newton’s First
Law vs. Middle School/ High School, Newton’s First Law vs. Grades taught, Newton’s Second
Law vs. Middle School/High School, Newton’s Second Law vs. Eighth Grade/High School,
Newton’s Second Law vs. Grades Taught, Newton’s Third Law vs. Rural School District , and
Newton’s Third Law vs. Participants’ Sex.
A one-way between subjects ANOVA was conducted to compare the effect of region on
TRC Physics Assessment overall average in Region One, Region Two, Region Three, Region
Four, Region Five, Region Six, Region Seven, Region Eight, Region 10, Region 11, Region 12,
Region 13, Region 14, Region 15, Region 16, Region 17, and Region 19 conditions. There was a
0
50
100
150
0 0.2 0.4 0.6 0.8 1
Fre
qu
en
cy
Average
Figure 4.9. TRC Physics Assessment distribution for Newton’s Third Law Questions
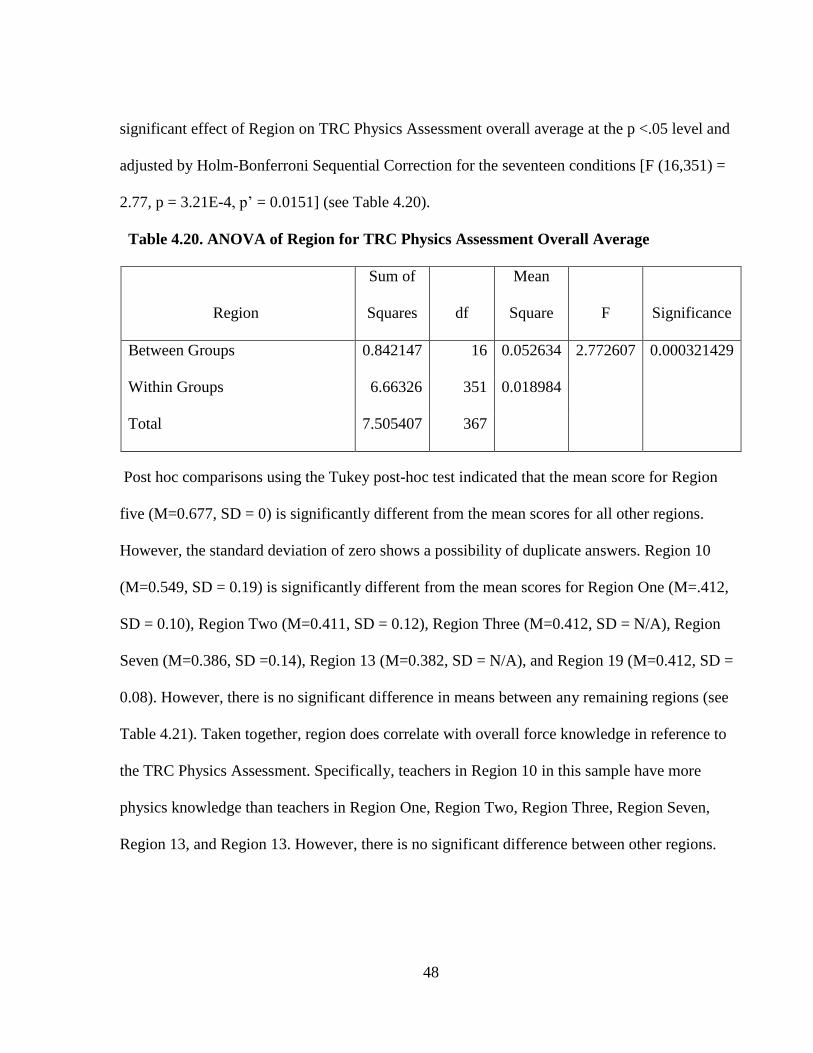
48
significant effect of Region on TRC Physics Assessment overall average at the p <.05 level and
adjusted by Holm-Bonferroni Sequential Correction for the seventeen conditions [F (16,351) =
2.77, p = 3.21E-4, p’ = 0.0151] (see Table 4.20).
Table 4.20. ANOVA of Region for TRC Physics Assessment Overall Average
Region
Sum of
Squares df
Mean
Square F Significance
Between Groups 0.842147 16 0.052634 2.772607 0.000321429
Within Groups 6.66326 351 0.018984
Total 7.505407 367
Post hoc comparisons using the Tukey post-hoc test indicated that the mean score for Region
five (M=0.677, SD = 0) is significantly different from the mean scores for all other regions.
However, the standard deviation of zero shows a possibility of duplicate answers. Region 10
(M=0.549, SD = 0.19) is significantly different from the mean scores for Region One (M=.412,
SD = 0.10), Region Two (M=0.411, SD = 0.12), Region Three (M=0.412, SD = N/A), Region
Seven (M=0.386, SD =0.14), Region 13 (M=0.382, SD = N/A), and Region 19 (M=0.412, SD =
0.08). However, there is no significant difference in means between any remaining regions (see
Table 4.21). Taken together, region does correlate with overall force knowledge in reference to
the TRC Physics Assessment. Specifically, teachers in Region 10 in this sample have more
physics knowledge than teachers in Region One, Region Two, Region Three, Region Seven,
Region 13, and Region 13. However, there is no significant difference between other regions.
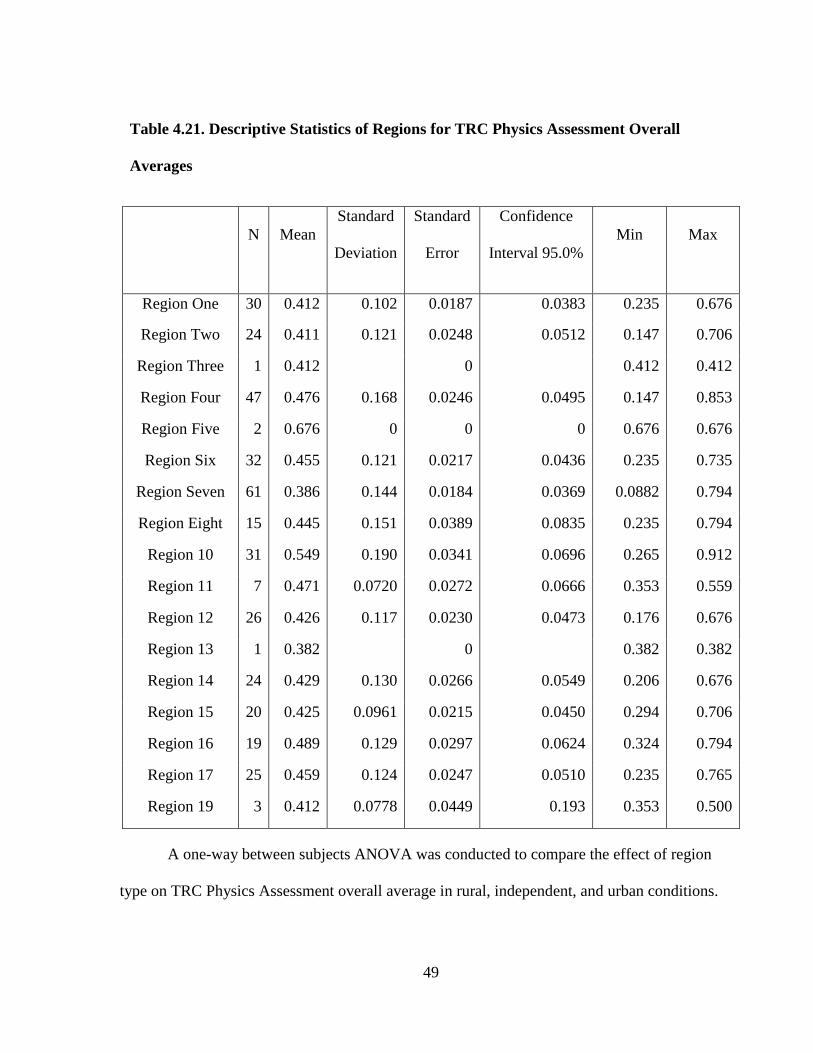
49
Table 4.21. Descriptive Statistics of Regions for TRC Physics Assessment Overall
Averages
N Mean
Standard
Deviation
Standard
Error
Confidence
Interval 95.0%
Min Max
Region One
30 0.412 0.102 0.0187
0.0383 0.235
0.676
Region Two
24 0.411 0.121 0.0248 0.0512 0.147
0.706
Region Three 1 0.412 0 0.412 0.412
Region Four 47 0.476 0.168 0.0246 0.0495 0.147
0.853
Region Five 2 0.676 0 0 0 0.676
0.676
Region Six 32 0.455 0.121 0.0217 0.0436 0.235
0.735
Region Seven 61 0.386 0.144 0.0184 0.0369 0.0882
0.794
Region Eight 15 0.445 0.151 0.0389 0.0835 0.235
0.794
Region 10 31 0.549 0.190 0.0341 0.0696
0.265 0.912
Region 11 7 0.471 0.0720 0.0272 0.0666
0.353 0.559
Region 12 26 0.426 0.117 0.0230 0.0473
0.176
0.676
Region 13 1 0.382 0 0.382
0.382
Region 14 24 0.429 0.130 0.0266 0.0549
0.206 0.676
Region 15 20 0.425 0.0961 0.0215 0.0450 0.294
0.706
Region 16 19 0.489 0.129 0.0297 0.0624 0.324 0.794
Region 17 25 0.459 0.124 0.0247 0.0510
0.235
0.765
Region 19 3 0.412 0.0778 0.0449 0.193
0.353 0.500
A one-way between subjects ANOVA was conducted to compare the effect of region
type on TRC Physics Assessment overall average in rural, independent, and urban conditions.
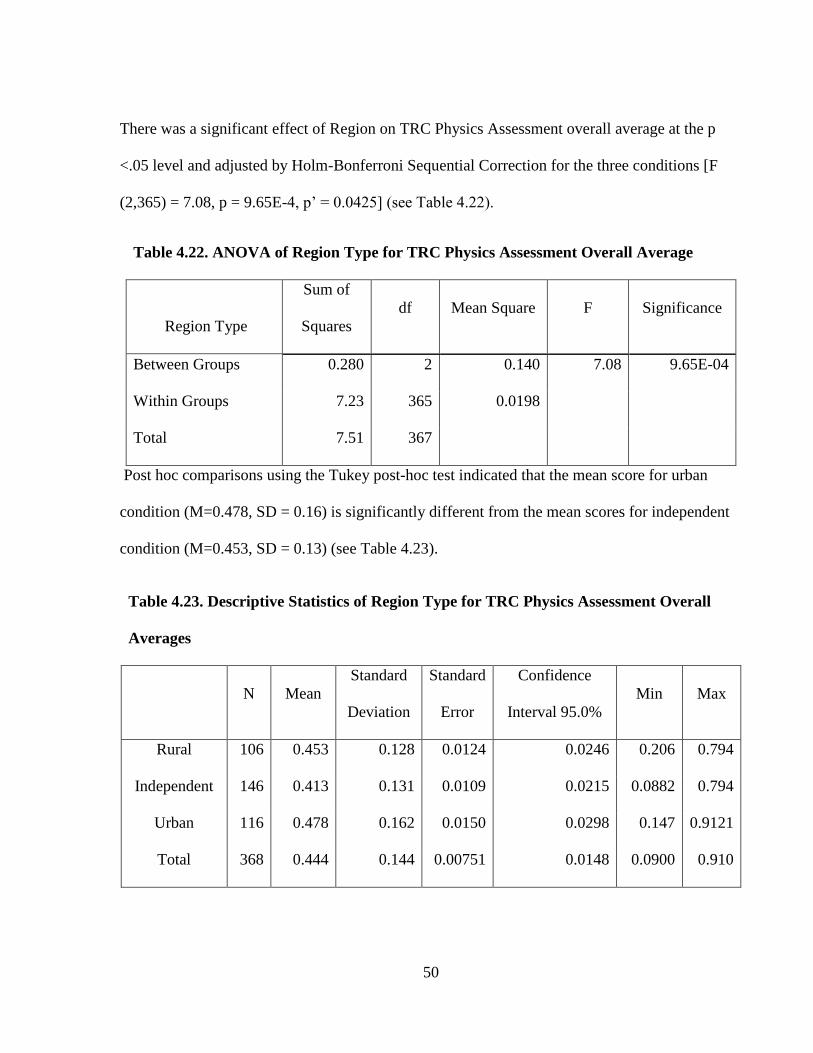
50
There was a significant effect of Region on TRC Physics Assessment overall average at the p
<.05 level and adjusted by Holm-Bonferroni Sequential Correction for the three conditions [F
(2,365) = 7.08, p = 9.65E-4, p’ = 0.0425] (see Table 4.22).
Table 4.22. ANOVA of Region Type for TRC Physics Assessment Overall Average
Region Type
Sum of
Squares
df Mean Square F Significance
Between Groups 0.280 2 0.140 7.08 9.65E-04
Within Groups 7.23 365 0.0198
Total 7.51 367
Post hoc comparisons using the Tukey post-hoc test indicated that the mean score for urban
condition (M=0.478, SD = 0.16) is significantly different from the mean scores for independent
condition (M=0.453, SD = 0.13) (see Table 4.23).
Table 4.23. Descriptive Statistics of Region Type for TRC Physics Assessment Overall
Averages
N Mean
Standard
Deviation
Standard
Error
Confidence
Interval 95.0%
Min Max
Rural 106 0.453 0.128 0.0124 0.0246 0.206 0.794
Independent 146 0.413 0.131 0.0109 0.0215 0.0882 0.794
Urban 116 0.478 0.162 0.0150 0.0298 0.147 0.9121
Total 368 0.444 0.144 0.00751 0.0148 0.0900 0.910
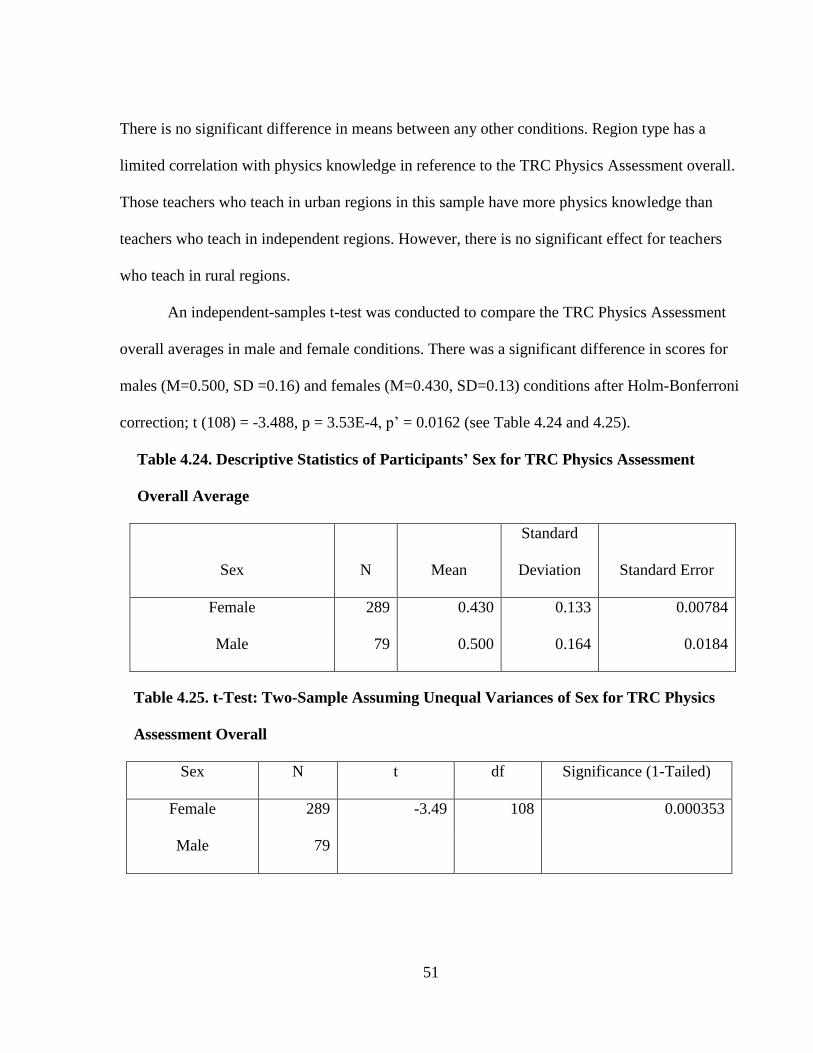
51
There is no significant difference in means between any other conditions. Region type has a
limited correlation with physics knowledge in reference to the TRC Physics Assessment overall.
Those teachers who teach in urban regions in this sample have more physics knowledge than
teachers who teach in independent regions. However, there is no significant effect for teachers
who teach in rural regions.
An independent-samples t-test was conducted to compare the TRC Physics Assessment
overall averages in male and female conditions. There was a significant difference in scores for
males (M=0.500, SD =0.16) and females (M=0.430, SD=0.13) conditions after Holm-Bonferroni
correction; t (108) = -3.488, p = 3.53E-4, p’ = 0.0162 (see Table 4.24 and 4.25).
Table 4.24. Descriptive Statistics of Participants’ Sex for TRC Physics Assessment
Overall Average
Sex N Mean
Standard
Deviation Standard Error
Female 289 0.430 0.133 0.00784
Male 79 0.500 0.164 0.0184
Table 4.25. t-Test: Two-Sample Assuming Unequal Variances of Sex for TRC Physics
Assessment Overall
Sex N t df Significance (1-Tailed)
Female 289 -3.49 108 0.000353
Male 79
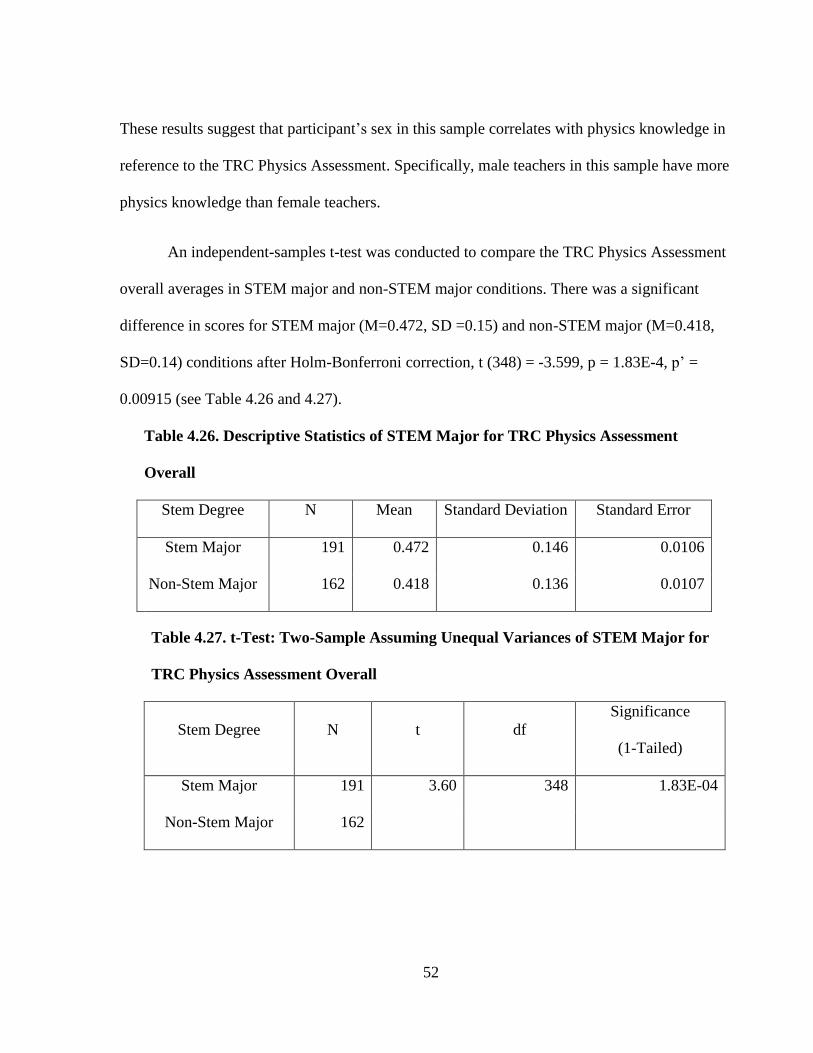
52
These results suggest that participant’s sex in this sample correlates with physics knowledge in
reference to the TRC Physics Assessment. Specifically, male teachers in this sample have more
physics knowledge than female teachers.
An independent-samples t-test was conducted to compare the TRC Physics Assessment
overall averages in STEM major and non-STEM major conditions. There was a significant
difference in scores for STEM major (M=0.472, SD =0.15) and non-STEM major (M=0.418,
SD=0.14) conditions after Holm-Bonferroni correction, t (348) = -3.599, p = 1.83E-4, p’ =
0.00915 (see Table 4.26 and 4.27).
Table 4.26. Descriptive Statistics of STEM Major for TRC Physics Assessment
Overall
Stem Degree N Mean Standard Deviation Standard Error
Stem Major 191 0.472 0.146 0.0106
Non-Stem Major 162 0.418 0.136 0.0107
Table 4.27. t-Test: Two-Sample Assuming Unequal Variances of STEM Major for
TRC Physics Assessment Overall
Stem Degree N t df
Significance
(1-Tailed)
Stem Major 191 3.60 348 1.83E-04
Non-Stem Major 162
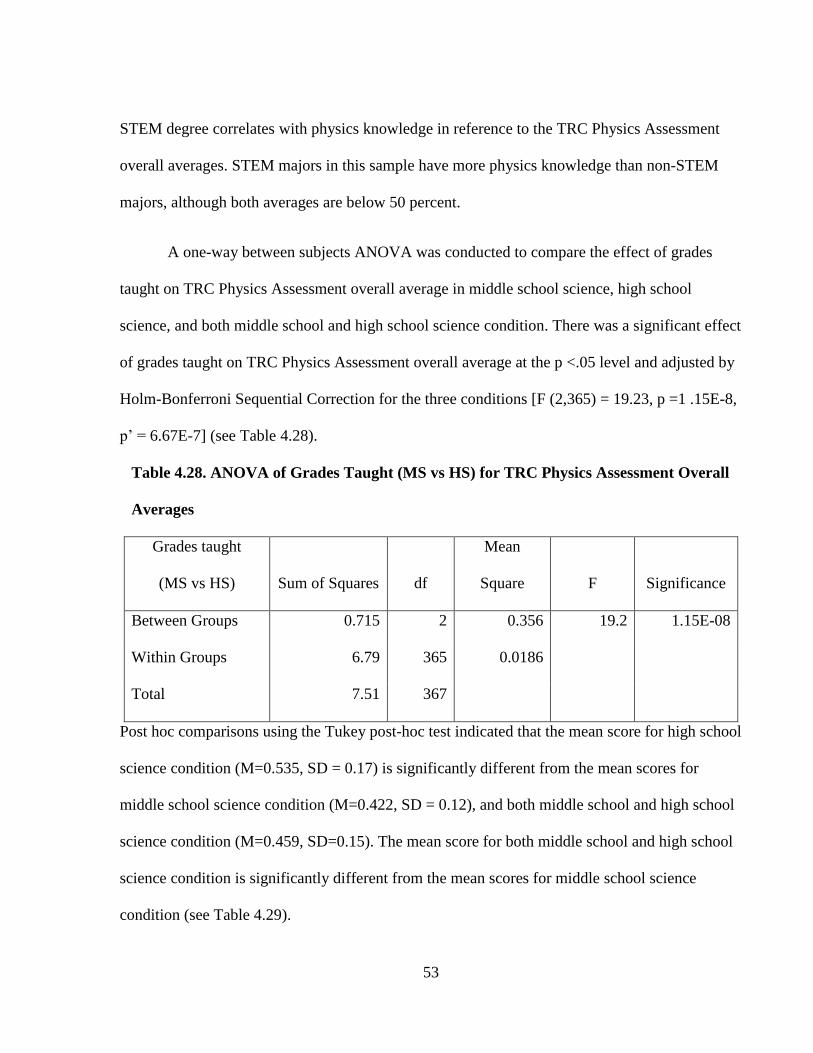
53
STEM degree correlates with physics knowledge in reference to the TRC Physics Assessment
overall averages. STEM majors in this sample have more physics knowledge than non-STEM
majors, although both averages are below 50 percent.
A one-way between subjects ANOVA was conducted to compare the effect of grades
taught on TRC Physics Assessment overall average in middle school science, high school
science, and both middle school and high school science condition. There was a significant effect
of grades taught on TRC Physics Assessment overall average at the p <.05 level and adjusted by
Holm-Bonferroni Sequential Correction for the three conditions [F (2,365) = 19.23, p =1 .15E-8,
p’ = 6.67E-7] (see Table 4.28).
Table 4.28. ANOVA of Grades Taught (MS vs HS) for TRC Physics Assessment Overall
Averages
Grades taught
(MS vs HS) Sum of Squares df
Mean
Square F Significance
Between Groups 0.715 2 0.356 19.2 1.15E-08
Within Groups 6.79 365 0.0186
Total 7.51 367
Post hoc comparisons using the Tukey post-hoc test indicated that the mean score for high school
science condition (M=0.535, SD = 0.17) is significantly different from the mean scores for
middle school science condition (M=0.422, SD = 0.12), and both middle school and high school
science condition (M=0.459, SD=0.15). The mean score for both middle school and high school
science condition is significantly different from the mean scores for middle school science
condition (see Table 4.29).
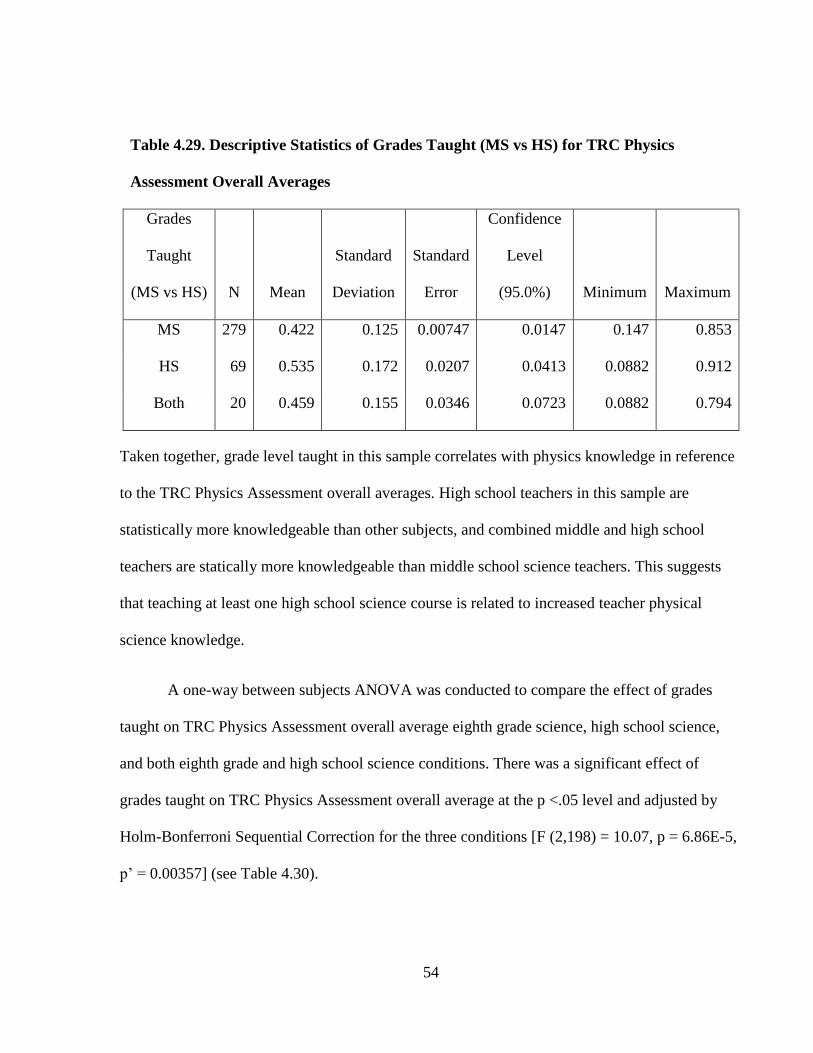
54
Table 4.29. Descriptive Statistics of Grades Taught (MS vs HS) for TRC Physics
Assessment Overall Averages
Grades
Taught
(MS vs HS) N Mean
Standard
Deviation
Standard
Error
Confidence
Level
(95.0%) Minimum Maximum
MS 279 0.422 0.125 0.00747 0.0147 0.147 0.853
HS 69 0.535 0.172 0.0207 0.0413 0.0882 0.912
Both 20 0.459 0.155 0.0346 0.0723 0.0882 0.794
Taken together, grade level taught in this sample correlates with physics knowledge in reference
to the TRC Physics Assessment overall averages. High school teachers in this sample are
statistically more knowledgeable than other subjects, and combined middle and high school
teachers are statically more knowledgeable than middle school science teachers. This suggests
that teaching at least one high school science course is related to increased teacher physical
science knowledge.
A one-way between subjects ANOVA was conducted to compare the effect of grades
taught on TRC Physics Assessment overall average eighth grade science, high school science,
and both eighth grade and high school science conditions. There was a significant effect of
grades taught on TRC Physics Assessment overall average at the p <.05 level and adjusted by
Holm-Bonferroni Sequential Correction for the three conditions [F (2,198) = 10.07, p = 6.86E-5,
p’ = 0.00357] (see Table 4.30).
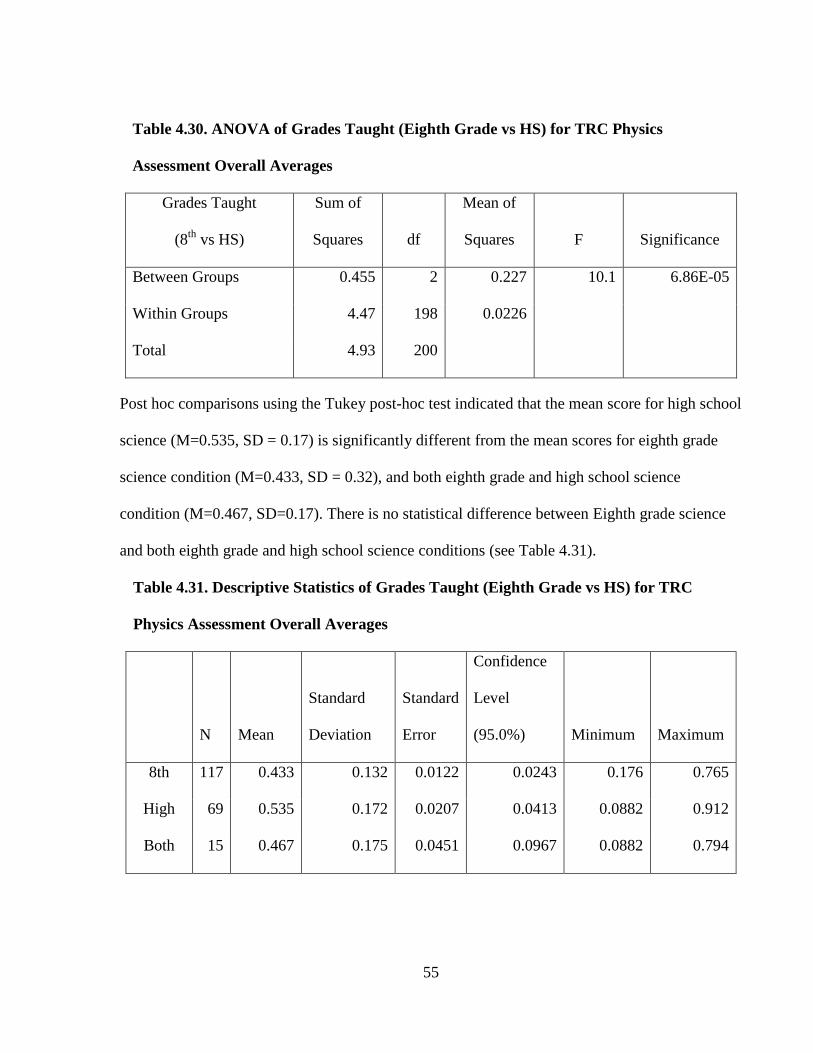
55
Table 4.30. ANOVA of Grades Taught (Eighth Grade vs HS) for TRC Physics
Assessment Overall Averages
Grades Taught
(8th
vs HS)
Sum of
Squares df
Mean of
Squares F Significance
Between Groups 0.455 2 0.227 10.1 6.86E-05
Within Groups 4.47 198 0.0226
Total 4.93 200
Post hoc comparisons using the Tukey post-hoc test indicated that the mean score for high school
science (M=0.535, SD = 0.17) is significantly different from the mean scores for eighth grade
science condition (M=0.433, SD = 0.32), and both eighth grade and high school science
condition (M=0.467, SD=0.17). There is no statistical difference between Eighth grade science
and both eighth grade and high school science conditions (see Table 4.31).
Table 4.31. Descriptive Statistics of Grades Taught (Eighth Grade vs HS) for TRC
Physics Assessment Overall Averages
N Mean
Standard
Deviation
Standard
Error
Confidence
Level
(95.0%) Minimum Maximum
8th 117 0.433 0.132 0.0122 0.0243 0.176 0.765
High 69 0.535 0.172 0.0207 0.0413 0.0882 0.912
Both 15 0.467 0.175 0.0451 0.0967 0.0882 0.794
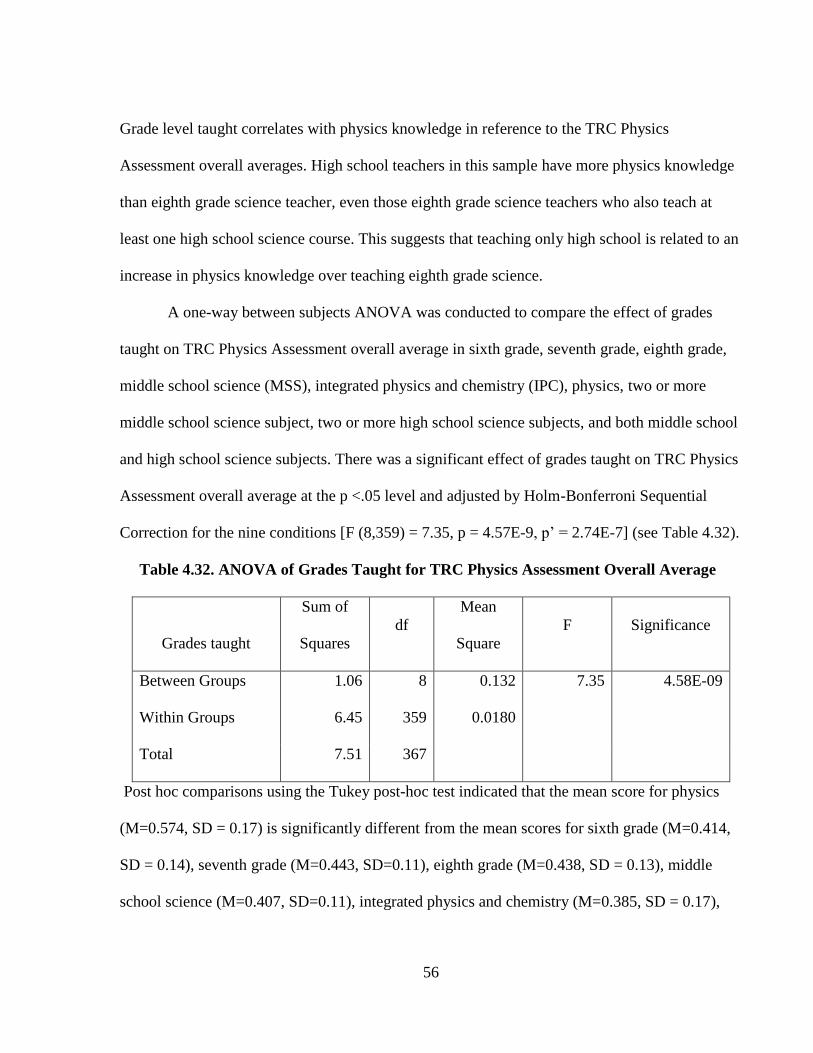
56
Grade level taught correlates with physics knowledge in reference to the TRC Physics
Assessment overall averages. High school teachers in this sample have more physics knowledge
than eighth grade science teacher, even those eighth grade science teachers who also teach at
least one high school science course. This suggests that teaching only high school is related to an
increase in physics knowledge over teaching eighth grade science.
A one-way between subjects ANOVA was conducted to compare the effect of grades
taught on TRC Physics Assessment overall average in sixth grade, seventh grade, eighth grade,
middle school science (MSS), integrated physics and chemistry (IPC), physics, two or more
middle school science subject, two or more high school science subjects, and both middle school
and high school science subjects. There was a significant effect of grades taught on TRC Physics
Assessment overall average at the p <.05 level and adjusted by Holm-Bonferroni Sequential
Correction for the nine conditions [F (8,359) = 7.35, p = 4.57E-9, p’ = 2.74E-7] (see Table 4.32).
Table 4.32. ANOVA of Grades Taught for TRC Physics Assessment Overall Average
Grades taught
Sum of
Squares
df
Mean
Square
F Significance
Between Groups 1.06 8 0.132 7.35 4.58E-09
Within Groups 6.45 359 0.0180
Total 7.51 367
Post hoc comparisons using the Tukey post-hoc test indicated that the mean score for physics
(M=0.574, SD = 0.17) is significantly different from the mean scores for sixth grade (M=0.414,
SD = 0.14), seventh grade (M=0.443, SD=0.11), eighth grade (M=0.438, SD = 0.13), middle
school science (M=0.407, SD=0.11), integrated physics and chemistry (M=0.385, SD = 0.17),
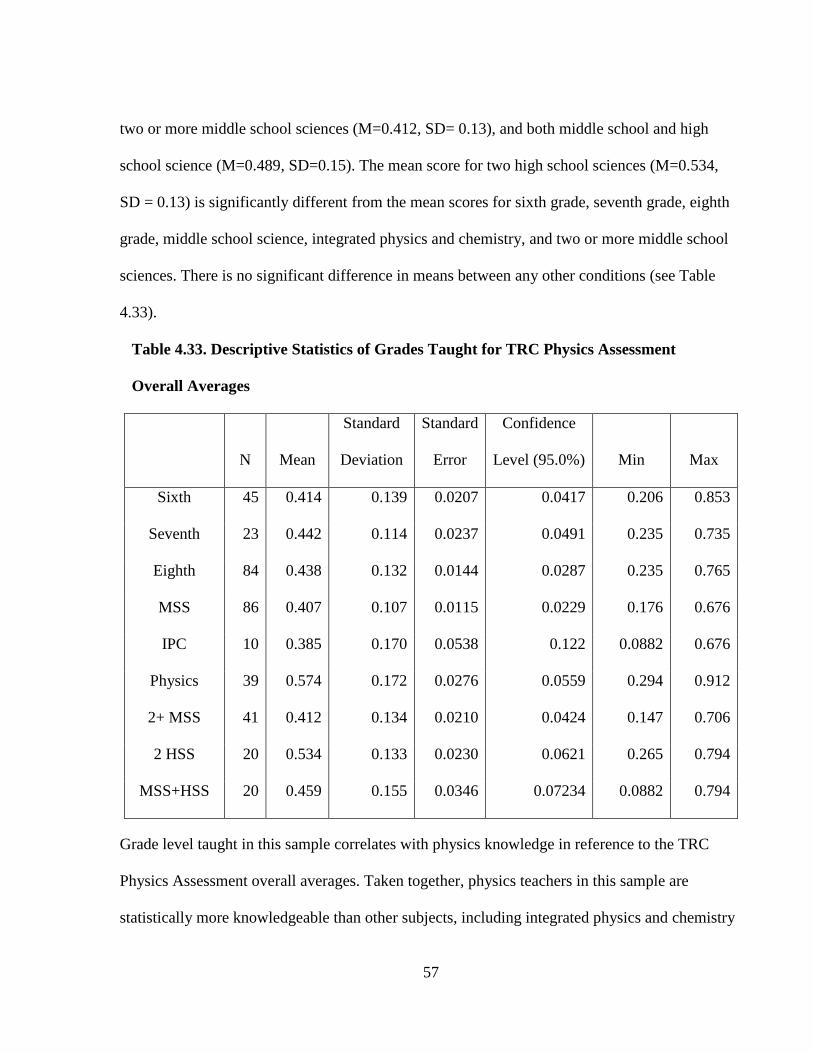
57
two or more middle school sciences (M=0.412, SD= 0.13), and both middle school and high
school science (M=0.489, SD=0.15). The mean score for two high school sciences (M=0.534,
SD = 0.13) is significantly different from the mean scores for sixth grade, seventh grade, eighth
grade, middle school science, integrated physics and chemistry, and two or more middle school
sciences. There is no significant difference in means between any other conditions (see Table
4.33).
Table 4.33. Descriptive Statistics of Grades Taught for TRC Physics Assessment
Overall Averages
N Mean
Standard
Deviation
Standard
Error
Confidence
Level (95.0%) Min Max
Sixth 45 0.414 0.139 0.0207 0.0417 0.206 0.853
Seventh 23 0.442 0.114 0.0237 0.0491 0.235 0.735
Eighth 84 0.438 0.132 0.0144 0.0287 0.235 0.765
MSS 86 0.407 0.107 0.0115 0.0229 0.176 0.676
IPC 10 0.385 0.170 0.0538 0.122 0.0882 0.676
Physics 39 0.574 0.172 0.0276 0.0559 0.294 0.912
2+ MSS 41 0.412 0.134 0.0210 0.0424 0.147 0.706
2 HSS 20 0.534 0.133 0.0230 0.0621 0.265 0.794
MSS+HSS 20 0.459 0.155 0.0346 0.07234 0.0882 0.794
Grade level taught in this sample correlates with physics knowledge in reference to the TRC
Physics Assessment overall averages. Taken together, physics teachers in this sample are
statistically more knowledgeable than other subjects, including integrated physics and chemistry
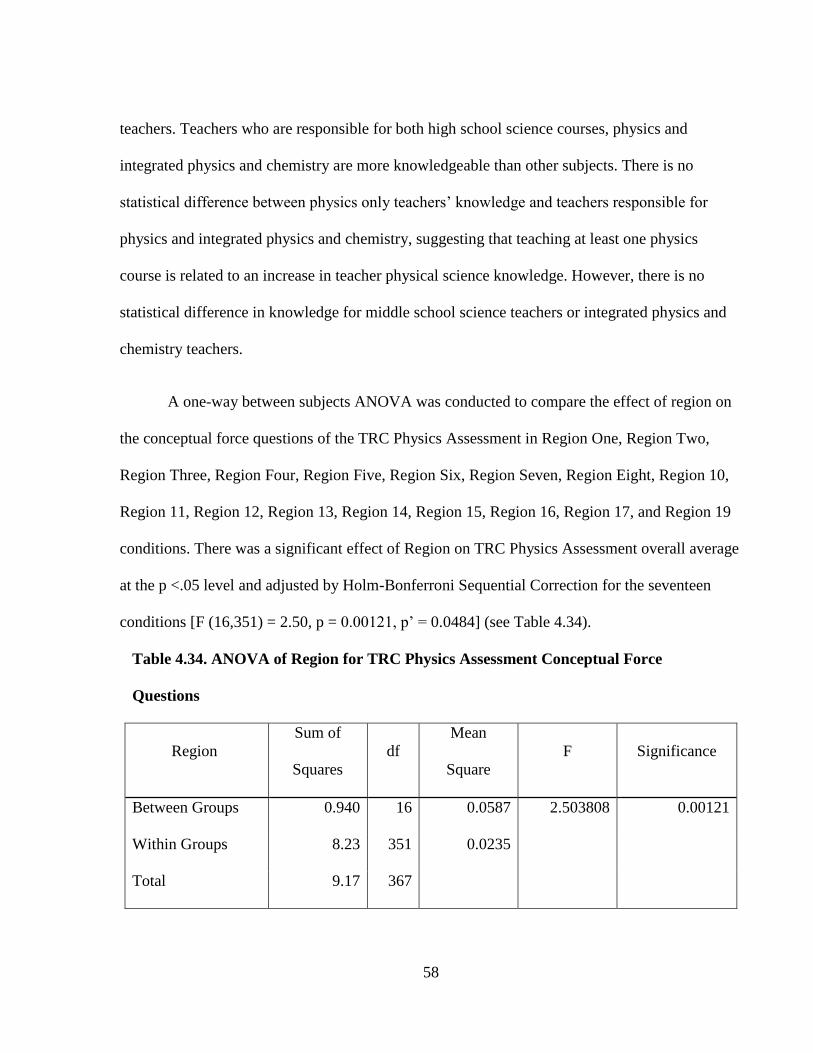
58
teachers. Teachers who are responsible for both high school science courses, physics and
integrated physics and chemistry are more knowledgeable than other subjects. There is no
statistical difference between physics only teachers’ knowledge and teachers responsible for
physics and integrated physics and chemistry, suggesting that teaching at least one physics
course is related to an increase in teacher physical science knowledge. However, there is no
statistical difference in knowledge for middle school science teachers or integrated physics and
chemistry teachers.
A one-way between subjects ANOVA was conducted to compare the effect of region on
the conceptual force questions of the TRC Physics Assessment in Region One, Region Two,
Region Three, Region Four, Region Five, Region Six, Region Seven, Region Eight, Region 10,
Region 11, Region 12, Region 13, Region 14, Region 15, Region 16, Region 17, and Region 19
conditions. There was a significant effect of Region on TRC Physics Assessment overall average
at the p <.05 level and adjusted by Holm-Bonferroni Sequential Correction for the seventeen
conditions [F (16,351) = 2.50, p = 0.00121, p’ = 0.0484] (see Table 4.34).
Table 4.34. ANOVA of Region for TRC Physics Assessment Conceptual Force
Questions
Region
Sum of
Squares
df
Mean
Square
F Significance
Between Groups 0.940 16 0.0587 2.503808 0.00121
Within Groups 8.23 351 0.0235
Total 9.17 367
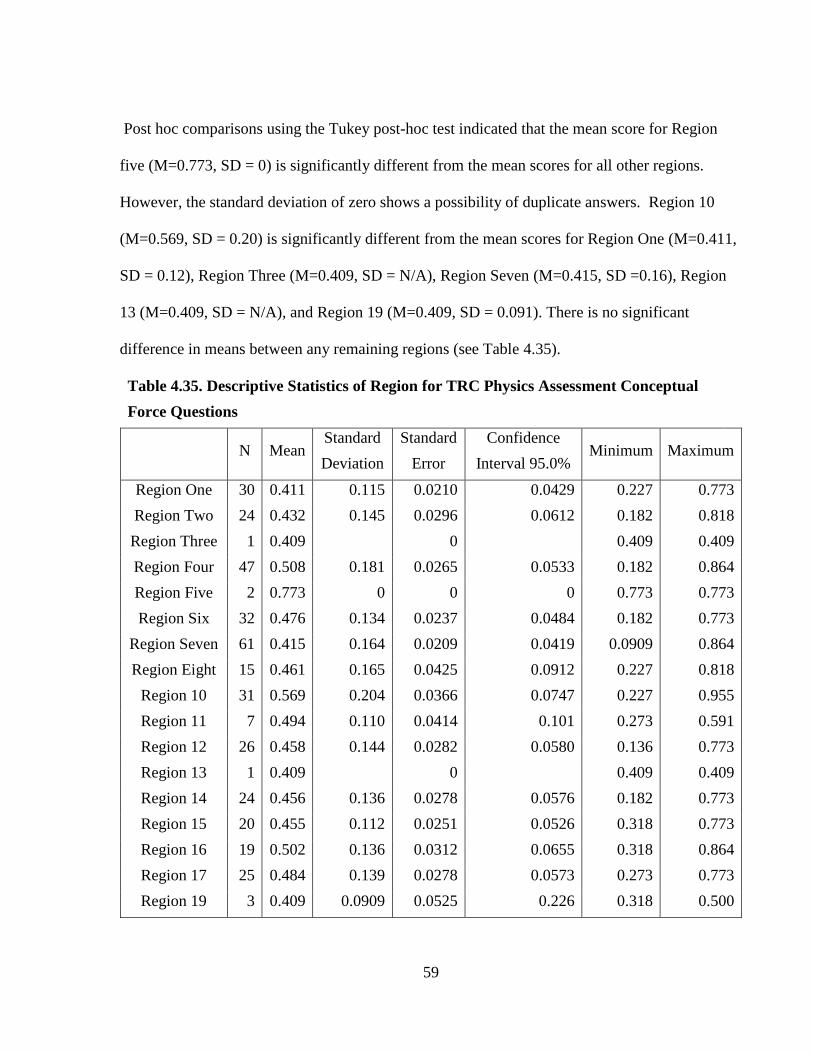
59
Post hoc comparisons using the Tukey post-hoc test indicated that the mean score for Region
five (M=0.773, SD = 0) is significantly different from the mean scores for all other regions.
However, the standard deviation of zero shows a possibility of duplicate answers. Region 10
(M=0.569, SD = 0.20) is significantly different from the mean scores for Region One (M=0.411,
SD = 0.12), Region Three (M=0.409, SD = N/A), Region Seven (M=0.415, SD =0.16), Region
13 (M=0.409, SD = N/A), and Region 19 (M=0.409, SD = 0.091). There is no significant
difference in means between any remaining regions (see Table 4.35).
Table 4.35. Descriptive Statistics of Region for TRC Physics Assessment Conceptual
Force Questions
N Mean Standard
Deviation
Standard
Error
Confidence
Interval 95.0% Minimum Maximum
Region One 30 0.411 0.115 0.0210 0.0429 0.227 0.773
Region Two 24 0.432 0.145 0.0296 0.0612 0.182 0.818
Region Three 1 0.409 0 0.409 0.409
Region Four 47 0.508 0.181 0.0265 0.0533 0.182 0.864
Region Five 2 0.773 0 0 0 0.773 0.773
Region Six 32 0.476 0.134 0.0237 0.0484 0.182 0.773
Region Seven 61 0.415 0.164 0.0209 0.0419 0.0909 0.864
Region Eight 15 0.461 0.165 0.0425 0.0912 0.227 0.818
Region 10 31 0.569 0.204 0.0366 0.0747 0.227 0.955
Region 11 7 0.494 0.110 0.0414 0.101 0.273 0.591
Region 12 26 0.458 0.144 0.0282 0.0580 0.136 0.773
Region 13 1 0.409 0 0.409 0.409
Region 14 24 0.456 0.136 0.0278 0.0576 0.182 0.773
Region 15 20 0.455 0.112 0.0251 0.0526 0.318 0.773
Region 16 19 0.502 0.136 0.0312 0.0655 0.318 0.864
Region 17 25 0.484 0.139 0.0278 0.0573 0.273 0.773
Region 19 3 0.409 0.0909 0.0525 0.226 0.318 0.500
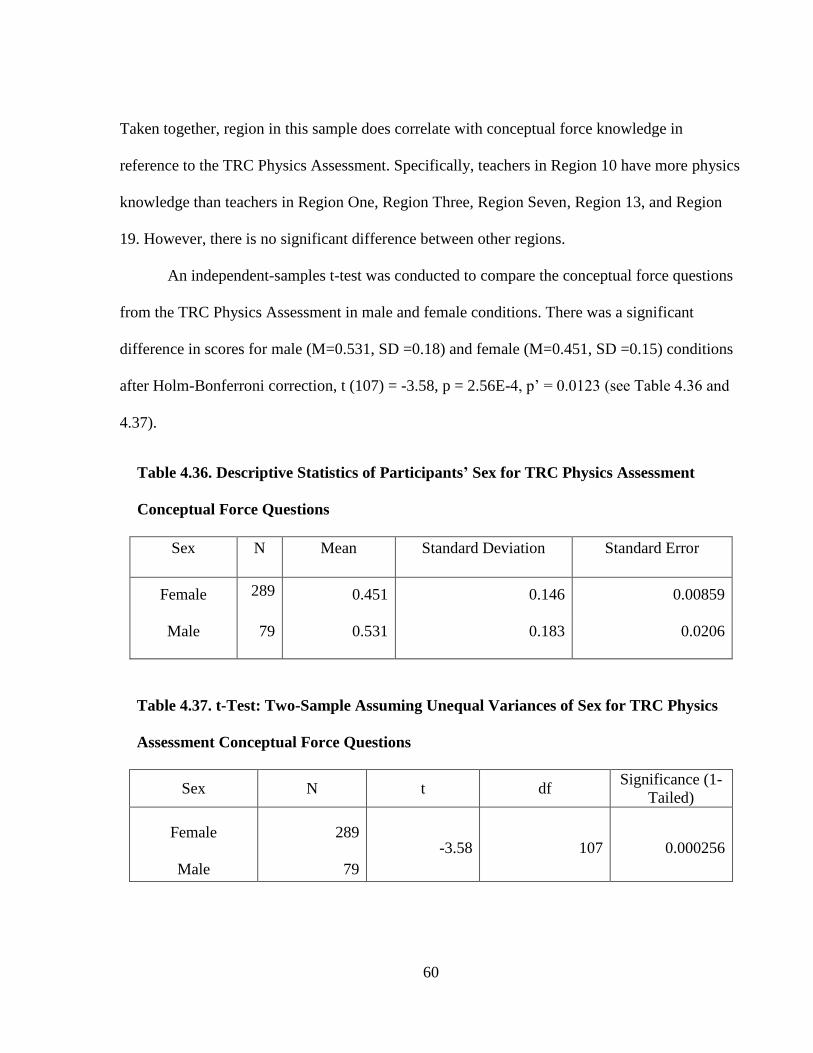
60
Taken together, region in this sample does correlate with conceptual force knowledge in
reference to the TRC Physics Assessment. Specifically, teachers in Region 10 have more physics
knowledge than teachers in Region One, Region Three, Region Seven, Region 13, and Region
19. However, there is no significant difference between other regions.
An independent-samples t-test was conducted to compare the conceptual force questions
from the TRC Physics Assessment in male and female conditions. There was a significant
difference in scores for male (M=0.531, SD =0.18) and female (M=0.451, SD =0.15) conditions
after Holm-Bonferroni correction, t (107) = -3.58, p = 2.56E-4, p’ = 0.0123 (see Table 4.36 and
4.37).
Table 4.36. Descriptive Statistics of Participants’ Sex for TRC Physics Assessment
Conceptual Force Questions
Sex N Mean Standard Deviation Standard Error
Female 289 0.451 0.146 0.00859
Male 79 0.531 0.183 0.0206
Table 4.37. t-Test: Two-Sample Assuming Unequal Variances of Sex for TRC Physics
Assessment Conceptual Force Questions
Sex N t df Significance (1-
Tailed)
Female 289 -3.58 107 0.000256
Male 79
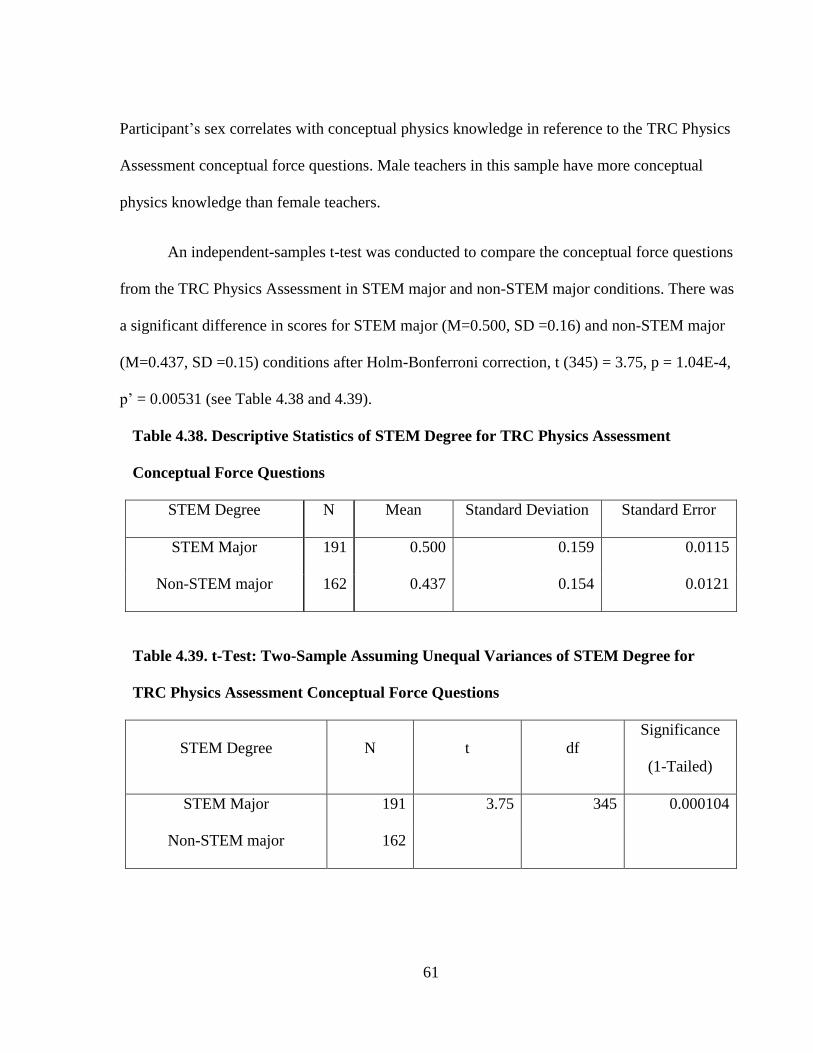
61
Participant’s sex correlates with conceptual physics knowledge in reference to the TRC Physics
Assessment conceptual force questions. Male teachers in this sample have more conceptual
physics knowledge than female teachers.
An independent-samples t-test was conducted to compare the conceptual force questions
from the TRC Physics Assessment in STEM major and non-STEM major conditions. There was
a significant difference in scores for STEM major (M=0.500, SD =0.16) and non-STEM major
(M=0.437, SD =0.15) conditions after Holm-Bonferroni correction, t (345) = 3.75, p = 1.04E-4,
p’ = 0.00531 (see Table 4.38 and 4.39).
Table 4.38. Descriptive Statistics of STEM Degree for TRC Physics Assessment
Conceptual Force Questions
STEM Degree N Mean Standard Deviation Standard Error
STEM Major 191 0.500 0.159 0.0115
Non-STEM major 162 0.437 0.154 0.0121
Table 4.39. t-Test: Two-Sample Assuming Unequal Variances of STEM Degree for
TRC Physics Assessment Conceptual Force Questions
STEM Degree N t df
Significance
(1-Tailed)
STEM Major 191 3.75 345 0.000104
Non-STEM major 162
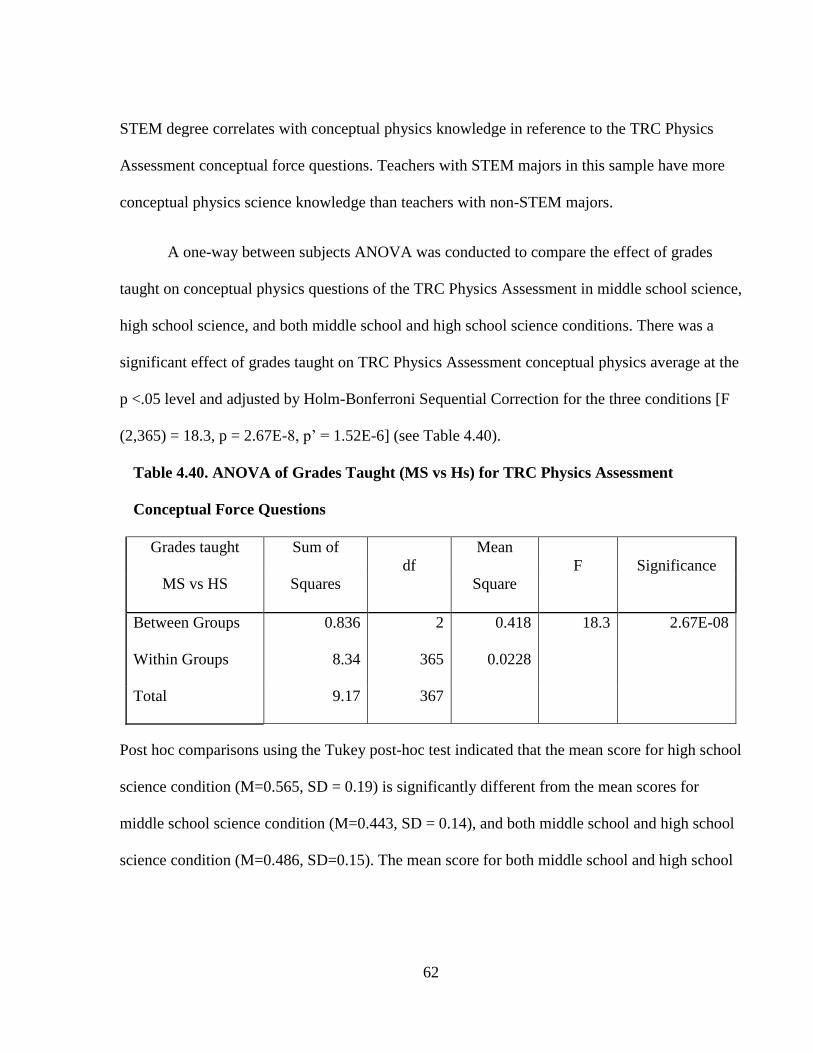
62
STEM degree correlates with conceptual physics knowledge in reference to the TRC Physics
Assessment conceptual force questions. Teachers with STEM majors in this sample have more
conceptual physics science knowledge than teachers with non-STEM majors.
A one-way between subjects ANOVA was conducted to compare the effect of grades
taught on conceptual physics questions of the TRC Physics Assessment in middle school science,
high school science, and both middle school and high school science conditions. There was a
significant effect of grades taught on TRC Physics Assessment conceptual physics average at the
p <.05 level and adjusted by Holm-Bonferroni Sequential Correction for the three conditions [F
(2,365) = 18.3, p = 2.67E-8, p’ = 1.52E-6] (see Table 4.40).
Table 4.40. ANOVA of Grades Taught (MS vs Hs) for TRC Physics Assessment
Conceptual Force Questions
Grades taught
MS vs HS
Sum of
Squares
df
Mean
Square
F Significance
Between Groups 0.836 2 0.418 18.3 2.67E-08
Within Groups 8.34 365 0.0228
Total 9.17 367
Post hoc comparisons using the Tukey post-hoc test indicated that the mean score for high school
science condition (M=0.565, SD = 0.19) is significantly different from the mean scores for
middle school science condition (M=0.443, SD = 0.14), and both middle school and high school
science condition (M=0.486, SD=0.15). The mean score for both middle school and high school
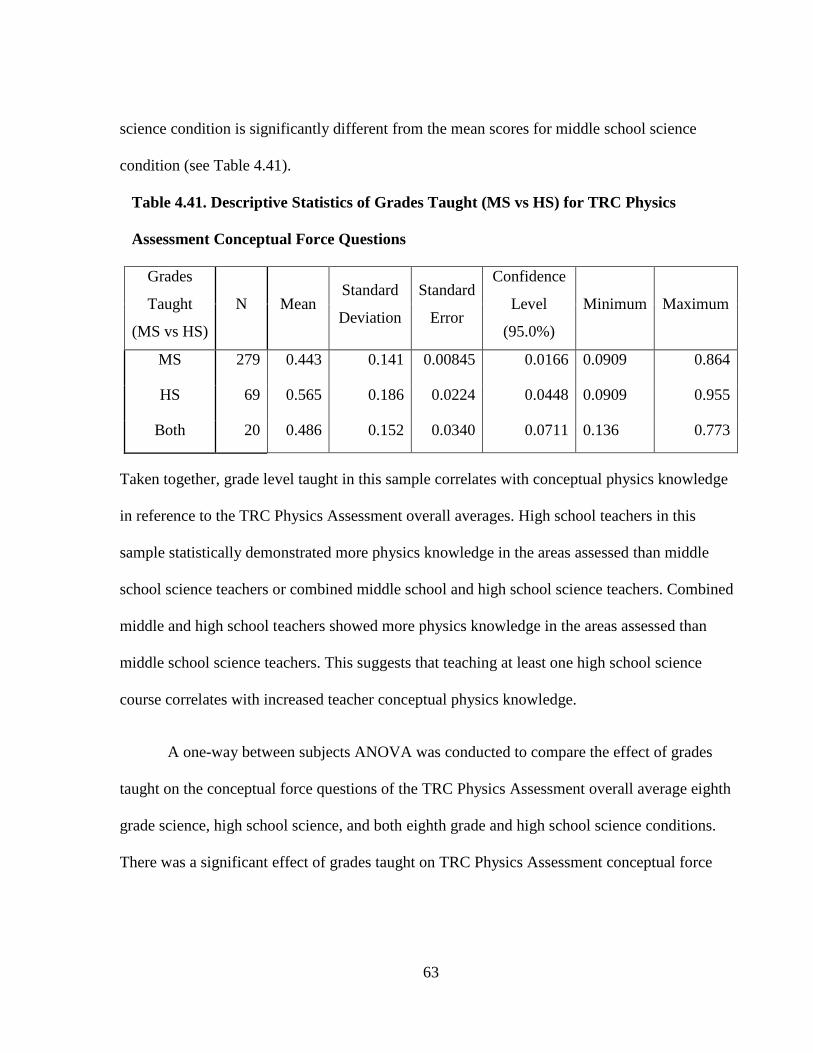
63
science condition is significantly different from the mean scores for middle school science
condition (see Table 4.41).
Table 4.41. Descriptive Statistics of Grades Taught (MS vs HS) for TRC Physics
Assessment Conceptual Force Questions
Grades
Taught
(MS vs HS)
N Mean Standard
Deviation
Standard
Error
Confidence
Level
(95.0%)
Minimum Maximum
MS 279 0.443 0.141 0.00845 0.0166 0.0909 0.864
HS 69 0.565 0.186 0.0224 0.0448 0.0909 0.955
Both 20 0.486 0.152 0.0340 0.0711 0.136 0.773
Taken together, grade level taught in this sample correlates with conceptual physics knowledge
in reference to the TRC Physics Assessment overall averages. High school teachers in this
sample statistically demonstrated more physics knowledge in the areas assessed than middle
school science teachers or combined middle school and high school science teachers. Combined
middle and high school teachers showed more physics knowledge in the areas assessed than
middle school science teachers. This suggests that teaching at least one high school science
course correlates with increased teacher conceptual physics knowledge.
A one-way between subjects ANOVA was conducted to compare the effect of grades
taught on the conceptual force questions of the TRC Physics Assessment overall average eighth
grade science, high school science, and both eighth grade and high school science conditions.
There was a significant effect of grades taught on TRC Physics Assessment conceptual force
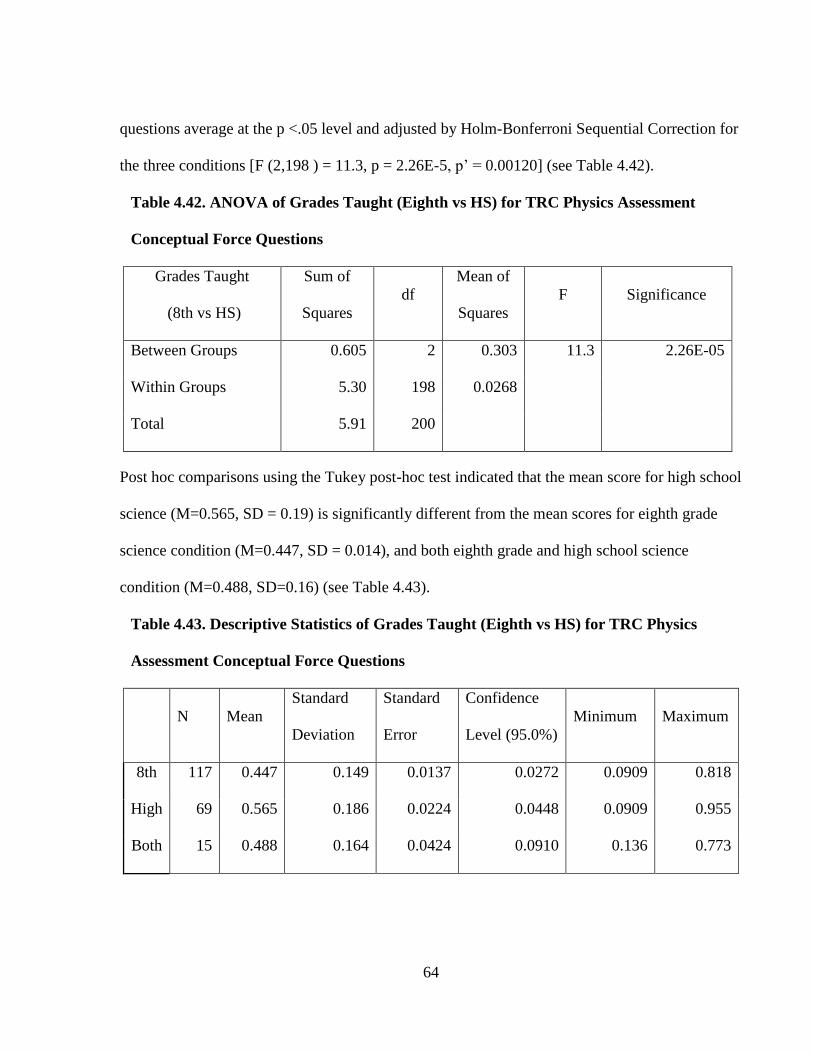
64
questions average at the p <.05 level and adjusted by Holm-Bonferroni Sequential Correction for
the three conditions [F (2,198 ) = 11.3, p = 2.26E-5, p’ = 0.00120] (see Table 4.42).
Table 4.42. ANOVA of Grades Taught (Eighth vs HS) for TRC Physics Assessment
Conceptual Force Questions
Grades Taught
(8th vs HS)
Sum of
Squares
df
Mean of
Squares
F Significance
Between Groups 0.605 2 0.303 11.3 2.26E-05
Within Groups 5.30 198 0.0268
Total 5.91 200
Post hoc comparisons using the Tukey post-hoc test indicated that the mean score for high school
science (M=0.565, SD = 0.19) is significantly different from the mean scores for eighth grade
science condition (M=0.447, SD = 0.014), and both eighth grade and high school science
condition (M=0.488, SD=0.16) (see Table 4.43).
Table 4.43. Descriptive Statistics of Grades Taught (Eighth vs HS) for TRC Physics
Assessment Conceptual Force Questions
N Mean
Standard
Deviation
Standard
Error
Confidence
Level (95.0%)
Minimum Maximum
8th 117 0.447 0.149 0.0137 0.0272 0.0909 0.818
High 69 0.565 0.186 0.0224 0.0448 0.0909 0.955
Both 15 0.488 0.164 0.0424 0.0910 0.136 0.773
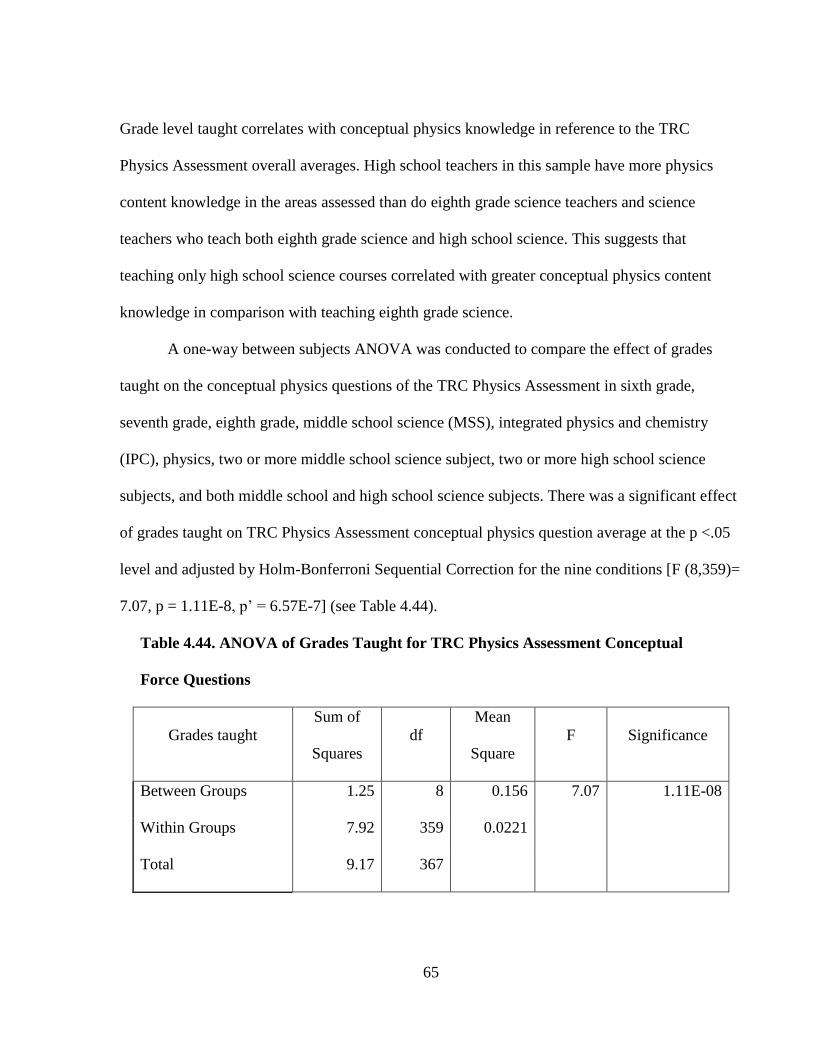
65
Grade level taught correlates with conceptual physics knowledge in reference to the TRC
Physics Assessment overall averages. High school teachers in this sample have more physics
content knowledge in the areas assessed than do eighth grade science teachers and science
teachers who teach both eighth grade science and high school science. This suggests that
teaching only high school science courses correlated with greater conceptual physics content
knowledge in comparison with teaching eighth grade science.
A one-way between subjects ANOVA was conducted to compare the effect of grades
taught on the conceptual physics questions of the TRC Physics Assessment in sixth grade,
seventh grade, eighth grade, middle school science (MSS), integrated physics and chemistry
(IPC), physics, two or more middle school science subject, two or more high school science
subjects, and both middle school and high school science subjects. There was a significant effect
of grades taught on TRC Physics Assessment conceptual physics question average at the p <.05
level and adjusted by Holm-Bonferroni Sequential Correction for the nine conditions [F (8,359)=
7.07, p = 1.11E-8, p’ = 6.57E-7] (see Table 4.44).
Table 4.44. ANOVA of Grades Taught for TRC Physics Assessment Conceptual
Force Questions
Grades taught
Sum of
Squares
df
Mean
Square
F Significance
Between Groups 1.25 8 0.156 7.07 1.11E-08
Within Groups 7.92 359 0.0221
Total 9.17 367
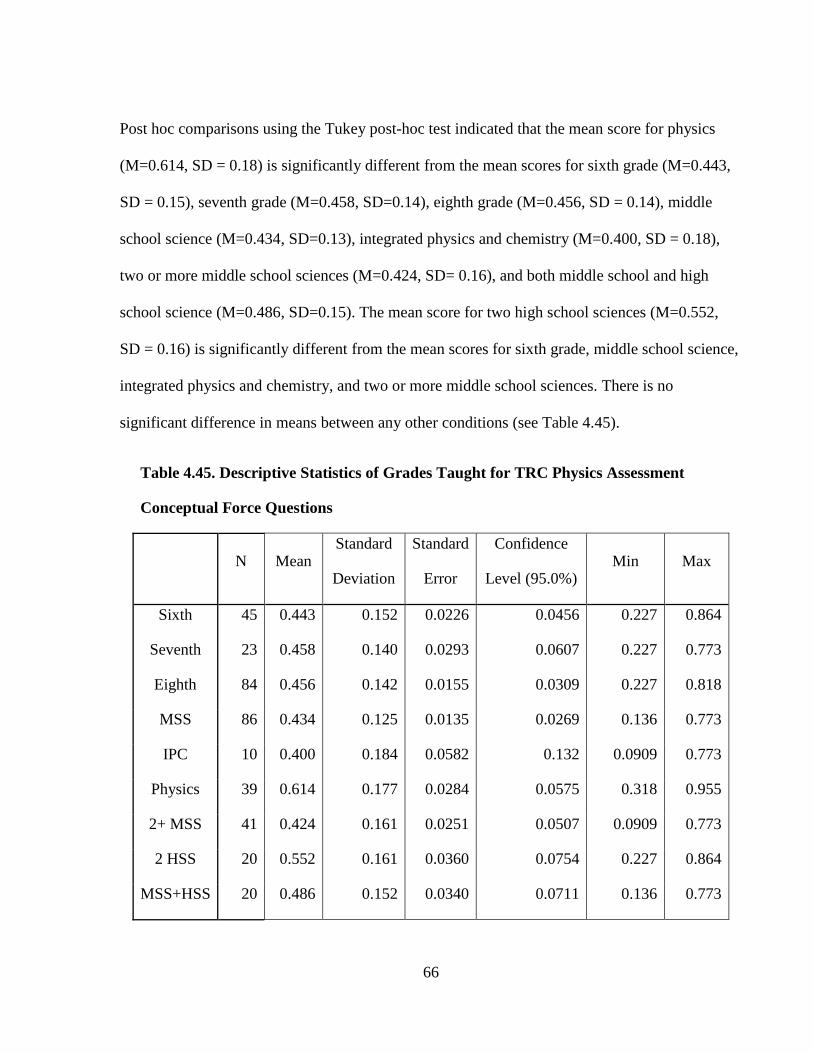
66
Post hoc comparisons using the Tukey post-hoc test indicated that the mean score for physics
(M=0.614, SD = 0.18) is significantly different from the mean scores for sixth grade (M=0.443,
SD = 0.15), seventh grade (M=0.458, SD=0.14), eighth grade (M=0.456, SD = 0.14), middle
school science (M=0.434, SD=0.13), integrated physics and chemistry (M=0.400, SD = 0.18),
two or more middle school sciences (M=0.424, SD= 0.16), and both middle school and high
school science (M=0.486, SD=0.15). The mean score for two high school sciences (M=0.552,
SD = 0.16) is significantly different from the mean scores for sixth grade, middle school science,
integrated physics and chemistry, and two or more middle school sciences. There is no
significant difference in means between any other conditions (see Table 4.45).
Table 4.45. Descriptive Statistics of Grades Taught for TRC Physics Assessment
Conceptual Force Questions
N Mean Standard
Deviation
Standard
Error
Confidence
Level (95.0%) Min Max
Sixth 45 0.443 0.152 0.0226 0.0456 0.227 0.864
Seventh 23 0.458 0.140 0.0293 0.0607 0.227 0.773
Eighth 84 0.456 0.142 0.0155 0.0309 0.227 0.818
MSS 86 0.434 0.125 0.0135 0.0269 0.136 0.773
IPC 10 0.400 0.184 0.0582 0.132 0.0909 0.773
Physics 39 0.614 0.177 0.0284 0.0575 0.318 0.955
2+ MSS 41 0.424 0.161 0.0251 0.0507 0.0909 0.773
2 HSS 20 0.552 0.161 0.0360 0.0754 0.227 0.864
MSS+HSS 20 0.486 0.152 0.0340 0.0711 0.136 0.773
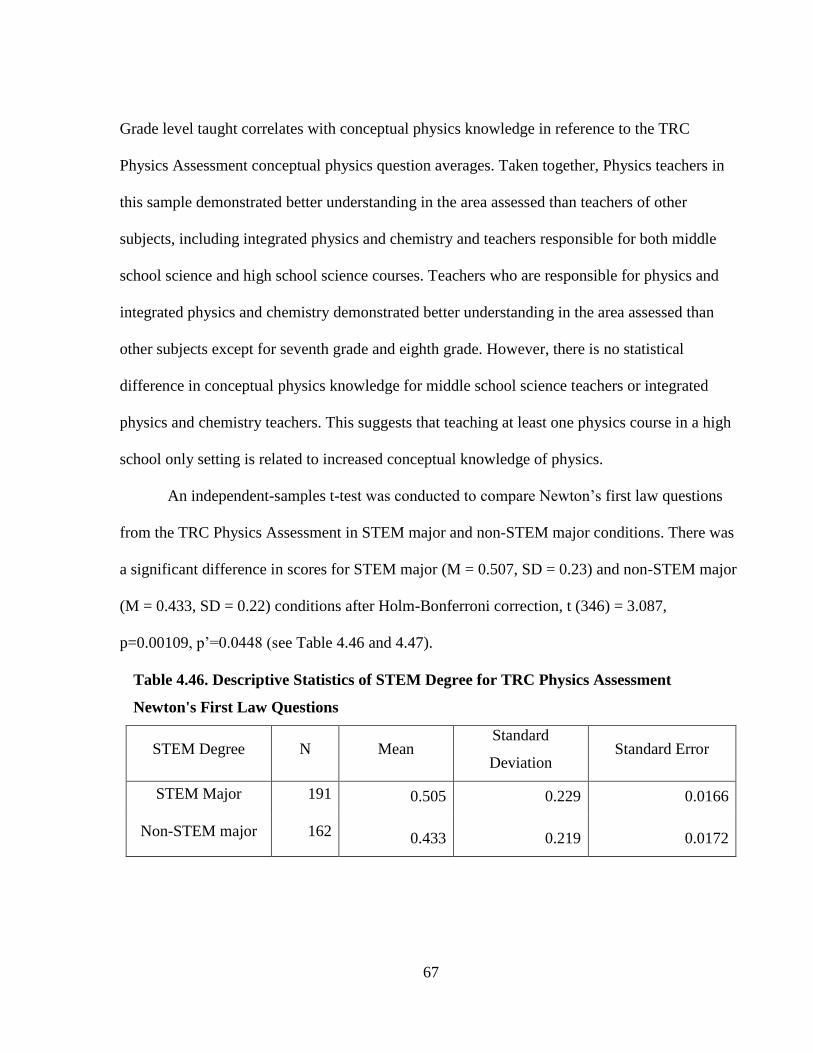
67
Grade level taught correlates with conceptual physics knowledge in reference to the TRC
Physics Assessment conceptual physics question averages. Taken together, Physics teachers in
this sample demonstrated better understanding in the area assessed than teachers of other
subjects, including integrated physics and chemistry and teachers responsible for both middle
school science and high school science courses. Teachers who are responsible for physics and
integrated physics and chemistry demonstrated better understanding in the area assessed than
other subjects except for seventh grade and eighth grade. However, there is no statistical
difference in conceptual physics knowledge for middle school science teachers or integrated
physics and chemistry teachers. This suggests that teaching at least one physics course in a high
school only setting is related to increased conceptual knowledge of physics.
An independent-samples t-test was conducted to compare Newton’s first law questions
from the TRC Physics Assessment in STEM major and non-STEM major conditions. There was
a significant difference in scores for STEM major (M = 0.507, SD = 0.23) and non-STEM major
(M = 0.433, SD = 0.22) conditions after Holm-Bonferroni correction, t (346) = 3.087,
p=0.00109, p’=0.0448 (see Table 4.46 and 4.47).
Table 4.46. Descriptive Statistics of STEM Degree for TRC Physics Assessment
Newton's First Law Questions
STEM Degree N Mean Standard
Deviation Standard Error
STEM Major 191 0.505 0.229 0.0166
Non-STEM major 162 0.433 0.219 0.0172
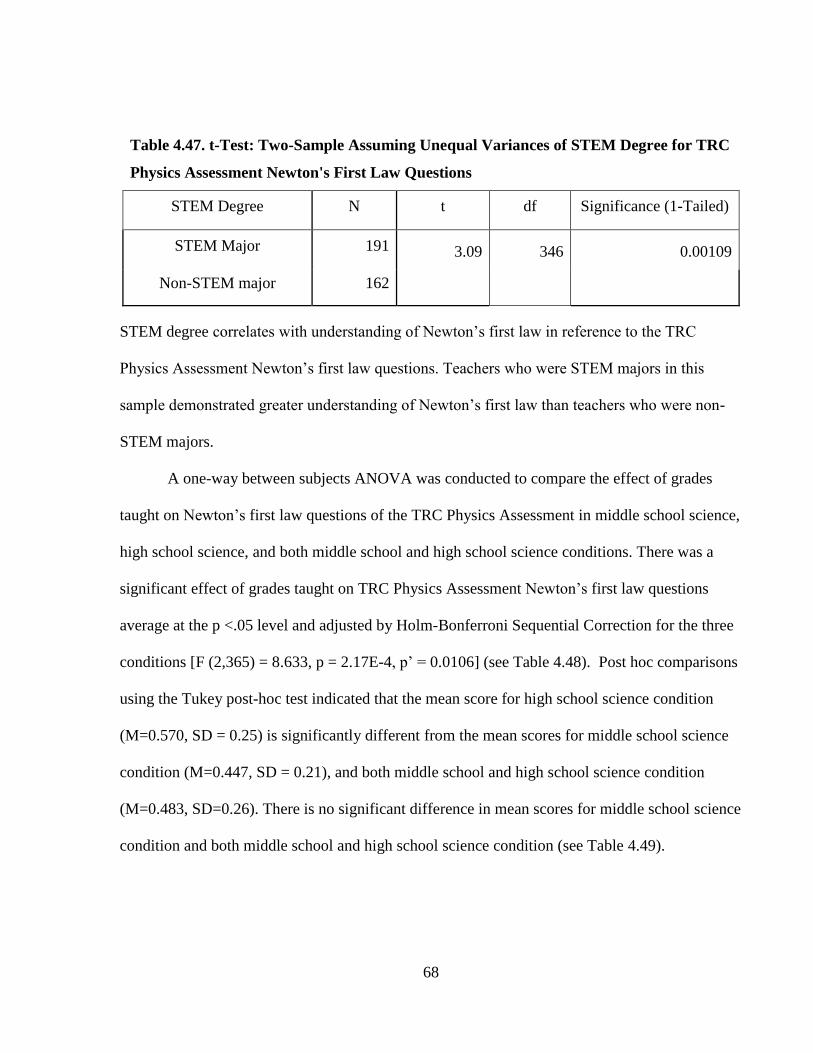
68
Table 4.47. t-Test: Two-Sample Assuming Unequal Variances of STEM Degree for TRC
Physics Assessment Newton's First Law Questions
STEM Degree N t df Significance (1-Tailed)
STEM Major 191 3.09 346 0.00109
Non-STEM major 162
STEM degree correlates with understanding of Newton’s first law in reference to the TRC
Physics Assessment Newton’s first law questions. Teachers who were STEM majors in this
sample demonstrated greater understanding of Newton’s first law than teachers who were non-
STEM majors.
A one-way between subjects ANOVA was conducted to compare the effect of grades
taught on Newton’s first law questions of the TRC Physics Assessment in middle school science,
high school science, and both middle school and high school science conditions. There was a
significant effect of grades taught on TRC Physics Assessment Newton’s first law questions
average at the p <.05 level and adjusted by Holm-Bonferroni Sequential Correction for the three
conditions [F (2,365) = 8.633, p = 2.17E-4, p’ = 0.0106] (see Table 4.48). Post hoc comparisons
using the Tukey post-hoc test indicated that the mean score for high school science condition
(M=0.570, SD = 0.25) is significantly different from the mean scores for middle school science
condition (M=0.447, SD = 0.21), and both middle school and high school science condition
(M=0.483, SD=0.26). There is no significant difference in mean scores for middle school science
condition and both middle school and high school science condition (see Table 4.49).
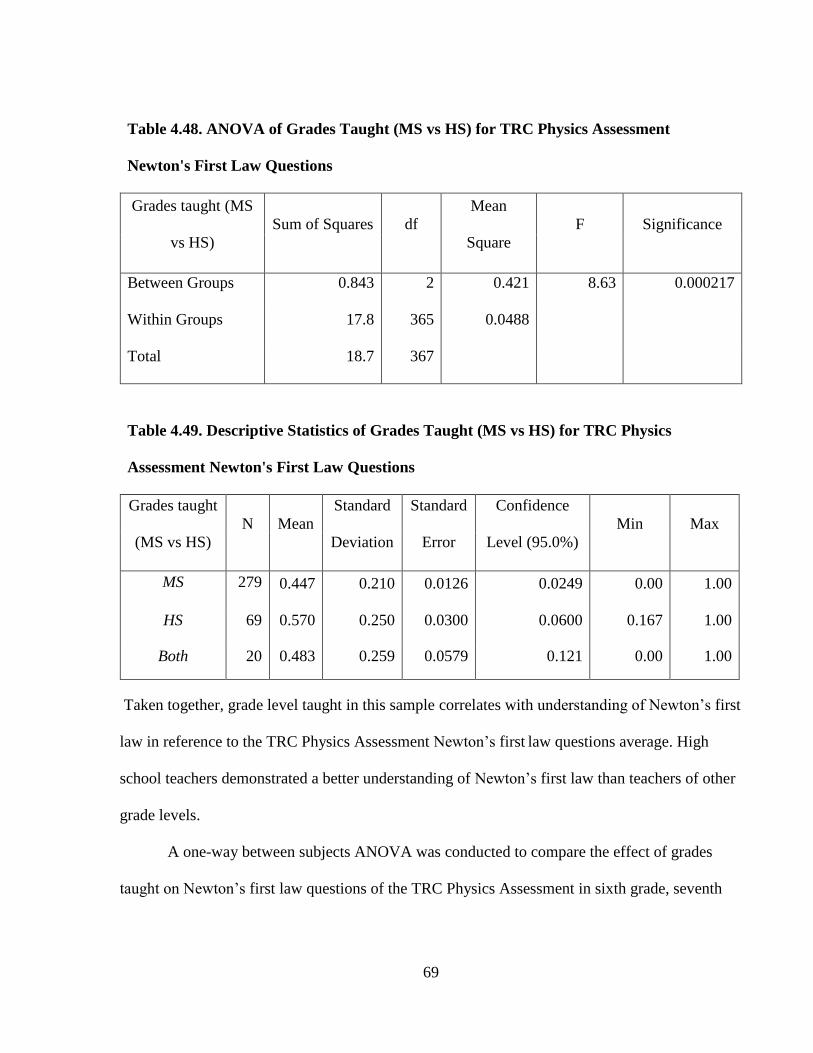
69
Table 4.48. ANOVA of Grades Taught (MS vs HS) for TRC Physics Assessment
Newton's First Law Questions
Grades taught (MS
vs HS)
Sum of Squares df
Mean
Square
F Significance
Between Groups 0.843 2 0.421 8.63 0.000217
Within Groups 17.8 365 0.0488
Total 18.7 367
Table 4.49. Descriptive Statistics of Grades Taught (MS vs HS) for TRC Physics
Assessment Newton's First Law Questions
Grades taught
(MS vs HS)
N Mean
Standard
Deviation
Standard
Error
Confidence
Level (95.0%)
Min Max
MS 279 0.447 0.210 0.0126 0.0249 0.00 1.00
HS 69 0.570 0.250 0.0300 0.0600 0.167 1.00
Both 20 0.483 0.259 0.0579 0.121 0.00 1.00
Taken together, grade level taught in this sample correlates with understanding of Newton’s first
law in reference to the TRC Physics Assessment Newton’s first law questions average. High
school teachers demonstrated a better understanding of Newton’s first law than teachers of other
grade levels.
A one-way between subjects ANOVA was conducted to compare the effect of grades
taught on Newton’s first law questions of the TRC Physics Assessment in sixth grade, seventh
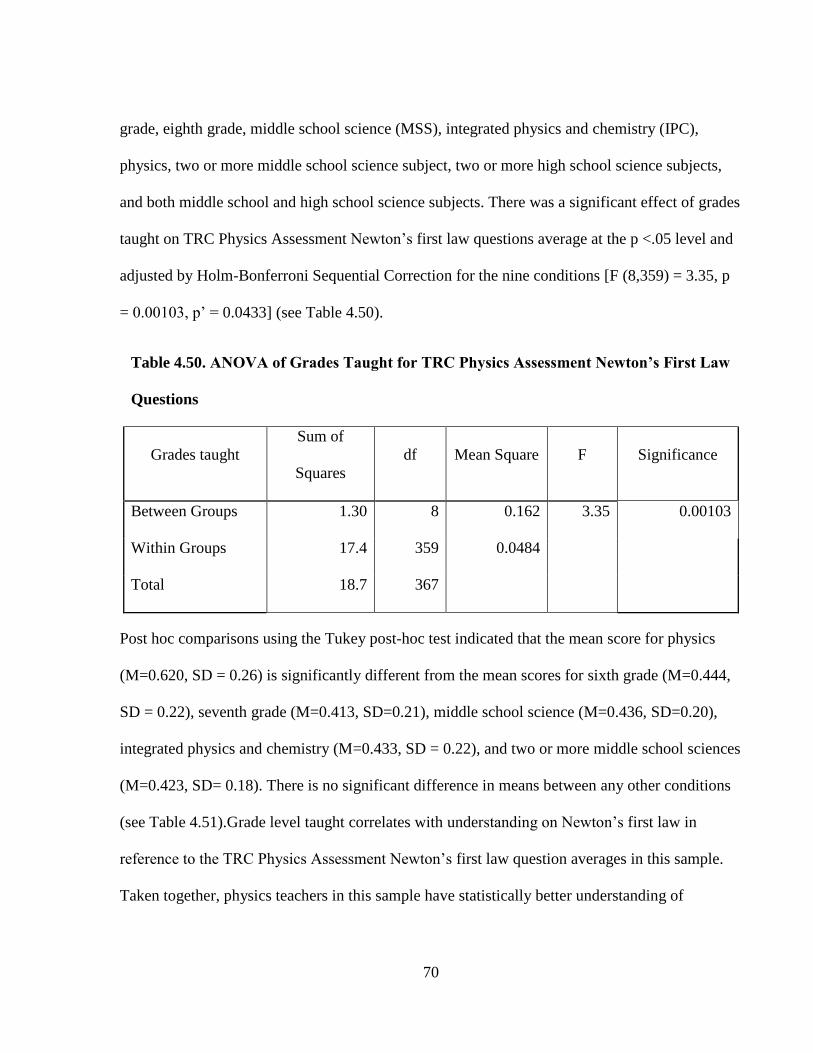
70
grade, eighth grade, middle school science (MSS), integrated physics and chemistry (IPC),
physics, two or more middle school science subject, two or more high school science subjects,
and both middle school and high school science subjects. There was a significant effect of grades
taught on TRC Physics Assessment Newton’s first law questions average at the p <.05 level and
adjusted by Holm-Bonferroni Sequential Correction for the nine conditions [F (8,359) = 3.35, p
= 0.00103, p’ = 0.0433] (see Table 4.50).
Table 4.50. ANOVA of Grades Taught for TRC Physics Assessment Newton’s First Law
Questions
Grades taught
Sum of
Squares
df Mean Square F Significance
Between Groups 1.30 8 0.162 3.35 0.00103
Within Groups 17.4 359 0.0484
Total 18.7 367
Post hoc comparisons using the Tukey post-hoc test indicated that the mean score for physics
(M=0.620, SD = 0.26) is significantly different from the mean scores for sixth grade (M=0.444,
SD = 0.22), seventh grade (M=0.413, SD=0.21), middle school science (M=0.436, SD=0.20),
integrated physics and chemistry (M=0.433, SD = 0.22), and two or more middle school sciences
(M=0.423, SD= 0.18). There is no significant difference in means between any other conditions
(see Table 4.51).Grade level taught correlates with understanding on Newton’s first law in
reference to the TRC Physics Assessment Newton’s first law question averages in this sample.
Taken together, physics teachers in this sample have statistically better understanding of
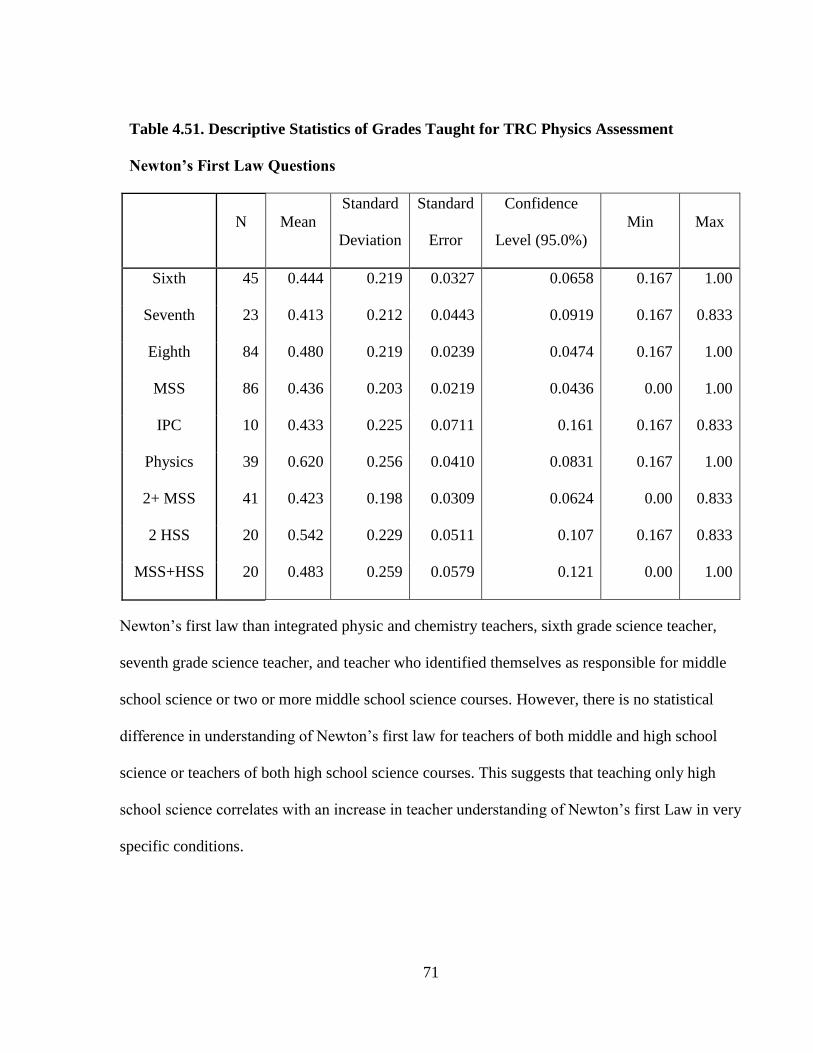
71
Table 4.51. Descriptive Statistics of Grades Taught for TRC Physics Assessment
Newton’s First Law Questions
N Mean
Standard
Deviation
Standard
Error
Confidence
Level (95.0%)
Min Max
Sixth 45 0.444 0.219 0.0327 0.0658 0.167 1.00
Seventh 23 0.413 0.212 0.0443 0.0919 0.167 0.833
Eighth 84 0.480 0.219 0.0239 0.0474 0.167 1.00
MSS 86 0.436 0.203 0.0219 0.0436 0.00 1.00
IPC 10 0.433 0.225 0.0711 0.161 0.167 0.833
Physics 39 0.620 0.256 0.0410 0.0831 0.167 1.00
2+ MSS 41 0.423 0.198 0.0309 0.0624 0.00 0.833
2 HSS 20 0.542 0.229 0.0511 0.107 0.167 0.833
MSS+HSS 20 0.483 0.259 0.0579 0.121 0.00 1.00
Newton’s first law than integrated physic and chemistry teachers, sixth grade science teacher,
seventh grade science teacher, and teacher who identified themselves as responsible for middle
school science or two or more middle school science courses. However, there is no statistical
difference in understanding of Newton’s first law for teachers of both middle and high school
science or teachers of both high school science courses. This suggests that teaching only high
school science correlates with an increase in teacher understanding of Newton’s first Law in very
specific conditions.
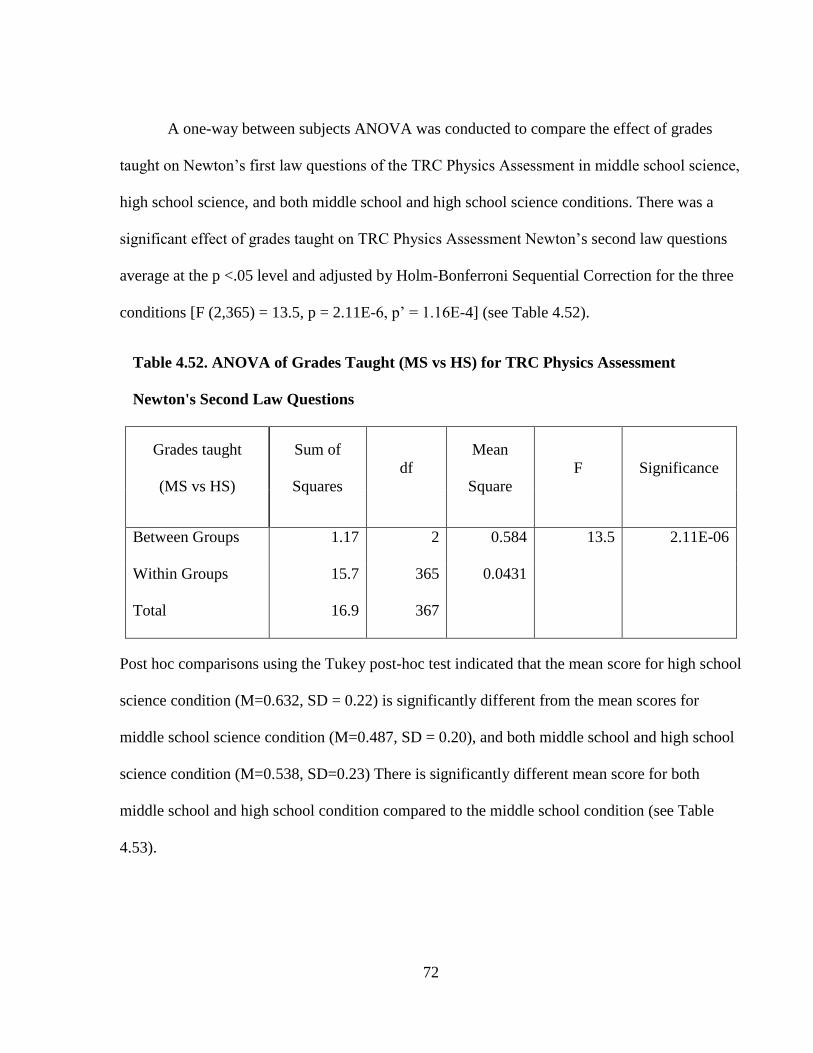
72
A one-way between subjects ANOVA was conducted to compare the effect of grades
taught on Newton’s first law questions of the TRC Physics Assessment in middle school science,
high school science, and both middle school and high school science conditions. There was a
significant effect of grades taught on TRC Physics Assessment Newton’s second law questions
average at the p <.05 level and adjusted by Holm-Bonferroni Sequential Correction for the three
conditions [F (2,365) = 13.5, p = 2.11E-6, p’ = 1.16E-4] (see Table 4.52).
Table 4.52. ANOVA of Grades Taught (MS vs HS) for TRC Physics Assessment
Newton's Second Law Questions
Grades taught
(MS vs HS)
Sum of
Squares
df
Mean
Square
F Significance
Between Groups 1.17 2 0.584 13.5 2.11E-06
Within Groups 15.7 365 0.0431
Total 16.9 367
Post hoc comparisons using the Tukey post-hoc test indicated that the mean score for high school
science condition (M=0.632, SD = 0.22) is significantly different from the mean scores for
middle school science condition (M=0.487, SD = 0.20), and both middle school and high school
science condition (M=0.538, SD=0.23) There is significantly different mean score for both
middle school and high school condition compared to the middle school condition (see Table
4.53).
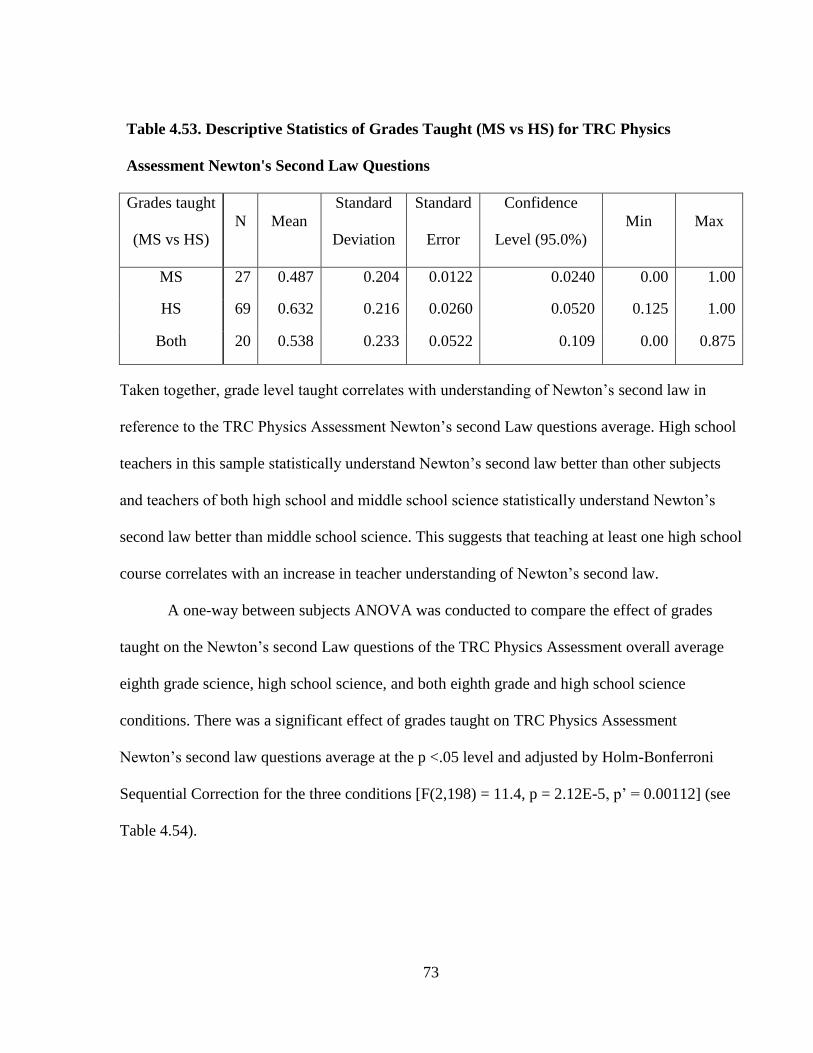
73
Table 4.53. Descriptive Statistics of Grades Taught (MS vs HS) for TRC Physics
Assessment Newton's Second Law Questions
Grades taught
(MS vs HS)
N Mean
Standard
Deviation
Standard
Error
Confidence
Level (95.0%)
Min Max
MS 27
9
0.487 0.204 0.0122 0.0240 0.00 1.00
HS 69 0.632 0.216 0.0260 0.0520 0.125 1.00
Both 20 0.538 0.233 0.0522 0.109 0.00 0.875
Taken together, grade level taught correlates with understanding of Newton’s second law in
reference to the TRC Physics Assessment Newton’s second Law questions average. High school
teachers in this sample statistically understand Newton’s second law better than other subjects
and teachers of both high school and middle school science statistically understand Newton’s
second law better than middle school science. This suggests that teaching at least one high school
course correlates with an increase in teacher understanding of Newton’s second law.
A one-way between subjects ANOVA was conducted to compare the effect of grades
taught on the Newton’s second Law questions of the TRC Physics Assessment overall average
eighth grade science, high school science, and both eighth grade and high school science
conditions. There was a significant effect of grades taught on TRC Physics Assessment
Newton’s second law questions average at the p <.05 level and adjusted by Holm-Bonferroni
Sequential Correction for the three conditions [F(2,198) = 11.4, p = 2.12E-5, p’ = 0.00112] (see
Table 4.54).
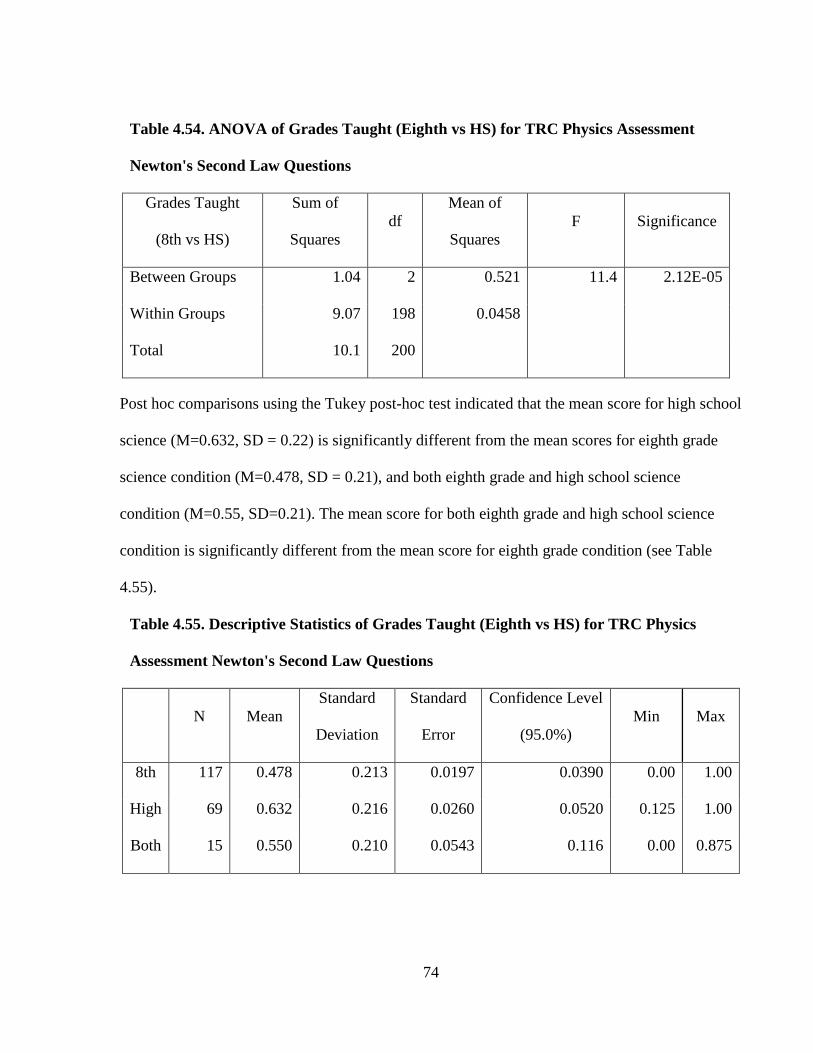
74
Table 4.54. ANOVA of Grades Taught (Eighth vs HS) for TRC Physics Assessment
Newton's Second Law Questions
Grades Taught
(8th vs HS)
Sum of
Squares
df
Mean of
Squares
F Significance
Between Groups 1.04 2 0.521 11.4 2.12E-05
Within Groups 9.07 198 0.0458
Total 10.1 200
Post hoc comparisons using the Tukey post-hoc test indicated that the mean score for high school
science (M=0.632, SD = 0.22) is significantly different from the mean scores for eighth grade
science condition (M=0.478, SD = 0.21), and both eighth grade and high school science
condition (M=0.55, SD=0.21). The mean score for both eighth grade and high school science
condition is significantly different from the mean score for eighth grade condition (see Table
4.55).
Table 4.55. Descriptive Statistics of Grades Taught (Eighth vs HS) for TRC Physics
Assessment Newton's Second Law Questions
N Mean
Standard
Deviation
Standard
Error
Confidence Level
(95.0%)
Min Max
8th 117 0.478 0.213 0.0197 0.0390 0.00 1.00
High 69 0.632 0.216 0.0260 0.0520 0.125 1.00
Both 15 0.550 0.210 0.0543 0.116 0.00 0.875
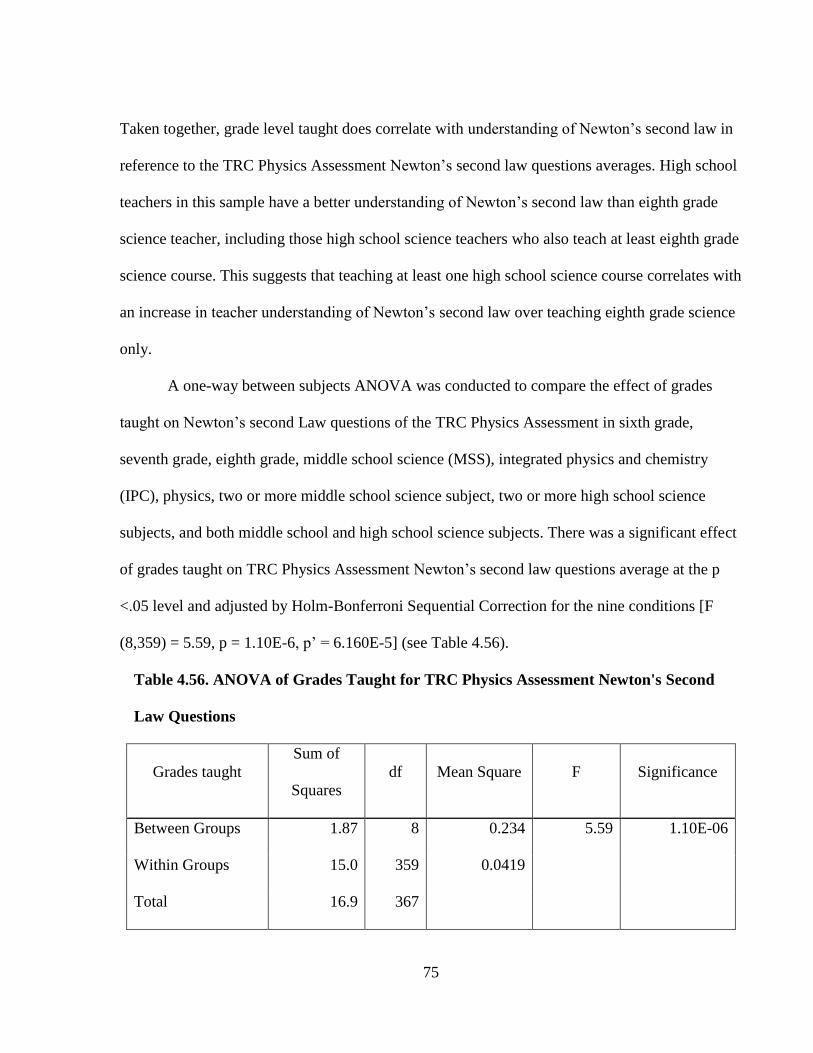
75
Taken together, grade level taught does correlate with understanding of Newton’s second law in
reference to the TRC Physics Assessment Newton’s second law questions averages. High school
teachers in this sample have a better understanding of Newton’s second law than eighth grade
science teacher, including those high school science teachers who also teach at least eighth grade
science course. This suggests that teaching at least one high school science course correlates with
an increase in teacher understanding of Newton’s second law over teaching eighth grade science
only.
A one-way between subjects ANOVA was conducted to compare the effect of grades
taught on Newton’s second Law questions of the TRC Physics Assessment in sixth grade,
seventh grade, eighth grade, middle school science (MSS), integrated physics and chemistry
(IPC), physics, two or more middle school science subject, two or more high school science
subjects, and both middle school and high school science subjects. There was a significant effect
of grades taught on TRC Physics Assessment Newton’s second law questions average at the p
<.05 level and adjusted by Holm-Bonferroni Sequential Correction for the nine conditions [F
(8,359) = 5.59, p = 1.10E-6, p’ = 6.160E-5] (see Table 4.56).
Table 4.56. ANOVA of Grades Taught for TRC Physics Assessment Newton's Second
Law Questions
Grades taught
Sum of
Squares
df Mean Square F Significance
Between Groups 1.87 8 0.234 5.59 1.10E-06
Within Groups 15.0 359 0.0419
Total 16.9 367
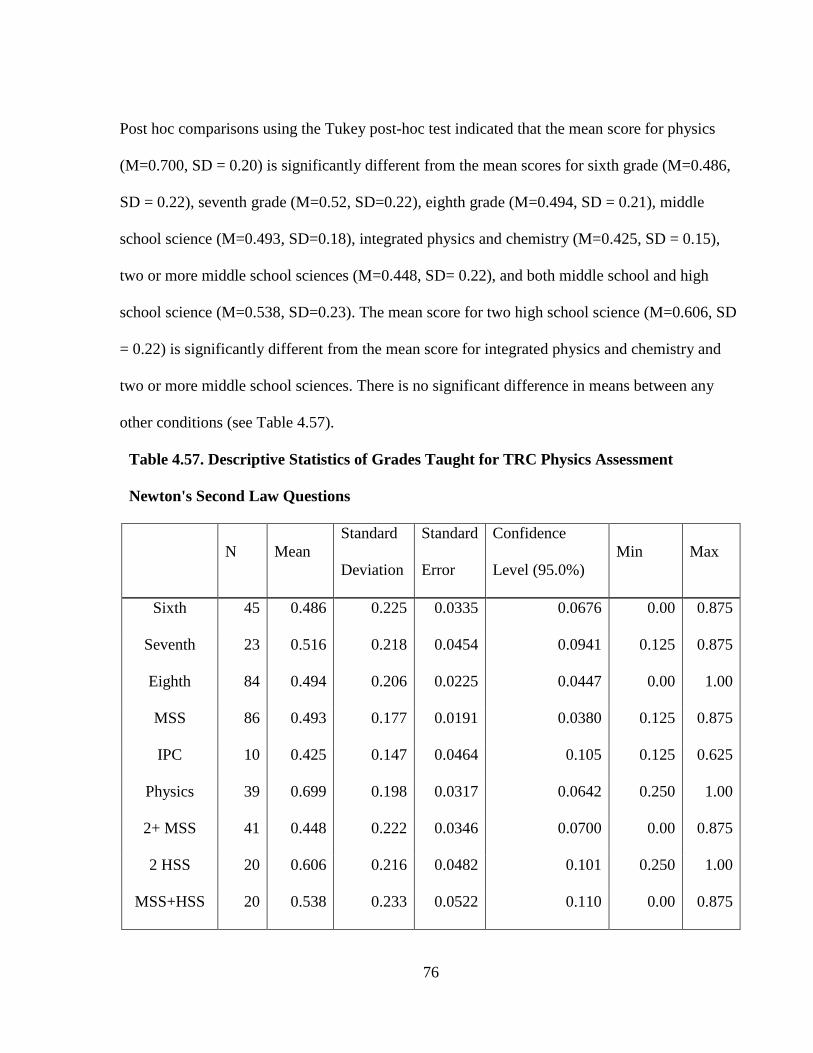
76
Post hoc comparisons using the Tukey post-hoc test indicated that the mean score for physics
(M=0.700, SD = 0.20) is significantly different from the mean scores for sixth grade (M=0.486,
SD = 0.22), seventh grade (M=0.52, SD=0.22), eighth grade (M=0.494, SD = 0.21), middle
school science (M=0.493, SD=0.18), integrated physics and chemistry (M=0.425, SD = 0.15),
two or more middle school sciences (M=0.448, SD= 0.22), and both middle school and high
school science (M=0.538, SD=0.23). The mean score for two high school science (M=0.606, SD
= 0.22) is significantly different from the mean score for integrated physics and chemistry and
two or more middle school sciences. There is no significant difference in means between any
other conditions (see Table 4.57).
Table 4.57. Descriptive Statistics of Grades Taught for TRC Physics Assessment
Newton's Second Law Questions
N Mean
Standard
Deviation
Standard
Error
Confidence
Level (95.0%)
Min Max
Sixth 45 0.486 0.225 0.0335 0.0676 0.00 0.875
Seventh 23 0.516 0.218 0.0454 0.0941 0.125 0.875
Eighth 84 0.494 0.206 0.0225 0.0447 0.00 1.00
MSS 86 0.493 0.177 0.0191 0.0380 0.125 0.875
IPC 10 0.425 0.147 0.0464 0.105 0.125 0.625
Physics 39 0.699 0.198 0.0317 0.0642 0.250 1.00
2+ MSS 41 0.448 0.222 0.0346 0.0700 0.00 0.875
2 HSS 20 0.606 0.216 0.0482 0.101 0.250 1.00
MSS+HSS 20 0.538 0.233 0.0522 0.110 0.00 0.875
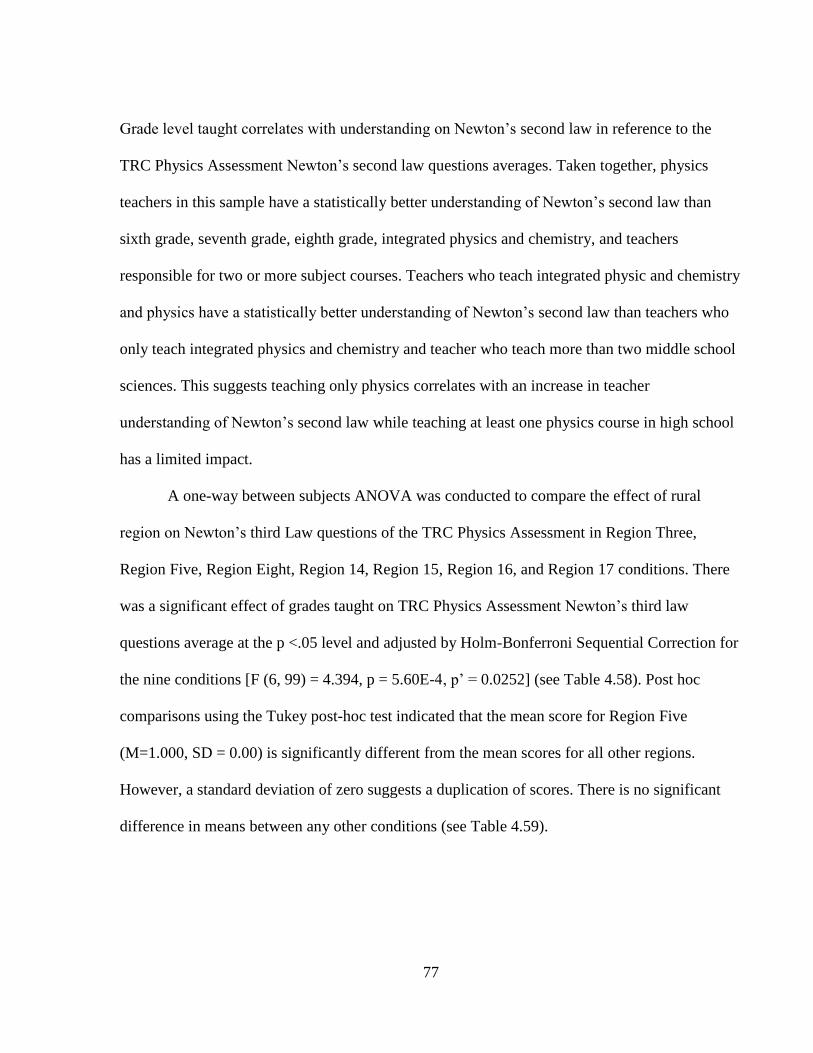
77
Grade level taught correlates with understanding on Newton’s second law in reference to the
TRC Physics Assessment Newton’s second law questions averages. Taken together, physics
teachers in this sample have a statistically better understanding of Newton’s second law than
sixth grade, seventh grade, eighth grade, integrated physics and chemistry, and teachers
responsible for two or more subject courses. Teachers who teach integrated physic and chemistry
and physics have a statistically better understanding of Newton’s second law than teachers who
only teach integrated physics and chemistry and teacher who teach more than two middle school
sciences. This suggests teaching only physics correlates with an increase in teacher
understanding of Newton’s second law while teaching at least one physics course in high school
has a limited impact.
A one-way between subjects ANOVA was conducted to compare the effect of rural
region on Newton’s third Law questions of the TRC Physics Assessment in Region Three,
Region Five, Region Eight, Region 14, Region 15, Region 16, and Region 17 conditions. There
was a significant effect of grades taught on TRC Physics Assessment Newton’s third law
questions average at the p <.05 level and adjusted by Holm-Bonferroni Sequential Correction for
the nine conditions [F (6, 99) = 4.394, p = 5.60E-4, p’ = 0.0252] (see Table 4.58). Post hoc
comparisons using the Tukey post-hoc test indicated that the mean score for Region Five
(M=1.000, SD = 0.00) is significantly different from the mean scores for all other regions.
However, a standard deviation of zero suggests a duplication of scores. There is no significant
difference in means between any other conditions (see Table 4.59).
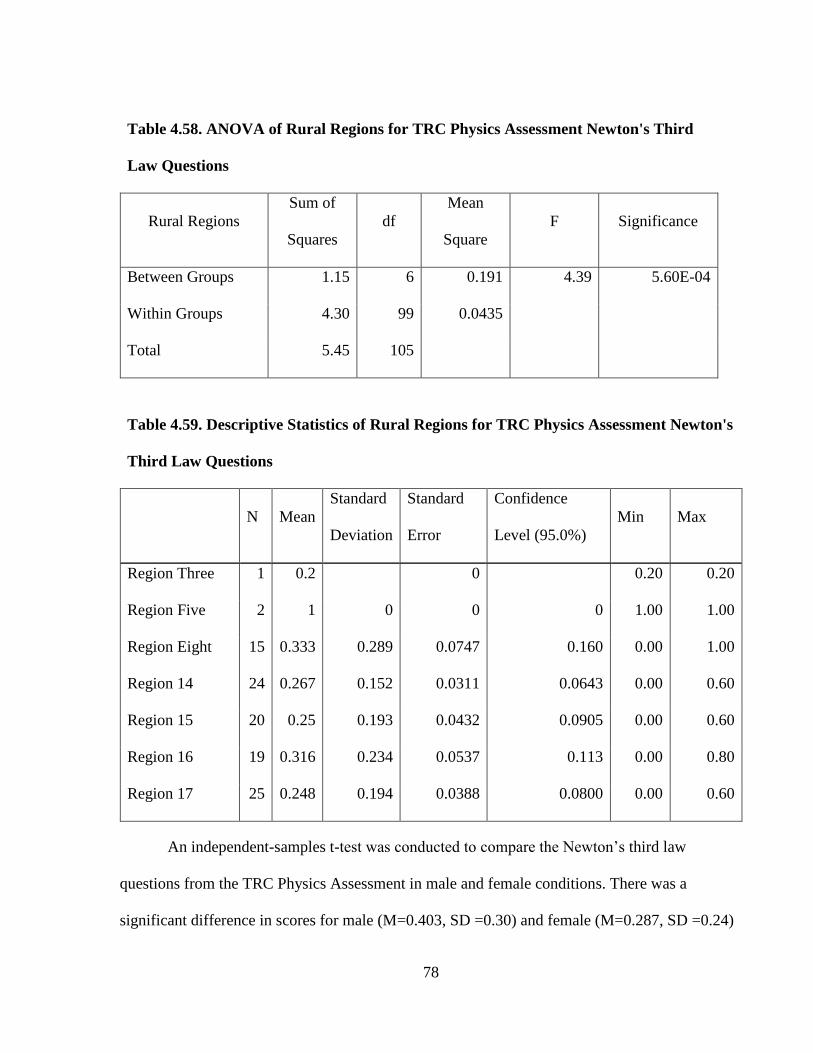
78
Table 4.58. ANOVA of Rural Regions for TRC Physics Assessment Newton's Third
Law Questions
Rural Regions
Sum of
Squares
df
Mean
Square
F Significance
Between Groups 1.15 6 0.191 4.39 5.60E-04
Within Groups 4.30 99 0.0435
Total 5.45 105
Table 4.59. Descriptive Statistics of Rural Regions for TRC Physics Assessment Newton's
Third Law Questions
N Mean
Standard
Deviation
Standard
Error
Confidence
Level (95.0%)
Min Max
Region Three 1 0.2 0 0.20 0.20
Region Five 2 1 0 0 0 1.00 1.00
Region Eight 15 0.333 0.289 0.0747 0.160 0.00 1.00
Region 14 24 0.267 0.152 0.0311 0.0643 0.00 0.60
Region 15 20 0.25 0.193 0.0432 0.0905 0.00 0.60
Region 16 19 0.316 0.234 0.0537 0.113 0.00 0.80
Region 17 25 0.248 0.194 0.0388 0.0800 0.00 0.60
An independent-samples t-test was conducted to compare the Newton’s third law
questions from the TRC Physics Assessment in male and female conditions. There was a
significant difference in scores for male (M=0.403, SD =0.30) and female (M=0.287, SD =0.24)
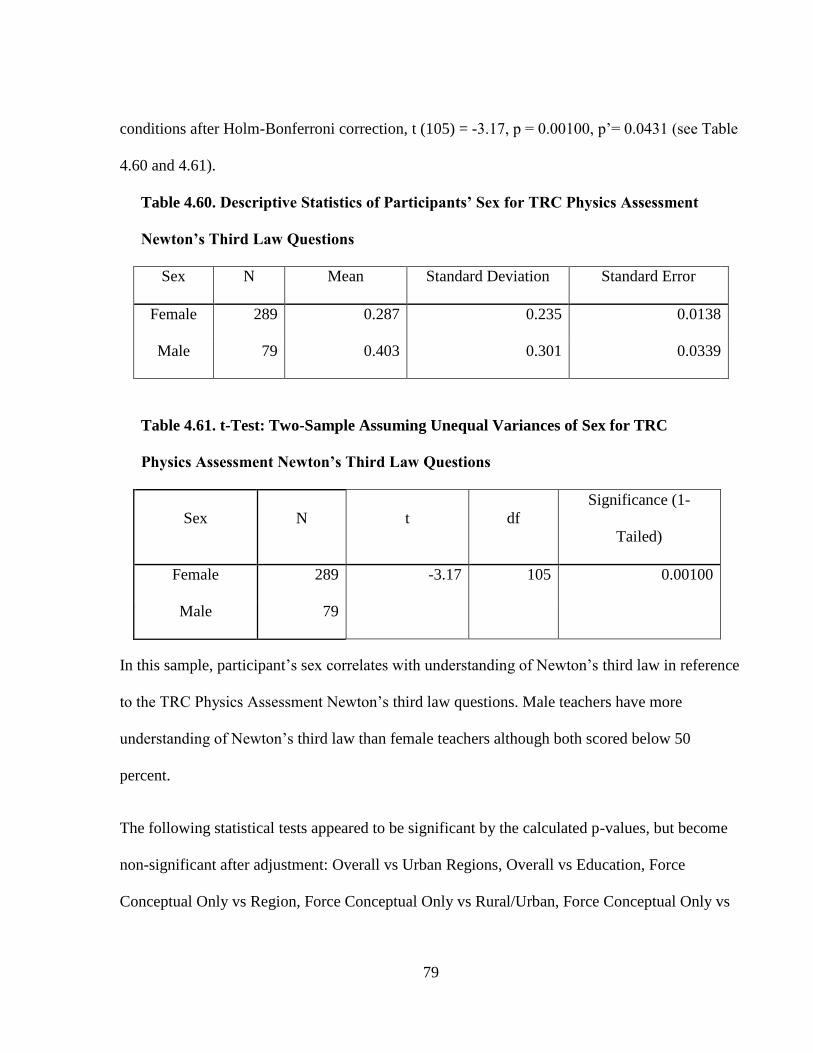
79
conditions after Holm-Bonferroni correction, t (105) = -3.17, p = 0.00100, p’= 0.0431 (see Table
4.60 and 4.61).
Table 4.60. Descriptive Statistics of Participants’ Sex for TRC Physics Assessment
Newton’s Third Law Questions
Sex N Mean Standard Deviation Standard Error
Female 289 0.287 0.235 0.0138
Male 79 0.403 0.301 0.0339
Table 4.61. t-Test: Two-Sample Assuming Unequal Variances of Sex for TRC
Physics Assessment Newton’s Third Law Questions
Sex N t df
Significance (1-
Tailed)
Female 289 -3.17 105 0.00100
Male 79
In this sample, participant’s sex correlates with understanding of Newton’s third law in reference
to the TRC Physics Assessment Newton’s third law questions. Male teachers have more
understanding of Newton’s third law than female teachers although both scored below 50
percent.
The following statistical tests appeared to be significant by the calculated p-values, but become
non-significant after adjustment: Overall vs Urban Regions, Overall vs Education, Force
Conceptual Only vs Region, Force Conceptual Only vs Rural/Urban, Force Conceptual Only vs
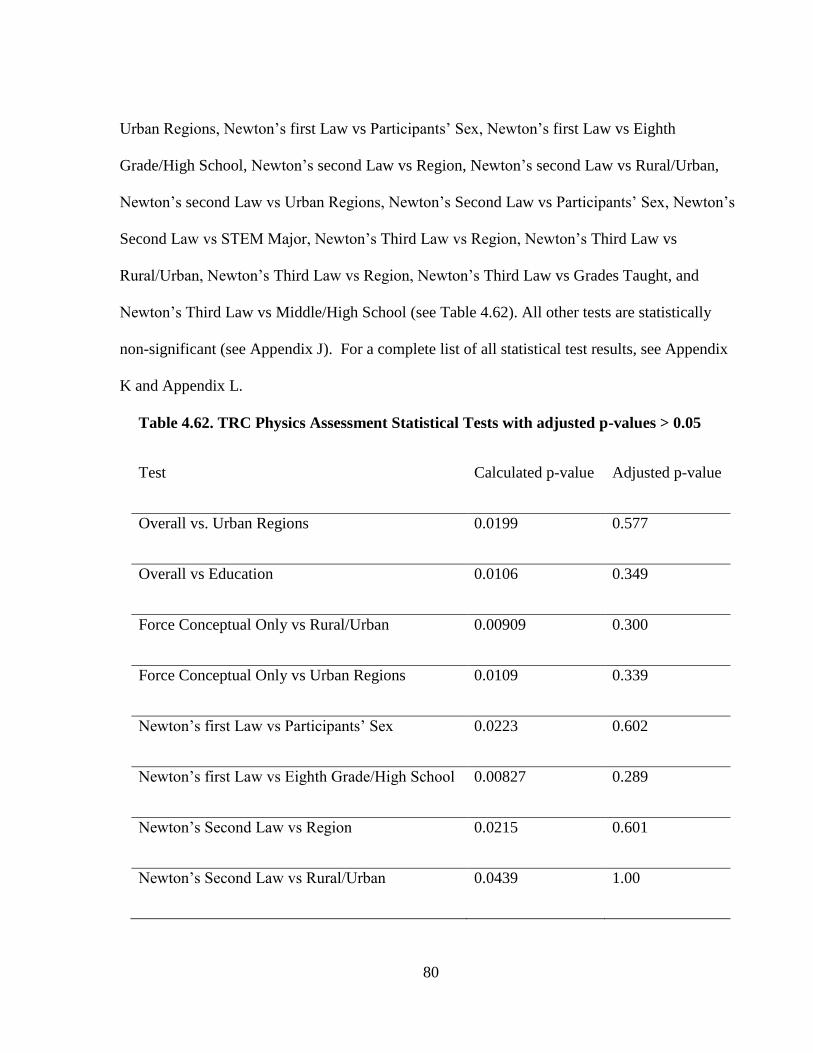
80
Urban Regions, Newton’s first Law vs Participants’ Sex, Newton’s first Law vs Eighth
Grade/High School, Newton’s second Law vs Region, Newton’s second Law vs Rural/Urban,
Newton’s second Law vs Urban Regions, Newton’s Second Law vs Participants’ Sex, Newton’s
Second Law vs STEM Major, Newton’s Third Law vs Region, Newton’s Third Law vs
Rural/Urban, Newton’s Third Law vs Region, Newton’s Third Law vs Grades Taught, and
Newton’s Third Law vs Middle/High School (see Table 4.62). All other tests are statistically
non-significant (see Appendix J). For a complete list of all statistical test results, see Appendix
K and Appendix L.
Table 4.62. TRC Physics Assessment Statistical Tests with adjusted p-values > 0.05
Test Calculated p-value Adjusted p-value
Overall vs. Urban Regions 0.0199 0.577
Overall vs Education 0.0106 0.349
Force Conceptual Only vs Rural/Urban 0.00909 0.300
Force Conceptual Only vs Urban Regions 0.0109 0.339
Newton’s first Law vs Participants’ Sex 0.0223 0.602
Newton’s first Law vs Eighth Grade/High School 0.00827 0.289
Newton’s Second Law vs Region 0.0215 0.601
Newton’s Second Law vs Rural/Urban 0.0439 1.00
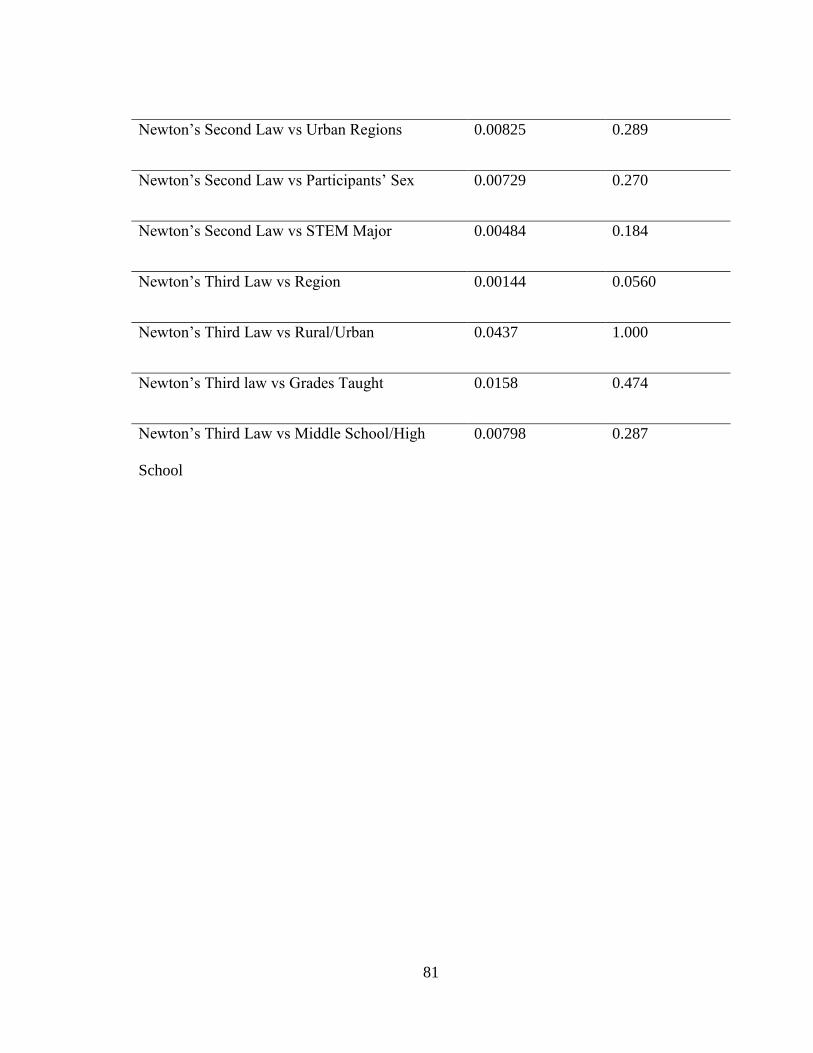
81
Newton’s Second Law vs Urban Regions 0.00825 0.289
Newton’s Second Law vs Participants’ Sex 0.00729 0.270
Newton’s Second Law vs STEM Major 0.00484 0.184
Newton’s Third Law vs Region 0.00144 0.0560
Newton’s Third Law vs Rural/Urban 0.0437 1.000
Newton’s Third law vs Grades Taught 0.0158 0.474
Newton’s Third Law vs Middle School/High
School
0.00798 0.287
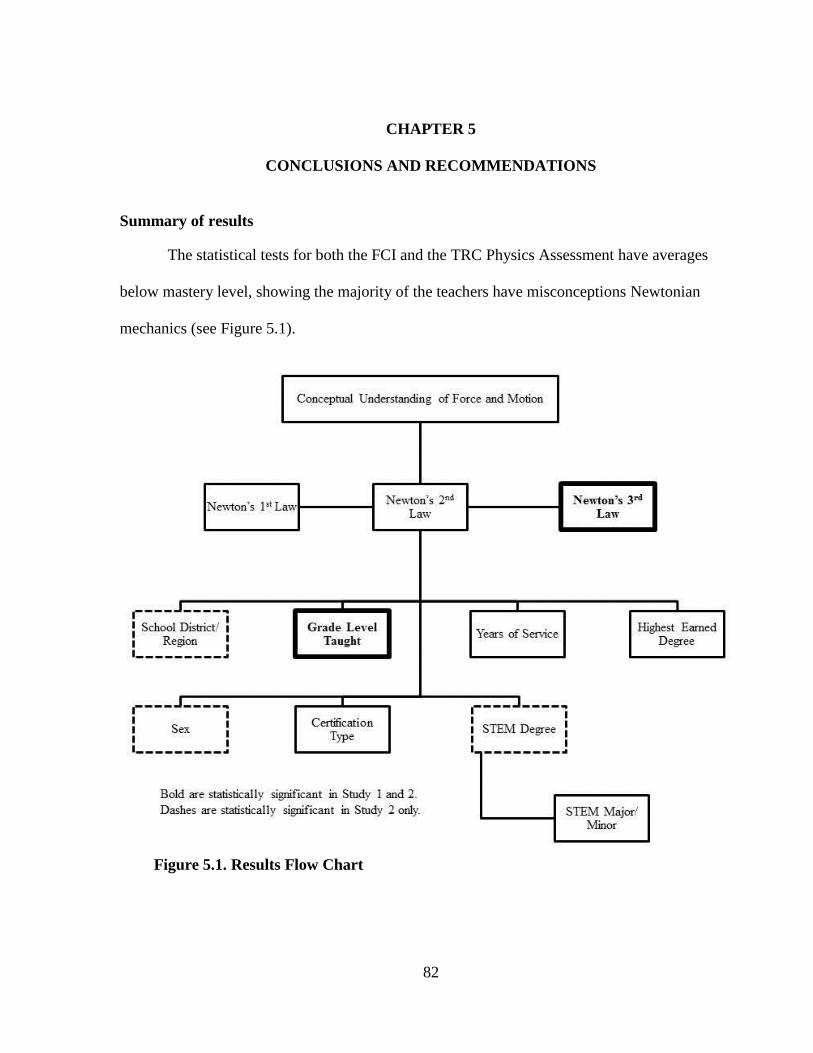
82
CHAPTER 5
CONCLUSIONS AND RECOMMENDATIONS
Summary of results
The statistical tests for both the FCI and the TRC Physics Assessment have averages
below mastery level, showing the majority of the teachers have misconceptions Newtonian
mechanics (see Figure 5.1).
Figure 5.1. Results Flow Chart
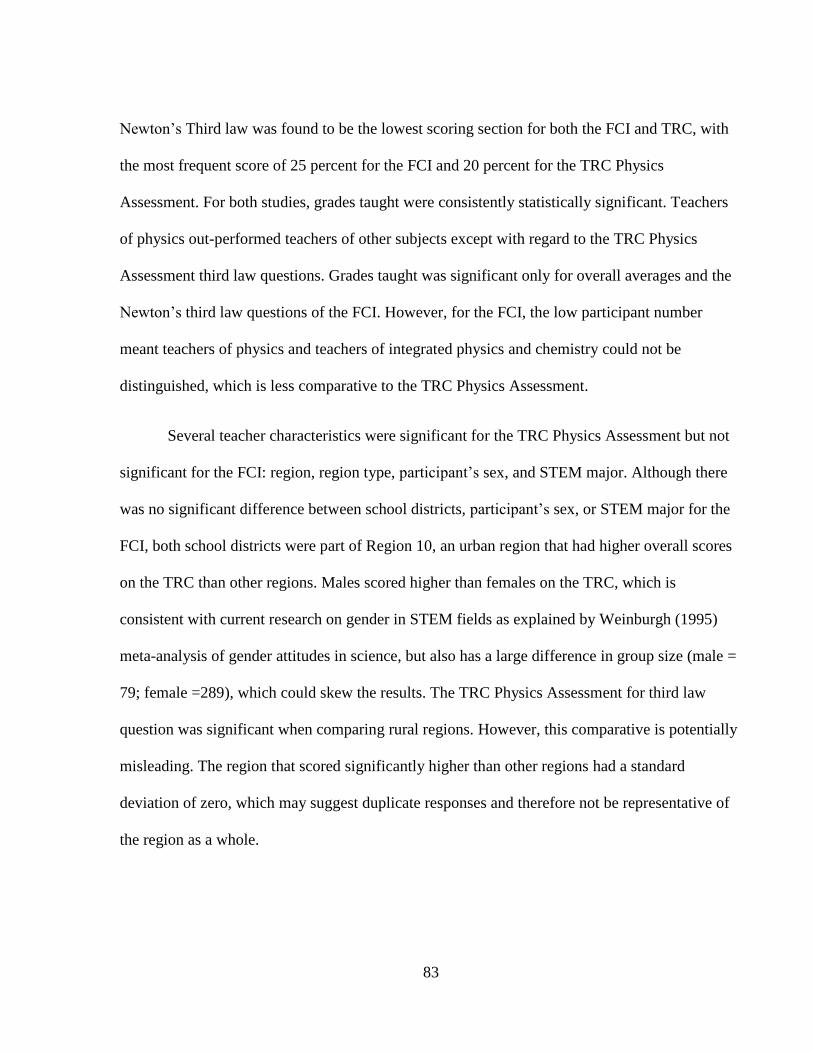
83
Newton’s Third law was found to be the lowest scoring section for both the FCI and TRC, with
the most frequent score of 25 percent for the FCI and 20 percent for the TRC Physics
Assessment. For both studies, grades taught were consistently statistically significant. Teachers
of physics out-performed teachers of other subjects except with regard to the TRC Physics
Assessment third law questions. Grades taught was significant only for overall averages and the
Newton’s third law questions of the FCI. However, for the FCI, the low participant number
meant teachers of physics and teachers of integrated physics and chemistry could not be
distinguished, which is less comparative to the TRC Physics Assessment.
Several teacher characteristics were significant for the TRC Physics Assessment but not
significant for the FCI: region, region type, participant’s sex, and STEM major. Although there
was no significant difference between school districts, participant’s sex, or STEM major for the
FCI, both school districts were part of Region 10, an urban region that had higher overall scores
on the TRC than other regions. Males scored higher than females on the TRC, which is
consistent with current research on gender in STEM fields as explained by Weinburgh (1995)
meta-analysis of gender attitudes in science, but also has a large difference in group size (male =
79; female =289), which could skew the results. The TRC Physics Assessment for third law
question was significant when comparing rural regions. However, this comparative is potentially
misleading. The region that scored significantly higher than other regions had a standard
deviation of zero, which may suggest duplicate responses and therefore not be representative of
the region as a whole.
84
Conclusion
Based on the findings of this study, the majority of Texas science teachers responsible for
teaching physical science have not mastered at least a portion of the physical science content
they are teaching. These findings appear state-wide and cross sex of teacher, location, years of
service, STEM education, and certification. Teachers in this study had particular difficulty with
questions on Newton’s third law of motion.
In this study, teachers of physics demonstrated a better understanding than teachers of
other science courses, but on average, did not reach the mastery level of conceptual knowledge
in Newtonian mechanics according to the FCI and TRC Physics Assessment. The lack of
knowledge corresponds to the Neuschatz and McFarling (2000) findings on the low number of
physics teachers who majored in physics. Without a large number of teachers with physics
degrees in the teacher population, there is a higher likelihood that misconceptions will be
embedded in the curriculum presented to the students (Burgoon et al., 2009).
Middle school teachers were the lowest performing group, suggesting this teacher
population has the most misconceptions. This corresponds with the finding of the Harrell (2010)
study on eighth grade science teachers in Texas, suggesting that the loophole in certification for
middle school science is allowing physical science to be taught by unprepared teachers. A
prevalence of misconceptions among middle school teachers is particularly concerning because
according to the TEKS, sixth grade science introduces force and motion in terms of Newton’s
three laws of motion and eighth grade science continues these concepts which are then tested on
the state assessment (see Appendix M). If these teachers have insufficient knowledge of physical
85
science content, then their students are likely to have major misconceptions that will have to be
addressed in physics before students are able to be successful (Berg & Brouwer, 1991).
Equally concerning is the impact of years of service. There is no indication in this study
that years of service impact overall knowledge of physical science. This suggests that teachers
are continuing to teach physical science with insufficient knowledge of the content. The students
of these teachers continue to build misconceptions year after year, as long as the teacher is active
in his or her career.
Limitations
It is important to note that Study One using the FCI has a small sample size (n=24) which
makes findings suggestive but not conclusive. A possible influencing factor is that teacher
participation in Study One for School Districts A and B was strictly voluntary without provided
incentives. In Study Two, the TRC Physics Assessment did not undergo reliability and validity
testing before implementation due to time constraints in its creation, although it assessed similar
concepts to the FCI. The TRC demographic survey identified participants as either earning a
degree with a STEM major or not, but did not give specific information as to the undergraduate
major. The TRC demographic survey also did not collect information about current teacher
certificates held by each participant. The participants in the TRC are not necessarily
representative of the entire Texas teacher population. The TRC requires 100 hours of
professional development over the school year, which deters some teachers from participating.
The TRC also offers incentives for joining, such as stipends, classroom supplies and resources,
free technology instruments, or scholarship money for graduate coursework. These incentives
86
create a self-selection bias in the sample, particularly with regards to motivation and amount of
prior professional development.
Recommendations
Based on the findings and conclusions in this study, the following recommendations are
offered.
1. Middle school science teacher certification should be limited to a science certification
that includes physical science.
2. Physical science curriculum presented should address specific facets on Newton’s third
law in order to correct teacher misconceptions.
3. Physics teachers can serve as mentors for physical science content knowledge, as they are
the most likely to understand it.
4. Teachers of record for middle school science, integrated physics and chemistry, and
physics should have specialized professional development in Newton’s laws from a
physics education expert to correct teacher misconceptions regardless of years of service.
Future Research
This study was able to show that the majority of science teachers do not understand at
least some of the physical science content they are teaching. However, this study is unable to
indicate what specific misconceptions regarding Newton’s laws of motion this teacher
population has and how best to combat them. Future research into why teachers chose specific
incorrect answers would be insightful for building a professional development to correct teacher
87
knowledge. This study focused on physical science, but similar trends may appear in other
subjects, specifically chemistry and earth science. Some research has suggested similar trends
(Kind, 2014), but these should be explored more thoroughly. Middle school science has the most
certification routes that do not require physical science knowledge, especially in sixth grade. A
study between specific middle school certifications and teacher knowledge needs to researched,
but is beyond the scope of this study.
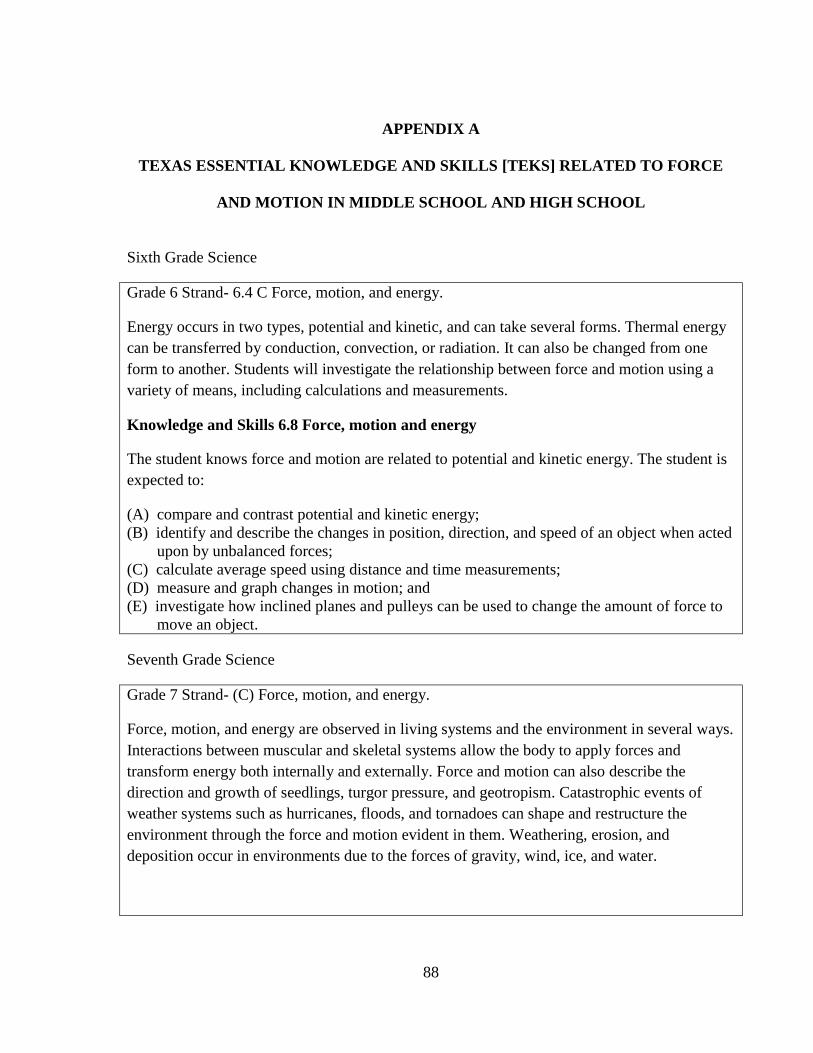
88
APPENDIX A
TEXAS ESSENTIAL KNOWLEDGE AND SKILLS [TEKS] RELATED TO FORCE
AND MOTION IN MIDDLE SCHOOL AND HIGH SCHOOL
Sixth Grade Science
Grade 6 Strand- 6.4 C Force, motion, and energy.
Energy occurs in two types, potential and kinetic, and can take several forms. Thermal energy
can be transferred by conduction, convection, or radiation. It can also be changed from one
form to another. Students will investigate the relationship between force and motion using a
variety of means, including calculations and measurements.
Knowledge and Skills 6.8 Force, motion and energy
The student knows force and motion are related to potential and kinetic energy. The student is
expected to:
(A) compare and contrast potential and kinetic energy;
(B) identify and describe the changes in position, direction, and speed of an object when acted
upon by unbalanced forces;
(C) calculate average speed using distance and time measurements;
(D) measure and graph changes in motion; and
(E) investigate how inclined planes and pulleys can be used to change the amount of force to
move an object.
Seventh Grade Science
Grade 7 Strand- (C) Force, motion, and energy.
Force, motion, and energy are observed in living systems and the environment in several ways.
Interactions between muscular and skeletal systems allow the body to apply forces and
transform energy both internally and externally. Force and motion can also describe the
direction and growth of seedlings, turgor pressure, and geotropism. Catastrophic events of
weather systems such as hurricanes, floods, and tornadoes can shape and restructure the
environment through the force and motion evident in them. Weathering, erosion, and
deposition occur in environments due to the forces of gravity, wind, ice, and water.
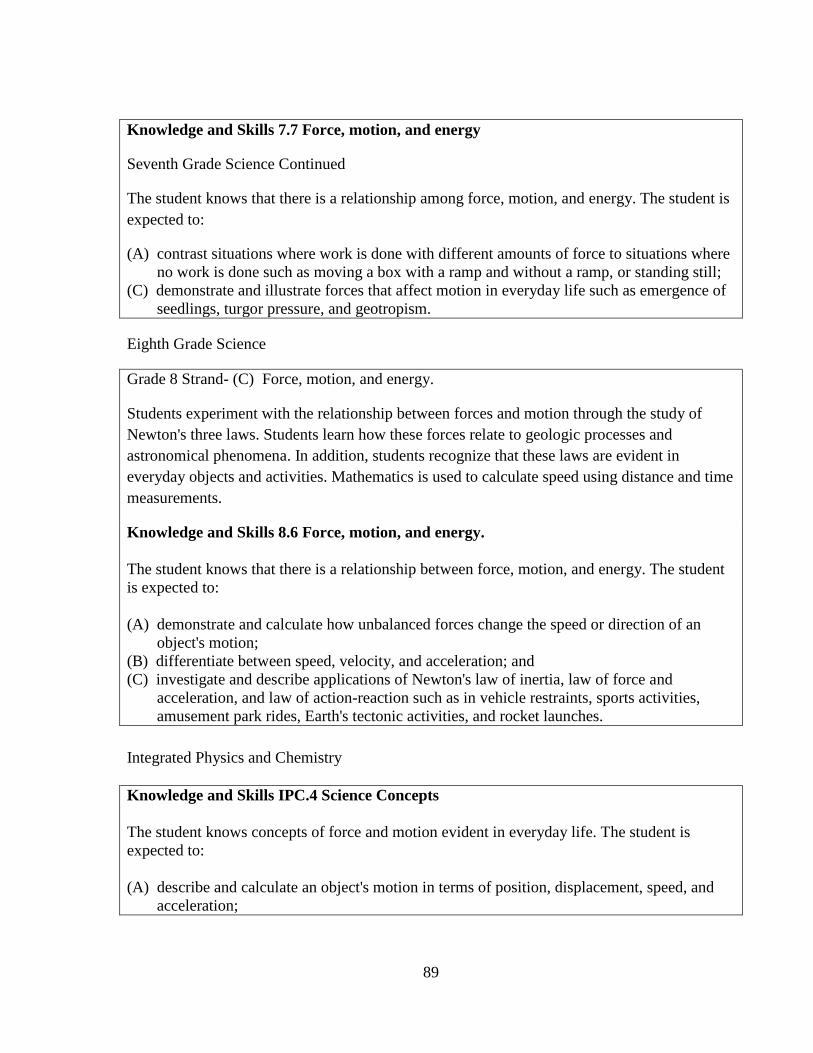
89
Knowledge and Skills 7.7 Force, motion, and energy
Seventh Grade Science Continued
The student knows that there is a relationship among force, motion, and energy. The student is
expected to:
(A) contrast situations where work is done with different amounts of force to situations where
no work is done such as moving a box with a ramp and without a ramp, or standing still;
(C) demonstrate and illustrate forces that affect motion in everyday life such as emergence of
seedlings, turgor pressure, and geotropism.
Eighth Grade Science
Grade 8 Strand- (C) Force, motion, and energy.
Students experiment with the relationship between forces and motion through the study of
Newton's three laws. Students learn how these forces relate to geologic processes and
astronomical phenomena. In addition, students recognize that these laws are evident in
everyday objects and activities. Mathematics is used to calculate speed using distance and time
measurements.
Knowledge and Skills 8.6 Force, motion, and energy.
The student knows that there is a relationship between force, motion, and energy. The student
is expected to:
(A) demonstrate and calculate how unbalanced forces change the speed or direction of an
object's motion;
(B) differentiate between speed, velocity, and acceleration; and
(C) investigate and describe applications of Newton's law of inertia, law of force and
acceleration, and law of action-reaction such as in vehicle restraints, sports activities,
amusement park rides, Earth's tectonic activities, and rocket launches.
Integrated Physics and Chemistry
Knowledge and Skills IPC.4 Science Concepts
The student knows concepts of force and motion evident in everyday life. The student is
expected to:
(A) describe and calculate an object's motion in terms of position, displacement, speed, and
acceleration;
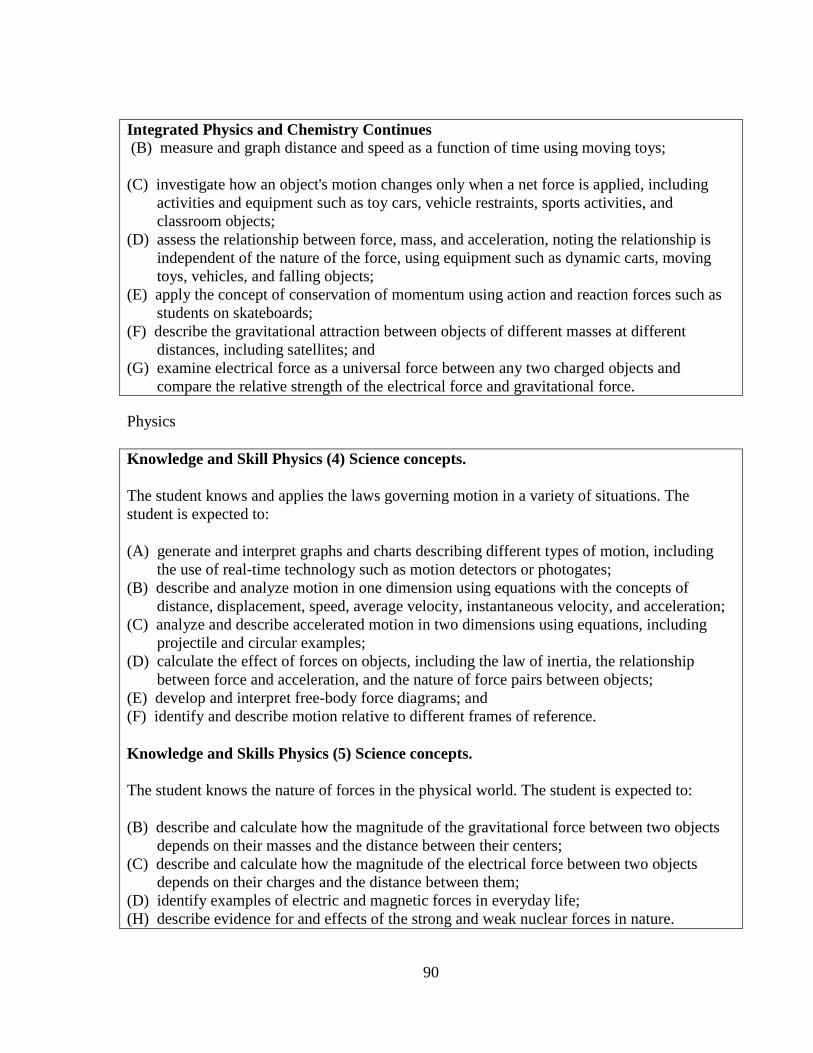
90
Integrated Physics and Chemistry Continues
(B) measure and graph distance and speed as a function of time using moving toys;
(C) investigate how an object's motion changes only when a net force is applied, including
activities and equipment such as toy cars, vehicle restraints, sports activities, and
classroom objects;
(D) assess the relationship between force, mass, and acceleration, noting the relationship is
independent of the nature of the force, using equipment such as dynamic carts, moving
toys, vehicles, and falling objects;
(E) apply the concept of conservation of momentum using action and reaction forces such as
students on skateboards;
(F) describe the gravitational attraction between objects of different masses at different
distances, including satellites; and
(G) examine electrical force as a universal force between any two charged objects and
compare the relative strength of the electrical force and gravitational force.
Physics
Knowledge and Skill Physics (4) Science concepts.
The student knows and applies the laws governing motion in a variety of situations. The
student is expected to:
(A) generate and interpret graphs and charts describing different types of motion, including
the use of real-time technology such as motion detectors or photogates;
(B) describe and analyze motion in one dimension using equations with the concepts of
distance, displacement, speed, average velocity, instantaneous velocity, and acceleration;
(C) analyze and describe accelerated motion in two dimensions using equations, including
projectile and circular examples;
(D) calculate the effect of forces on objects, including the law of inertia, the relationship
between force and acceleration, and the nature of force pairs between objects;
(E) develop and interpret free-body force diagrams; and
(F) identify and describe motion relative to different frames of reference.
Knowledge and Skills Physics (5) Science concepts.
The student knows the nature of forces in the physical world. The student is expected to:
(B) describe and calculate how the magnitude of the gravitational force between two objects
depends on their masses and the distance between their centers;
(C) describe and calculate how the magnitude of the electrical force between two objects
depends on their charges and the distance between them;
(D) identify examples of electric and magnetic forces in everyday life;
(H) describe evidence for and effects of the strong and weak nuclear forces in nature.
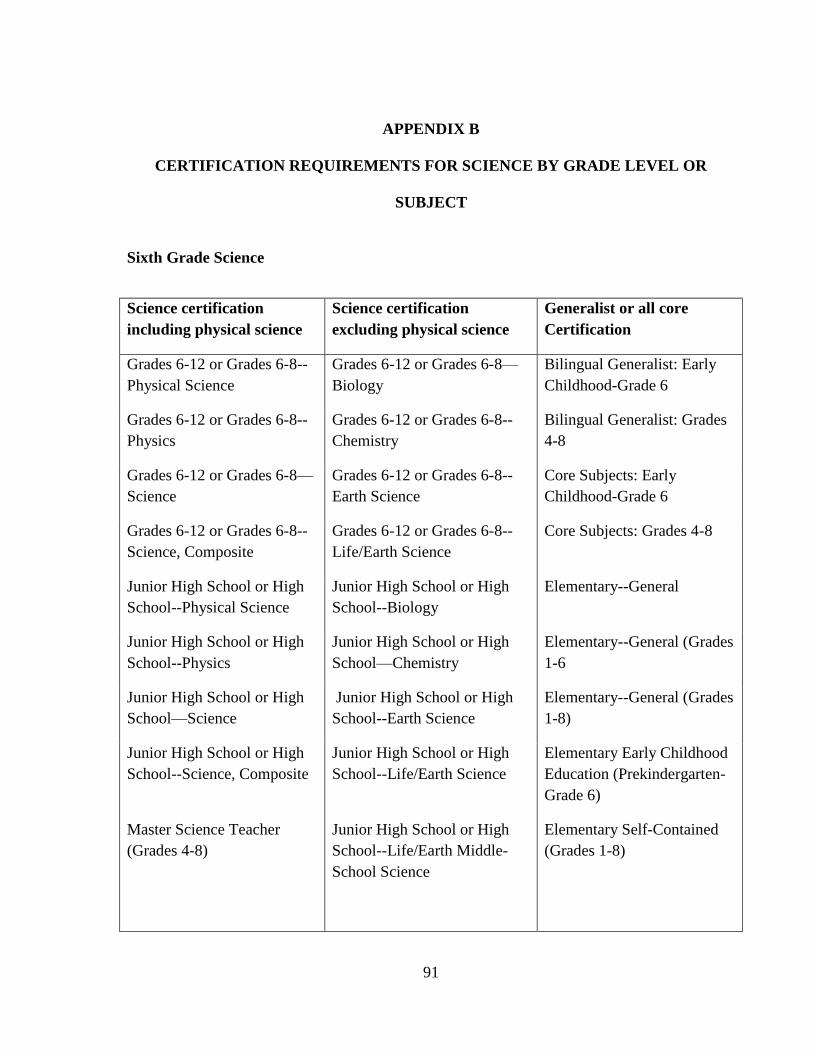
91
APPENDIX B
CERTIFICATION REQUIREMENTS FOR SCIENCE BY GRADE LEVEL OR
SUBJECT
Sixth Grade Science
Science certification
including physical science
Science certification
excluding physical science
Generalist or all core
Certification
Grades 6-12 or Grades 6-8--
Physical Science
Grades 6-12 or Grades 6-8—
Biology
Bilingual Generalist: Early
Childhood-Grade 6
Grades 6-12 or Grades 6-8--
Physics
Grades 6-12 or Grades 6-8--
Chemistry
Bilingual Generalist: Grades
4-8
Grades 6-12 or Grades 6-8—
Science
Grades 6-12 or Grades 6-8--
Earth Science
Core Subjects: Early
Childhood-Grade 6
Grades 6-12 or Grades 6-8--
Science, Composite
Grades 6-12 or Grades 6-8--
Life/Earth Science
Core Subjects: Grades 4-8
Junior High School or High
School--Physical Science
Junior High School or High
School--Biology
Elementary--General
Junior High School or High
School--Physics
Junior High School or High
School—Chemistry
Elementary--General (Grades
1-6
Junior High School or High
School—Science
Junior High School or High
School--Earth Science
Elementary--General (Grades
1-8)
Junior High School or High
School--Science, Composite
Junior High School or High
School--Life/Earth Science
Elementary Early Childhood
Education (Prekindergarten-
Grade 6)
Master Science Teacher
(Grades 4-8)
Junior High School or High
School--Life/Earth Middle-
School Science
Elementary Self-Contained
(Grades 1-8)
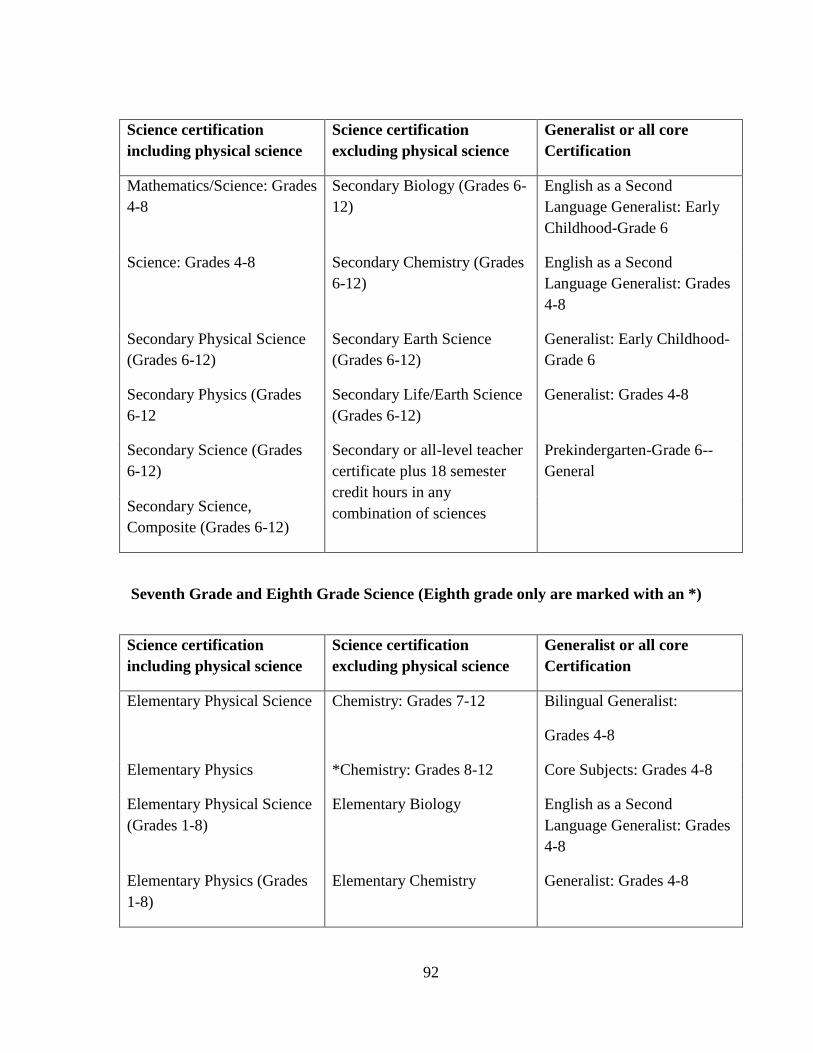
92
Science certification
including physical science
Science certification
excluding physical science
Generalist or all core
Certification
Mathematics/Science: Grades
4-8
Secondary Biology (Grades 6-
12)
English as a Second
Language Generalist: Early
Childhood-Grade 6
Science: Grades 4-8 Secondary Chemistry (Grades
6-12)
English as a Second
Language Generalist: Grades
4-8
Secondary Physical Science
(Grades 6-12)
Secondary Earth Science
(Grades 6-12)
Generalist: Early Childhood-
Grade 6
Secondary Physics (Grades
6-12
Secondary Life/Earth Science
(Grades 6-12)
Generalist: Grades 4-8
Secondary Science (Grades
6-12)
Secondary or all-level teacher
certificate plus 18 semester
credit hours in any
combination of sciences
Prekindergarten-Grade 6--
General
Secondary Science,
Composite (Grades 6-12)
Seventh Grade and Eighth Grade Science (Eighth grade only are marked with an *)
Science certification
including physical science
Science certification
excluding physical science
Generalist or all core
Certification
Elementary Physical Science Chemistry: Grades 7-12 Bilingual Generalist:
Grades 4-8
Elementary Physics *Chemistry: Grades 8-12 Core Subjects: Grades 4-8
Elementary Physical Science
(Grades 1-8)
Elementary Biology English as a Second
Language Generalist: Grades
4-8
Elementary Physics (Grades
1-8)
Elementary Chemistry Generalist: Grades 4-8
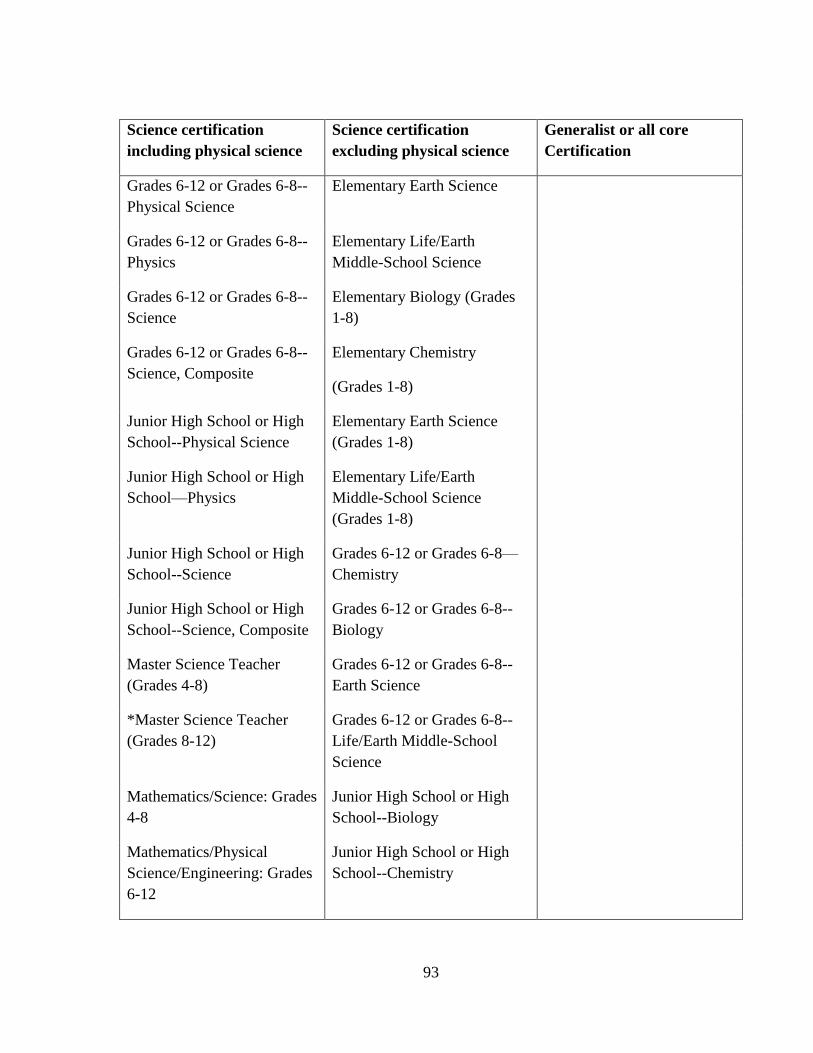
93
Science certification
including physical science
Science certification
excluding physical science
Generalist or all core
Certification
Grades 6-12 or Grades 6-8--
Physical Science
Elementary Earth Science
Grades 6-12 or Grades 6-8--
Physics
Elementary Life/Earth
Middle-School Science
Grades 6-12 or Grades 6-8--
Science
Elementary Biology (Grades
1-8)
Grades 6-12 or Grades 6-8--
Science, Composite
Elementary Chemistry
(Grades 1-8)
Junior High School or High
School--Physical Science
Elementary Earth Science
(Grades 1-8)
Junior High School or High
School—Physics
Elementary Life/Earth
Middle-School Science
(Grades 1-8)
Junior High School or High
School--Science
Grades 6-12 or Grades 6-8—
Chemistry
Junior High School or High
School--Science, Composite
Grades 6-12 or Grades 6-8--
Biology
Master Science Teacher
(Grades 4-8)
Grades 6-12 or Grades 6-8--
Earth Science
*Master Science Teacher
(Grades 8-12)
Grades 6-12 or Grades 6-8--
Life/Earth Middle-School
Science
Mathematics/Science: Grades
4-8
Junior High School or High
School--Biology
Mathematics/Physical
Science/Engineering: Grades
6-12
Junior High School or High
School--Chemistry
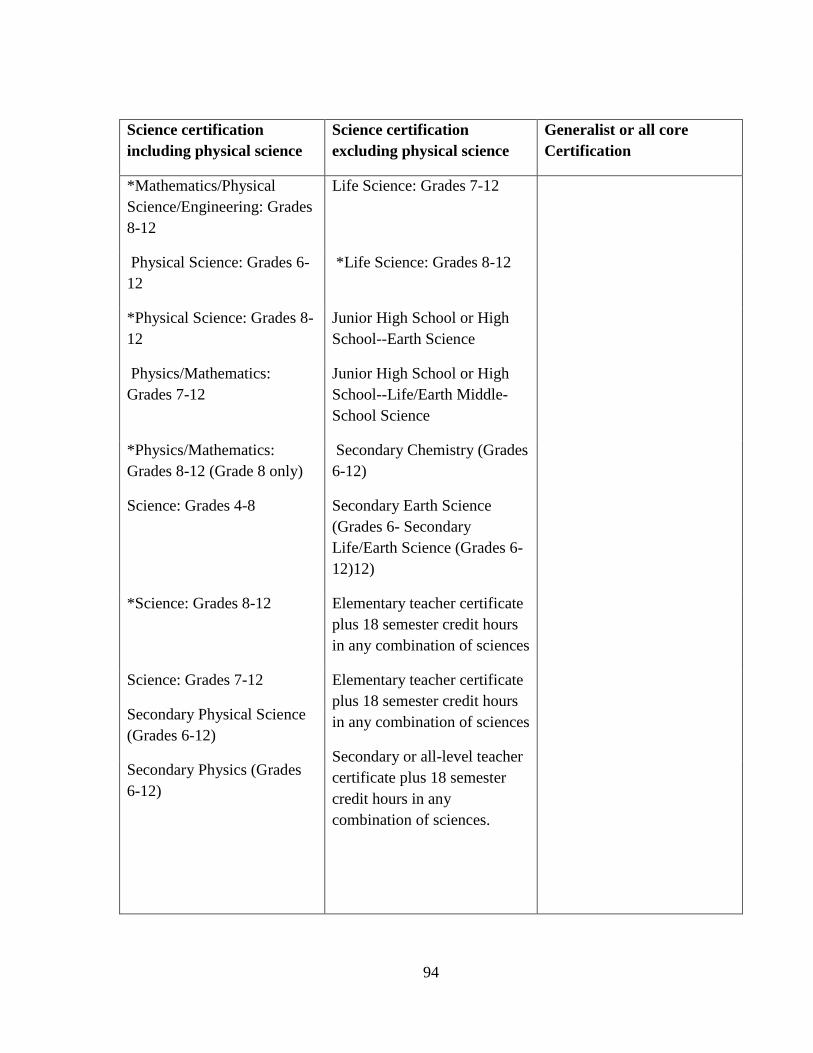
94
Science certification
including physical science
Science certification
excluding physical science
Generalist or all core
Certification
*Mathematics/Physical
Science/Engineering: Grades
8-12
Life Science: Grades 7-12
Physical Science: Grades 6-
12
*Life Science: Grades 8-12
*Physical Science: Grades 8-
12
Junior High School or High
School--Earth Science
Physics/Mathematics:
Grades 7-12
Junior High School or High
School--Life/Earth Middle-
School Science
*Physics/Mathematics:
Grades 8-12 (Grade 8 only)
Secondary Chemistry (Grades
6-12)
Science: Grades 4-8 Secondary Earth Science
(Grades 6- Secondary
Life/Earth Science (Grades 6-
12)12)
*Science: Grades 8-12 Elementary teacher certificate
plus 18 semester credit hours
in any combination of sciences
Science: Grades 7-12 Elementary teacher certificate
plus 18 semester credit hours
in any combination of sciences
Secondary or all-level teacher
certificate plus 18 semester
credit hours in any
combination of sciences.
Secondary Physical Science
(Grades 6-12)
Secondary Physics (Grades
6-12)
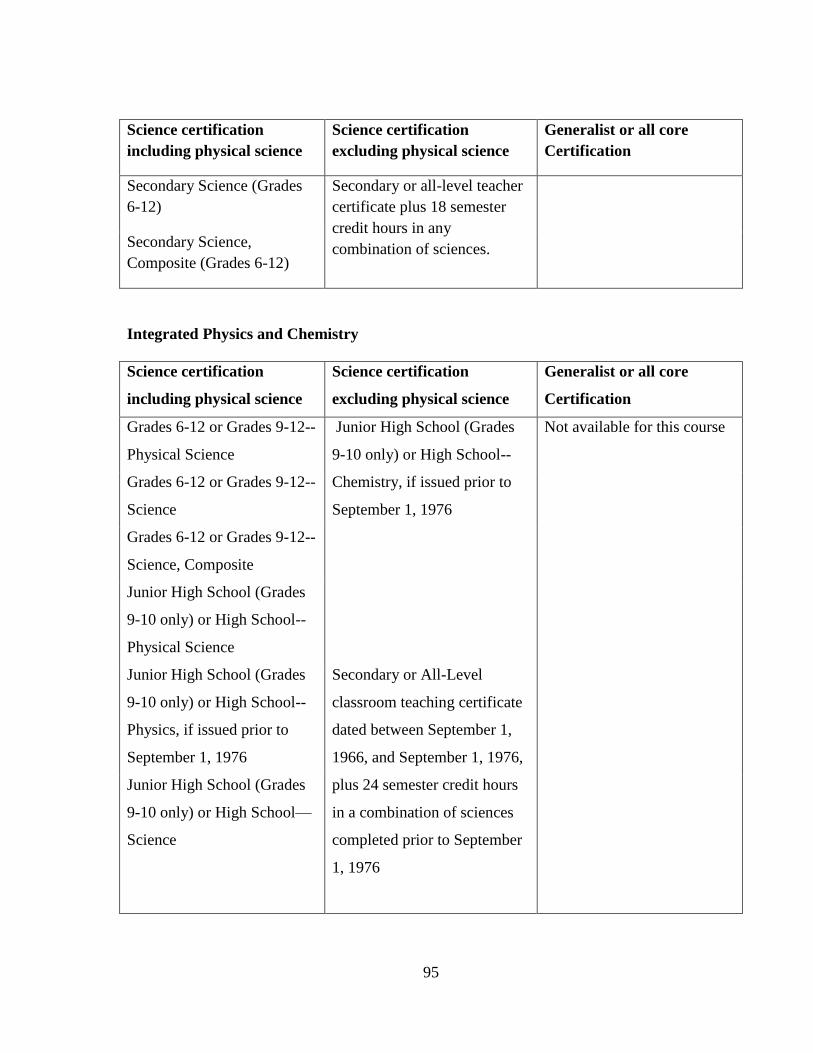
95
Science certification
including physical science
Science certification
excluding physical science
Generalist or all core
Certification
Secondary Science (Grades
6-12)
Secondary or all-level teacher
certificate plus 18 semester
credit hours in any
combination of sciences.
Secondary Science,
Composite (Grades 6-12)
Integrated Physics and Chemistry
Science certification
including physical science
Science certification
excluding physical science
Generalist or all core
Certification
Grades 6-12 or Grades 9-12--
Physical Science
Junior High School (Grades
9-10 only) or High School--
Chemistry, if issued prior to
September 1, 1976
Not available for this course
Grades 6-12 or Grades 9-12--
Science
Grades 6-12 or Grades 9-12--
Science, Composite
Junior High School (Grades
9-10 only) or High School--
Physical Science
Junior High School (Grades
9-10 only) or High School--
Physics, if issued prior to
September 1, 1976
Secondary or All-Level
classroom teaching certificate
dated between September 1,
1966, and September 1, 1976,
plus 24 semester credit hours
in a combination of sciences
completed prior to September
1, 1976
Junior High School (Grades
9-10 only) or High School—
Science
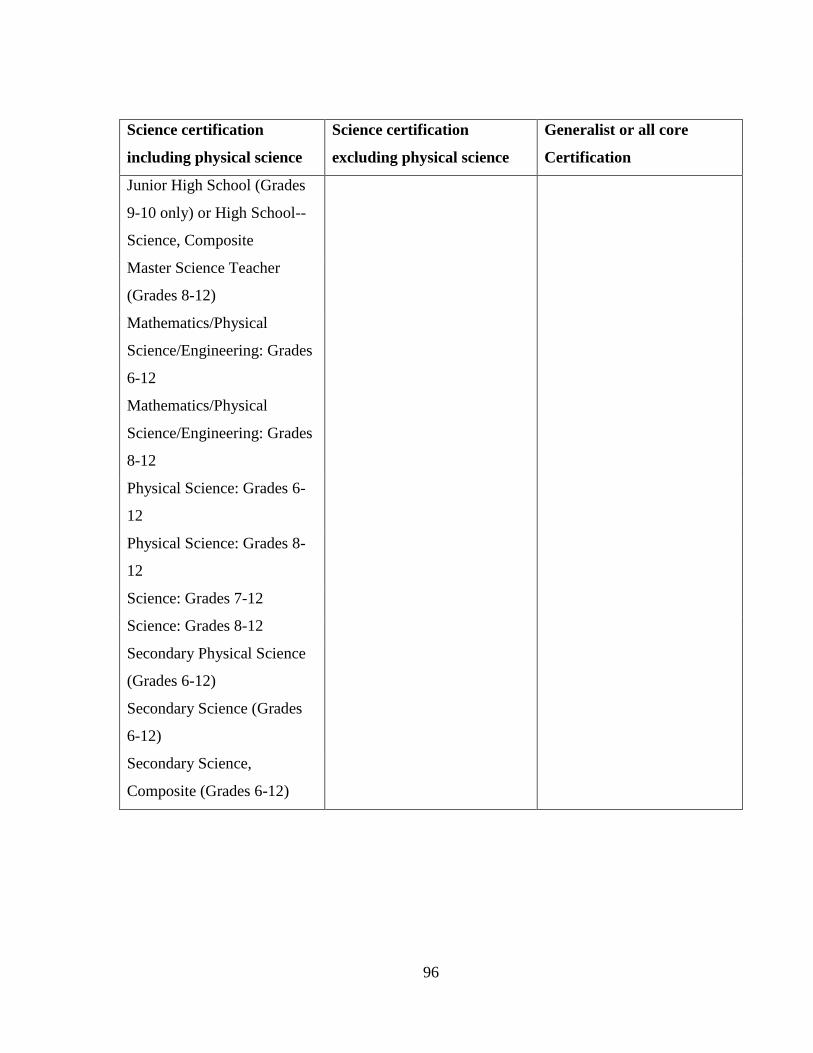
96
Science certification
including physical science
Science certification
excluding physical science
Generalist or all core
Certification
Junior High School (Grades
9-10 only) or High School--
Science, Composite
Master Science Teacher
(Grades 8-12)
Mathematics/Physical
Science/Engineering: Grades
6-12
Mathematics/Physical
Science/Engineering: Grades
8-12
Physical Science: Grades 6-
12
Physical Science: Grades 8-
12
Science: Grades 7-12
Science: Grades 8-12
Secondary Physical Science
(Grades 6-12)
Secondary Science (Grades
6-12)
Secondary Science,
Composite (Grades 6-12)
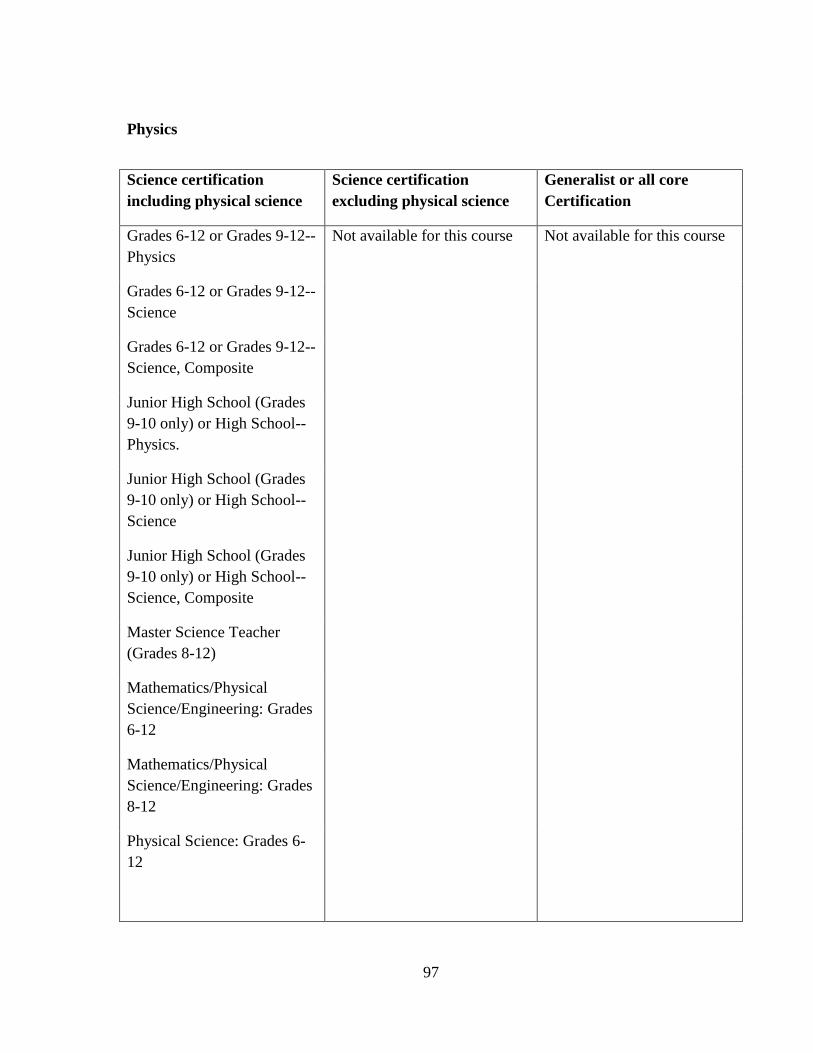
97
Physics
Science certification
including physical science
Science certification
excluding physical science
Generalist or all core
Certification
Grades 6-12 or Grades 9-12--
Physics
Not available for this course Not available for this course
Grades 6-12 or Grades 9-12--
Science
Grades 6-12 or Grades 9-12--
Science, Composite
Junior High School (Grades
9-10 only) or High School--
Physics.
Junior High School (Grades
9-10 only) or High School--
Science
Junior High School (Grades
9-10 only) or High School--
Science, Composite
Master Science Teacher
(Grades 8-12)
Mathematics/Physical
Science/Engineering: Grades
6-12
Mathematics/Physical
Science/Engineering: Grades
8-12
Physical Science: Grades 6-
12
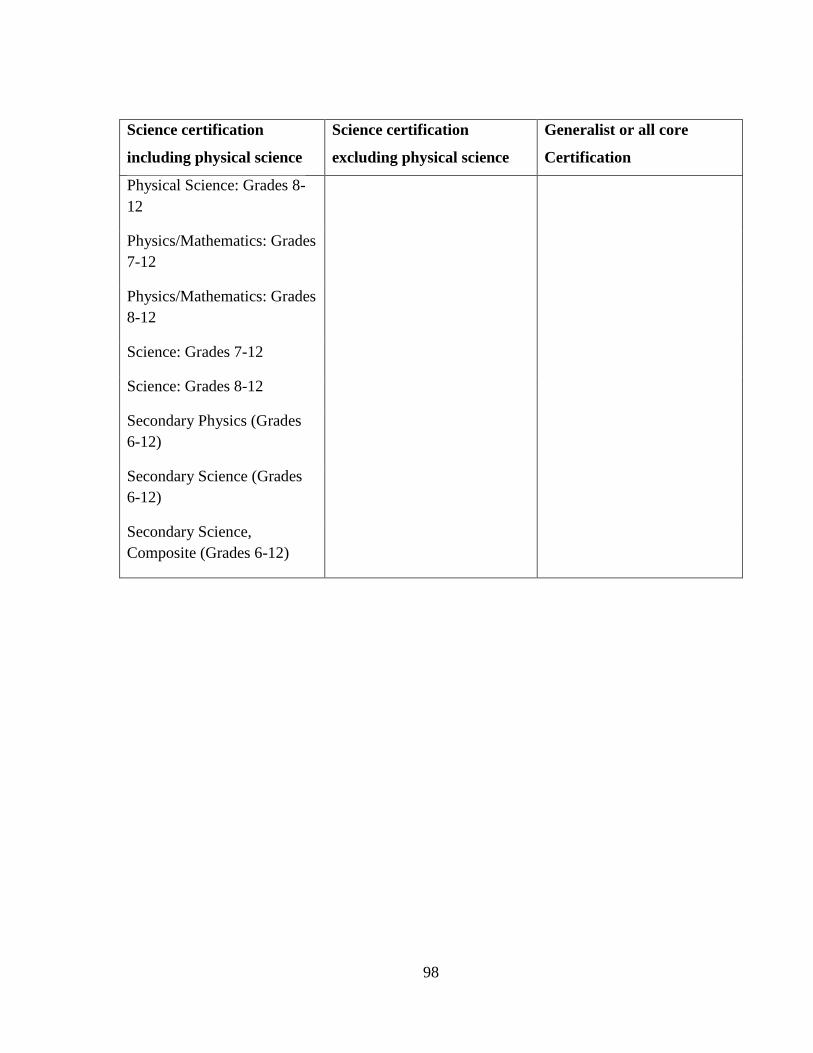
98
Science certification
including physical science
Science certification
excluding physical science
Generalist or all core
Certification
Physical Science: Grades 8-
12
Physics/Mathematics: Grades
7-12
Physics/Mathematics: Grades
8-12
Science: Grades 7-12
Science: Grades 8-12
Secondary Physics (Grades
6-12)
Secondary Science (Grades
6-12)
Secondary Science,
Composite (Grades 6-12)
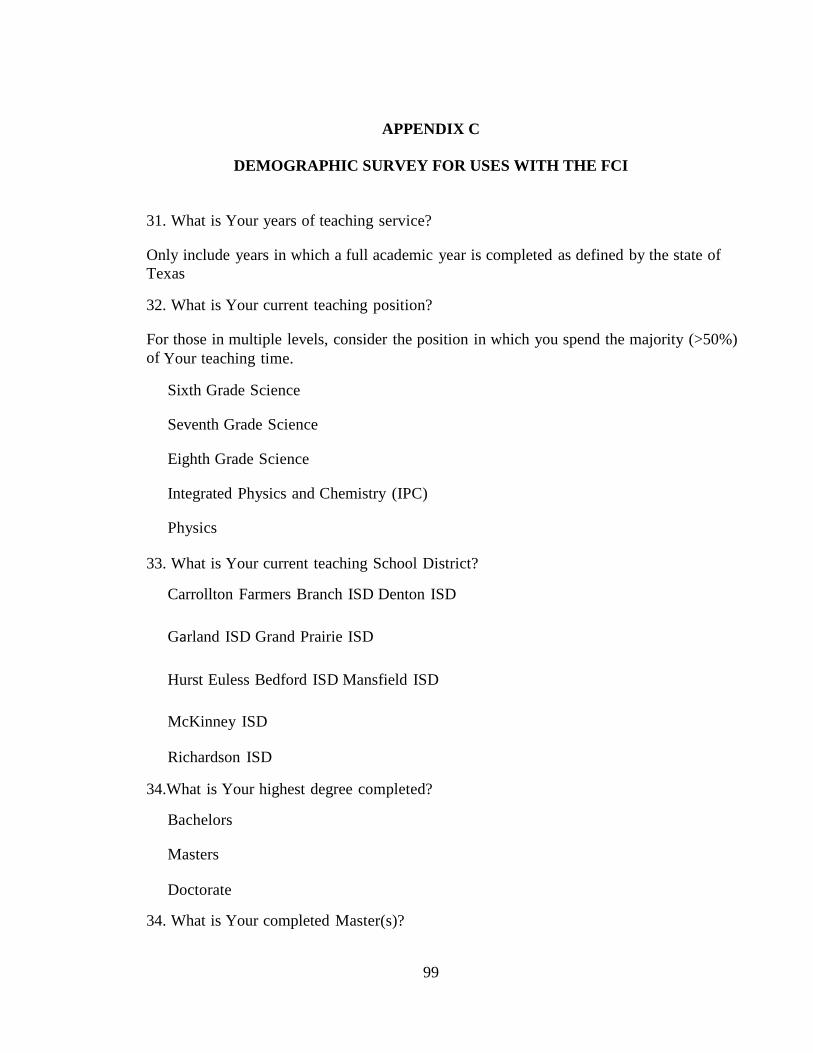
99
APPENDIX C
DEMOGRAPHIC SURVEY FOR USES WITH THE FCI
31. What is Your years of teaching service?
Only include years in which a full academic year is completed as defined by the state of
Texas
32. What is Your current teaching position?
For those in multiple levels, consider the position in which you spend the majority (>50%)
of Your teaching time.
Sixth Grade Science
Seventh Grade Science
Eighth Grade Science
Integrated Physics and Chemistry (IPC)
Physics
33. What is Your current teaching School District?
Carrollton Farmers Branch ISD Denton ISD
Garland ISD Grand Prairie ISD
Hurst Euless Bedford ISD Mansfield ISD
McKinney ISD
Richardson ISD
34.What is Your highest degree completed?
Bachelors
Masters
Doctorate
34. What is Your completed Master(s)?
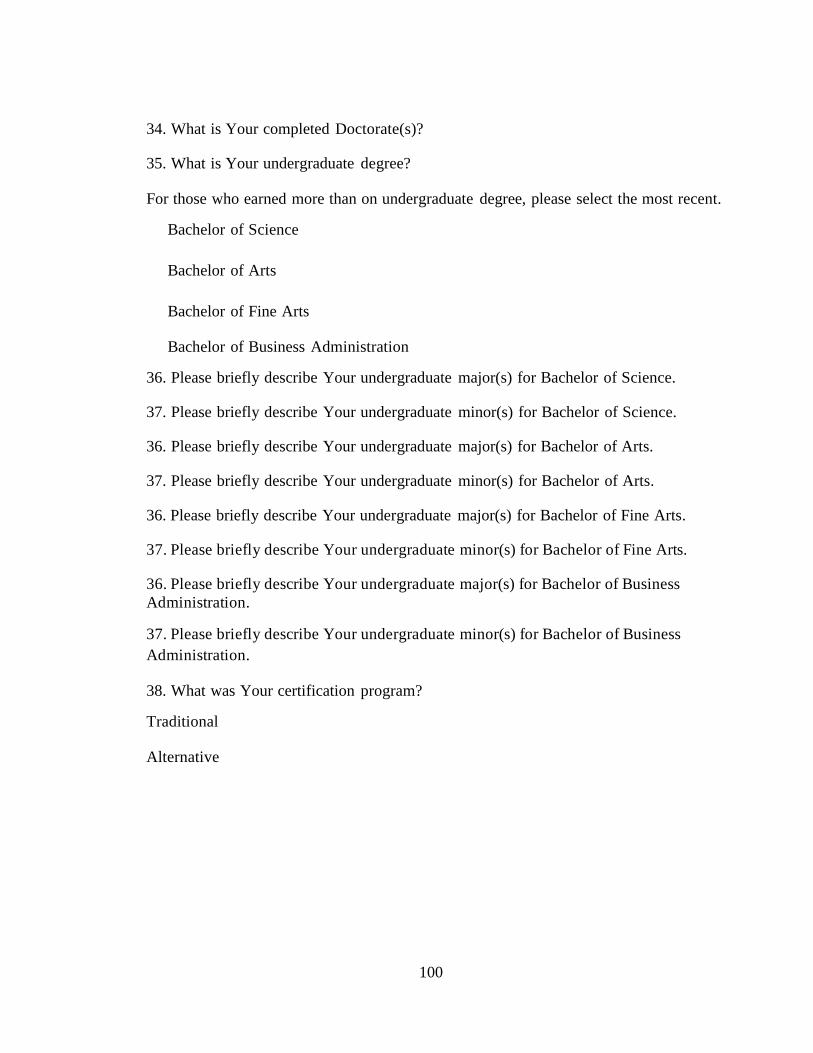
100
34. What is Your completed Doctorate(s)?
35. What is Your undergraduate degree?
For those who earned more than on undergraduate degree, please select the most recent.
Bachelor of Science
Bachelor of Arts
Bachelor of Fine Arts
Bachelor of Business Administration
36. Please briefly describe Your undergraduate major(s) for Bachelor of Science.
37. Please briefly describe Your undergraduate minor(s) for Bachelor of Science.
36. Please briefly describe Your undergraduate major(s) for Bachelor of Arts.
37. Please briefly describe Your undergraduate minor(s) for Bachelor of Arts.
36. Please briefly describe Your undergraduate major(s) for Bachelor of Fine Arts.
37. Please briefly describe Your undergraduate minor(s) for Bachelor of Fine Arts.
36. Please briefly describe Your undergraduate major(s) for Bachelor of Business
Administration.
37. Please briefly describe Your undergraduate minor(s) for Bachelor of Business
Administration.
38. What was Your certification program?
Traditional
Alternative
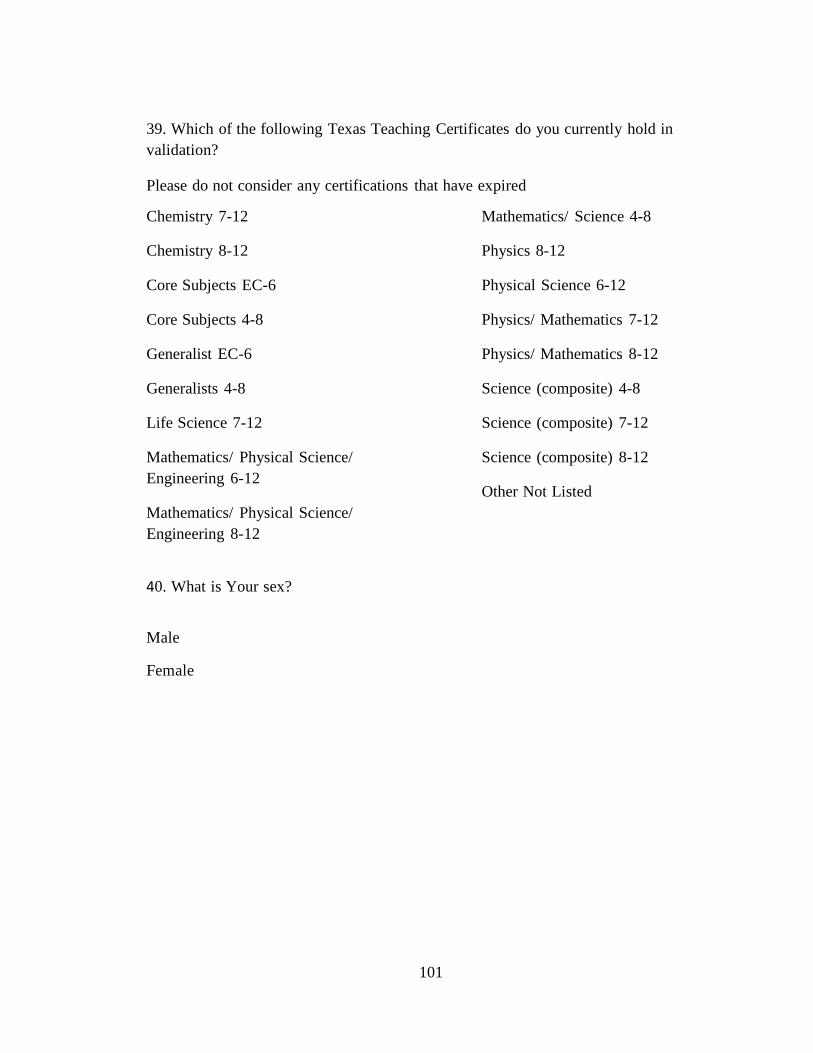
101
39. Which of the following Texas Teaching Certificates do you currently hold in
validation?
Please do not consider any certifications that have expired
Chemistry 712
Chemistry 812
Core Subjects EC6
Core Subjects 48
Generalist EC6
Generalists 48
Life Science 712
Mathematics/ Physical Science/
Engineering 612
Mathematics/ Physical Science/
Engineering 812
Mathematics/ Science 48
Physics 812
Physical Science 612
Physics/ Mathematics 712
Physics/ Mathematics 812
Science (composite) 48
Science (composite) 712
Science (composite) 812
Other Not Listed
40. What is Your sex?
Male
Female
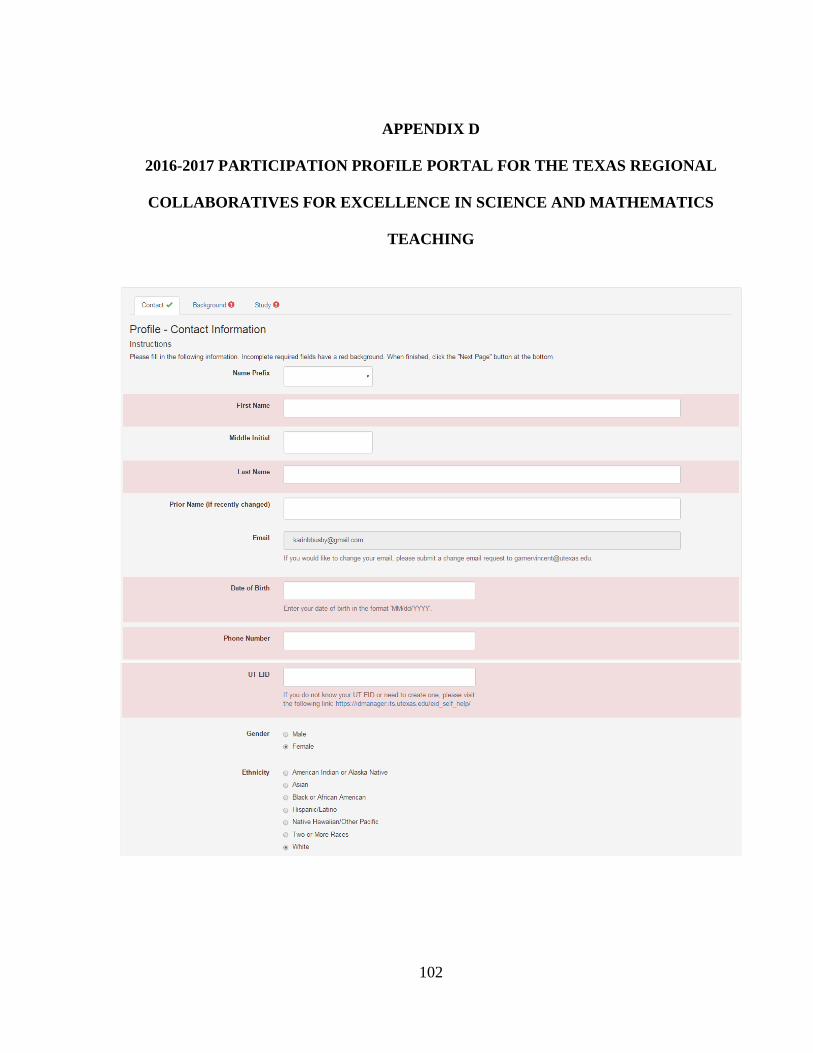
102
APPENDIX D
2016-2017 PARTICIPATION PROFILE PORTAL FOR THE TEXAS REGIONAL
COLLABORATIVES FOR EXCELLENCE IN SCIENCE AND MATHEMATICS
TEACHING
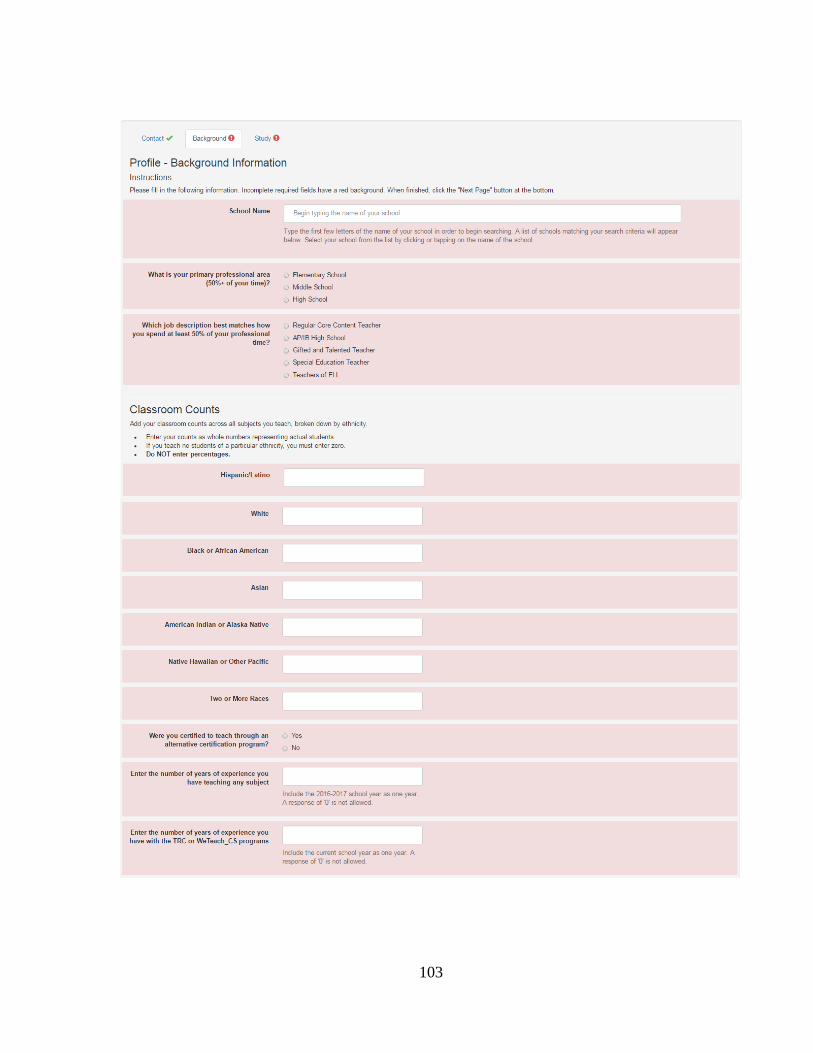
103
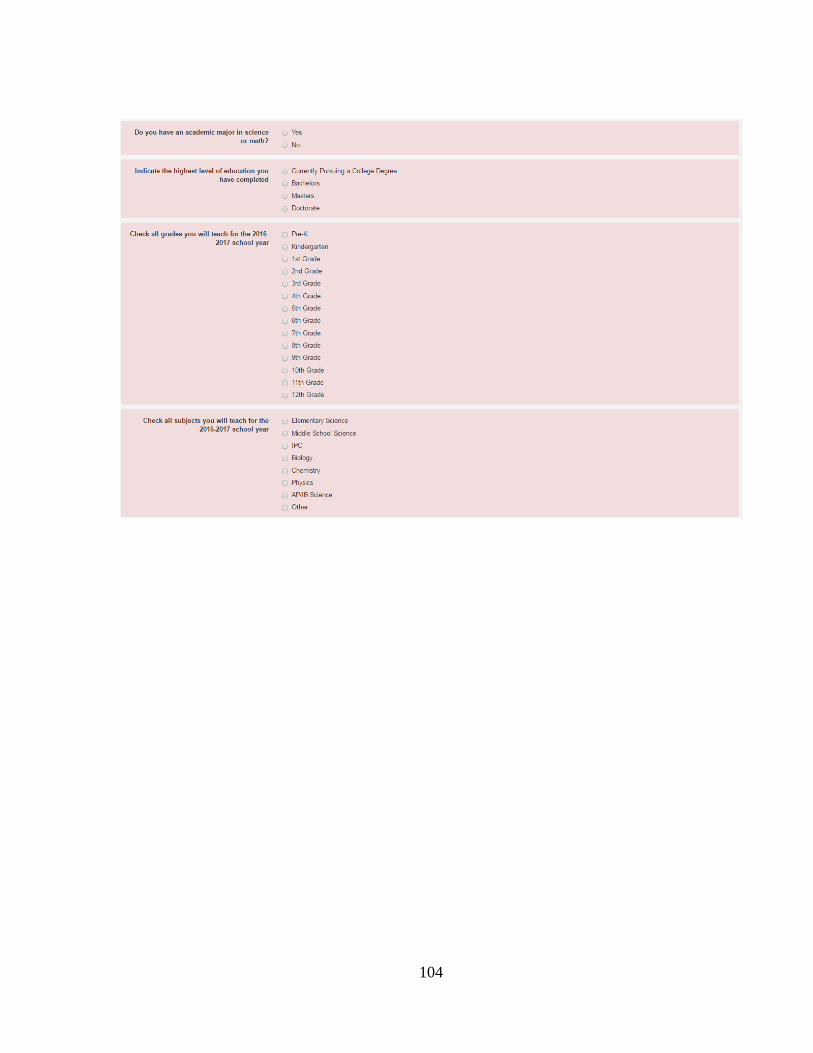
104
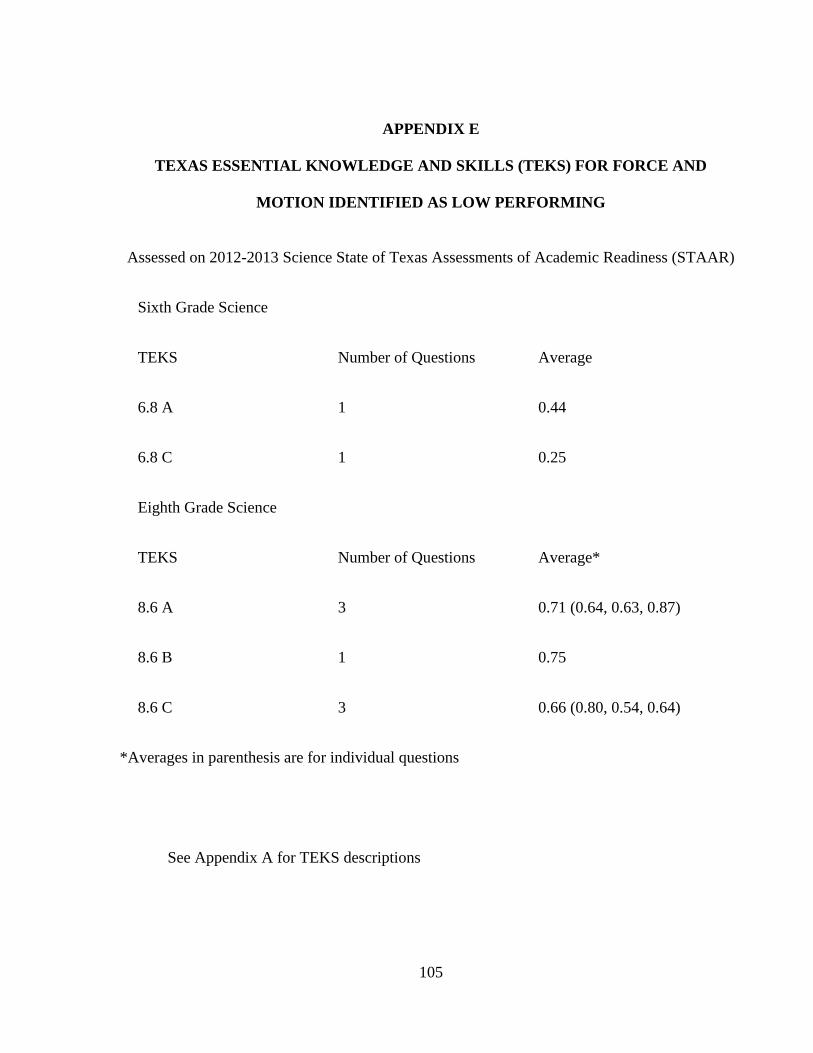
105
APPENDIX E
TEXAS ESSENTIAL KNOWLEDGE AND SKILLS (TEKS) FOR FORCE AND
MOTION IDENTIFIED AS LOW PERFORMING
Assessed on 2012-2013 Science State of Texas Assessments of Academic Readiness (STAAR)
Sixth Grade Science
TEKS Number of Questions Average
6.8 A 1 0.44
6.8 C 1 0.25
Eighth Grade Science
TEKS Number of Questions Average*
8.6 A 3 0.71 (0.64, 0.63, 0.87)
8.6 B 1 0.75
8.6 C 3 0.66 (0.80, 0.54, 0.64)
*Averages in parenthesis are for individual questions
See Appendix A for TEKS descriptions
106
APPENDIX F
SAMPLE QUESTIONS FROM THE TRC PHYSICS ASSESSMENT
Copyright 2013
Dr. Mary Urquhart of The University of Texas at Dallas and
Texas Regional Collaborative for Excellence in Science and Mathematics Teaching at
The University of Texas at Austin
All Rights Reserved
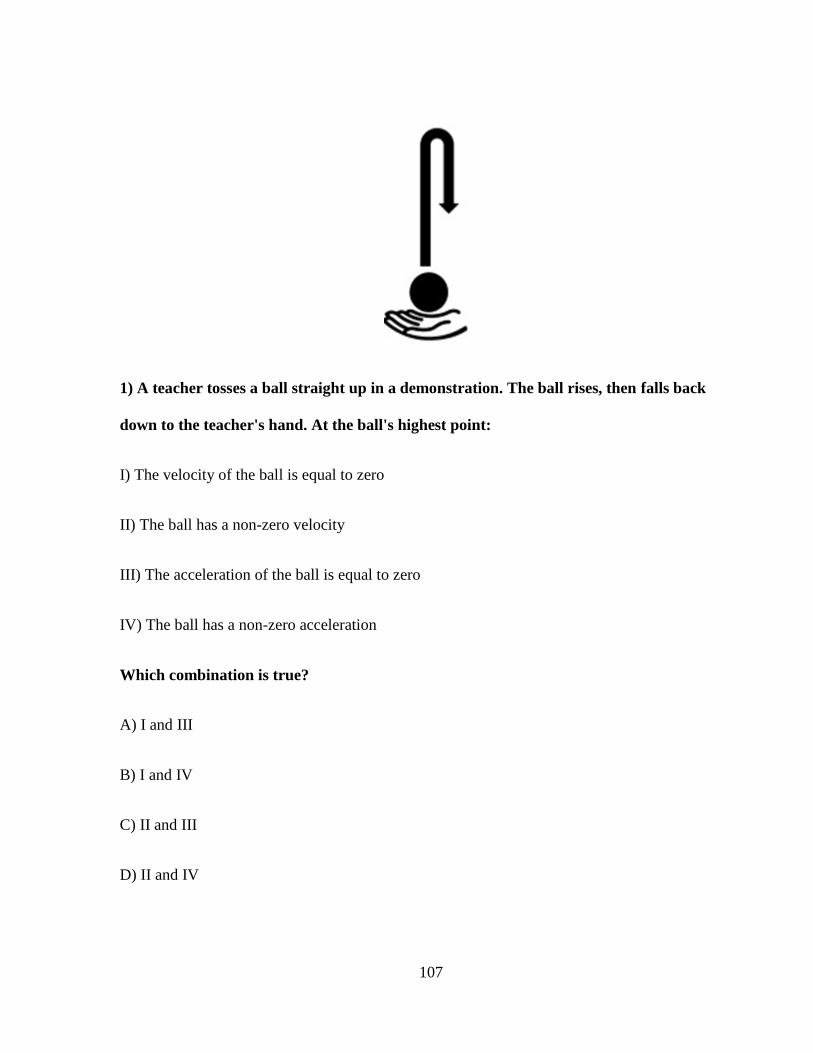
107
1) A teacher tosses a ball straight up in a demonstration. The ball rises, then falls back
down to the teacher's hand. At the ball's highest point:
I) The velocity of the ball is equal to zero
II) The ball has a non-zero velocity
III) The acceleration of the ball is equal to zero
IV) The ball has a non-zero acceleration
Which combination is true?
A) I and III
B) I and IV
C) II and III
D) II and IV
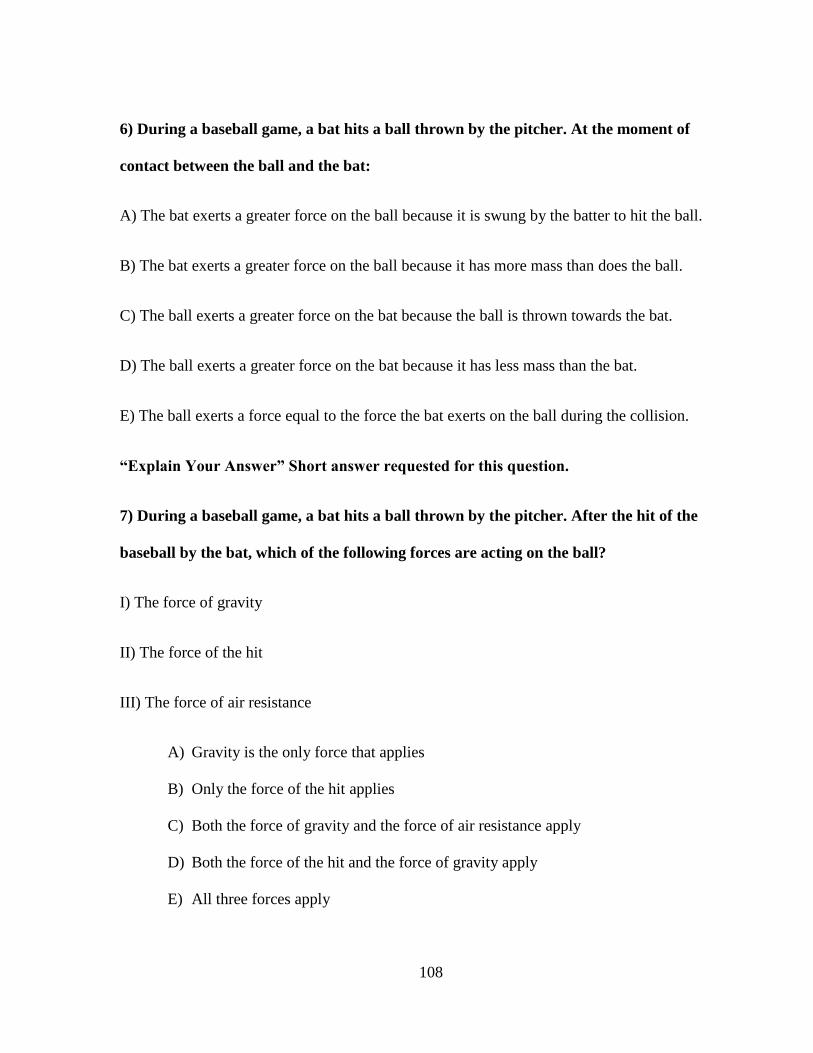
108
6) During a baseball game, a bat hits a ball thrown by the pitcher. At the moment of
contact between the ball and the bat:
A) The bat exerts a greater force on the ball because it is swung by the batter to hit the ball.
B) The bat exerts a greater force on the ball because it has more mass than does the ball.
C) The ball exerts a greater force on the bat because the ball is thrown towards the bat.
D) The ball exerts a greater force on the bat because it has less mass than the bat.
E) The ball exerts a force equal to the force the bat exerts on the ball during the collision.
“Explain Your Answer” Short answer requested for this question.
7) During a baseball game, a bat hits a ball thrown by the pitcher. After the hit of the
baseball by the bat, which of the following forces are acting on the ball?
I) The force of gravity
II) The force of the hit
III) The force of air resistance
A) Gravity is the only force that applies
B) Only the force of the hit applies
C) Both the force of gravity and the force of air resistance apply
D) Both the force of the hit and the force of gravity apply
E) All three forces apply
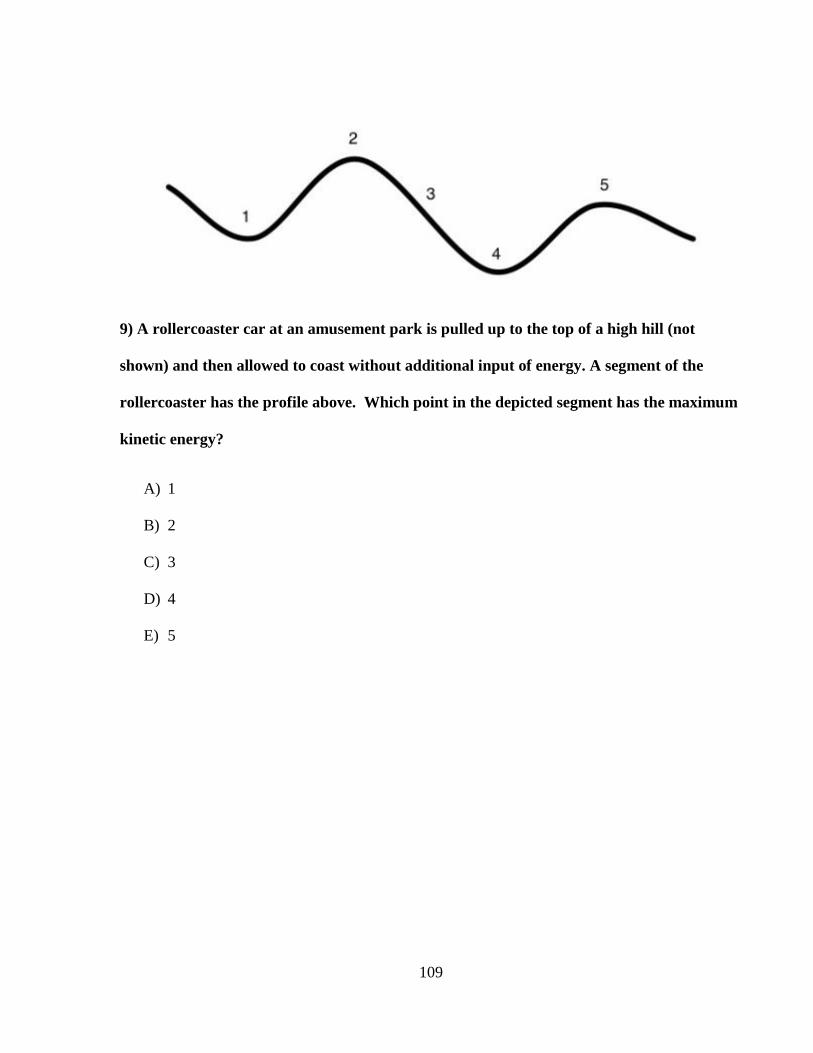
109
9) A rollercoaster car at an amusement park is pulled up to the top of a high hill (not
shown) and then allowed to coast without additional input of energy. A segment of the
rollercoaster has the profile above. Which point in the depicted segment has the maximum
kinetic energy?
A) 1
B) 2
C) 3
D) 4
E) 5
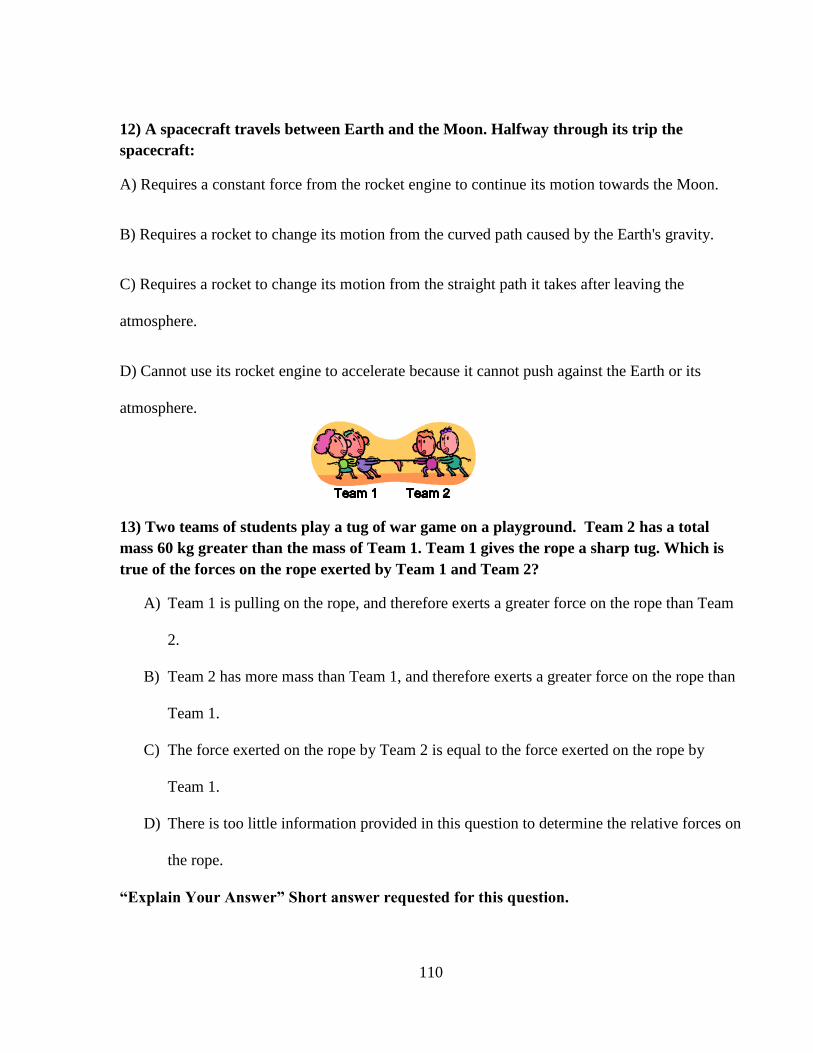
110
12) A spacecraft travels between Earth and the Moon. Halfway through its trip the
spacecraft:
A) Requires a constant force from the rocket engine to continue its motion towards the Moon.
B) Requires a rocket to change its motion from the curved path caused by the Earth's gravity.
C) Requires a rocket to change its motion from the straight path it takes after leaving the
atmosphere.
D) Cannot use its rocket engine to accelerate because it cannot push against the Earth or its
atmosphere.
13) Two teams of students play a tug of war game on a playground. Team 2 has a total
mass 60 kg greater than the mass of Team 1. Team 1 gives the rope a sharp tug. Which is
true of the forces on the rope exerted by Team 1 and Team 2?
A) Team 1 is pulling on the rope, and therefore exerts a greater force on the rope than Team
2.
B) Team 2 has more mass than Team 1, and therefore exerts a greater force on the rope than
Team 1.
C) The force exerted on the rope by Team 2 is equal to the force exerted on the rope by
Team 1.
D) There is too little information provided in this question to determine the relative forces on
the rope.
“Explain Your Answer” Short answer requested for this question.
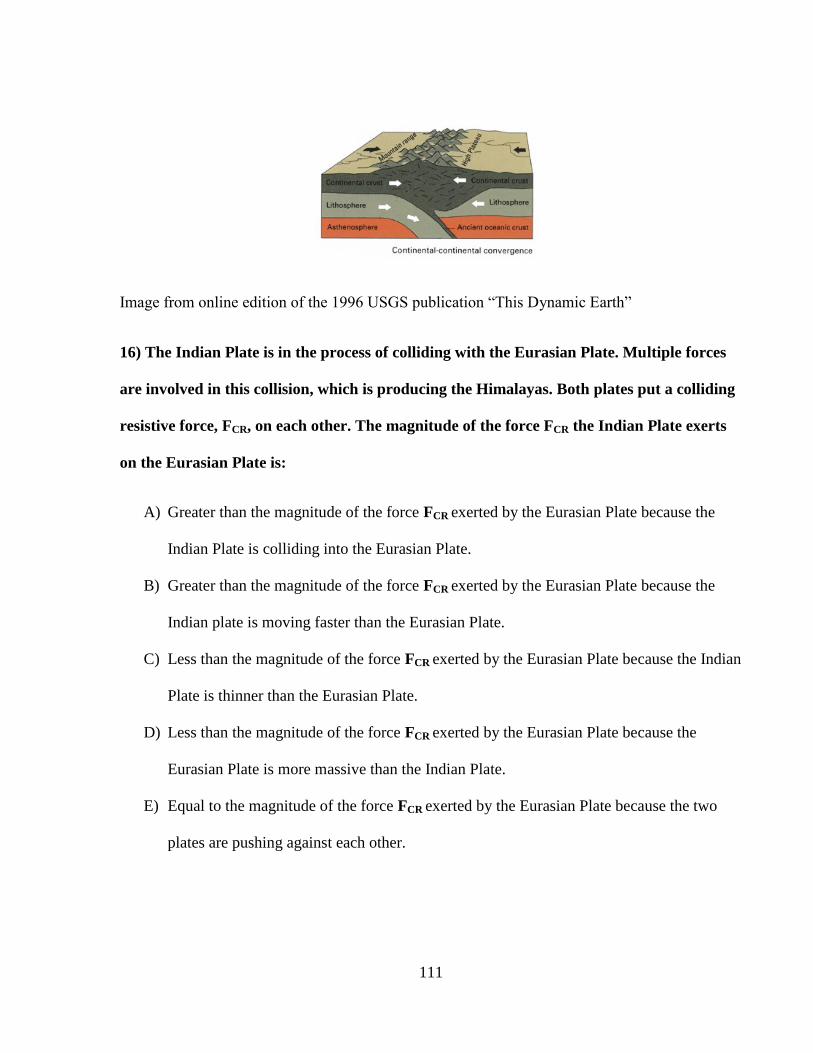
111
Image from online edition of the 1996 USGS publication “This Dynamic Earth”
16) The Indian Plate is in the process of colliding with the Eurasian Plate. Multiple forces
are involved in this collision, which is producing the Himalayas. Both plates put a colliding
resistive force, FCR, on each other. The magnitude of the force FCR the Indian Plate exerts
on the Eurasian Plate is:
A) Greater than the magnitude of the force FCR exerted by the Eurasian Plate because the
Indian Plate is colliding into the Eurasian Plate.
B) Greater than the magnitude of the force FCR exerted by the Eurasian Plate because the
Indian plate is moving faster than the Eurasian Plate.
C) Less than the magnitude of the force FCR exerted by the Eurasian Plate because the Indian
Plate is thinner than the Eurasian Plate.
D) Less than the magnitude of the force FCR exerted by the Eurasian Plate because the
Eurasian Plate is more massive than the Indian Plate.
E) Equal to the magnitude of the force FCR exerted by the Eurasian Plate because the two
plates are pushing against each other.
112
28) A book sits on a table at rest. In this situation, determine if the following statement is
true or false based on the reasoning given.
Newton's first law of motion (law of inertia) applies because the force of gravity on the book and
the force of the table on the book are balanced.
A) True
B) False
For the complete instrument, please contact the author at [email protected]
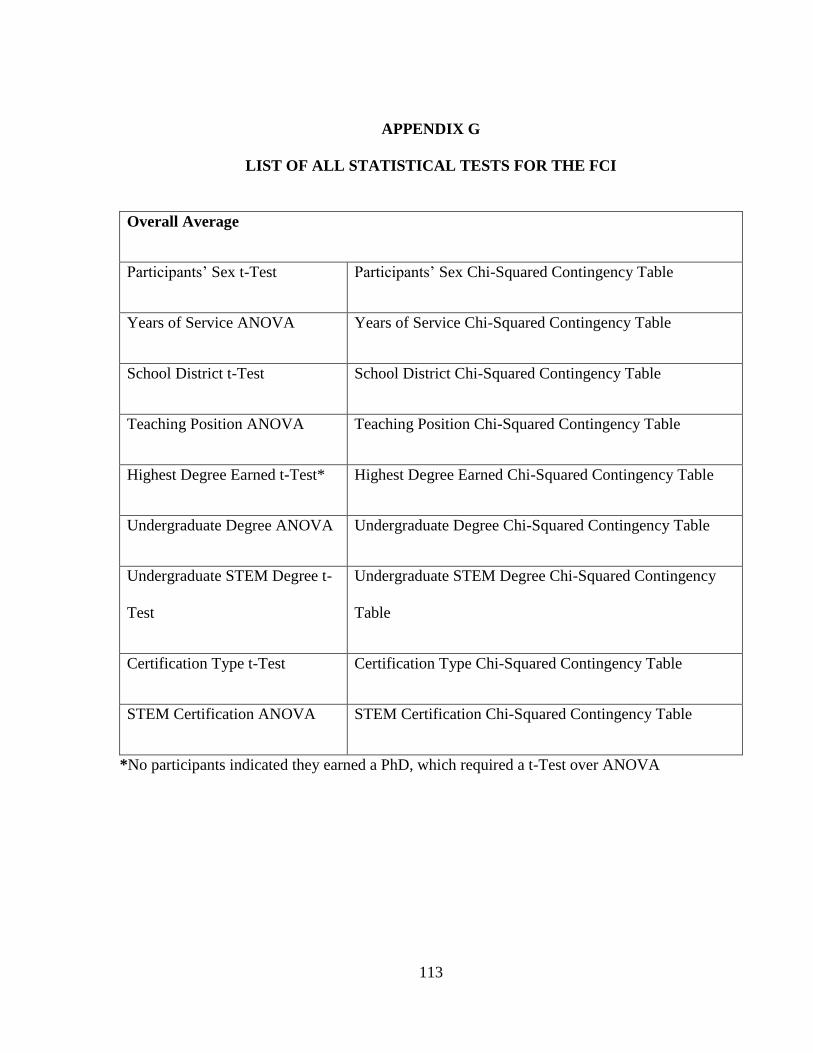
113
APPENDIX G
LIST OF ALL STATISTICAL TESTS FOR THE FCI
Overall Average
Participants’ Sex t-Test Participants’ Sex Chi-Squared Contingency Table
Years of Service ANOVA Years of Service Chi-Squared Contingency Table
School District t-Test School District Chi-Squared Contingency Table
Teaching Position ANOVA Teaching Position Chi-Squared Contingency Table
Highest Degree Earned t-Test* Highest Degree Earned Chi-Squared Contingency Table
Undergraduate Degree ANOVA Undergraduate Degree Chi-Squared Contingency Table
Undergraduate STEM Degree t-
Test
Undergraduate STEM Degree Chi-Squared Contingency
Table
Certification Type t-Test Certification Type Chi-Squared Contingency Table
STEM Certification ANOVA STEM Certification Chi-Squared Contingency Table
*No participants indicated they earned a PhD, which required a t-Test over ANOVA
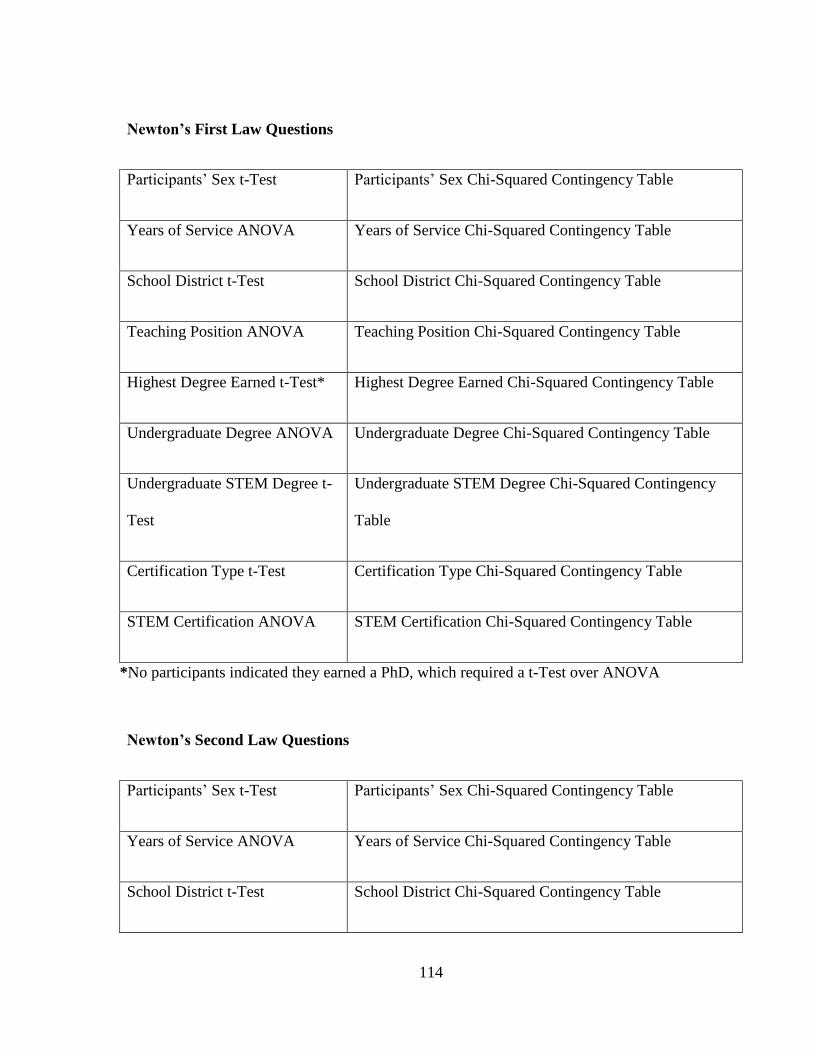
114
Newton’s First Law Questions
Participants’ Sex t-Test Participants’ Sex Chi-Squared Contingency Table
Years of Service ANOVA Years of Service Chi-Squared Contingency Table
School District t-Test School District Chi-Squared Contingency Table
Teaching Position ANOVA Teaching Position Chi-Squared Contingency Table
Highest Degree Earned t-Test* Highest Degree Earned Chi-Squared Contingency Table
Undergraduate Degree ANOVA Undergraduate Degree Chi-Squared Contingency Table
Undergraduate STEM Degree t-
Test
Undergraduate STEM Degree Chi-Squared Contingency
Table
Certification Type t-Test Certification Type Chi-Squared Contingency Table
STEM Certification ANOVA STEM Certification Chi-Squared Contingency Table
*No participants indicated they earned a PhD, which required a t-Test over ANOVA
Newton’s Second Law Questions
Participants’ Sex t-Test Participants’ Sex Chi-Squared Contingency Table
Years of Service ANOVA Years of Service Chi-Squared Contingency Table
School District t-Test School District Chi-Squared Contingency Table
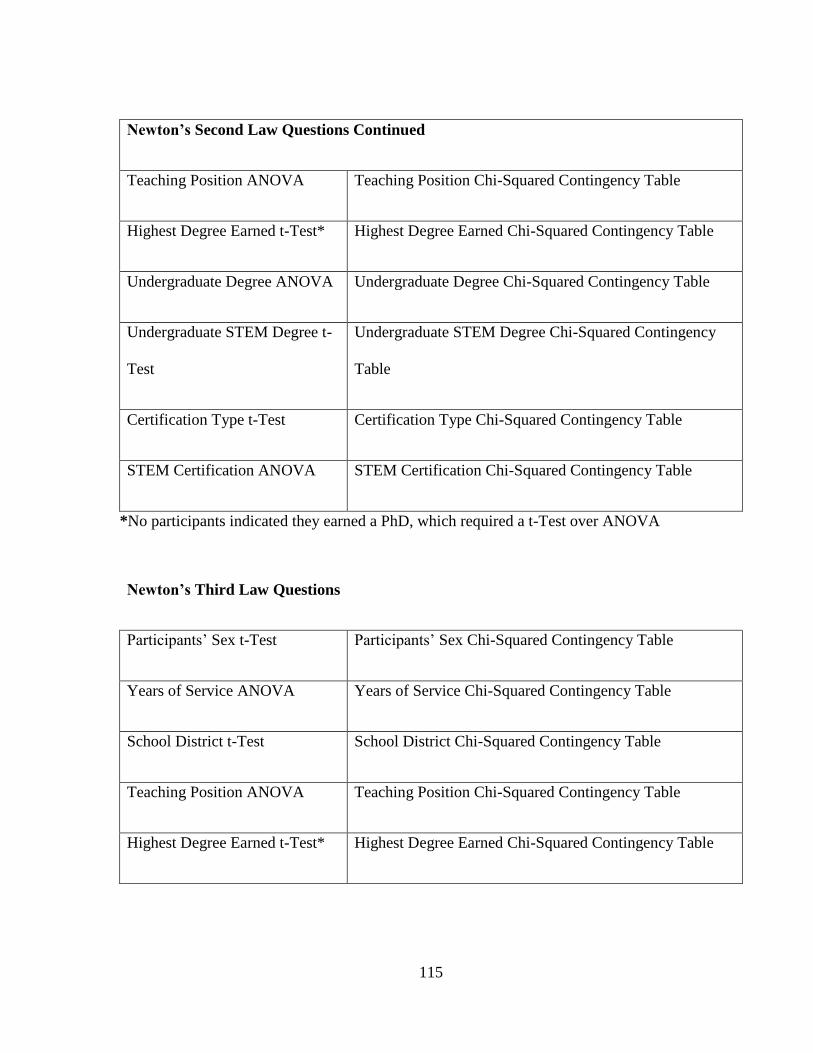
115
Newton’s Second Law Questions Continued
Teaching Position ANOVA Teaching Position Chi-Squared Contingency Table
Highest Degree Earned t-Test* Highest Degree Earned Chi-Squared Contingency Table
Undergraduate Degree ANOVA Undergraduate Degree Chi-Squared Contingency Table
Undergraduate STEM Degree t-
Test
Undergraduate STEM Degree Chi-Squared Contingency
Table
Certification Type t-Test Certification Type Chi-Squared Contingency Table
STEM Certification ANOVA STEM Certification Chi-Squared Contingency Table
*No participants indicated they earned a PhD, which required a t-Test over ANOVA
Newton’s Third Law Questions
Participants’ Sex t-Test Participants’ Sex Chi-Squared Contingency Table
Years of Service ANOVA Years of Service Chi-Squared Contingency Table
School District t-Test School District Chi-Squared Contingency Table
Teaching Position ANOVA Teaching Position Chi-Squared Contingency Table
Highest Degree Earned t-Test* Highest Degree Earned Chi-Squared Contingency Table
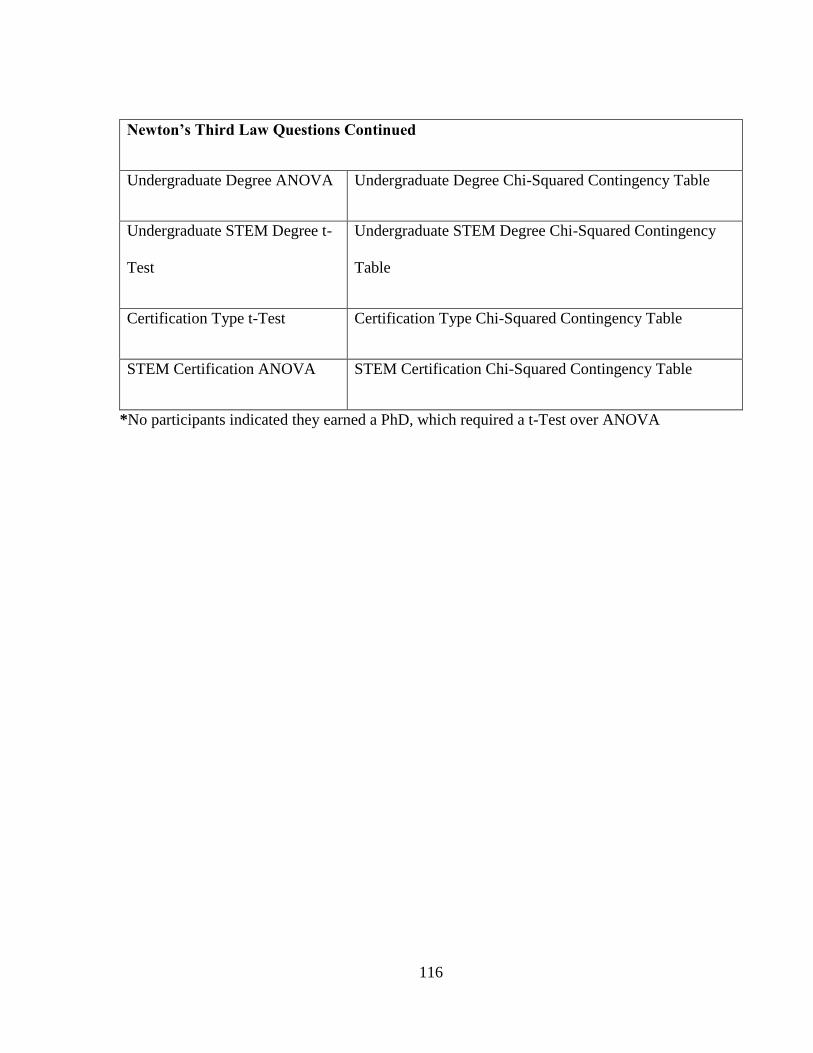
116
Newton’s Third Law Questions Continued
Undergraduate Degree ANOVA Undergraduate Degree Chi-Squared Contingency Table
Undergraduate STEM Degree t-
Test
Undergraduate STEM Degree Chi-Squared Contingency
Table
Certification Type t-Test Certification Type Chi-Squared Contingency Table
STEM Certification ANOVA STEM Certification Chi-Squared Contingency Table
*No participants indicated they earned a PhD, which required a t-Test over ANOVA
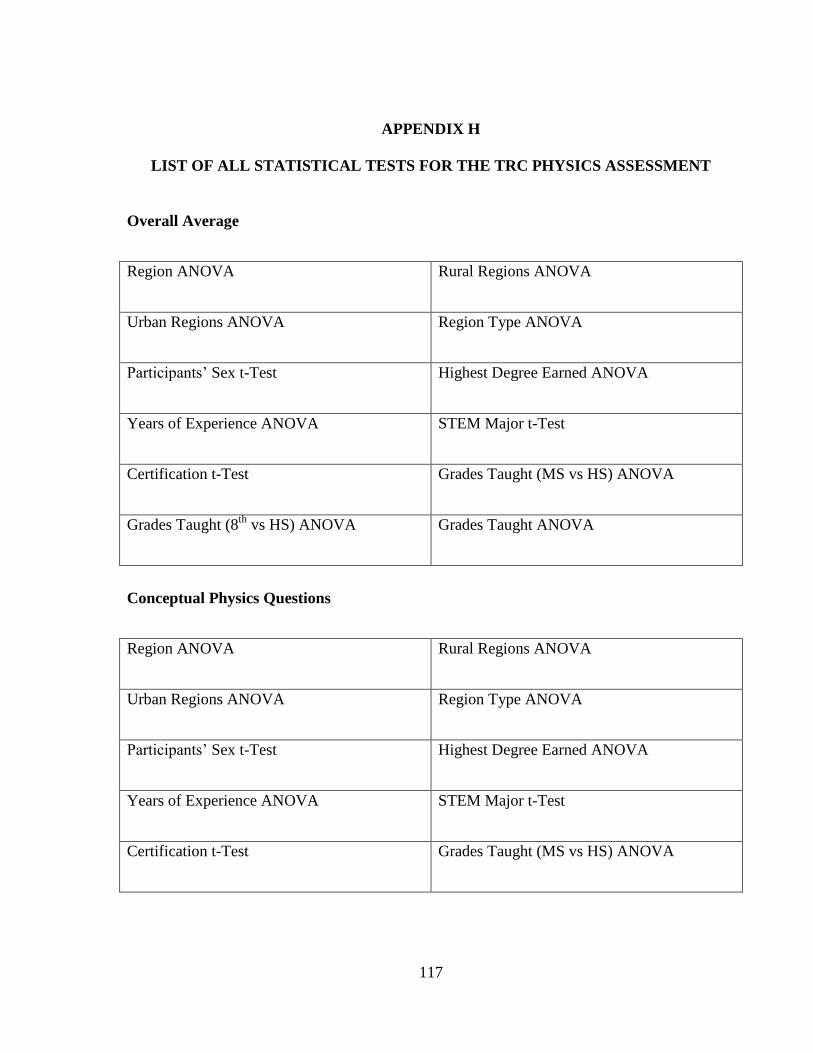
117
APPENDIX H
LIST OF ALL STATISTICAL TESTS FOR THE TRC PHYSICS ASSESSMENT
Overall Average
Region ANOVA Rural Regions ANOVA
Urban Regions ANOVA Region Type ANOVA
Participants’ Sex t-Test Highest Degree Earned ANOVA
Years of Experience ANOVA STEM Major t-Test
Certification t-Test Grades Taught (MS vs HS) ANOVA
Grades Taught (8th
vs HS) ANOVA Grades Taught ANOVA
Conceptual Physics Questions
Region ANOVA Rural Regions ANOVA
Urban Regions ANOVA Region Type ANOVA
Participants’ Sex t-Test Highest Degree Earned ANOVA
Years of Experience ANOVA STEM Major t-Test
Certification t-Test Grades Taught (MS vs HS) ANOVA
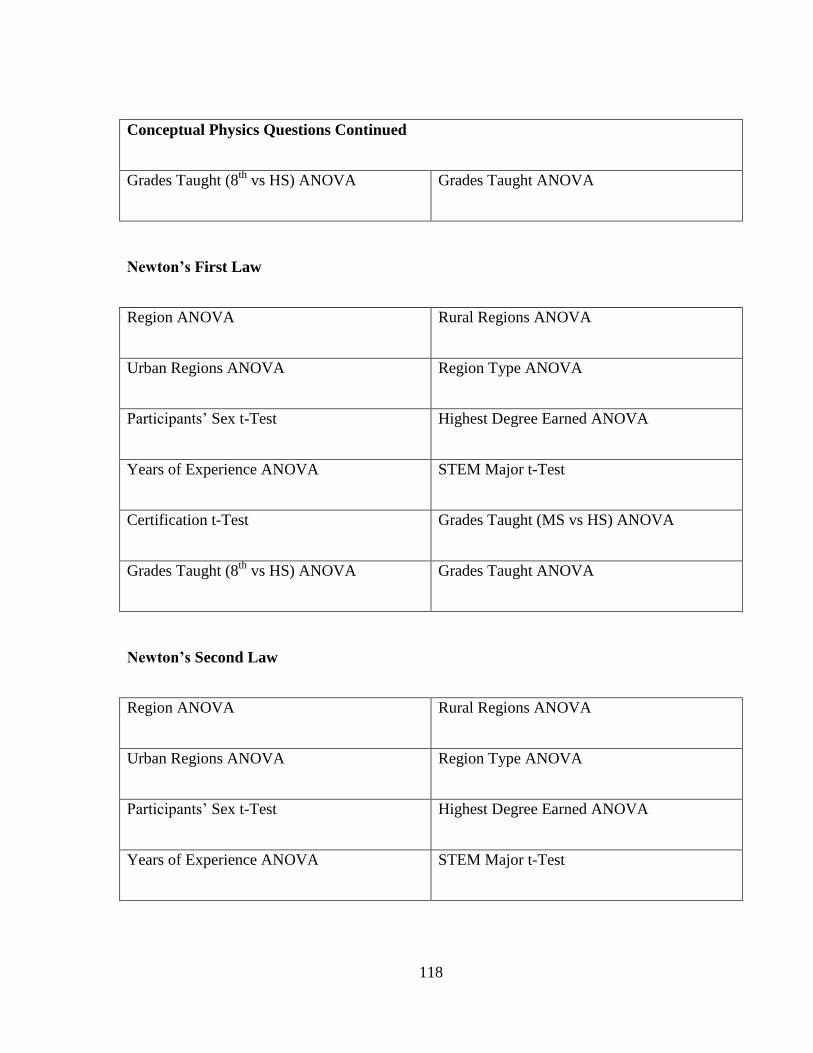
118
Conceptual Physics Questions Continued
Grades Taught (8th
vs HS) ANOVA Grades Taught ANOVA
Newton’s First Law
Region ANOVA Rural Regions ANOVA
Urban Regions ANOVA Region Type ANOVA
Participants’ Sex t-Test Highest Degree Earned ANOVA
Years of Experience ANOVA STEM Major t-Test
Certification t-Test Grades Taught (MS vs HS) ANOVA
Grades Taught (8th
vs HS) ANOVA Grades Taught ANOVA
Newton’s Second Law
Region ANOVA Rural Regions ANOVA
Urban Regions ANOVA Region Type ANOVA
Participants’ Sex t-Test Highest Degree Earned ANOVA
Years of Experience ANOVA STEM Major t-Test
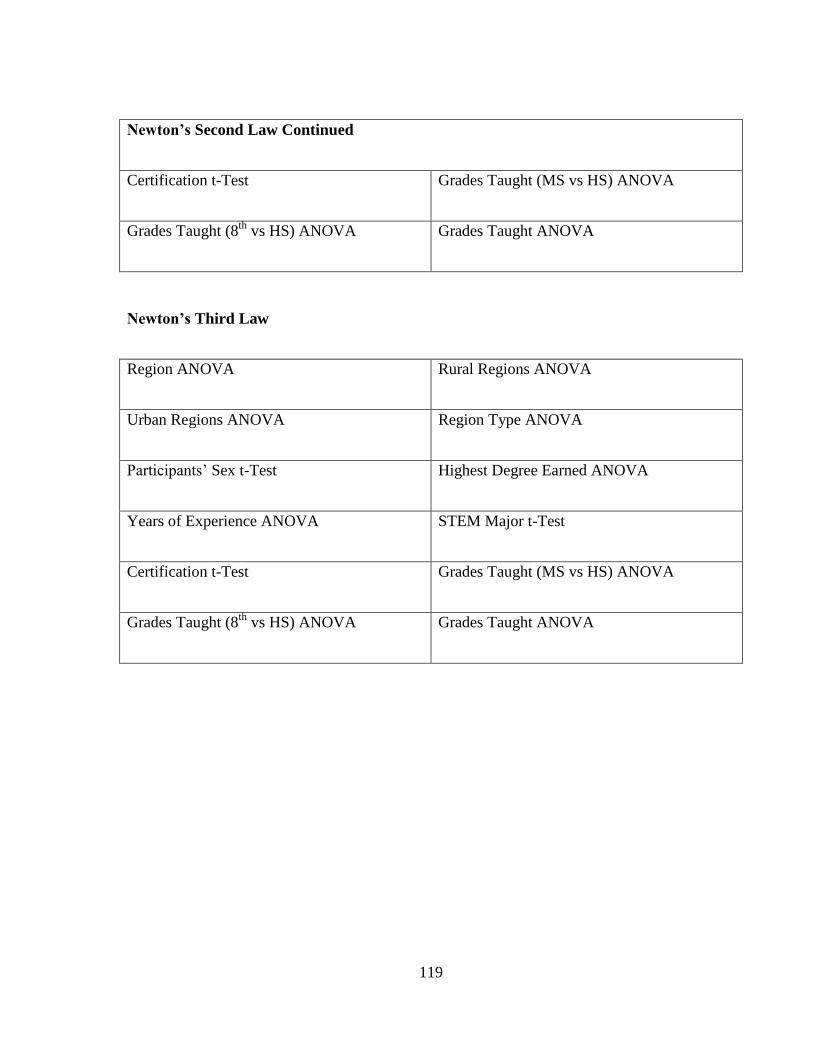
119
Newton’s Second Law Continued
Certification t-Test Grades Taught (MS vs HS) ANOVA
Grades Taught (8th
vs HS) ANOVA Grades Taught ANOVA
Newton’s Third Law
Region ANOVA Rural Regions ANOVA
Urban Regions ANOVA Region Type ANOVA
Participants’ Sex t-Test Highest Degree Earned ANOVA
Years of Experience ANOVA STEM Major t-Test
Certification t-Test Grades Taught (MS vs HS) ANOVA
Grades Taught (8th
vs HS) ANOVA Grades Taught ANOVA
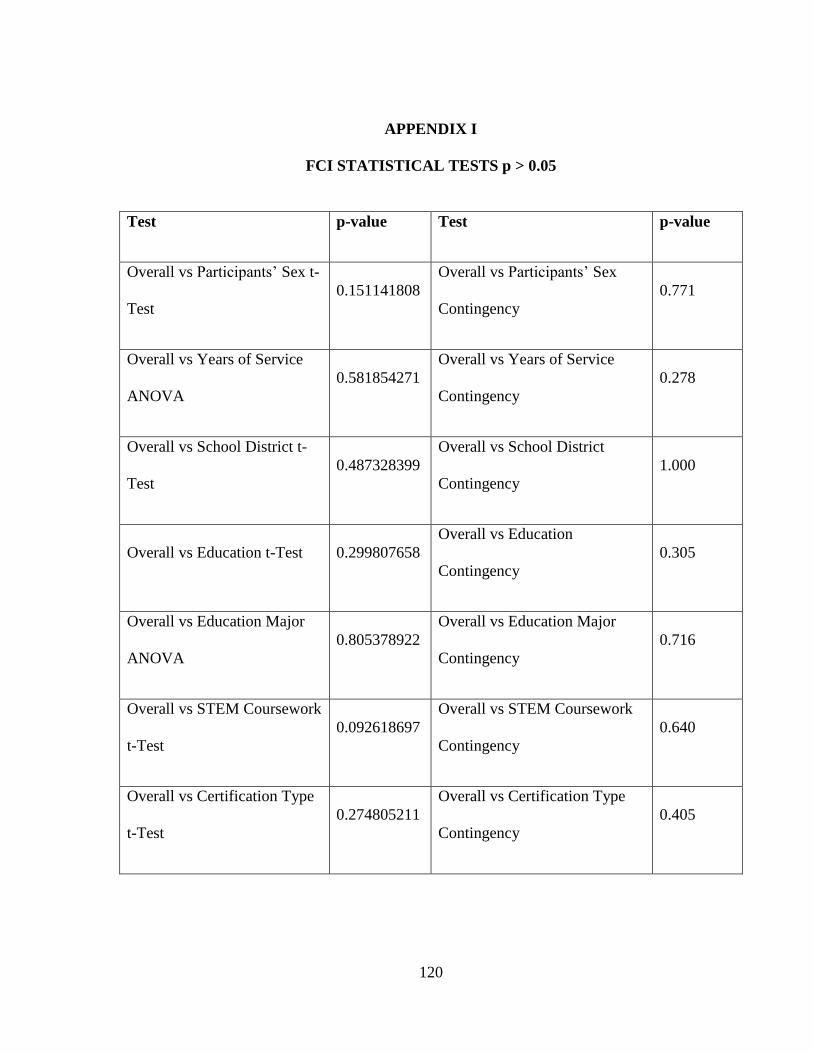
120
APPENDIX I
FCI STATISTICAL TESTS p > 0.05
Test p-value Test p-value
Overall vs Participants’ Sex t-
Test
0.151141808
Overall vs Participants’ Sex
Contingency
0.771
Overall vs Years of Service
ANOVA
0.581854271
Overall vs Years of Service
Contingency
0.278
Overall vs School District t-
Test
0.487328399
Overall vs School District
Contingency
1.000
Overall vs Education t-Test 0.299807658
Overall vs Education
Contingency
0.305
Overall vs Education Major
ANOVA
0.805378922
Overall vs Education Major
Contingency
0.716
Overall vs STEM Coursework
t-Test
0.092618697
Overall vs STEM Coursework
Contingency
0.640
Overall vs Certification Type
t-Test
0.274805211
Overall vs Certification Type
Contingency
0.405
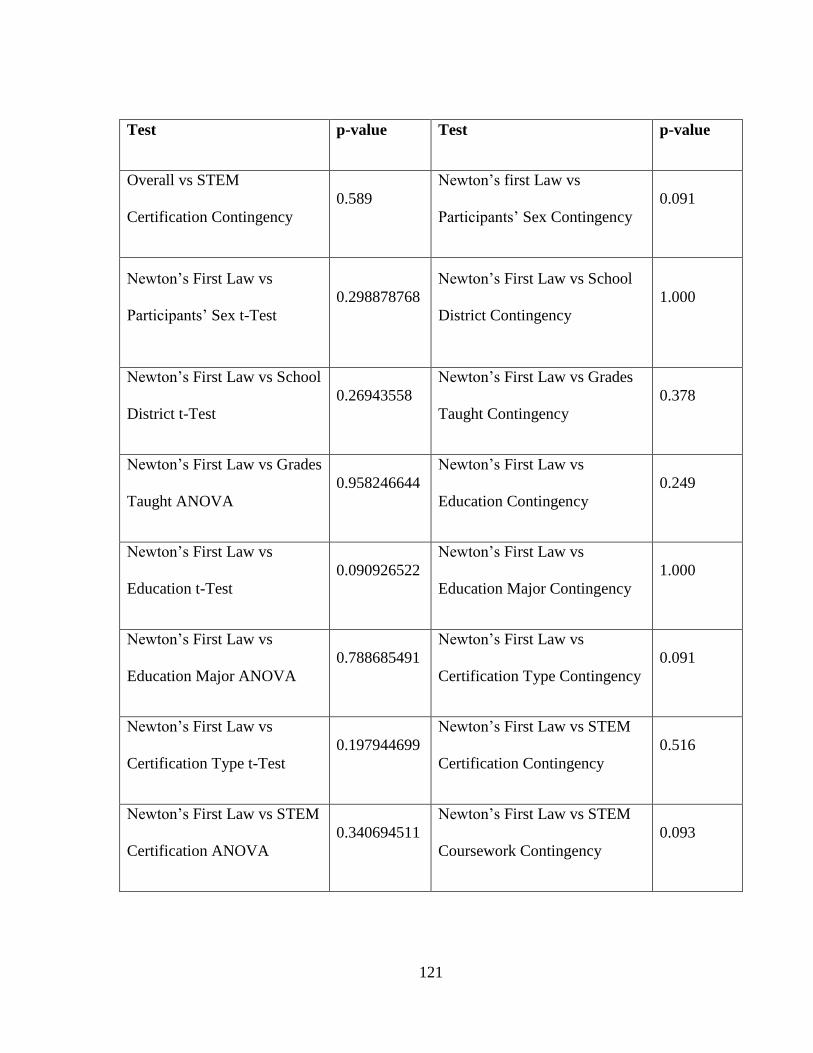
121
Test p-value Test p-value
Overall vs STEM
Certification Contingency
0.589
Newton’s first Law vs
Participants’ Sex Contingency
0.091
Newton’s First Law vs
Participants’ Sex t-Test
0.298878768
Newton’s First Law vs School
District Contingency
1.000
Newton’s First Law vs School
District t-Test
0.26943558
Newton’s First Law vs Grades
Taught Contingency
0.378
Newton’s First Law vs Grades
Taught ANOVA
0.958246644
Newton’s First Law vs
Education Contingency
0.249
Newton’s First Law vs
Education t-Test
0.090926522
Newton’s First Law vs
Education Major Contingency
1.000
Newton’s First Law vs
Education Major ANOVA
0.788685491
Newton’s First Law vs
Certification Type Contingency
0.091
Newton’s First Law vs
Certification Type t-Test
0.197944699
Newton’s First Law vs STEM
Certification Contingency
0.516
Newton’s First Law vs STEM
Certification ANOVA
0.340694511
Newton’s First Law vs STEM
Coursework Contingency
0.093
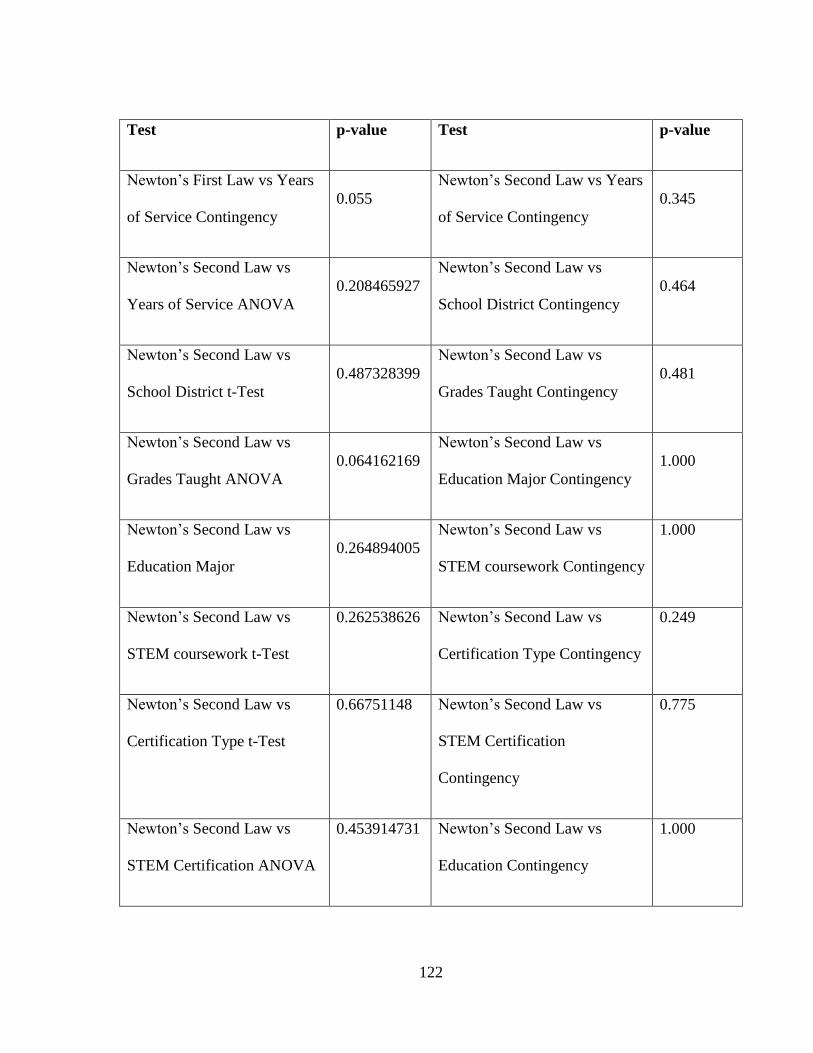
122
Test p-value Test p-value
Newton’s First Law vs Years
of Service Contingency
0.055
Newton’s Second Law vs Years
of Service Contingency
0.345
Newton’s Second Law vs
Years of Service ANOVA
0.208465927
Newton’s Second Law vs
School District Contingency
0.464
Newton’s Second Law vs
School District t-Test
0.487328399
Newton’s Second Law vs
Grades Taught Contingency
0.481
Newton’s Second Law vs
Grades Taught ANOVA
0.064162169
Newton’s Second Law vs
Education Major Contingency
1.000
Newton’s Second Law vs
Education Major
0.264894005
Newton’s Second Law vs
STEM coursework Contingency
1.000
Newton’s Second Law vs
STEM coursework t-Test
0.262538626 Newton’s Second Law vs
Certification Type Contingency
0.249
Newton’s Second Law vs
Certification Type t-Test
0.66751148 Newton’s Second Law vs
STEM Certification
Contingency
0.775
Newton’s Second Law vs
STEM Certification ANOVA
0.453914731 Newton’s Second Law vs
Education Contingency
1.000
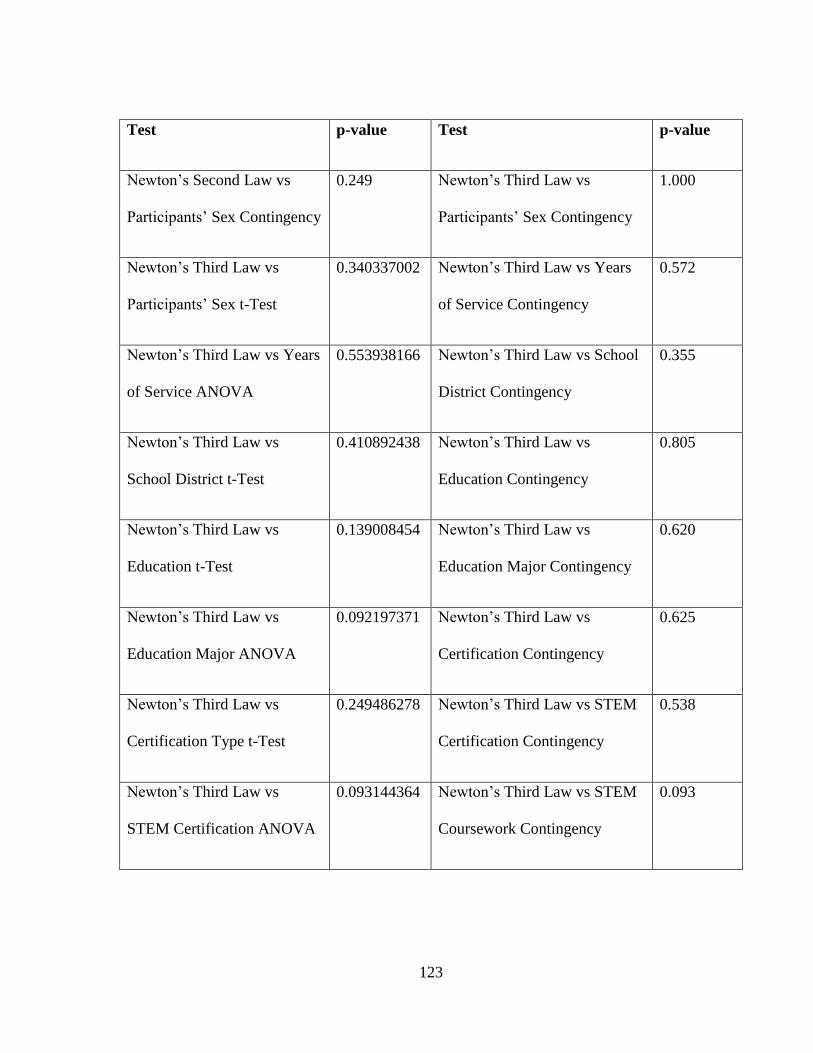
123
Test p-value Test p-value
Newton’s Second Law vs
Participants’ Sex Contingency
0.249 Newton’s Third Law vs
Participants’ Sex Contingency
1.000
Newton’s Third Law vs
Participants’ Sex t-Test
0.340337002 Newton’s Third Law vs Years
of Service Contingency
0.572
Newton’s Third Law vs Years
of Service ANOVA
0.553938166 Newton’s Third Law vs School
District Contingency
0.355
Newton’s Third Law vs
School District t-Test
0.410892438 Newton’s Third Law vs
Education Contingency
0.805
Newton’s Third Law vs
Education t-Test
0.139008454 Newton’s Third Law vs
Education Major Contingency
0.620
Newton’s Third Law vs
Education Major ANOVA
0.092197371 Newton’s Third Law vs
Certification Contingency
0.625
Newton’s Third Law vs
Certification Type t-Test
0.249486278 Newton’s Third Law vs STEM
Certification Contingency
0.538
Newton’s Third Law vs
STEM Certification ANOVA
0.093144364 Newton’s Third Law vs STEM
Coursework Contingency
0.093
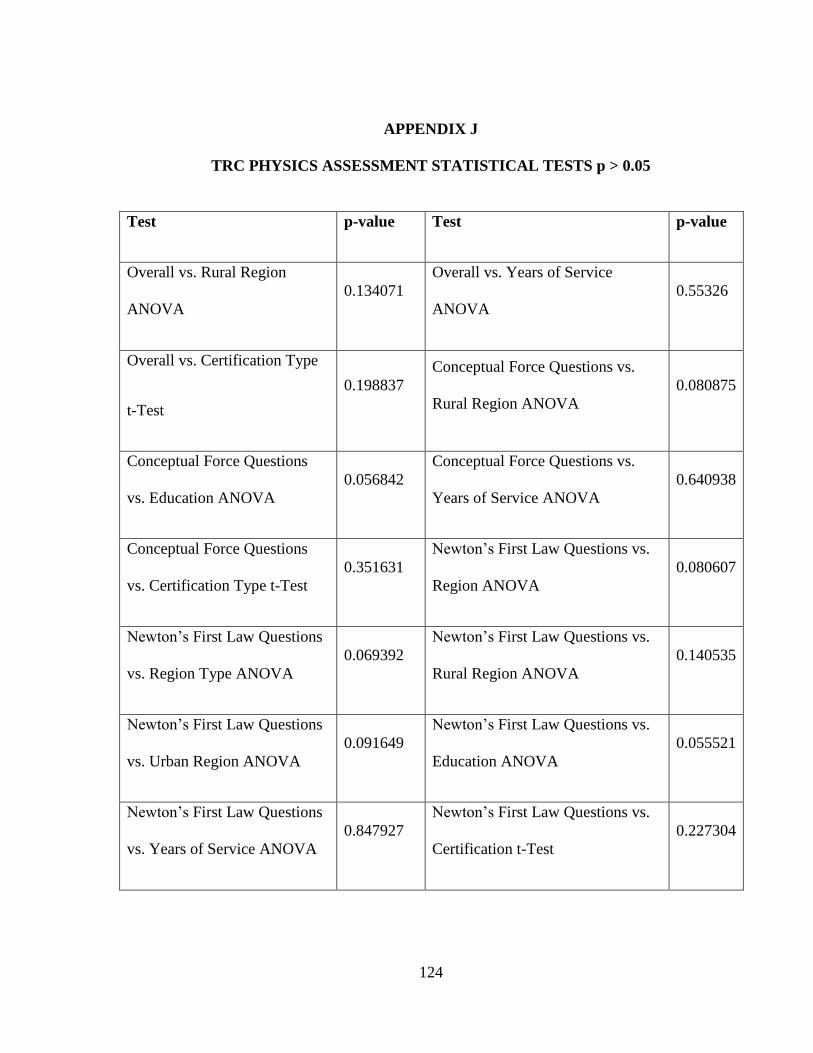
124
APPENDIX J
TRC PHYSICS ASSESSMENT STATISTICAL TESTS p > 0.05
Test p-value Test p-value
Overall vs. Rural Region
ANOVA
0.134071
Overall vs. Years of Service
ANOVA
0.55326
Overall vs. Certification Type
t-Test
0.198837
Conceptual Force Questions vs.
Rural Region ANOVA
0.080875
Conceptual Force Questions
vs. Education ANOVA
0.056842
Conceptual Force Questions vs.
Years of Service ANOVA
0.640938
Conceptual Force Questions
vs. Certification Type t-Test
0.351631
Newton’s First Law Questions vs.
Region ANOVA
0.080607
Newton’s First Law Questions
vs. Region Type ANOVA
0.069392
Newton’s First Law Questions vs.
Rural Region ANOVA
0.140535
Newton’s First Law Questions
vs. Urban Region ANOVA
0.091649
Newton’s First Law Questions vs.
Education ANOVA
0.055521
Newton’s First Law Questions
vs. Years of Service ANOVA
0.847927
Newton’s First Law Questions vs.
Certification t-Test
0.227304
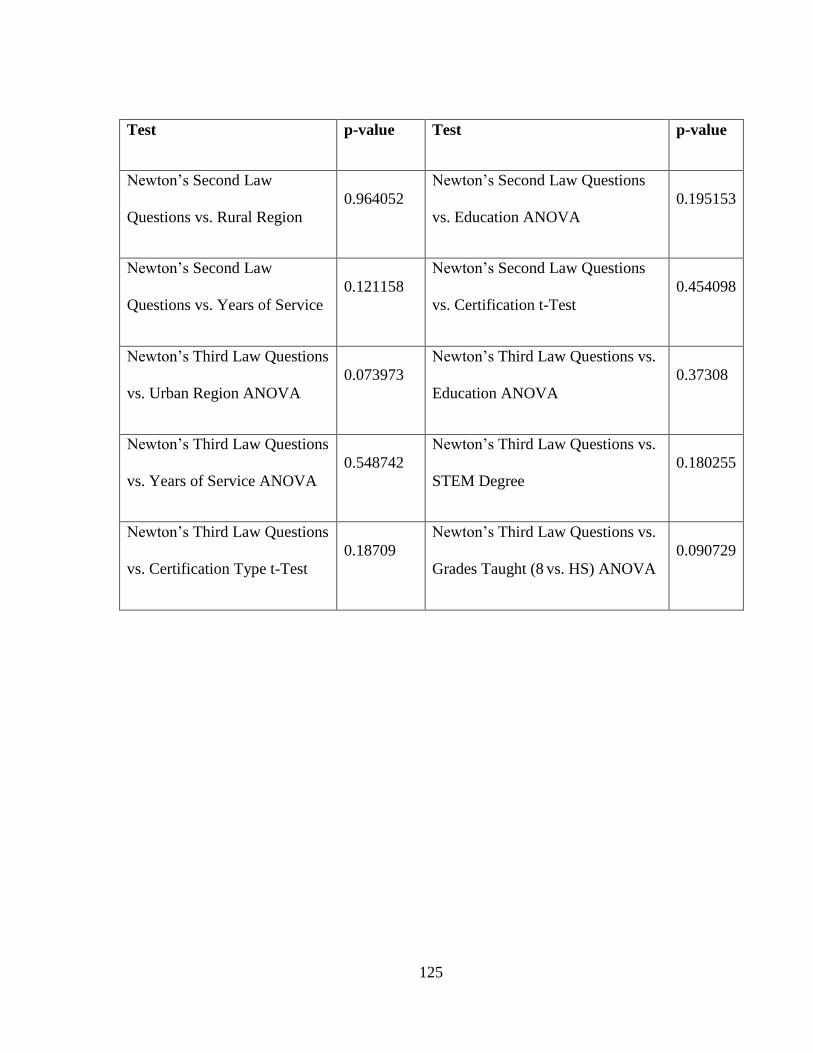
125
Test p-value Test p-value
Newton’s Second Law
Questions vs. Rural Region
0.964052
Newton’s Second Law Questions
vs. Education ANOVA
0.195153
Newton’s Second Law
Questions vs. Years of Service
0.121158
Newton’s Second Law Questions
vs. Certification t-Test
0.454098
Newton’s Third Law Questions
vs. Urban Region ANOVA
0.073973
Newton’s Third Law Questions vs.
Education ANOVA
0.37308
Newton’s Third Law Questions
vs. Years of Service ANOVA
0.548742
Newton’s Third Law Questions vs.
STEM Degree
0.180255
Newton’s Third Law Questions
vs. Certification Type t-Test
0.18709
Newton’s Third Law Questions vs.
Grades Taught (8 vs. HS) ANOVA
0.090729
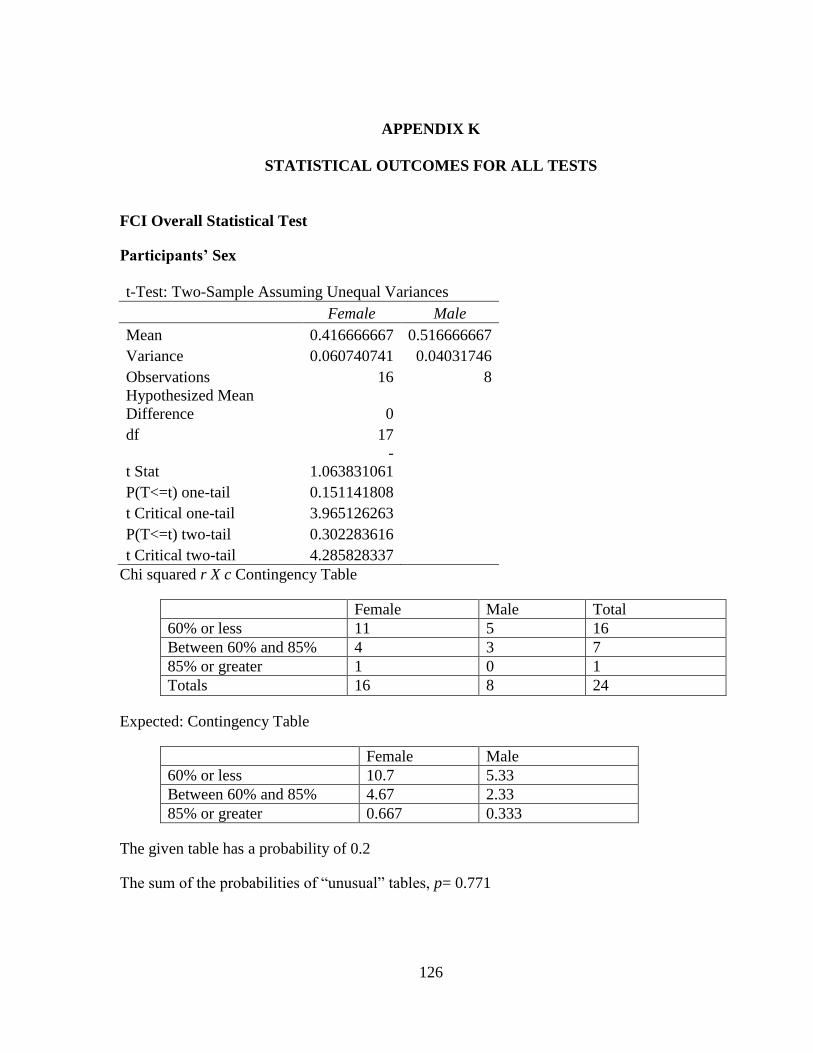
126
APPENDIX K
STATISTICAL OUTCOMES FOR ALL TESTS
FCI Overall Statistical Test
Participants’ Sex
t-Test: Two-Sample Assuming Unequal Variances
Female Male
Mean 0.416666667 0.516666667
Variance 0.060740741 0.04031746
Observations 16 8
Hypothesized Mean
Difference 0
df 17
t Stat
-
1.063831061
P(T<=t) one-tail 0.151141808
t Critical one-tail 3.965126263
P(T<=t) two-tail 0.302283616
t Critical two-tail 4.285828337
Chi squared r X c Contingency Table
Female Male Total
60% or less 11 5 16
Between 60% and 85% 4 3 7
85% or greater 1 0 1
Totals 16 8 24
Expected: Contingency Table
Female Male
60% or less 10.7 5.33
Between 60% and 85% 4.67 2.33
85% or greater 0.667 0.333
The given table has a probability of 0.2
The sum of the probabilities of “unusual” tables, p= 0.771
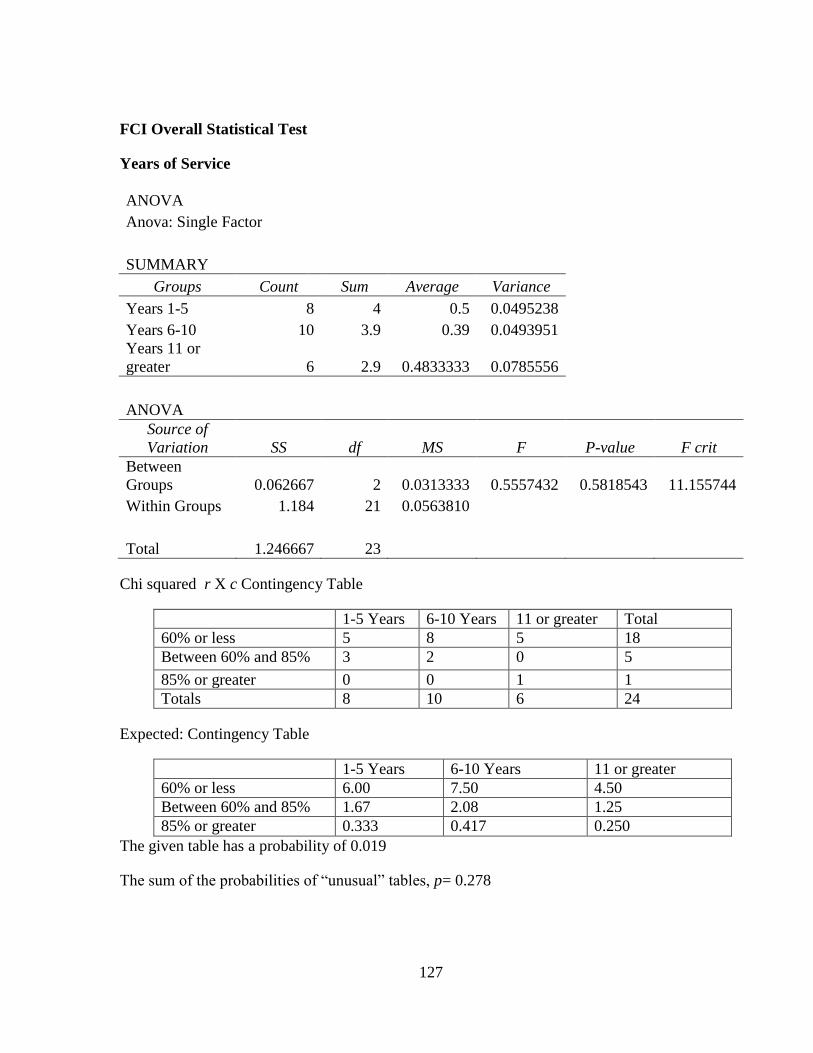
127
FCI Overall Statistical Test
Years of Service
ANOVA
Anova: Single Factor
SUMMARY
Groups Count Sum Average Variance
Years 1-5 8 4 0.5 0.0495238
Years 6-10 10 3.9 0.39 0.0493951
Years 11 or
greater 6 2.9 0.4833333 0.0785556
ANOVA
Source of
Variation SS df MS F P-value F crit
Between
Groups 0.062667 2 0.0313333 0.5557432 0.5818543 11.155744
Within Groups 1.184 21 0.0563810
Total 1.246667 23
Chi squared r X c Contingency Table
1-5 Years 6-10 Years 11 or greater Total
60% or less 5 8 5 18
Between 60% and 85% 3 2 0 5
85% or greater 0 0 1 1
Totals 8 10 6 24
Expected: Contingency Table
1-5 Years 6-10 Years 11 or greater
60% or less 6.00 7.50 4.50
Between 60% and 85% 1.67 2.08 1.25
85% or greater 0.333 0.417 0.250
The given table has a probability of 0.019
The sum of the probabilities of “unusual” tables, p= 0.278
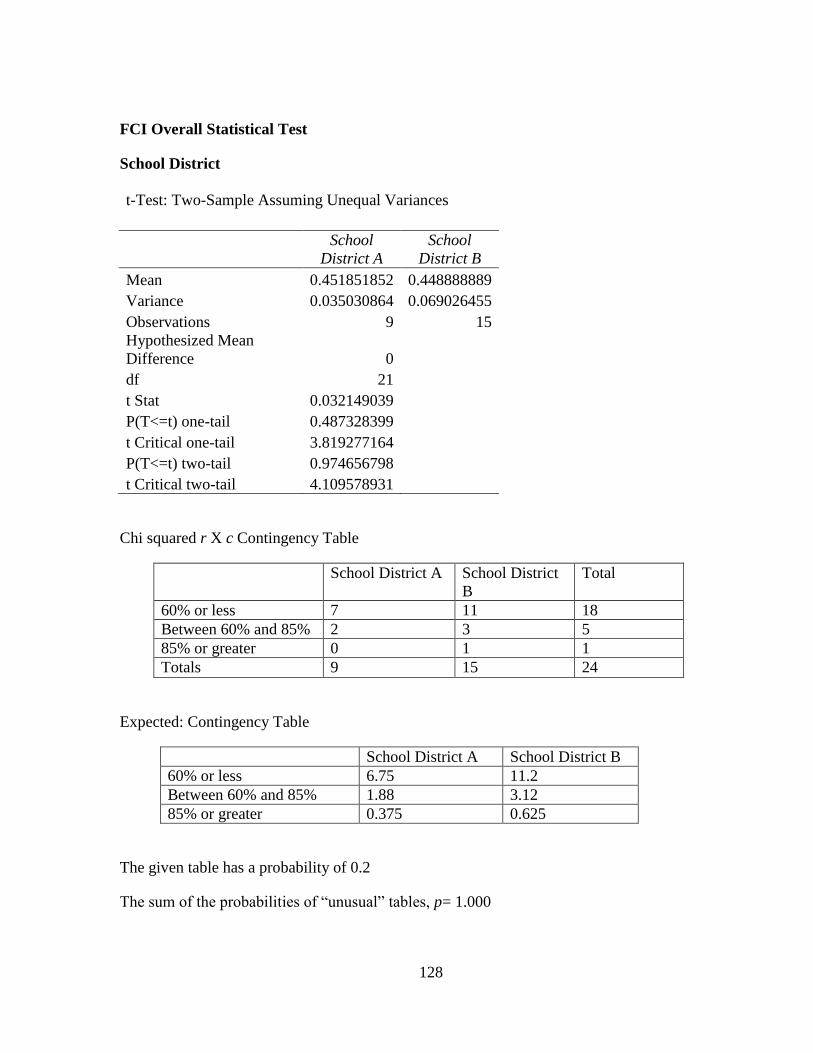
128
FCI Overall Statistical Test
School District
t-Test: Two-Sample Assuming Unequal Variances
School
District A
School
District B
Mean 0.451851852 0.448888889
Variance 0.035030864 0.069026455
Observations 9 15
Hypothesized Mean
Difference 0
df 21
t Stat 0.032149039
P(T<=t) one-tail 0.487328399
t Critical one-tail 3.819277164
P(T<=t) two-tail 0.974656798
t Critical two-tail 4.109578931
Chi squared r X c Contingency Table
School District A School District
B
Total
60% or less 7 11 18
Between 60% and 85% 2 3 5
85% or greater 0 1 1
Totals 9 15 24
Expected: Contingency Table
School District A School District B
60% or less 6.75 11.2
Between 60% and 85% 1.88 3.12
85% or greater 0.375 0.625
The given table has a probability of 0.2
The sum of the probabilities of “unusual” tables, p= 1.000
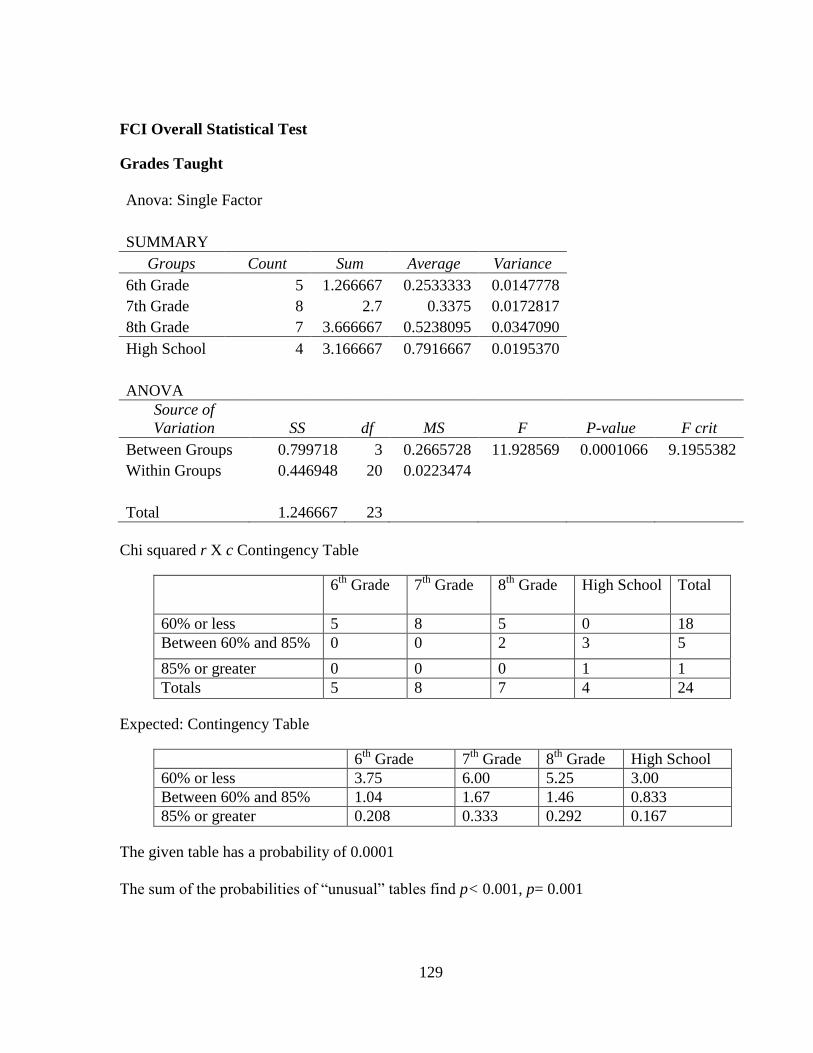
129
FCI Overall Statistical Test
Grades Taught
Anova: Single Factor
SUMMARY
Groups Count Sum Average Variance
6th Grade 5 1.266667 0.2533333 0.0147778
7th Grade 8 2.7 0.3375 0.0172817
8th Grade 7 3.666667 0.5238095 0.0347090
High School 4 3.166667 0.7916667 0.0195370
ANOVA
Source of
Variation SS df MS F P-value F crit
Between Groups 0.799718 3 0.2665728 11.928569 0.0001066 9.1955382
Within Groups 0.446948 20 0.0223474
Total 1.246667 23
Chi squared r X c Contingency Table
6th
Grade 7th
Grade 8th
Grade High School Total
60% or less 5 8 5 0 18
Between 60% and 85% 0 0 2 3 5
85% or greater 0 0 0 1 1
Totals 5 8 7 4 24
Expected: Contingency Table
6th
Grade 7th
Grade 8th
Grade High School
60% or less 3.75 6.00 5.25 3.00
Between 60% and 85% 1.04 1.67 1.46 0.833
85% or greater 0.208 0.333 0.292 0.167
The given table has a probability of 0.0001
The sum of the probabilities of “unusual” tables find p< 0.001, p= 0.001
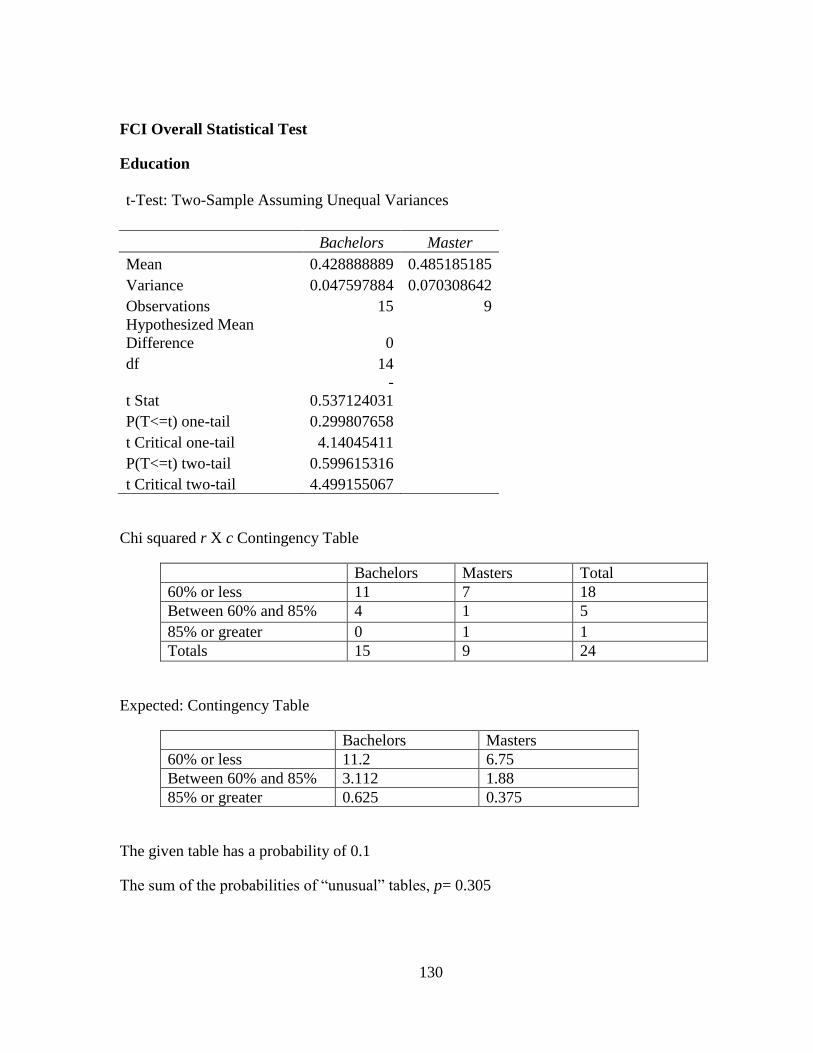
130
FCI Overall Statistical Test
Education
t-Test: Two-Sample Assuming Unequal Variances
Bachelors Master
Mean 0.428888889 0.485185185
Variance 0.047597884 0.070308642
Observations 15 9
Hypothesized Mean
Difference 0
df 14
t Stat
-
0.537124031
P(T<=t) one-tail 0.299807658
t Critical one-tail 4.14045411
P(T<=t) two-tail 0.599615316
t Critical two-tail 4.499155067
Chi squared r X c Contingency Table
Bachelors Masters Total
60% or less 11 7 18
Between 60% and 85% 4 1 5
85% or greater 0 1 1
Totals 15 9 24
Expected: Contingency Table
Bachelors Masters
60% or less 11.2 6.75
Between 60% and 85% 3.112 1.88
85% or greater 0.625 0.375
The given table has a probability of 0.1
The sum of the probabilities of “unusual” tables, p= 0.305
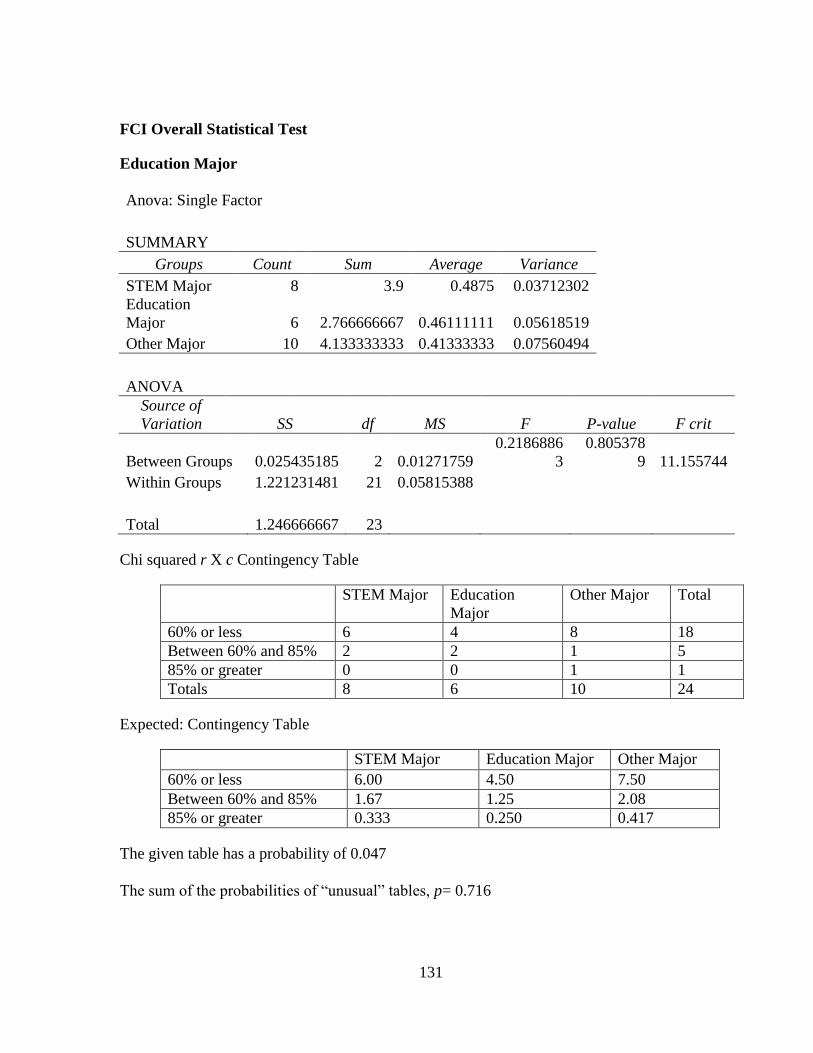
131
FCI Overall Statistical Test
Education Major
Anova: Single Factor
SUMMARY
Groups Count Sum Average Variance
STEM Major 8 3.9 0.4875 0.03712302
Education
Major 6 2.766666667 0.46111111 0.05618519
Other Major 10 4.133333333 0.41333333 0.07560494
ANOVA
Source of
Variation SS df MS F P-value F crit
Between Groups 0.025435185 2 0.01271759
0.2186886
3
0.805378
9 11.155744
Within Groups 1.221231481 21 0.05815388
Total 1.246666667 23
Chi squared r X c Contingency Table
STEM Major Education
Major
Other Major Total
60% or less 6 4 8 18
Between 60% and 85% 2 2 1 5
85% or greater 0 0 1 1
Totals 8 6 10 24
Expected: Contingency Table
STEM Major Education Major Other Major
60% or less 6.00 4.50 7.50
Between 60% and 85% 1.67 1.25 2.08
85% or greater 0.333 0.250 0.417
The given table has a probability of 0.047
The sum of the probabilities of “unusual” tables, p= 0.716
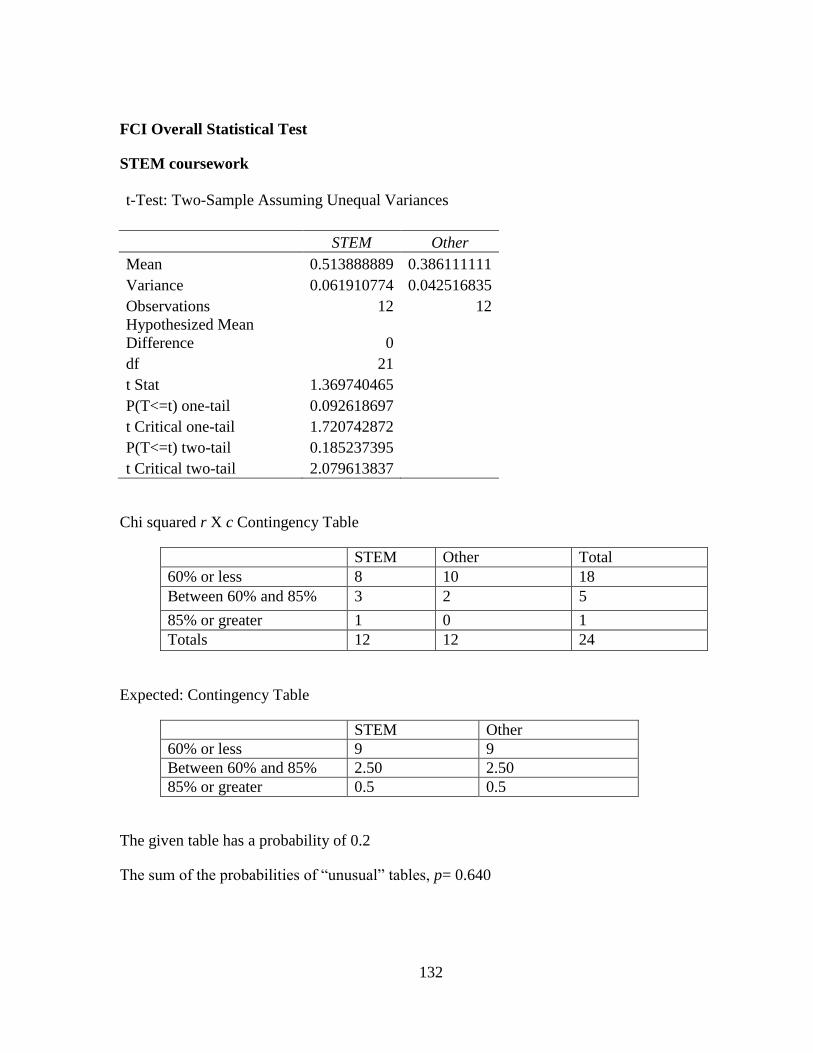
132
FCI Overall Statistical Test
STEM coursework
t-Test: Two-Sample Assuming Unequal Variances
STEM Other
Mean 0.513888889 0.386111111
Variance 0.061910774 0.042516835
Observations 12 12
Hypothesized Mean
Difference 0
df 21
t Stat 1.369740465
P(T<=t) one-tail 0.092618697
t Critical one-tail 1.720742872
P(T<=t) two-tail 0.185237395
t Critical two-tail 2.079613837
Chi squared r X c Contingency Table
STEM Other Total
60% or less 8 10 18
Between 60% and 85% 3 2 5
85% or greater 1 0 1
Totals 12 12 24
Expected: Contingency Table
STEM Other
60% or less 9 9
Between 60% and 85% 2.50 2.50
85% or greater 0.5 0.5
The given table has a probability of 0.2
The sum of the probabilities of “unusual” tables, p= 0.640
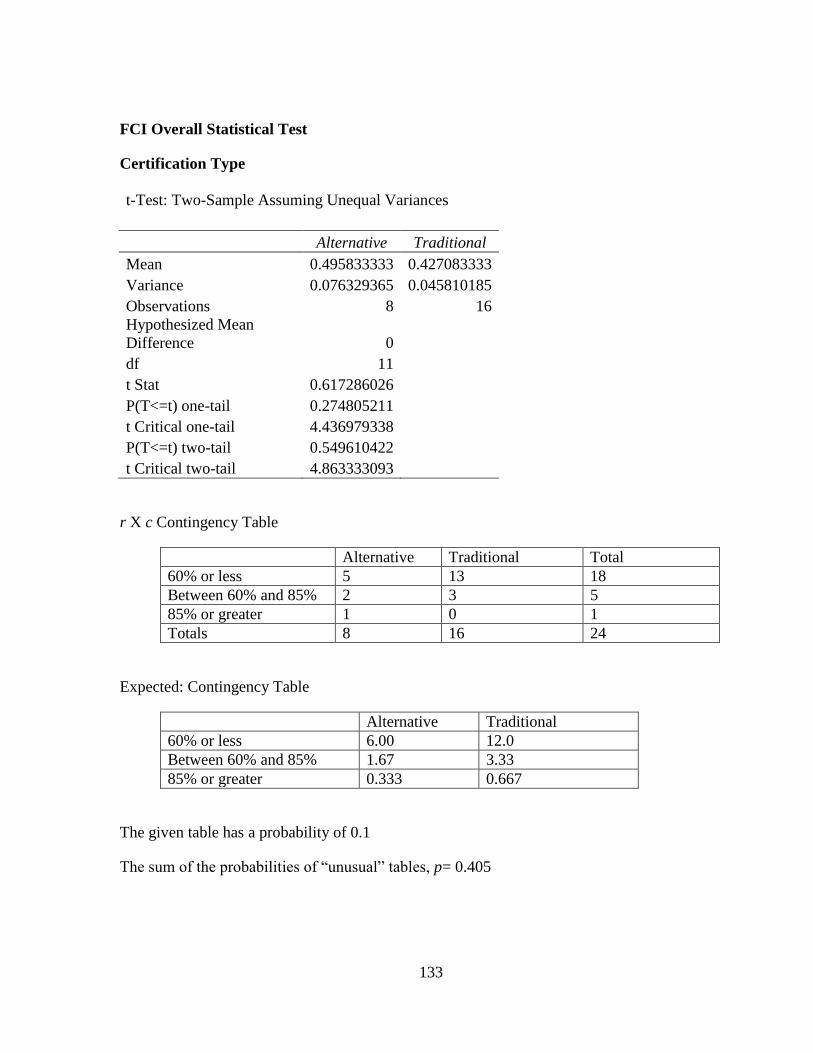
133
FCI Overall Statistical Test
Certification Type
t-Test: Two-Sample Assuming Unequal Variances
Alternative Traditional
Mean 0.495833333 0.427083333
Variance 0.076329365 0.045810185
Observations 8 16
Hypothesized Mean
Difference 0
df 11
t Stat 0.617286026
P(T<=t) one-tail 0.274805211
t Critical one-tail 4.436979338
P(T<=t) two-tail 0.549610422
t Critical two-tail 4.863333093
r X c Contingency Table
Alternative Traditional Total
60% or less 5 13 18
Between 60% and 85% 2 3 5
85% or greater 1 0 1
Totals 8 16 24
Expected: Contingency Table
Alternative Traditional
60% or less 6.00 12.0
Between 60% and 85% 1.67 3.33
85% or greater 0.333 0.667
The given table has a probability of 0.1
The sum of the probabilities of “unusual” tables, p= 0.405
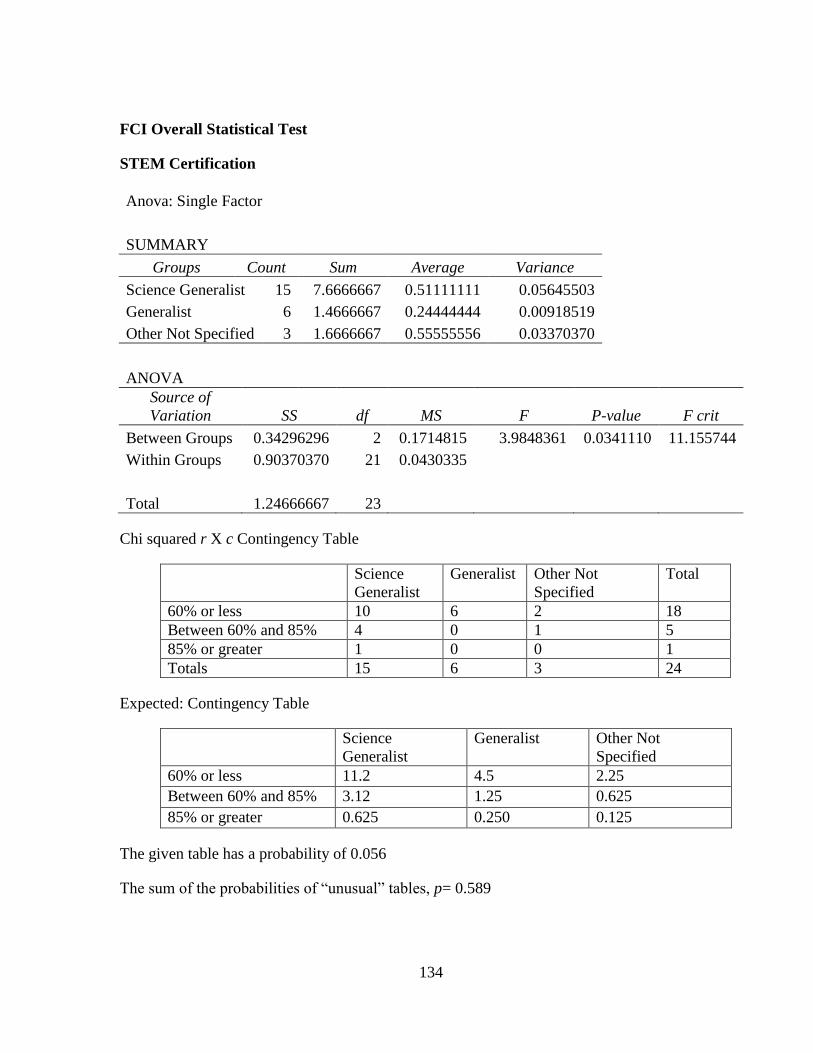
134
FCI Overall Statistical Test
STEM Certification
Anova: Single Factor
SUMMARY
Groups Count Sum Average Variance
Science Generalist 15 7.6666667 0.51111111 0.05645503
Generalist 6 1.4666667 0.24444444 0.00918519
Other Not Specified 3 1.6666667 0.55555556 0.03370370
ANOVA
Source of
Variation SS df MS F P-value F crit
Between Groups 0.34296296 2 0.1714815 3.9848361 0.0341110 11.155744
Within Groups 0.90370370 21 0.0430335
Total 1.24666667 23
Chi squared r X c Contingency Table
Science
Generalist
Generalist Other Not
Specified
Total
60% or less 10 6 2 18
Between 60% and 85% 4 0 1 5
85% or greater 1 0 0 1
Totals 15 6 3 24
Expected: Contingency Table
Science
Generalist
Generalist Other Not
Specified
60% or less 11.2 4.5 2.25
Between 60% and 85% 3.12 1.25 0.625
85% or greater 0.625 0.250 0.125
The given table has a probability of 0.056
The sum of the probabilities of “unusual” tables, p= 0.589
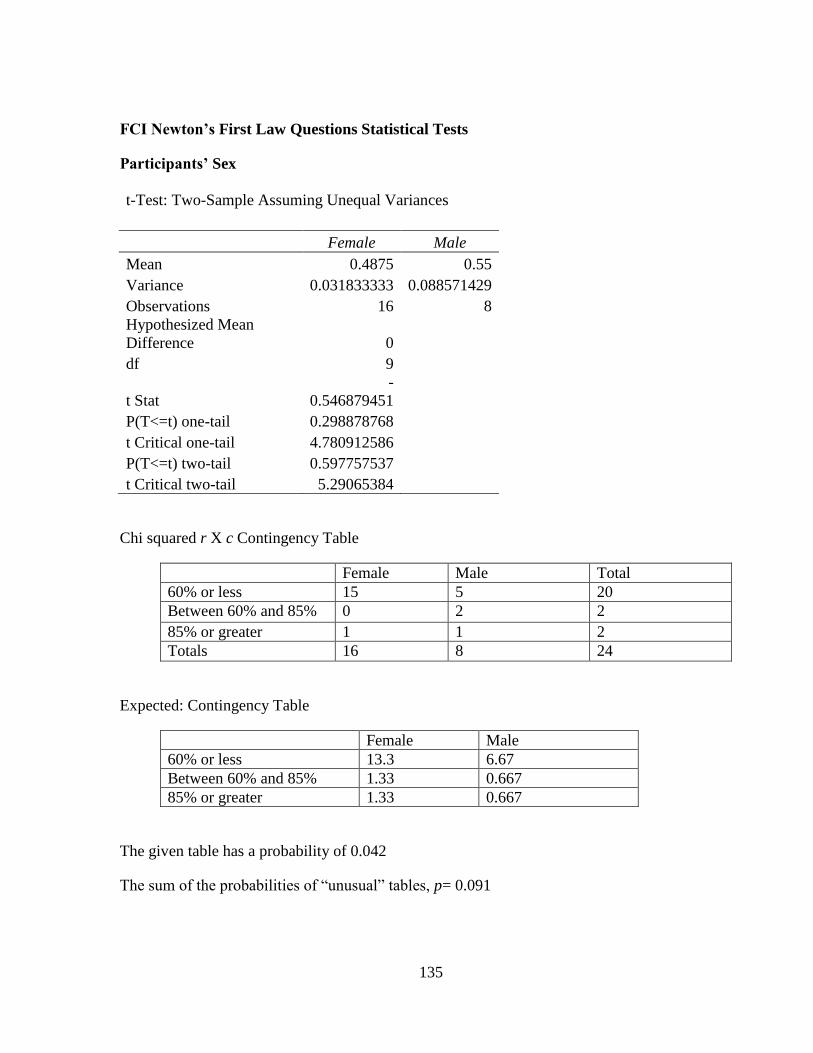
135
FCI Newton’s First Law Questions Statistical Tests
Participants’ Sex
t-Test: Two-Sample Assuming Unequal Variances
Female Male
Mean 0.4875 0.55
Variance 0.031833333 0.088571429
Observations 16 8
Hypothesized Mean
Difference 0
df 9
t Stat
-
0.546879451
P(T<=t) one-tail 0.298878768
t Critical one-tail 4.780912586
P(T<=t) two-tail 0.597757537
t Critical two-tail 5.29065384
Chi squared r X c Contingency Table
Female Male Total
60% or less 15 5 20
Between 60% and 85% 0 2 2
85% or greater 1 1 2
Totals 16 8 24
Expected: Contingency Table
Female Male
60% or less 13.3 6.67
Between 60% and 85% 1.33 0.667
85% or greater 1.33 0.667
The given table has a probability of 0.042
The sum of the probabilities of “unusual” tables, p= 0.091
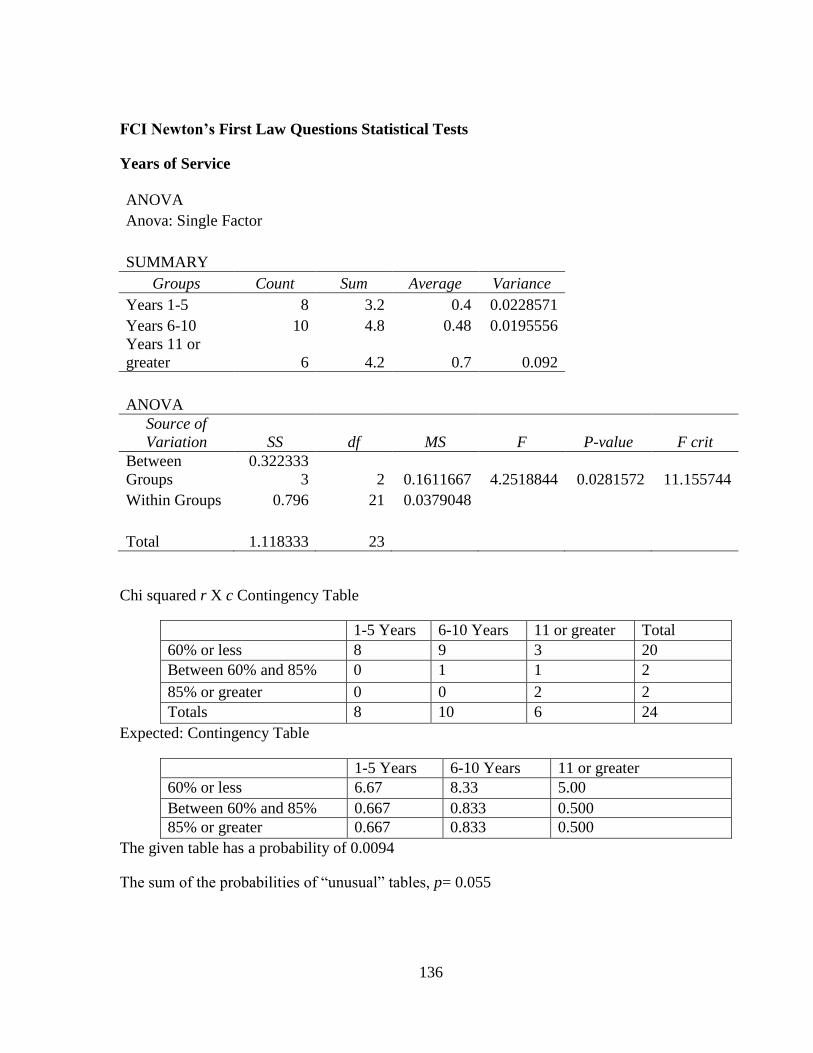
136
FCI Newton’s First Law Questions Statistical Tests
Years of Service
ANOVA
Anova: Single Factor
SUMMARY
Groups Count Sum Average Variance
Years 1-5 8 3.2 0.4 0.0228571
Years 6-10 10 4.8 0.48 0.0195556
Years 11 or
greater 6 4.2 0.7 0.092
ANOVA
Source of
Variation SS df MS F P-value F crit
Between
Groups
0.322333
3 2 0.1611667 4.2518844 0.0281572 11.155744
Within Groups 0.796 21 0.0379048
Total 1.118333 23
Chi squared r X c Contingency Table
1-5 Years 6-10 Years 11 or greater Total
60% or less 8 9 3 20
Between 60% and 85% 0 1 1 2
85% or greater 0 0 2 2
Totals 8 10 6 24
Expected: Contingency Table
1-5 Years 6-10 Years 11 or greater
60% or less 6.67 8.33 5.00
Between 60% and 85% 0.667 0.833 0.500
85% or greater 0.667 0.833 0.500
The given table has a probability of 0.0094
The sum of the probabilities of “unusual” tables, p= 0.055
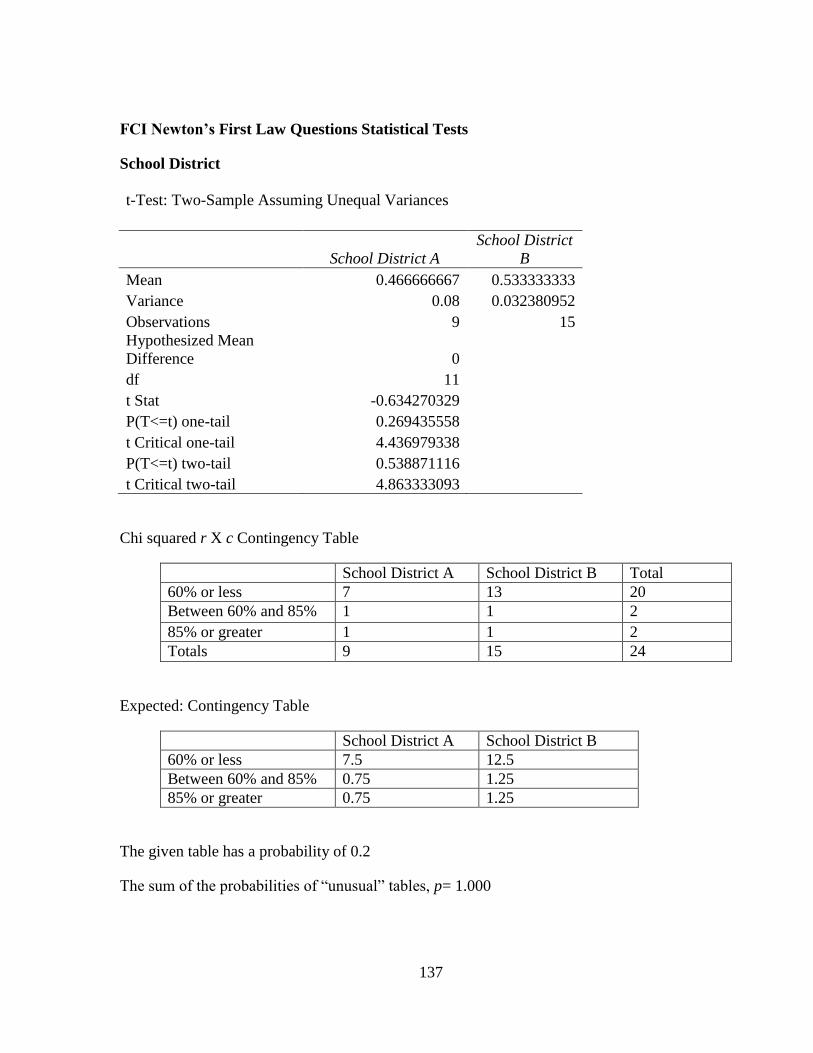
137
FCI Newton’s First Law Questions Statistical Tests
School District
t-Test: Two-Sample Assuming Unequal Variances
School District A
School District
B
Mean 0.466666667 0.533333333
Variance 0.08 0.032380952
Observations 9 15
Hypothesized Mean
Difference 0
df 11
t Stat -0.634270329
P(T<=t) one-tail 0.269435558
t Critical one-tail 4.436979338
P(T<=t) two-tail 0.538871116
t Critical two-tail 4.863333093
Chi squared r X c Contingency Table
School District A School District B Total
60% or less 7 13 20
Between 60% and 85% 1 1 2
85% or greater 1 1 2
Totals 9 15 24
Expected: Contingency Table
School District A School District B
60% or less 7.5 12.5
Between 60% and 85% 0.75 1.25
85% or greater 0.75 1.25
The given table has a probability of 0.2
The sum of the probabilities of “unusual” tables, p= 1.000
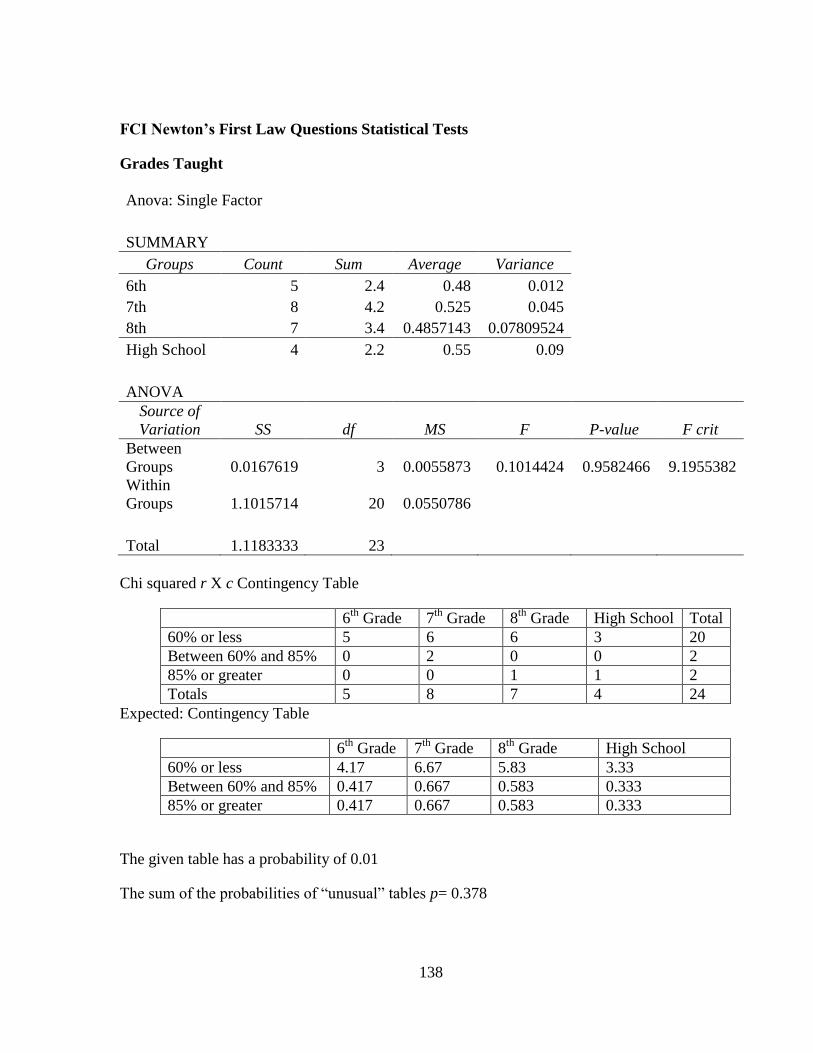
138
FCI Newton’s First Law Questions Statistical Tests
Grades Taught
Anova: Single Factor
SUMMARY
Groups Count Sum Average Variance
6th 5 2.4 0.48 0.012
7th 8 4.2 0.525 0.045
8th 7 3.4 0.4857143 0.07809524
High School 4 2.2 0.55 0.09
ANOVA
Source of
Variation SS df MS F P-value F crit
Between
Groups 0.0167619 3 0.0055873 0.1014424 0.9582466 9.1955382
Within
Groups 1.1015714 20 0.0550786
Total 1.1183333 23
Chi squared r X c Contingency Table
6th
Grade 7th
Grade 8th
Grade High School Total
60% or less 5 6 6 3 20
Between 60% and 85% 0 2 0 0 2
85% or greater 0 0 1 1 2
Totals 5 8 7 4 24
Expected: Contingency Table
6th
Grade 7th
Grade 8th
Grade High School
60% or less 4.17 6.67 5.83 3.33
Between 60% and 85% 0.417 0.667 0.583 0.333
85% or greater 0.417 0.667 0.583 0.333
The given table has a probability of 0.01
The sum of the probabilities of “unusual” tables p= 0.378
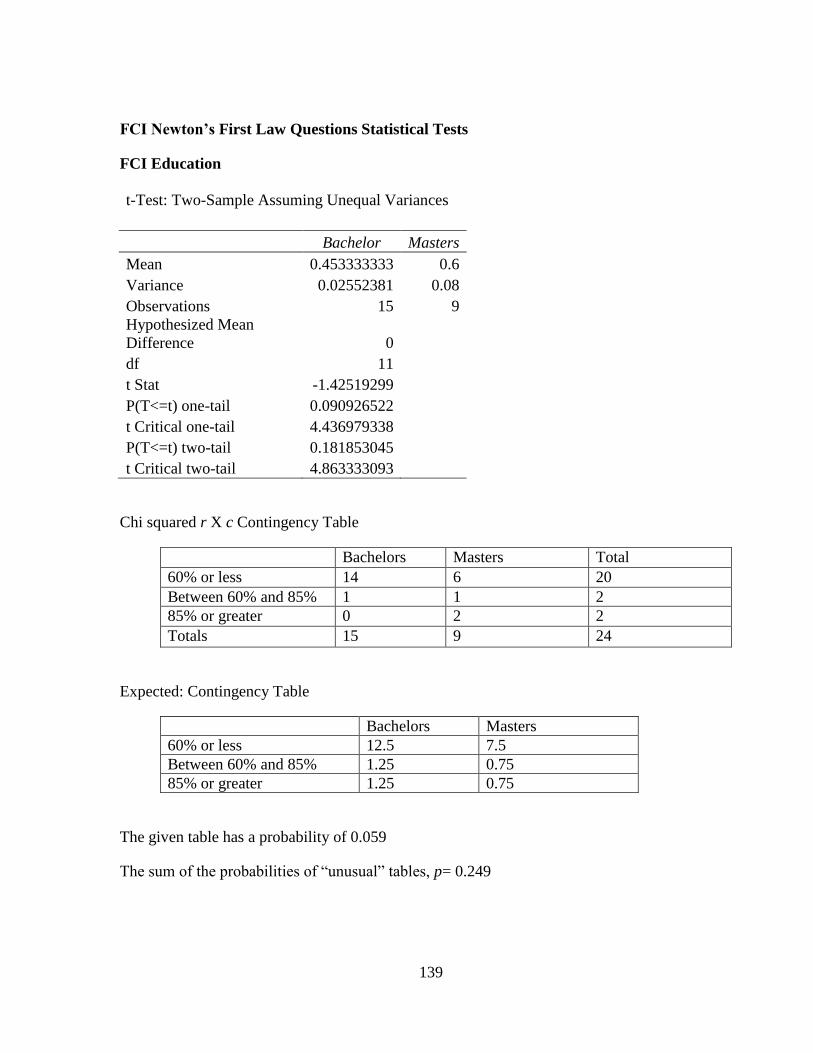
139
FCI Newton’s First Law Questions Statistical Tests
FCI Education
t-Test: Two-Sample Assuming Unequal Variances
Bachelor Masters
Mean 0.453333333 0.6
Variance 0.02552381 0.08
Observations 15 9
Hypothesized Mean
Difference 0
df 11
t Stat -1.42519299
P(T<=t) one-tail 0.090926522
t Critical one-tail 4.436979338
P(T<=t) two-tail 0.181853045
t Critical two-tail 4.863333093
Chi squared r X c Contingency Table
Bachelors Masters Total
60% or less 14 6 20
Between 60% and 85% 1 1 2
85% or greater 0 2 2
Totals 15 9 24
Expected: Contingency Table
Bachelors Masters
60% or less 12.5 7.5
Between 60% and 85% 1.25 0.75
85% or greater 1.25 0.75
The given table has a probability of 0.059
The sum of the probabilities of “unusual” tables, p= 0.249
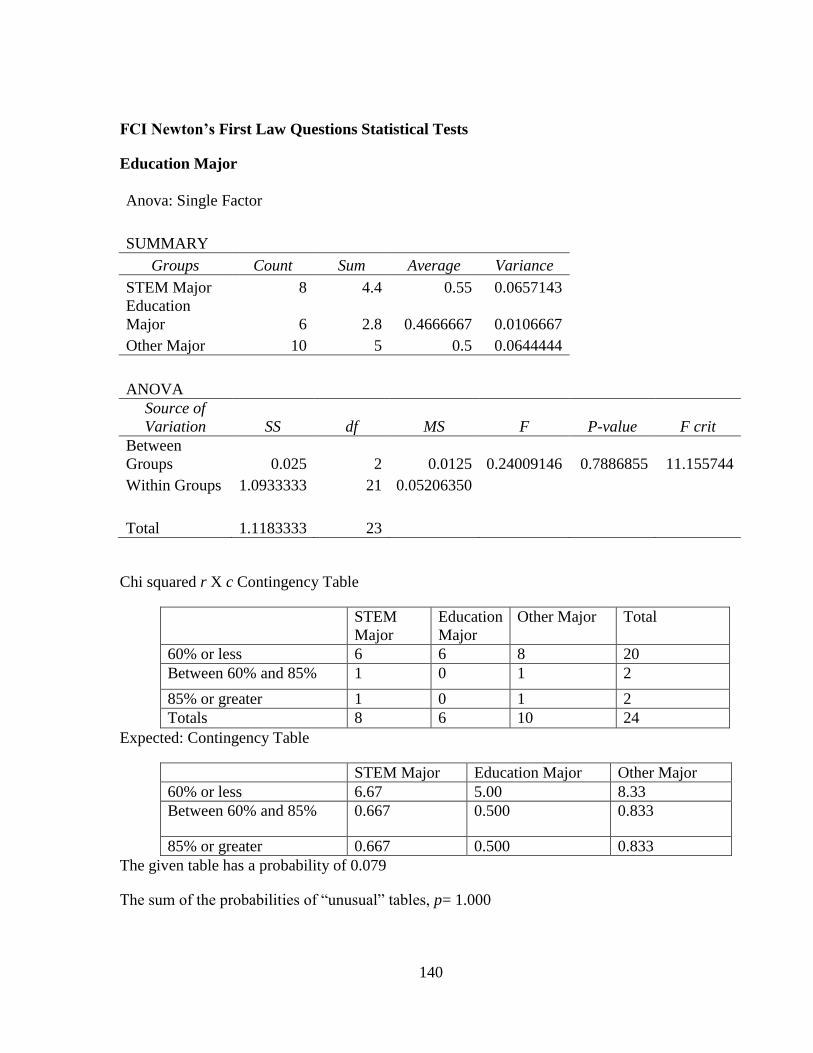
140
FCI Newton’s First Law Questions Statistical Tests
Education Major
Anova: Single Factor
SUMMARY
Groups Count Sum Average Variance
STEM Major 8 4.4 0.55 0.0657143
Education
Major 6 2.8 0.4666667 0.0106667
Other Major 10 5 0.5 0.0644444
ANOVA
Source of
Variation SS df MS F P-value F crit
Between
Groups 0.025 2 0.0125 0.24009146 0.7886855 11.155744
Within Groups 1.0933333 21 0.05206350
Total 1.1183333 23
Chi squared r X c Contingency Table
STEM
Major
Education
Major
Other Major Total
60% or less 6 6 8 20
Between 60% and 85% 1 0 1 2
85% or greater 1 0 1 2
Totals 8 6 10 24
Expected: Contingency Table
STEM Major Education Major Other Major
60% or less 6.67 5.00 8.33
Between 60% and 85% 0.667 0.500 0.833
85% or greater 0.667 0.500 0.833
The given table has a probability of 0.079
The sum of the probabilities of “unusual” tables, p= 1.000
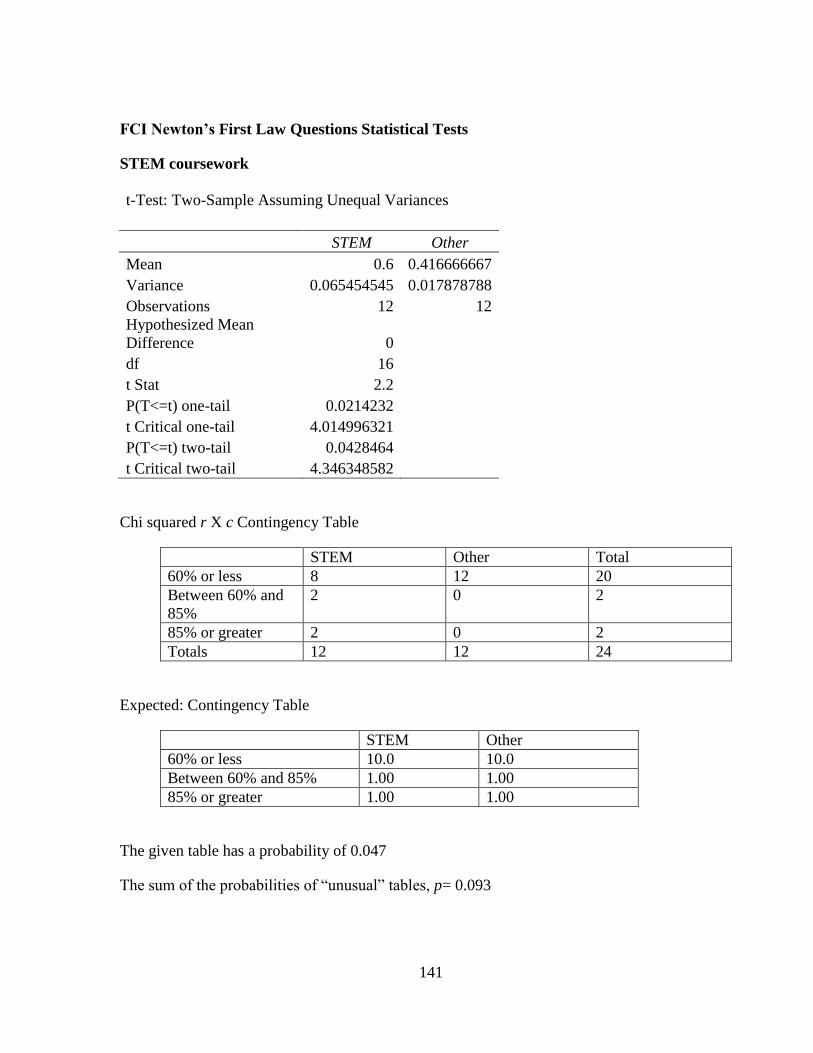
141
FCI Newton’s First Law Questions Statistical Tests
STEM coursework
t-Test: Two-Sample Assuming Unequal Variances
STEM Other
Mean 0.6 0.416666667
Variance 0.065454545 0.017878788
Observations 12 12
Hypothesized Mean
Difference 0
df 16
t Stat 2.2
P(T<=t) one-tail 0.0214232
t Critical one-tail 4.014996321
P(T<=t) two-tail 0.0428464
t Critical two-tail 4.346348582
Chi squared r X c Contingency Table
STEM Other Total
60% or less 8 12 20
Between 60% and
85%
2 0 2
85% or greater 2 0 2
Totals 12 12 24
Expected: Contingency Table
STEM Other
60% or less 10.0 10.0
Between 60% and 85% 1.00 1.00
85% or greater 1.00 1.00
The given table has a probability of 0.047
The sum of the probabilities of “unusual” tables, p= 0.093
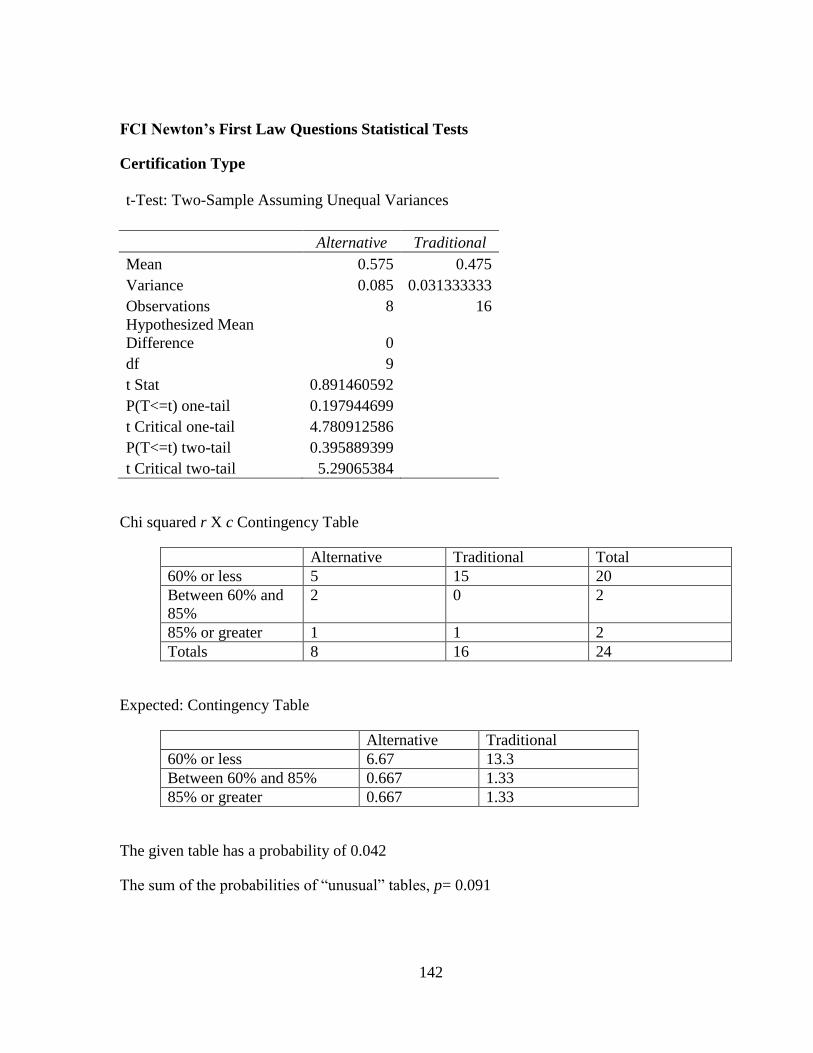
142
FCI Newton’s First Law Questions Statistical Tests
Certification Type
t-Test: Two-Sample Assuming Unequal Variances
Alternative Traditional
Mean 0.575 0.475
Variance 0.085 0.031333333
Observations 8 16
Hypothesized Mean
Difference 0
df 9
t Stat 0.891460592
P(T<=t) one-tail 0.197944699
t Critical one-tail 4.780912586
P(T<=t) two-tail 0.395889399
t Critical two-tail 5.29065384
Chi squared r X c Contingency Table
Alternative Traditional Total
60% or less 5 15 20
Between 60% and
85%
2 0 2
85% or greater 1 1 2
Totals 8 16 24
Expected: Contingency Table
Alternative Traditional
60% or less 6.67 13.3
Between 60% and 85% 0.667 1.33
85% or greater 0.667 1.33
The given table has a probability of 0.042
The sum of the probabilities of “unusual” tables, p= 0.091
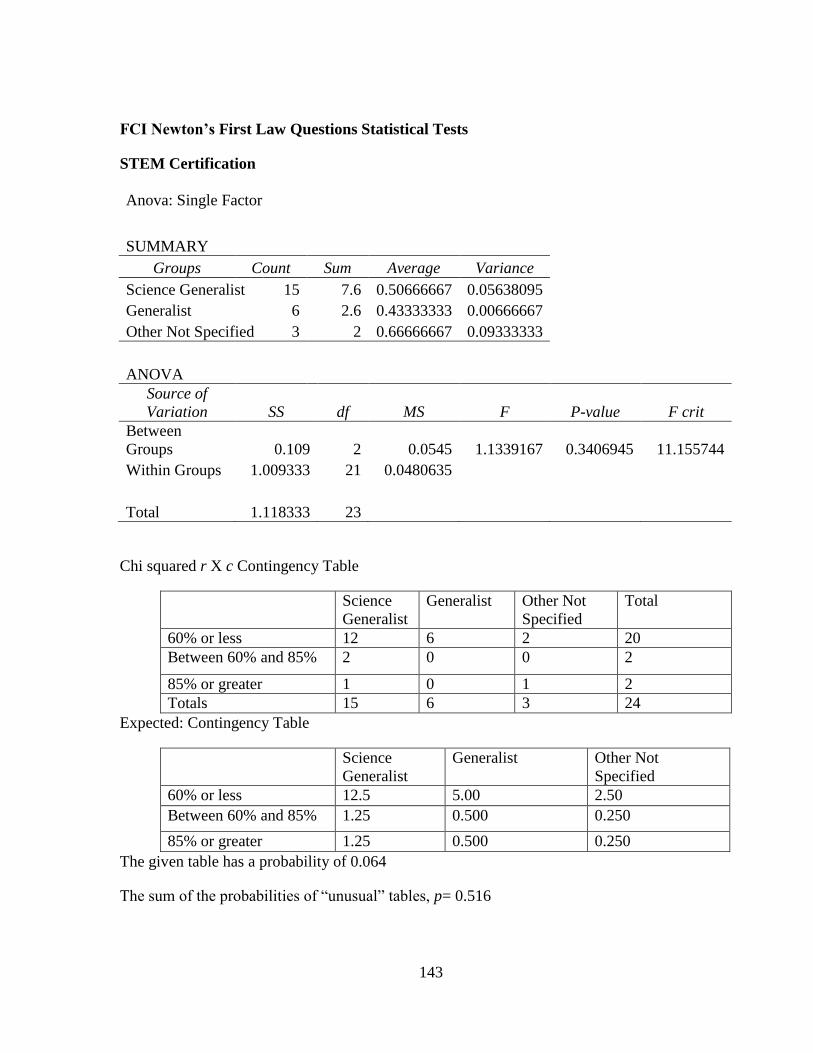
143
FCI Newton’s First Law Questions Statistical Tests
STEM Certification
Anova: Single Factor
SUMMARY
Groups Count Sum Average Variance
Science Generalist 15 7.6 0.50666667 0.05638095
Generalist 6 2.6 0.43333333 0.00666667
Other Not Specified 3 2 0.66666667 0.09333333
ANOVA
Source of
Variation SS df MS F P-value F crit
Between
Groups 0.109 2 0.0545 1.1339167 0.3406945 11.155744
Within Groups 1.009333 21 0.0480635
Total 1.118333 23
Chi squared r X c Contingency Table
Science
Generalist
Generalist Other Not
Specified
Total
60% or less 12 6 2 20
Between 60% and 85% 2 0 0 2
85% or greater 1 0 1 2
Totals 15 6 3 24
Expected: Contingency Table
Science
Generalist
Generalist Other Not
Specified
60% or less 12.5 5.00 2.50
Between 60% and 85% 1.25 0.500 0.250
85% or greater 1.25 0.500 0.250
The given table has a probability of 0.064
The sum of the probabilities of “unusual” tables, p= 0.516
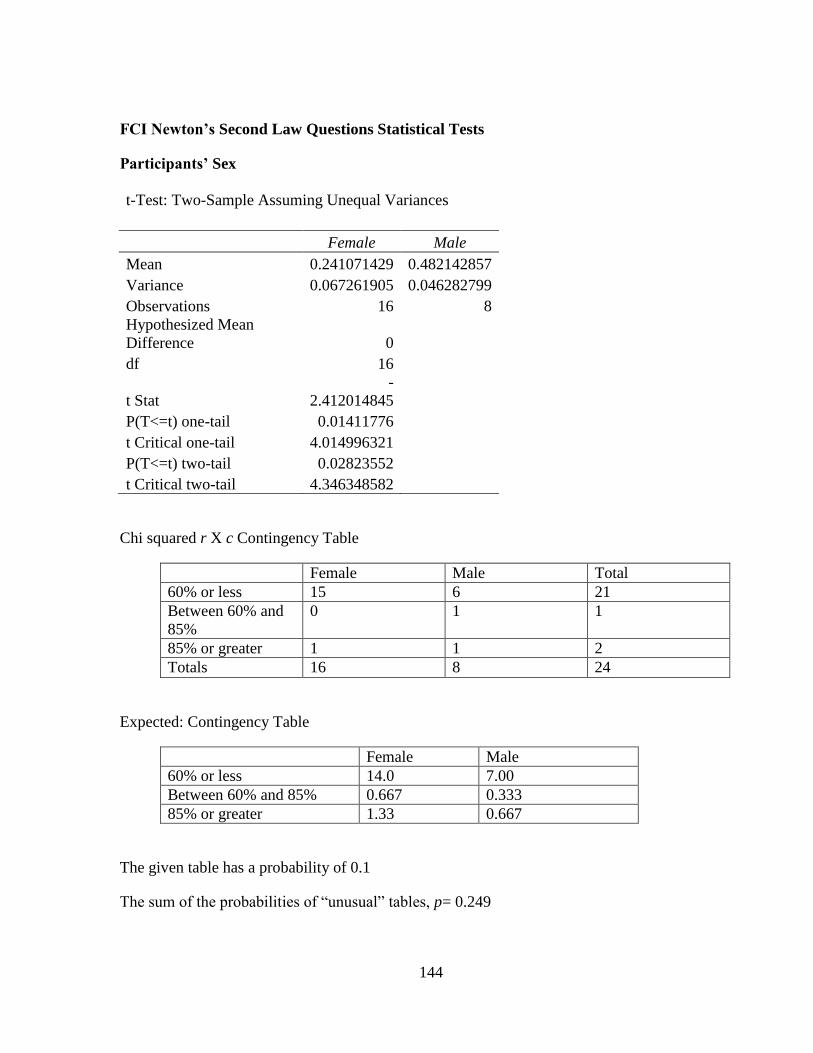
144
FCI Newton’s Second Law Questions Statistical Tests
Participants’ Sex
t-Test: Two-Sample Assuming Unequal Variances
Female Male
Mean 0.241071429 0.482142857
Variance 0.067261905 0.046282799
Observations 16 8
Hypothesized Mean
Difference 0
df 16
t Stat
-
2.412014845
P(T<=t) one-tail 0.01411776
t Critical one-tail 4.014996321
P(T<=t) two-tail 0.02823552
t Critical two-tail 4.346348582
Chi squared r X c Contingency Table
Female Male Total
60% or less 15 6 21
Between 60% and
85%
0 1 1
85% or greater 1 1 2
Totals 16 8 24
Expected: Contingency Table
Female Male
60% or less 14.0 7.00
Between 60% and 85% 0.667 0.333
85% or greater 1.33 0.667
The given table has a probability of 0.1
The sum of the probabilities of “unusual” tables, p= 0.249
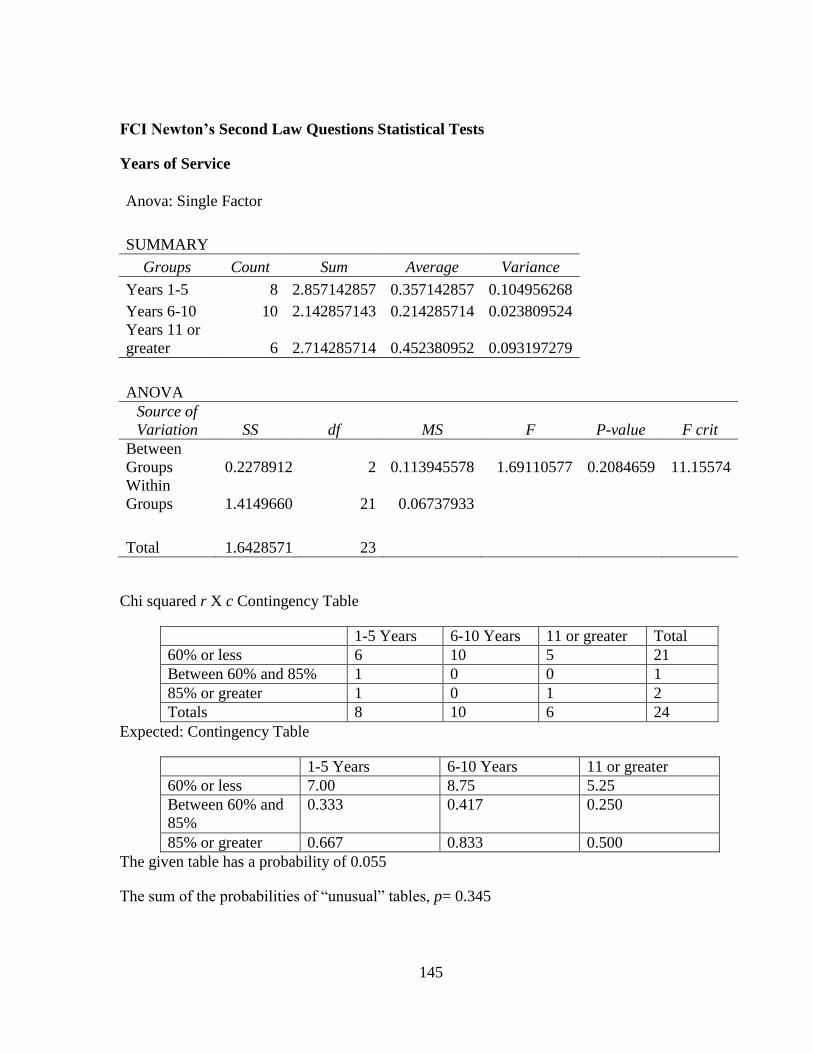
145
FCI Newton’s Second Law Questions Statistical Tests
Years of Service
Anova: Single Factor
SUMMARY
Groups Count Sum Average Variance
Years 1-5 8 2.857142857 0.357142857 0.104956268
Years 6-10 10 2.142857143 0.214285714 0.023809524
Years 11 or
greater 6 2.714285714 0.452380952 0.093197279
ANOVA
Source of
Variation SS df MS F P-value F crit
Between
Groups 0.2278912 2 0.113945578 1.69110577 0.2084659 11.15574
Within
Groups 1.4149660 21 0.06737933
Total 1.6428571 23
Chi squared r X c Contingency Table
1-5 Years 6-10 Years 11 or greater Total
60% or less 6 10 5 21
Between 60% and 85% 1 0 0 1
85% or greater 1 0 1 2
Totals 8 10 6 24
Expected: Contingency Table
1-5 Years 6-10 Years 11 or greater
60% or less 7.00 8.75 5.25
Between 60% and
85%
0.333 0.417 0.250
85% or greater 0.667 0.833 0.500
The given table has a probability of 0.055
The sum of the probabilities of “unusual” tables, p= 0.345
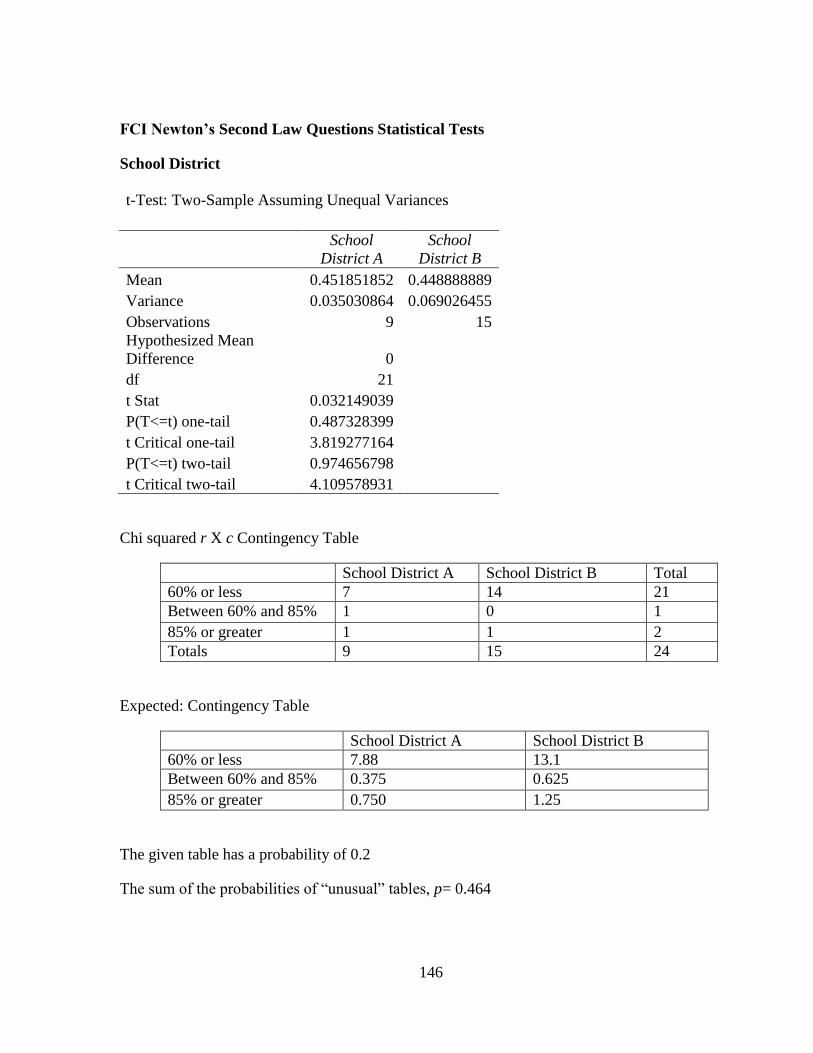
146
FCI Newton’s Second Law Questions Statistical Tests
School District
t-Test: Two-Sample Assuming Unequal Variances
School
District A
School
District B
Mean 0.451851852 0.448888889
Variance 0.035030864 0.069026455
Observations 9 15
Hypothesized Mean
Difference 0
df 21
t Stat 0.032149039
P(T<=t) one-tail 0.487328399
t Critical one-tail 3.819277164
P(T<=t) two-tail 0.974656798
t Critical two-tail 4.109578931
Chi squared r X c Contingency Table
School District A School District B Total
60% or less 7 14 21
Between 60% and 85% 1 0 1
85% or greater 1 1 2
Totals 9 15 24
Expected: Contingency Table
School District A School District B
60% or less 7.88 13.1
Between 60% and 85% 0.375 0.625
85% or greater 0.750 1.25
The given table has a probability of 0.2
The sum of the probabilities of “unusual” tables, p= 0.464
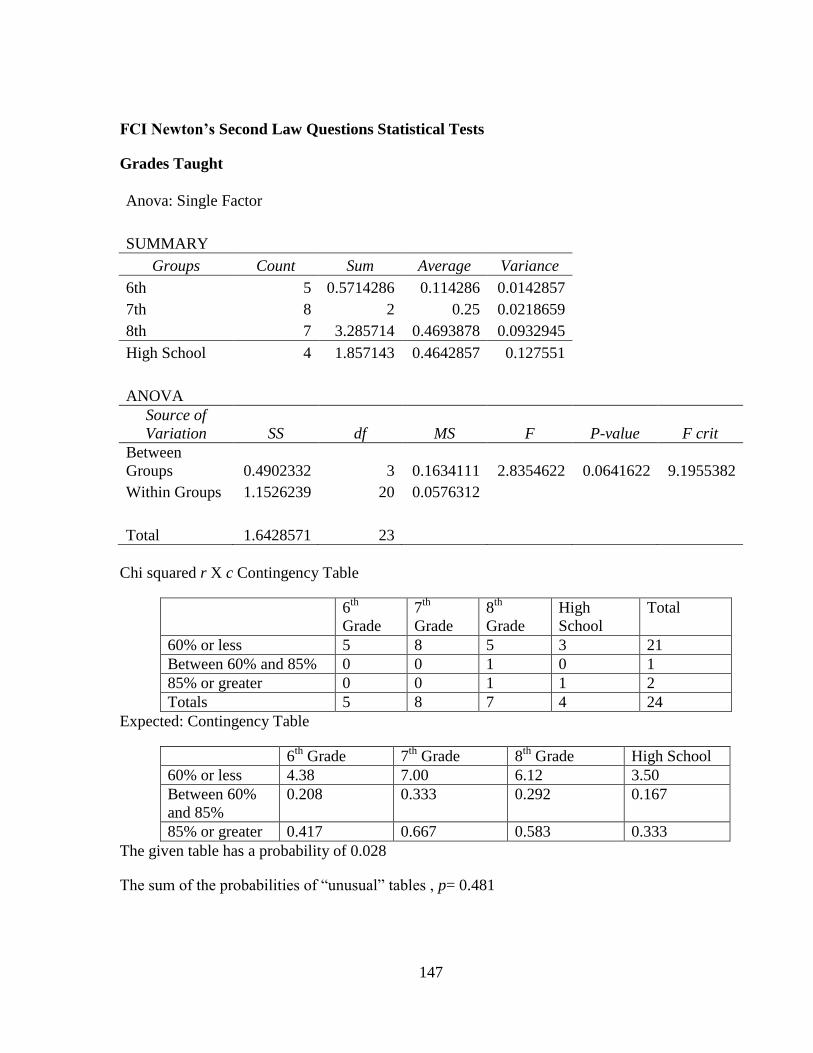
147
FCI Newton’s Second Law Questions Statistical Tests
Grades Taught
Anova: Single Factor
SUMMARY
Groups Count Sum Average Variance
6th 5 0.5714286 0.114286 0.0142857
7th 8 2 0.25 0.0218659
8th 7 3.285714 0.4693878 0.0932945
High School 4 1.857143 0.4642857 0.127551
ANOVA
Source of
Variation SS df MS F P-value F crit
Between
Groups 0.4902332 3 0.1634111 2.8354622 0.0641622 9.1955382
Within Groups 1.1526239 20 0.0576312
Total 1.6428571 23
Chi squared r X c Contingency Table
6th
Grade
7th
Grade
8th
Grade
High
School
Total
60% or less 5 8 5 3 21
Between 60% and 85% 0 0 1 0 1
85% or greater 0 0 1 1 2
Totals 5 8 7 4 24
Expected: Contingency Table
6th
Grade 7th
Grade 8th
Grade High School
60% or less 4.38 7.00 6.12 3.50
Between 60%
and 85%
0.208 0.333 0.292 0.167
85% or greater 0.417 0.667 0.583 0.333
The given table has a probability of 0.028
The sum of the probabilities of “unusual” tables , p= 0.481
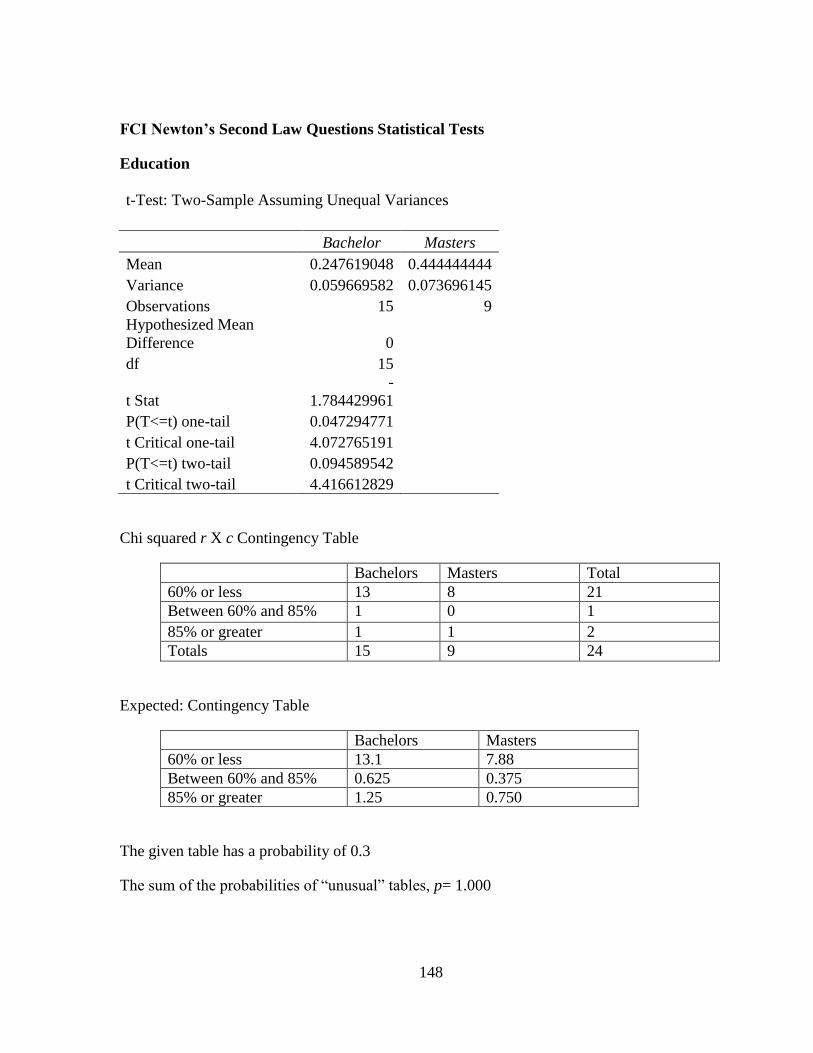
148
FCI Newton’s Second Law Questions Statistical Tests
Education
t-Test: Two-Sample Assuming Unequal Variances
Bachelor Masters
Mean 0.247619048 0.444444444
Variance 0.059669582 0.073696145
Observations 15 9
Hypothesized Mean
Difference 0
df 15
t Stat
-
1.784429961
P(T<=t) one-tail 0.047294771
t Critical one-tail 4.072765191
P(T<=t) two-tail 0.094589542
t Critical two-tail 4.416612829
Chi squared r X c Contingency Table
Bachelors Masters Total
60% or less 13 8 21
Between 60% and 85% 1 0 1
85% or greater 1 1 2
Totals 15 9 24
Expected: Contingency Table
Bachelors Masters
60% or less 13.1 7.88
Between 60% and 85% 0.625 0.375
85% or greater 1.25 0.750
The given table has a probability of 0.3
The sum of the probabilities of “unusual” tables, p= 1.000
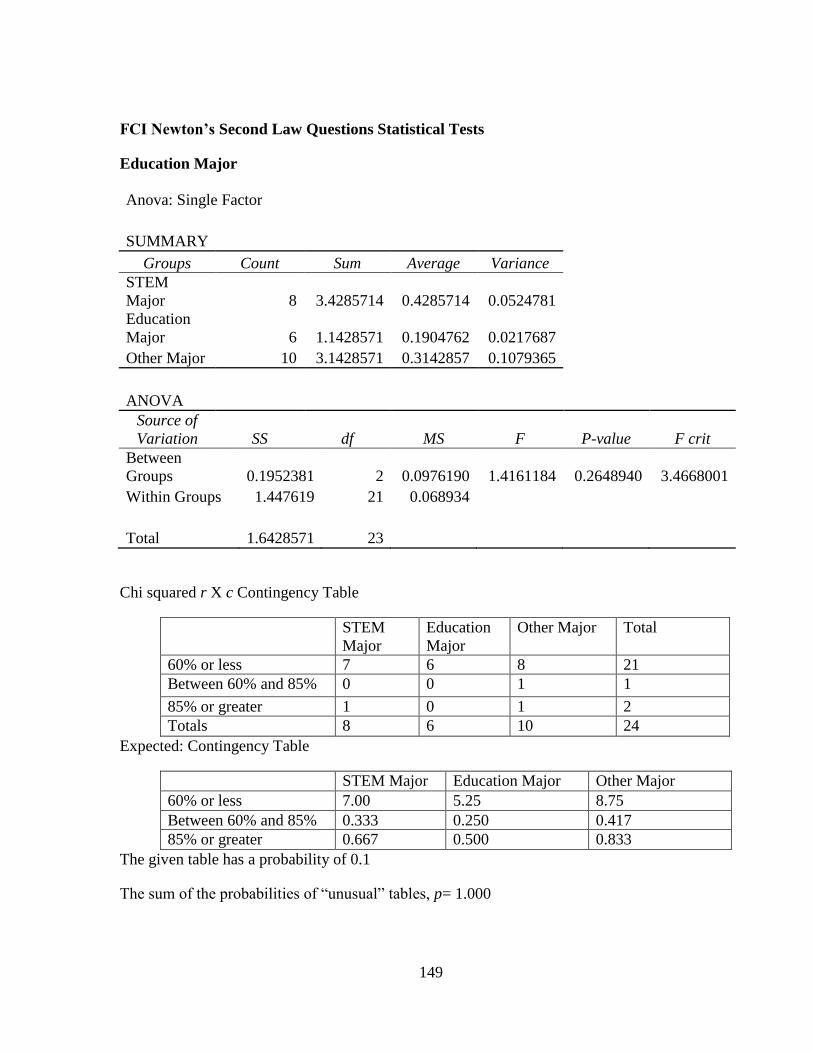
149
FCI Newton’s Second Law Questions Statistical Tests
Education Major
Anova: Single Factor
SUMMARY
Groups Count Sum Average Variance
STEM
Major 8 3.4285714 0.4285714 0.0524781
Education
Major 6 1.1428571 0.1904762 0.0217687
Other Major 10 3.1428571 0.3142857 0.1079365
ANOVA
Source of
Variation SS df MS F P-value F crit
Between
Groups 0.1952381 2 0.0976190 1.4161184 0.2648940 3.4668001
Within Groups 1.447619 21 0.068934
Total 1.6428571 23
Chi squared r X c Contingency Table
STEM
Major
Education
Major
Other Major Total
60% or less 7 6 8 21
Between 60% and 85% 0 0 1 1
85% or greater 1 0 1 2
Totals 8 6 10 24
Expected: Contingency Table
STEM Major Education Major Other Major
60% or less 7.00 5.25 8.75
Between 60% and 85% 0.333 0.250 0.417
85% or greater 0.667 0.500 0.833
The given table has a probability of 0.1
The sum of the probabilities of “unusual” tables, p= 1.000
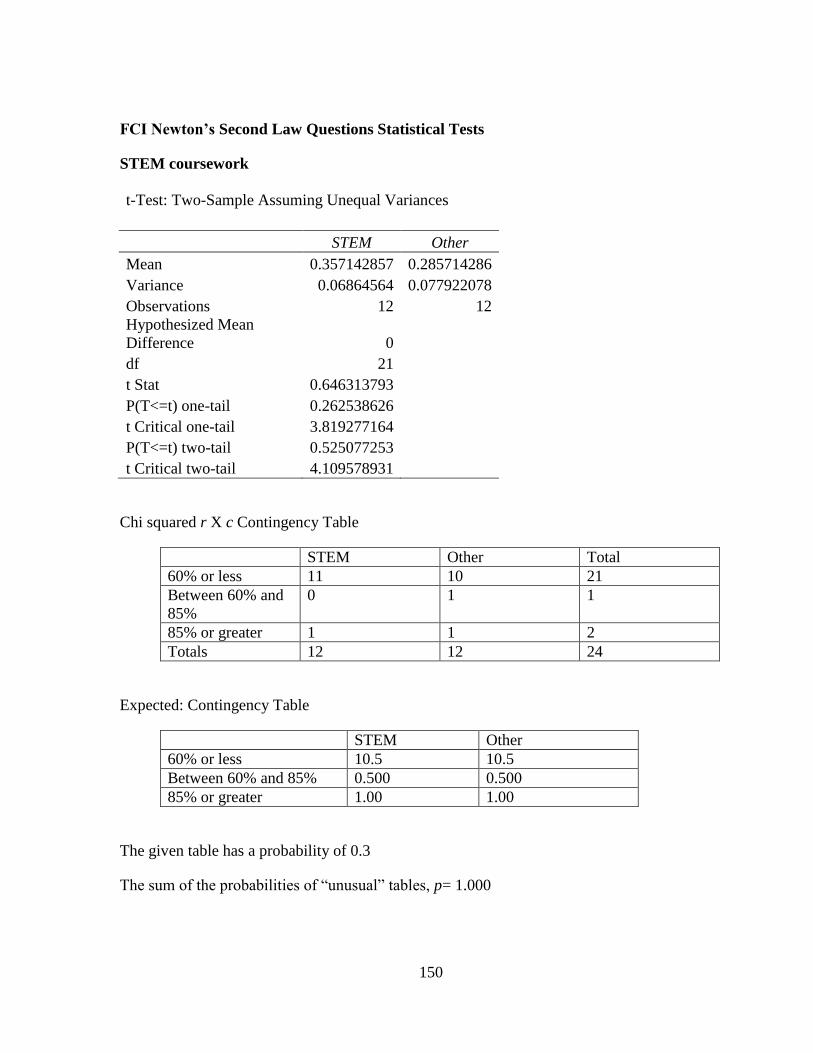
150
FCI Newton’s Second Law Questions Statistical Tests
STEM coursework
t-Test: Two-Sample Assuming Unequal Variances
STEM Other
Mean 0.357142857 0.285714286
Variance 0.06864564 0.077922078
Observations 12 12
Hypothesized Mean
Difference 0
df 21
t Stat 0.646313793
P(T<=t) one-tail 0.262538626
t Critical one-tail 3.819277164
P(T<=t) two-tail 0.525077253
t Critical two-tail 4.109578931
Chi squared r X c Contingency Table
STEM Other Total
60% or less 11 10 21
Between 60% and
85%
0 1 1
85% or greater 1 1 2
Totals 12 12 24
Expected: Contingency Table
STEM Other
60% or less 10.5 10.5
Between 60% and 85% 0.500 0.500
85% or greater 1.00 1.00
The given table has a probability of 0.3
The sum of the probabilities of “unusual” tables, p= 1.000
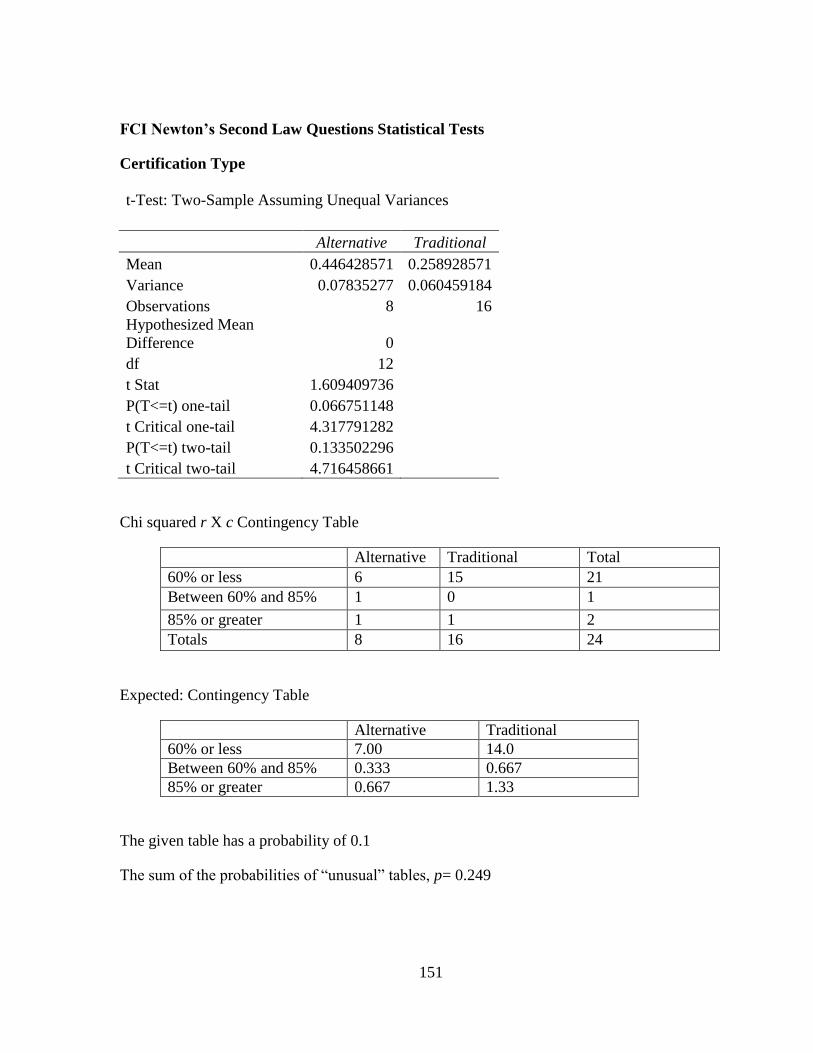
151
FCI Newton’s Second Law Questions Statistical Tests
Certification Type
t-Test: Two-Sample Assuming Unequal Variances
Alternative Traditional
Mean 0.446428571 0.258928571
Variance 0.07835277 0.060459184
Observations 8 16
Hypothesized Mean
Difference 0
df 12
t Stat 1.609409736
P(T<=t) one-tail 0.066751148
t Critical one-tail 4.317791282
P(T<=t) two-tail 0.133502296
t Critical two-tail 4.716458661
Chi squared r X c Contingency Table
Alternative Traditional Total
60% or less 6 15 21
Between 60% and 85% 1 0 1
85% or greater 1 1 2
Totals 8 16 24
Expected: Contingency Table
Alternative Traditional
60% or less 7.00 14.0
Between 60% and 85% 0.333 0.667
85% or greater 0.667 1.33
The given table has a probability of 0.1
The sum of the probabilities of “unusual” tables, p= 0.249
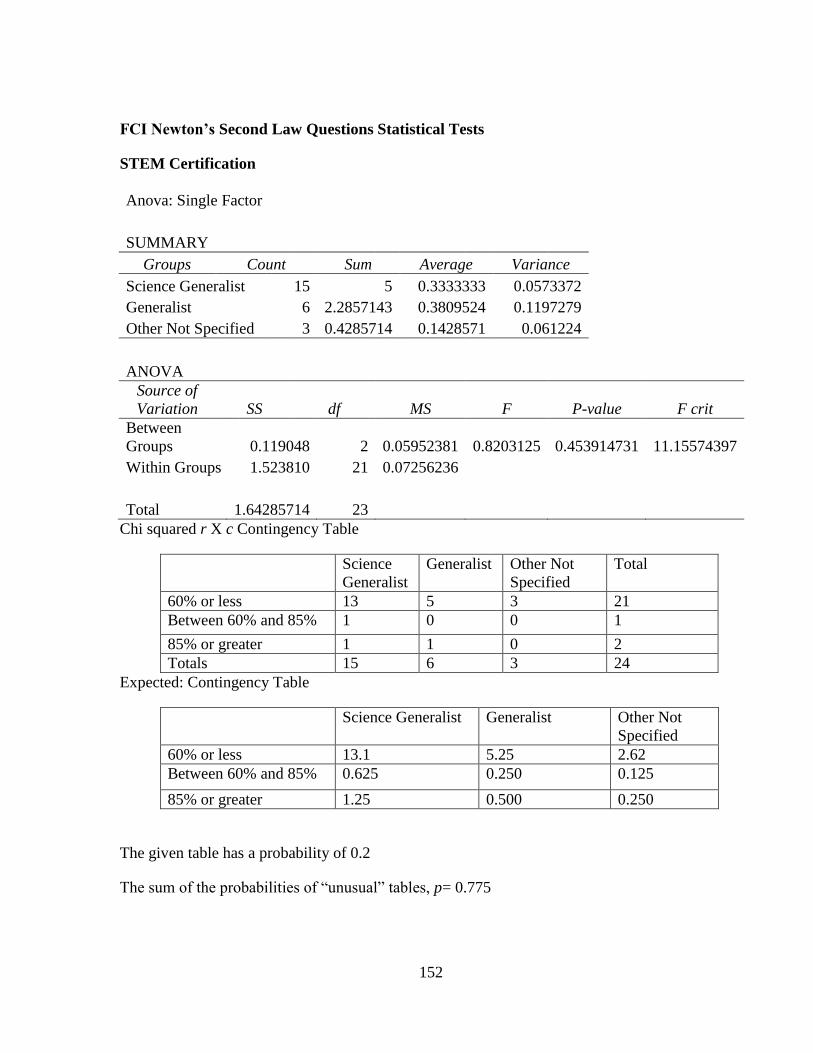
152
FCI Newton’s Second Law Questions Statistical Tests
STEM Certification
Anova: Single Factor
SUMMARY
Groups Count Sum Average Variance
Science Generalist 15 5 0.3333333 0.0573372
Generalist 6 2.2857143 0.3809524 0.1197279
Other Not Specified 3 0.4285714 0.1428571 0.061224
ANOVA
Source of
Variation SS df MS F P-value F crit
Between
Groups 0.119048 2 0.05952381 0.8203125 0.453914731 11.15574397
Within Groups 1.523810 21 0.07256236
Total 1.64285714 23
Chi squared r X c Contingency Table
Science
Generalist
Generalist Other Not
Specified
Total
60% or less 13 5 3 21
Between 60% and 85% 1 0 0 1
85% or greater 1 1 0 2
Totals 15 6 3 24
Expected: Contingency Table
Science Generalist Generalist Other Not
Specified
60% or less 13.1 5.25 2.62
Between 60% and 85% 0.625 0.250 0.125
85% or greater 1.25 0.500 0.250
The given table has a probability of 0.2
The sum of the probabilities of “unusual” tables, p= 0.775
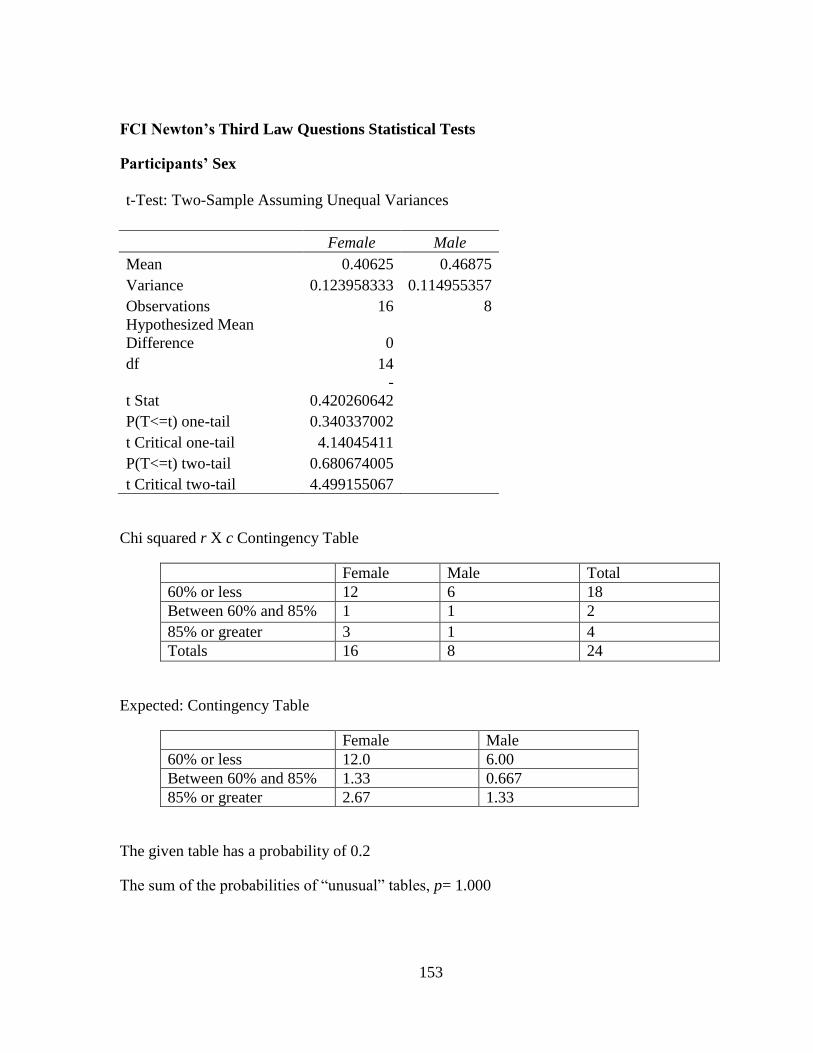
153
FCI Newton’s Third Law Questions Statistical Tests
Participants’ Sex
t-Test: Two-Sample Assuming Unequal Variances
Female Male
Mean 0.40625 0.46875
Variance 0.123958333 0.114955357
Observations 16 8
Hypothesized Mean
Difference 0
df 14
t Stat
-
0.420260642
P(T<=t) one-tail 0.340337002
t Critical one-tail 4.14045411
P(T<=t) two-tail 0.680674005
t Critical two-tail 4.499155067
Chi squared r X c Contingency Table
Female Male Total
60% or less 12 6 18
Between 60% and 85% 1 1 2
85% or greater 3 1 4
Totals 16 8 24
Expected: Contingency Table
Female Male
60% or less 12.0 6.00
Between 60% and 85% 1.33 0.667
85% or greater 2.67 1.33
The given table has a probability of 0.2
The sum of the probabilities of “unusual” tables, p= 1.000
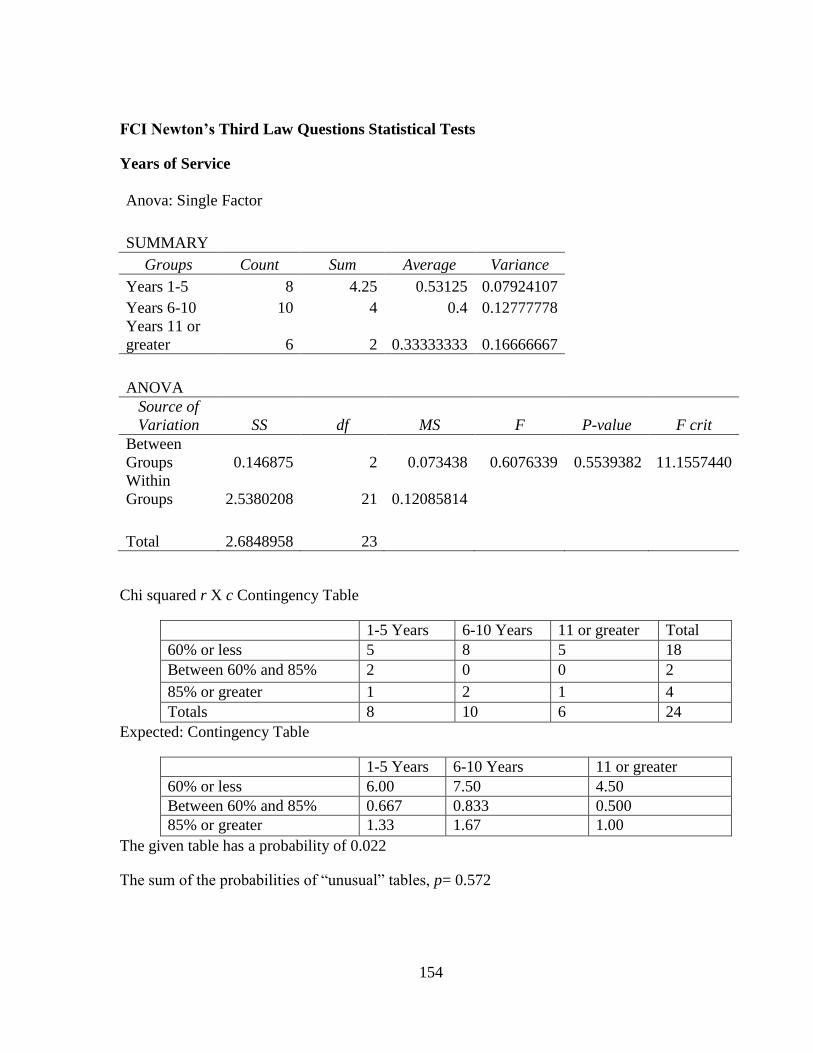
154
FCI Newton’s Third Law Questions Statistical Tests
Years of Service
Anova: Single Factor
SUMMARY
Groups Count Sum Average Variance
Years 1-5 8 4.25 0.53125 0.07924107
Years 6-10 10 4 0.4 0.12777778
Years 11 or
greater 6 2 0.33333333 0.16666667
ANOVA
Source of
Variation SS df MS F P-value F crit
Between
Groups 0.146875 2 0.073438 0.6076339 0.5539382 11.1557440
Within
Groups 2.5380208 21 0.12085814
Total 2.6848958 23
Chi squared r X c Contingency Table
1-5 Years 6-10 Years 11 or greater Total
60% or less 5 8 5 18
Between 60% and 85% 2 0 0 2
85% or greater 1 2 1 4
Totals 8 10 6 24
Expected: Contingency Table
1-5 Years 6-10 Years 11 or greater
60% or less 6.00 7.50 4.50
Between 60% and 85% 0.667 0.833 0.500
85% or greater 1.33 1.67 1.00
The given table has a probability of 0.022
The sum of the probabilities of “unusual” tables, p= 0.572
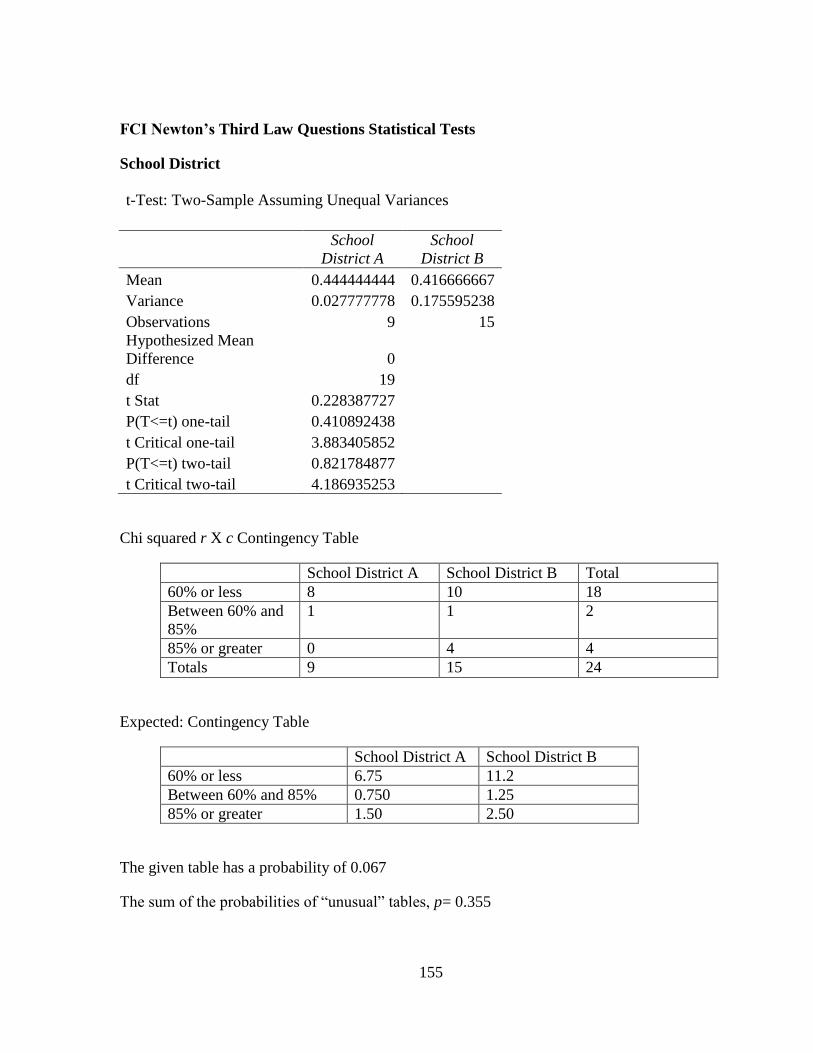
155
FCI Newton’s Third Law Questions Statistical Tests
School District
t-Test: Two-Sample Assuming Unequal Variances
School
District A
School
District B
Mean 0.444444444 0.416666667
Variance 0.027777778 0.175595238
Observations 9 15
Hypothesized Mean
Difference 0
df 19
t Stat 0.228387727
P(T<=t) one-tail 0.410892438
t Critical one-tail 3.883405852
P(T<=t) two-tail 0.821784877
t Critical two-tail 4.186935253
Chi squared r X c Contingency Table
School District A School District B Total
60% or less 8 10 18
Between 60% and
85%
1 1 2
85% or greater 0 4 4
Totals 9 15 24
Expected: Contingency Table
School District A School District B
60% or less 6.75 11.2
Between 60% and 85% 0.750 1.25
85% or greater 1.50 2.50
The given table has a probability of 0.067
The sum of the probabilities of “unusual” tables, p= 0.355
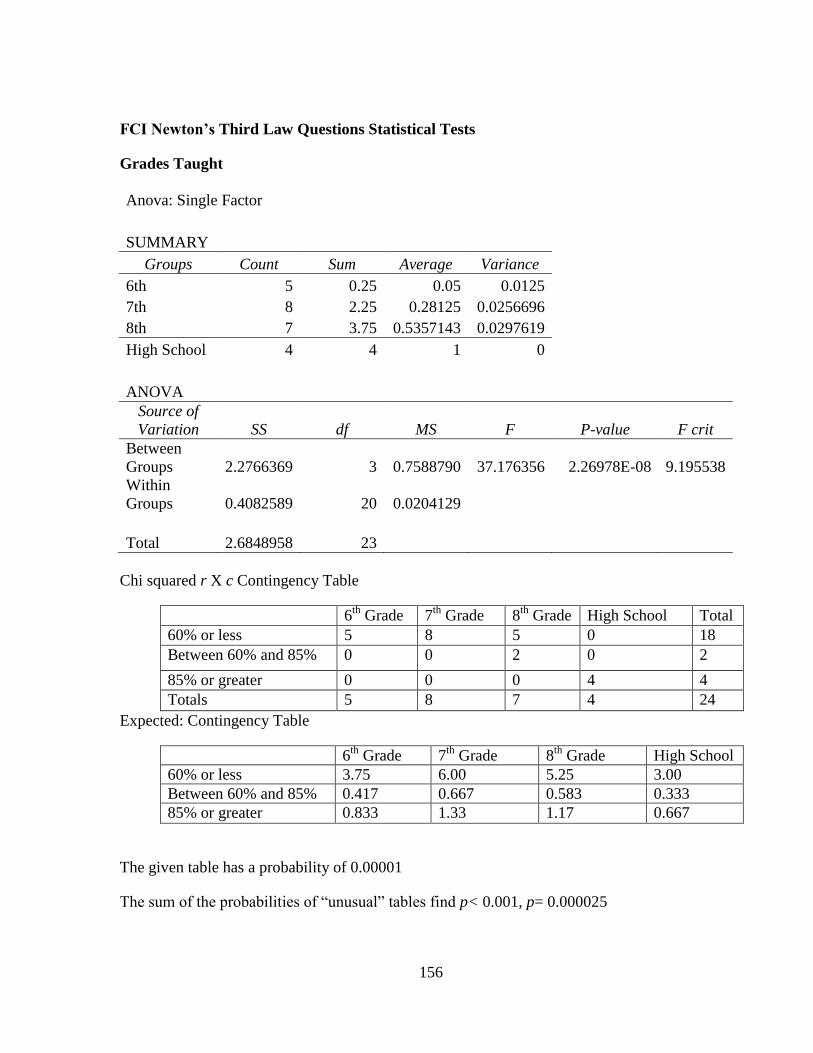
156
FCI Newton’s Third Law Questions Statistical Tests
Grades Taught
Anova: Single Factor
SUMMARY
Groups Count Sum Average Variance
6th 5 0.25 0.05 0.0125
7th 8 2.25 0.28125 0.0256696
8th 7 3.75 0.5357143 0.0297619
High School 4 4 1 0
ANOVA
Source of
Variation SS df MS F P-value F crit
Between
Groups 2.2766369 3 0.7588790 37.176356 2.26978E-08 9.195538
Within
Groups 0.4082589 20 0.0204129
Total 2.6848958 23
Chi squared r X c Contingency Table
6th
Grade 7th
Grade 8th
Grade High School Total
60% or less 5 8 5 0 18
Between 60% and 85% 0 0 2 0 2
85% or greater 0 0 0 4 4
Totals 5 8 7 4 24
Expected: Contingency Table
6th
Grade 7th
Grade 8th
Grade High School
60% or less 3.75 6.00 5.25 3.00
Between 60% and 85% 0.417 0.667 0.583 0.333
85% or greater 0.833 1.33 1.17 0.667
The given table has a probability of 0.00001
The sum of the probabilities of “unusual” tables find p< 0.001, p= 0.000025
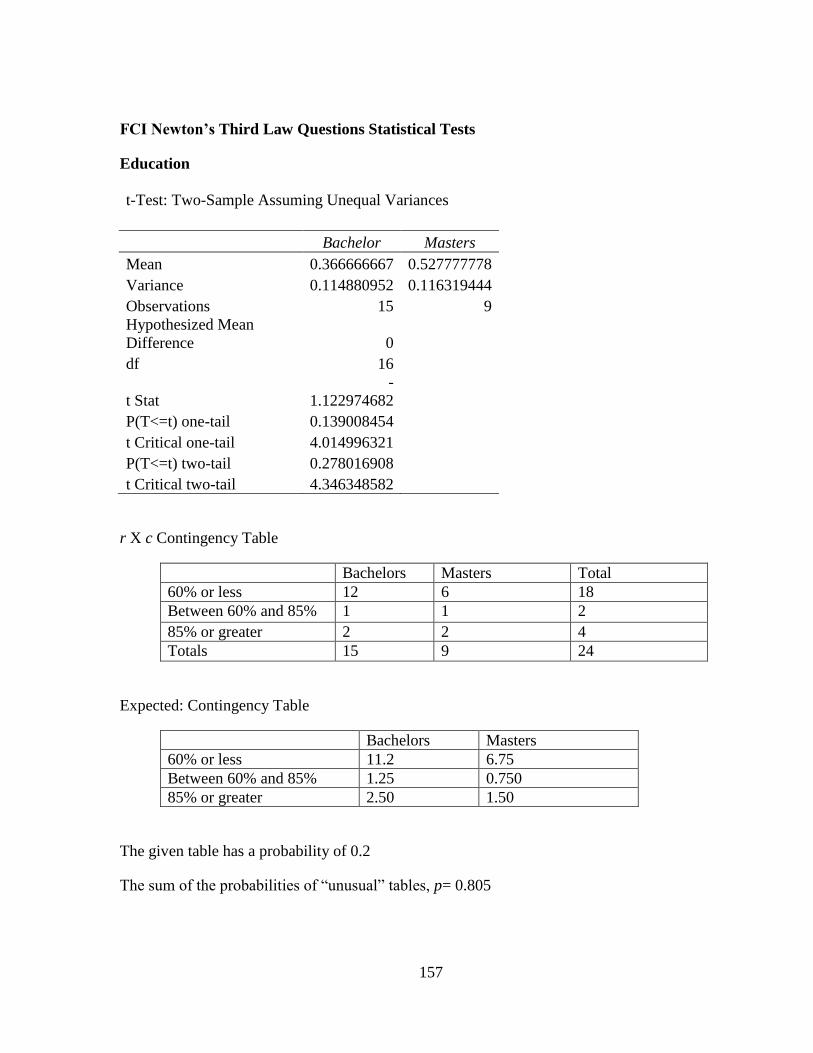
157
FCI Newton’s Third Law Questions Statistical Tests
Education
t-Test: Two-Sample Assuming Unequal Variances
Bachelor Masters
Mean 0.366666667 0.527777778
Variance 0.114880952 0.116319444
Observations 15 9
Hypothesized Mean
Difference 0
df 16
t Stat
-
1.122974682
P(T<=t) one-tail 0.139008454
t Critical one-tail 4.014996321
P(T<=t) two-tail 0.278016908
t Critical two-tail 4.346348582
r X c Contingency Table
Bachelors Masters Total
60% or less 12 6 18
Between 60% and 85% 1 1 2
85% or greater 2 2 4
Totals 15 9 24
Expected: Contingency Table
Bachelors Masters
60% or less 11.2 6.75
Between 60% and 85% 1.25 0.750
85% or greater 2.50 1.50
The given table has a probability of 0.2
The sum of the probabilities of “unusual” tables, p= 0.805
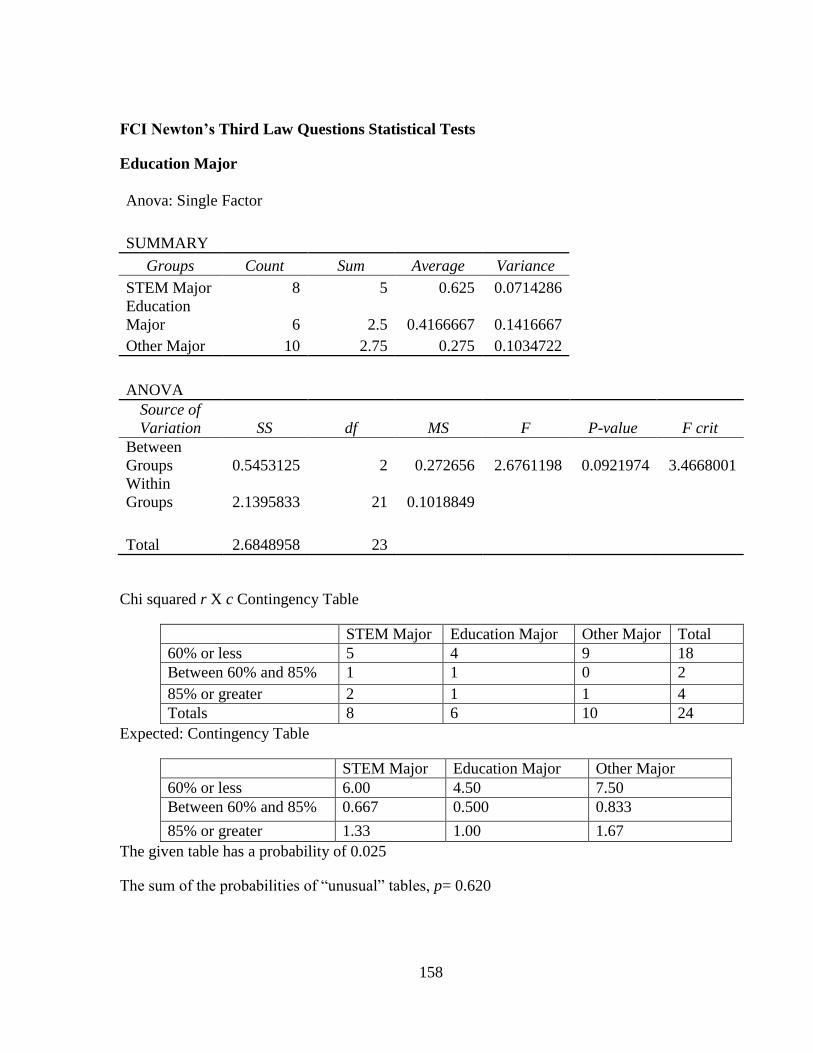
158
FCI Newton’s Third Law Questions Statistical Tests
Education Major
Anova: Single Factor
SUMMARY
Groups Count Sum Average Variance
STEM Major 8 5 0.625 0.0714286
Education
Major 6 2.5 0.4166667 0.1416667
Other Major 10 2.75 0.275 0.1034722
ANOVA
Source of
Variation SS df MS F P-value F crit
Between
Groups 0.5453125 2 0.272656 2.6761198 0.0921974 3.4668001
Within
Groups 2.1395833 21 0.1018849
Total 2.6848958 23
Chi squared r X c Contingency Table
STEM Major Education Major Other Major Total
60% or less 5 4 9 18
Between 60% and 85% 1 1 0 2
85% or greater 2 1 1 4
Totals 8 6 10 24
Expected: Contingency Table
STEM Major Education Major Other Major
60% or less 6.00 4.50 7.50
Between 60% and 85% 0.667 0.500 0.833
85% or greater 1.33 1.00 1.67
The given table has a probability of 0.025
The sum of the probabilities of “unusual” tables, p= 0.620
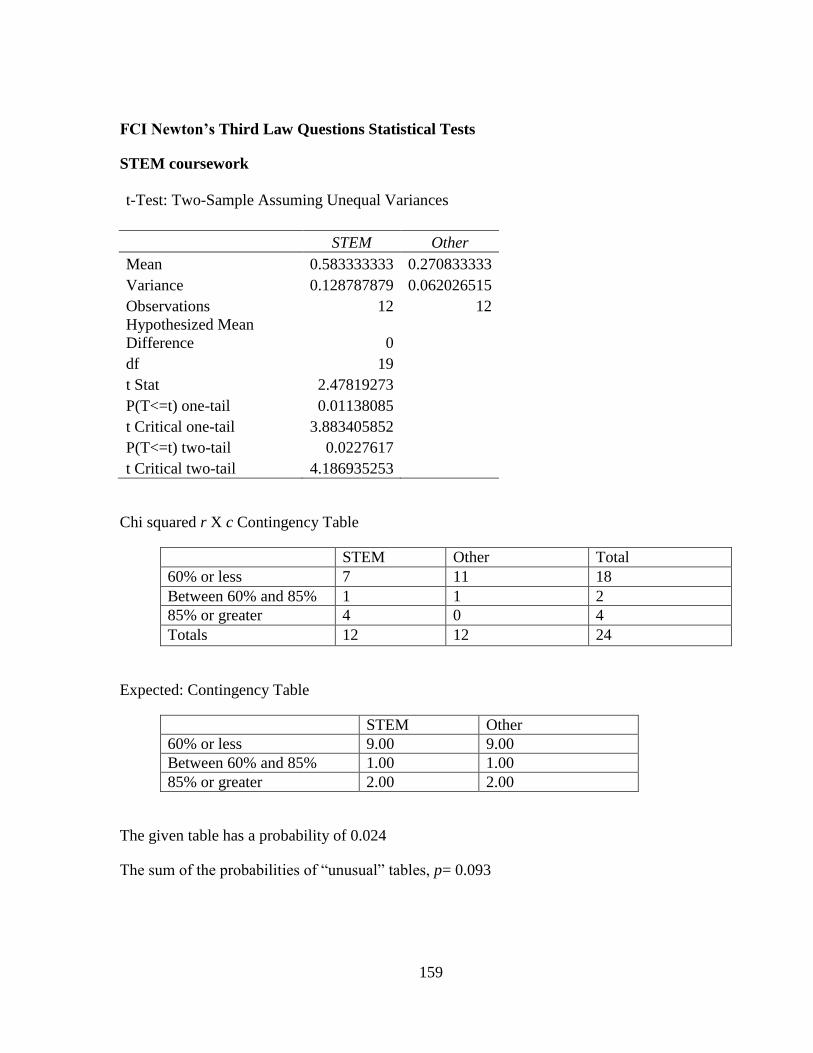
159
FCI Newton’s Third Law Questions Statistical Tests
STEM coursework
t-Test: Two-Sample Assuming Unequal Variances
STEM Other
Mean 0.583333333 0.270833333
Variance 0.128787879 0.062026515
Observations 12 12
Hypothesized Mean
Difference 0
df 19
t Stat 2.47819273
P(T<=t) one-tail 0.01138085
t Critical one-tail 3.883405852
P(T<=t) two-tail 0.0227617
t Critical two-tail 4.186935253
Chi squared r X c Contingency Table
STEM Other Total
60% or less 7 11 18
Between 60% and 85% 1 1 2
85% or greater 4 0 4
Totals 12 12 24
Expected: Contingency Table
STEM Other
60% or less 9.00 9.00
Between 60% and 85% 1.00 1.00
85% or greater 2.00 2.00
The given table has a probability of 0.024
The sum of the probabilities of “unusual” tables, p= 0.093
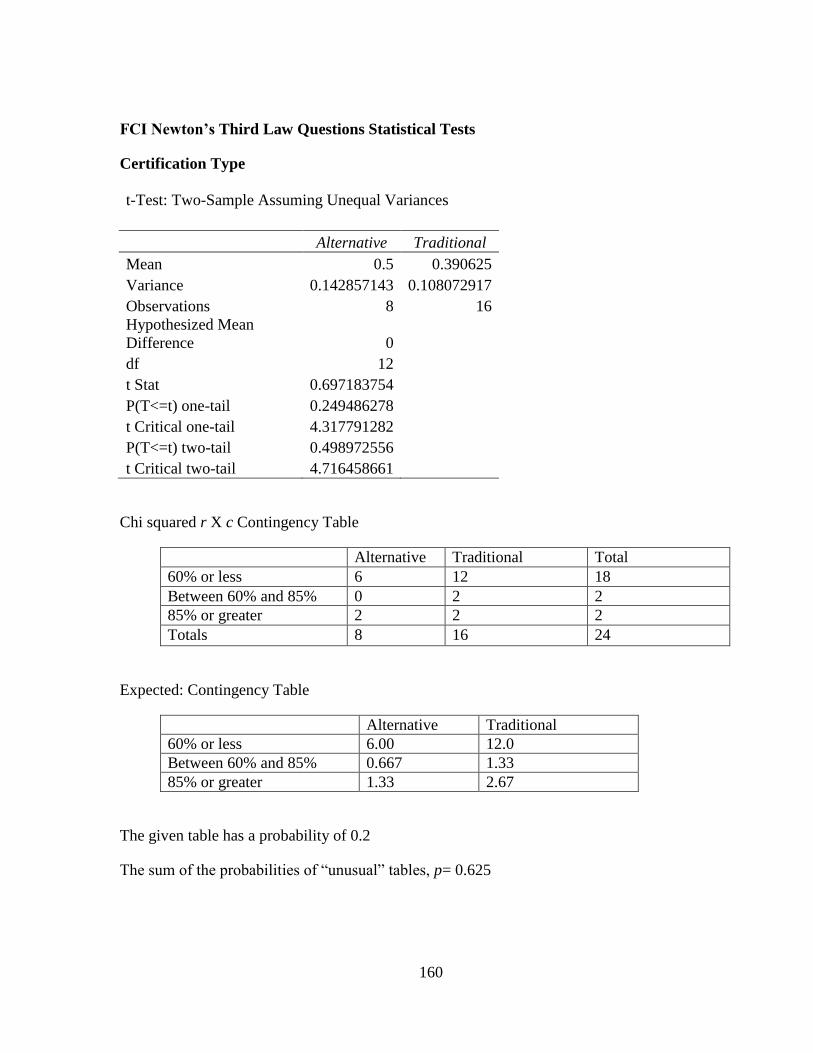
160
FCI Newton’s Third Law Questions Statistical Tests
Certification Type
t-Test: Two-Sample Assuming Unequal Variances
Alternative Traditional
Mean 0.5 0.390625
Variance 0.142857143 0.108072917
Observations 8 16
Hypothesized Mean
Difference 0
df 12
t Stat 0.697183754
P(T<=t) one-tail 0.249486278
t Critical one-tail 4.317791282
P(T<=t) two-tail 0.498972556
t Critical two-tail 4.716458661
Chi squared r X c Contingency Table
Alternative Traditional Total
60% or less 6 12 18
Between 60% and 85% 0 2 2
85% or greater 2 2 2
Totals 8 16 24
Expected: Contingency Table
Alternative Traditional
60% or less 6.00 12.0
Between 60% and 85% 0.667 1.33
85% or greater 1.33 2.67
The given table has a probability of 0.2
The sum of the probabilities of “unusual” tables, p= 0.625
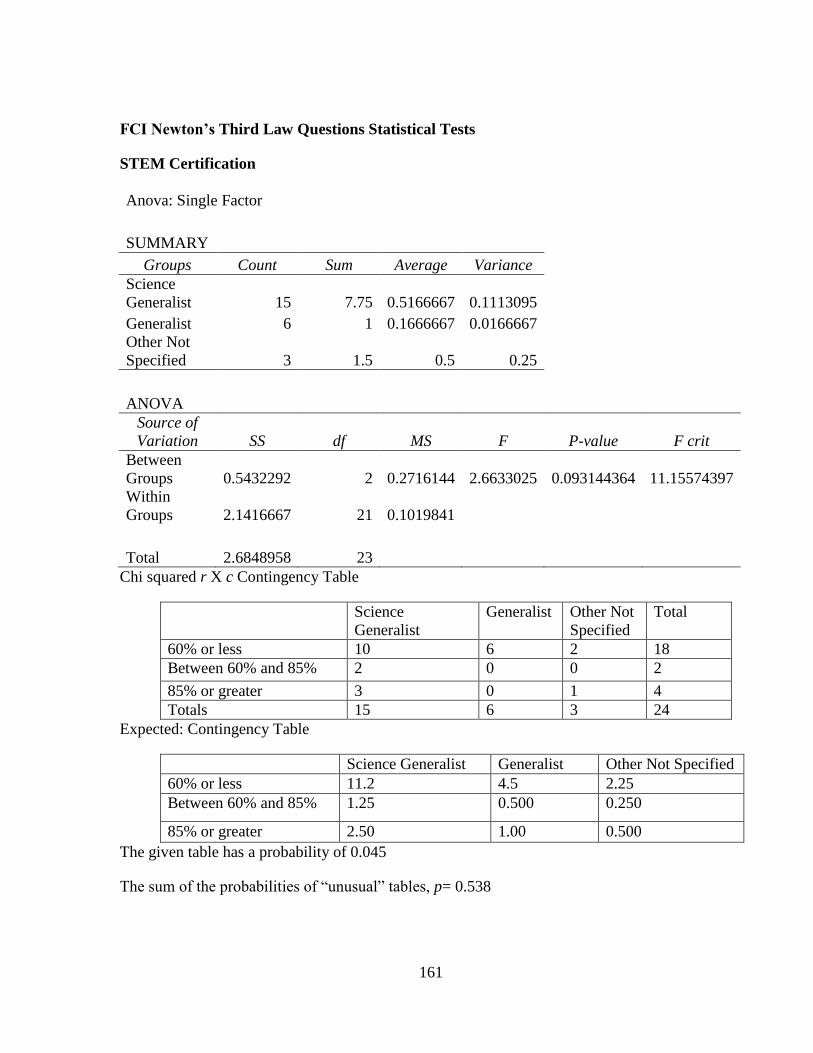
161
FCI Newton’s Third Law Questions Statistical Tests
STEM Certification
Anova: Single Factor
SUMMARY
Groups Count Sum Average Variance
Science
Generalist 15 7.75 0.5166667 0.1113095
Generalist 6 1 0.1666667 0.0166667
Other Not
Specified 3 1.5 0.5 0.25
ANOVA
Source of
Variation SS df MS F P-value F crit
Between
Groups 0.5432292 2 0.2716144 2.6633025 0.093144364 11.15574397
Within
Groups 2.1416667 21 0.1019841
Total 2.6848958 23
Chi squared r X c Contingency Table
Science
Generalist
Generalist Other Not
Specified
Total
60% or less 10 6 2 18
Between 60% and 85% 2 0 0 2
85% or greater 3 0 1 4
Totals 15 6 3 24
Expected: Contingency Table
Science Generalist Generalist Other Not Specified
60% or less 11.2 4.5 2.25
Between 60% and 85% 1.25 0.500 0.250
85% or greater 2.50 1.00 0.500
The given table has a probability of 0.045
The sum of the probabilities of “unusual” tables, p= 0.538
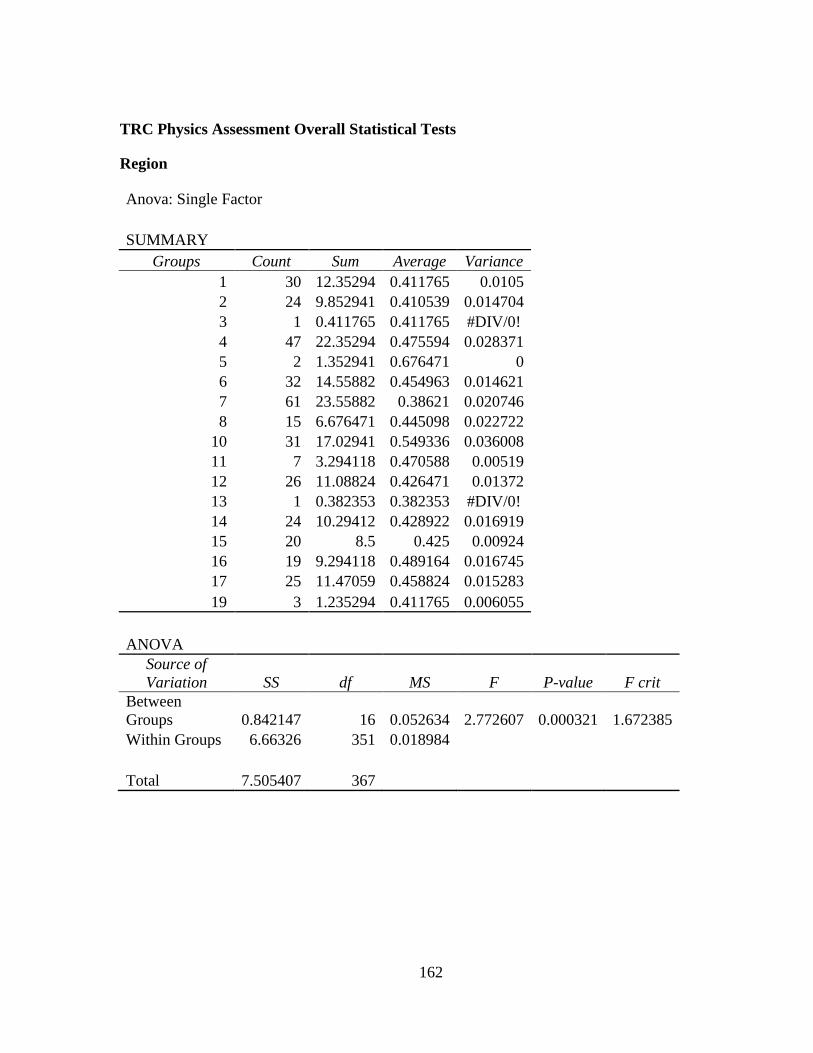
162
TRC Physics Assessment Overall Statistical Tests
Region
Anova: Single Factor
SUMMARY
Groups Count Sum Average Variance
1 30 12.35294 0.411765 0.0105
2 24 9.852941 0.410539 0.014704
3 1 0.411765 0.411765 #DIV/0!
4 47 22.35294 0.475594 0.028371
5 2 1.352941 0.676471 0
6 32 14.55882 0.454963 0.014621
7 61 23.55882 0.38621 0.020746
8 15 6.676471 0.445098 0.022722
10 31 17.02941 0.549336 0.036008
11 7 3.294118 0.470588 0.00519
12 26 11.08824 0.426471 0.01372
13 1 0.382353 0.382353 #DIV/0!
14 24 10.29412 0.428922 0.016919
15 20 8.5 0.425 0.00924
16 19 9.294118 0.489164 0.016745
17 25 11.47059 0.458824 0.015283
19 3 1.235294 0.411765 0.006055
ANOVA
Source of
Variation SS df MS F P-value F crit
Between
Groups 0.842147 16 0.052634 2.772607 0.000321 1.672385
Within Groups 6.66326 351 0.018984
Total 7.505407 367
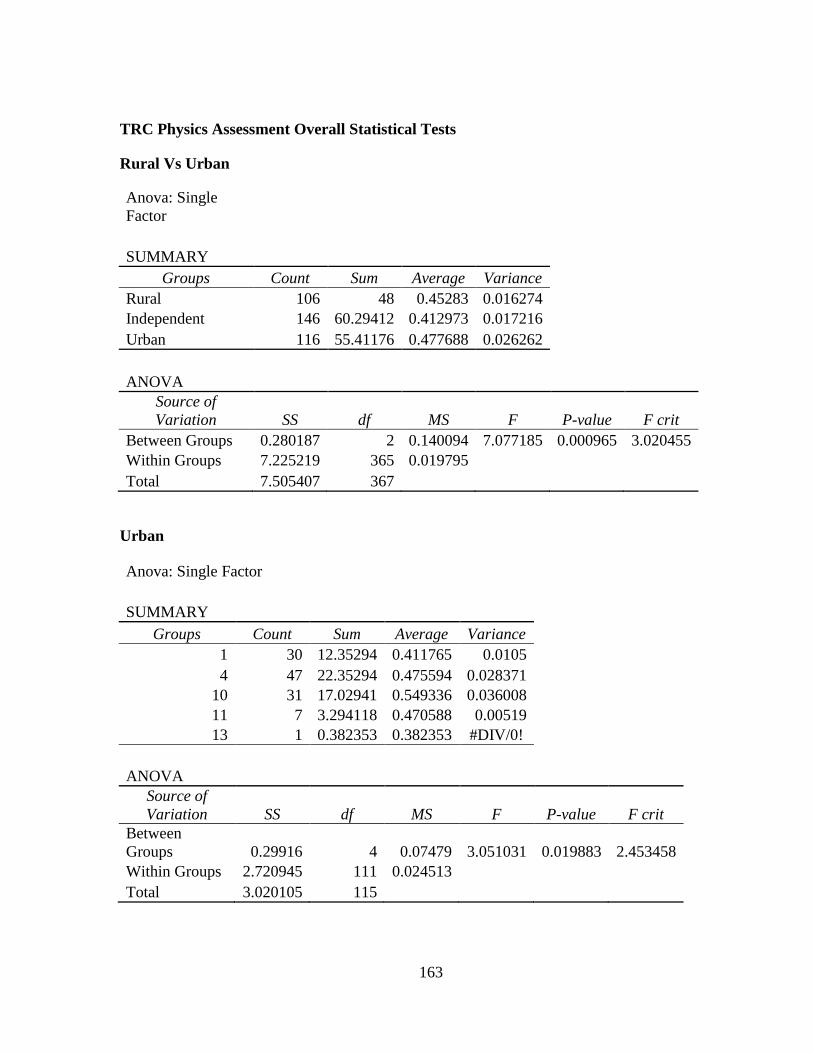
163
TRC Physics Assessment Overall Statistical Tests
Rural Vs Urban
Anova: Single
Factor
SUMMARY
Groups Count Sum Average Variance
Rural 106 48 0.45283 0.016274
Independent 146 60.29412 0.412973 0.017216
Urban 116 55.41176 0.477688 0.026262
ANOVA
Source of
Variation SS df MS F P-value F crit
Between Groups 0.280187 2 0.140094 7.077185 0.000965 3.020455
Within Groups 7.225219 365 0.019795
Total 7.505407 367
Urban
Anova: Single Factor
SUMMARY
Groups Count Sum Average Variance
1 30 12.35294 0.411765 0.0105
4 47 22.35294 0.475594 0.028371
10 31 17.02941 0.549336 0.036008
11 7 3.294118 0.470588 0.00519
13 1 0.382353 0.382353 #DIV/0!
ANOVA
Source of
Variation SS df MS F P-value F crit
Between
Groups 0.29916 4 0.07479 3.051031 0.019883 2.453458
Within Groups 2.720945 111 0.024513
Total 3.020105 115
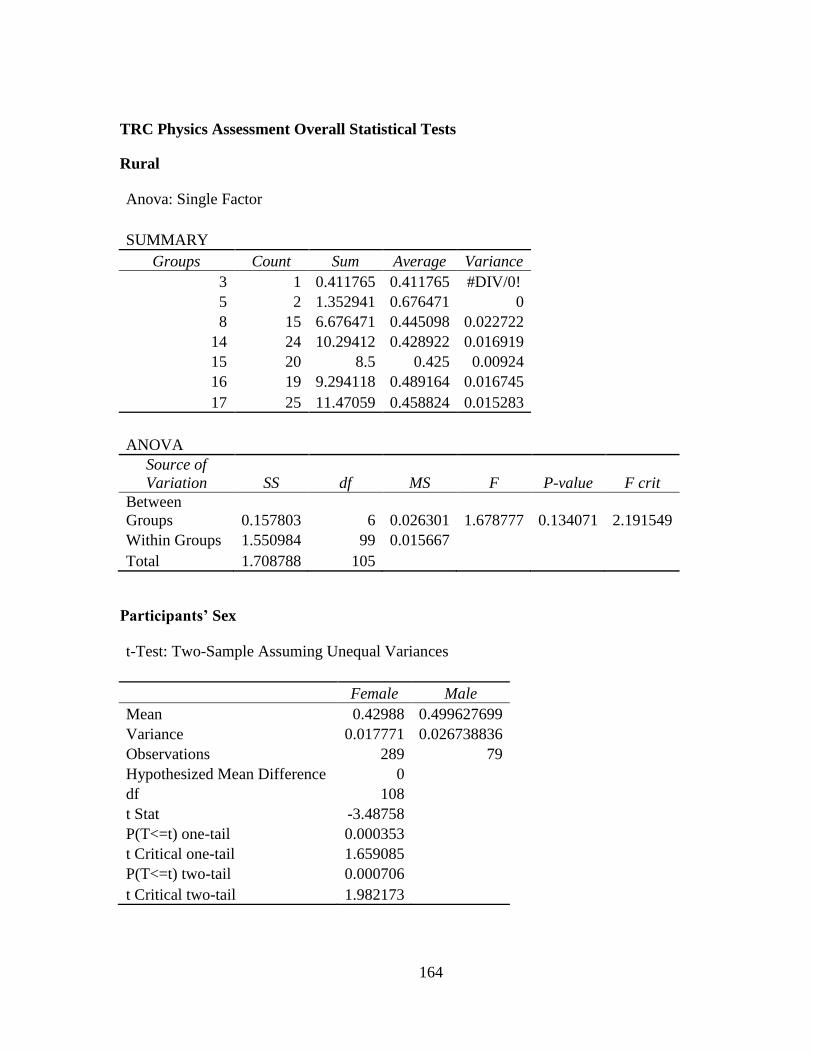
164
TRC Physics Assessment Overall Statistical Tests
Rural
Anova: Single Factor
SUMMARY
Groups Count Sum Average Variance
3 1 0.411765 0.411765 #DIV/0!
5 2 1.352941 0.676471 0
8 15 6.676471 0.445098 0.022722
14 24 10.29412 0.428922 0.016919
15 20 8.5 0.425 0.00924
16 19 9.294118 0.489164 0.016745
17 25 11.47059 0.458824 0.015283
ANOVA
Source of
Variation SS df MS F P-value F crit
Between
Groups 0.157803 6 0.026301 1.678777 0.134071 2.191549
Within Groups 1.550984 99 0.015667
Total 1.708788 105
Participants’ Sex
t-Test: Two-Sample Assuming Unequal Variances
Female Male
Mean 0.42988 0.499627699
Variance 0.017771 0.026738836
Observations 289 79
Hypothesized Mean Difference 0
df 108
t Stat -3.48758
P(T<=t) one-tail 0.000353
t Critical one-tail 1.659085
P(T<=t) two-tail 0.000706
t Critical two-tail 1.982173
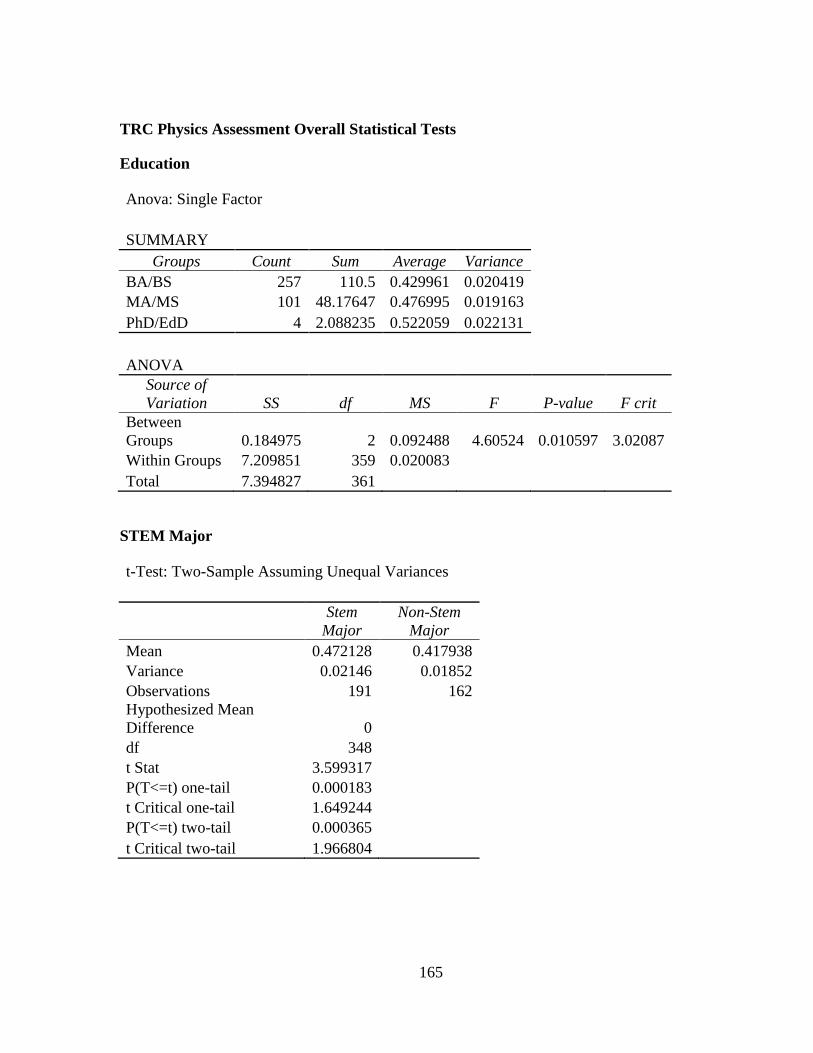
165
TRC Physics Assessment Overall Statistical Tests
Education
Anova: Single Factor
SUMMARY
Groups Count Sum Average Variance
BA/BS 257 110.5 0.429961 0.020419
MA/MS 101 48.17647 0.476995 0.019163
PhD/EdD 4 2.088235 0.522059 0.022131
ANOVA
Source of
Variation SS df MS F P-value F crit
Between
Groups 0.184975 2 0.092488 4.60524 0.010597 3.02087
Within Groups 7.209851 359 0.020083
Total 7.394827 361
STEM Major
t-Test: Two-Sample Assuming Unequal Variances
Stem
Major
Non-Stem
Major
Mean 0.472128 0.417938
Variance 0.02146 0.01852
Observations 191 162
Hypothesized Mean
Difference 0
df 348
t Stat 3.599317
P(T<=t) one-tail 0.000183
t Critical one-tail 1.649244
P(T<=t) two-tail 0.000365
t Critical two-tail 1.966804
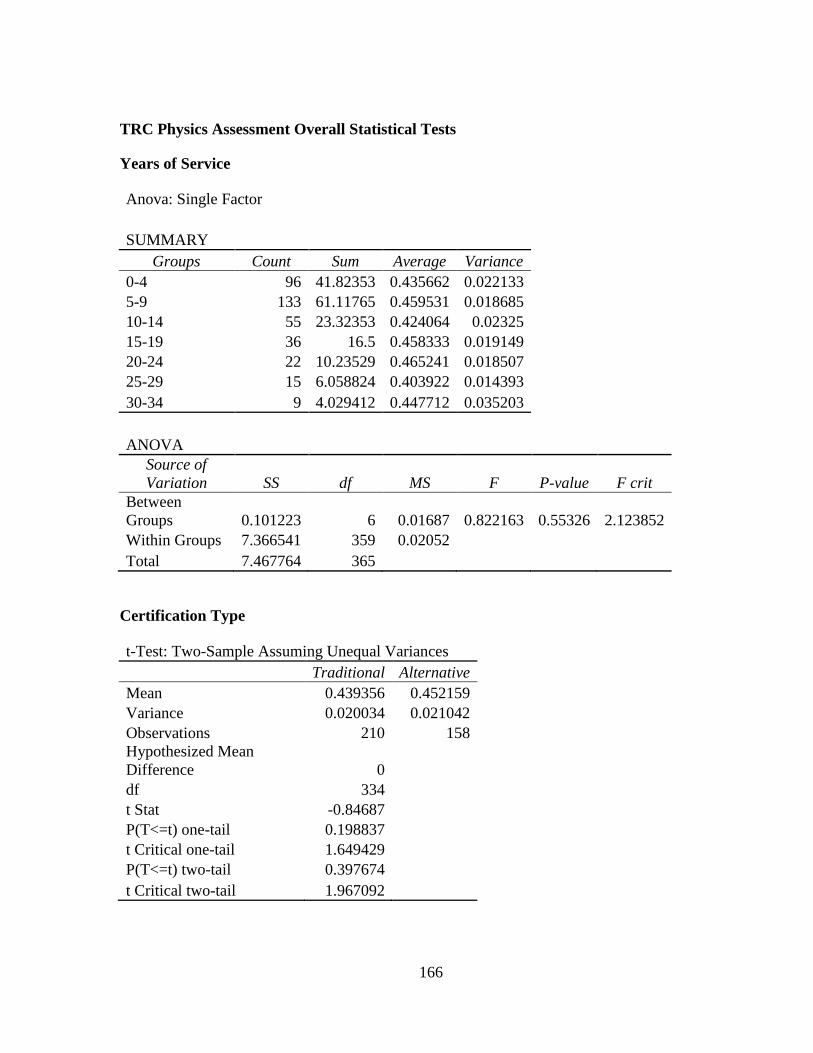
166
TRC Physics Assessment Overall Statistical Tests
Years of Service
Anova: Single Factor
SUMMARY
Groups Count Sum Average Variance
0-4 96 41.82353 0.435662 0.022133
5-9 133 61.11765 0.459531 0.018685
10-14 55 23.32353 0.424064 0.02325
15-19 36 16.5 0.458333 0.019149
20-24 22 10.23529 0.465241 0.018507
25-29 15 6.058824 0.403922 0.014393
30-34 9 4.029412 0.447712 0.035203
ANOVA
Source of
Variation SS df MS F P-value F crit
Between
Groups 0.101223 6 0.01687 0.822163 0.55326 2.123852
Within Groups 7.366541 359 0.02052
Total 7.467764 365
Certification Type
t-Test: Two-Sample Assuming Unequal Variances
Traditional Alternative
Mean 0.439356 0.452159
Variance 0.020034 0.021042
Observations 210 158
Hypothesized Mean
Difference 0
df 334
t Stat -0.84687
P(T<=t) one-tail 0.198837
t Critical one-tail 1.649429
P(T<=t) two-tail 0.397674
t Critical two-tail 1.967092
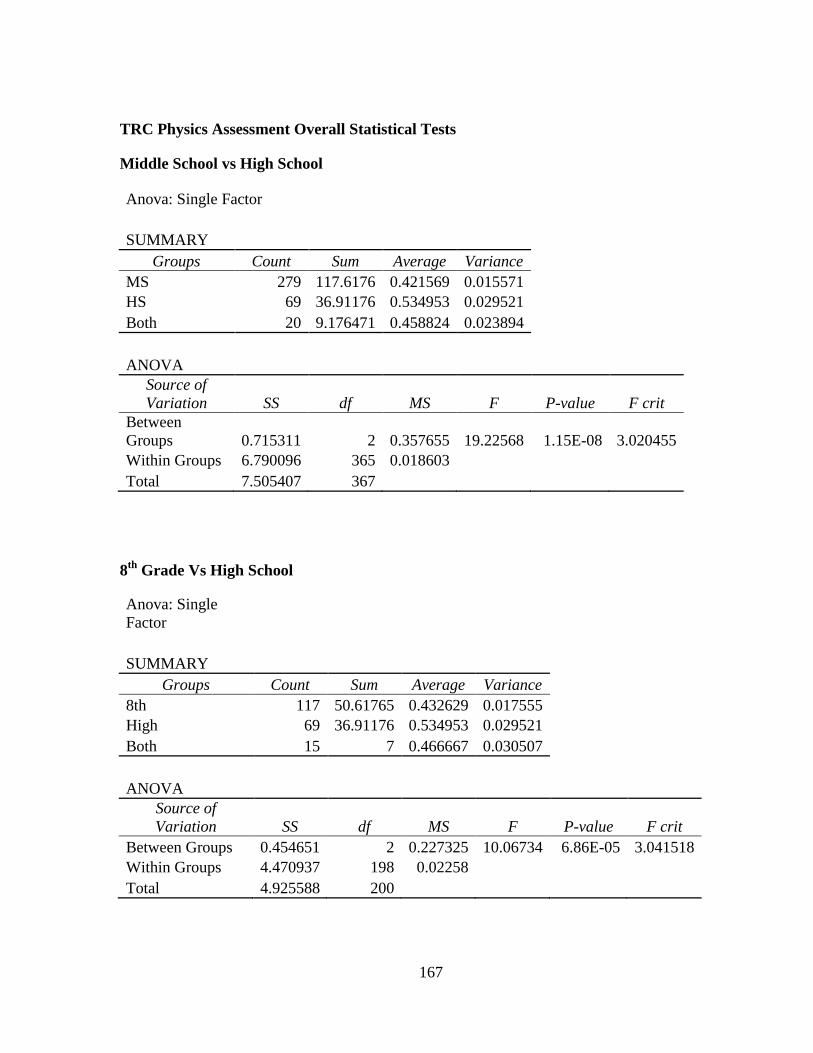
167
TRC Physics Assessment Overall Statistical Tests
Middle School vs High School
Anova: Single Factor
SUMMARY
Groups Count Sum Average Variance
MS 279 117.6176 0.421569 0.015571
HS 69 36.91176 0.534953 0.029521
Both 20 9.176471 0.458824 0.023894
ANOVA
Source of
Variation SS df MS F P-value F crit
Between
Groups 0.715311 2 0.357655 19.22568 1.15E-08 3.020455
Within Groups 6.790096 365 0.018603
Total 7.505407 367
8th
Grade Vs High School
Anova: Single
Factor
SUMMARY
Groups Count Sum Average Variance
8th 117 50.61765 0.432629 0.017555
High 69 36.91176 0.534953 0.029521
Both 15 7 0.466667 0.030507
ANOVA
Source of
Variation SS df MS F P-value F crit
Between Groups 0.454651 2 0.227325 10.06734 6.86E-05 3.041518
Within Groups 4.470937 198 0.02258
Total 4.925588 200
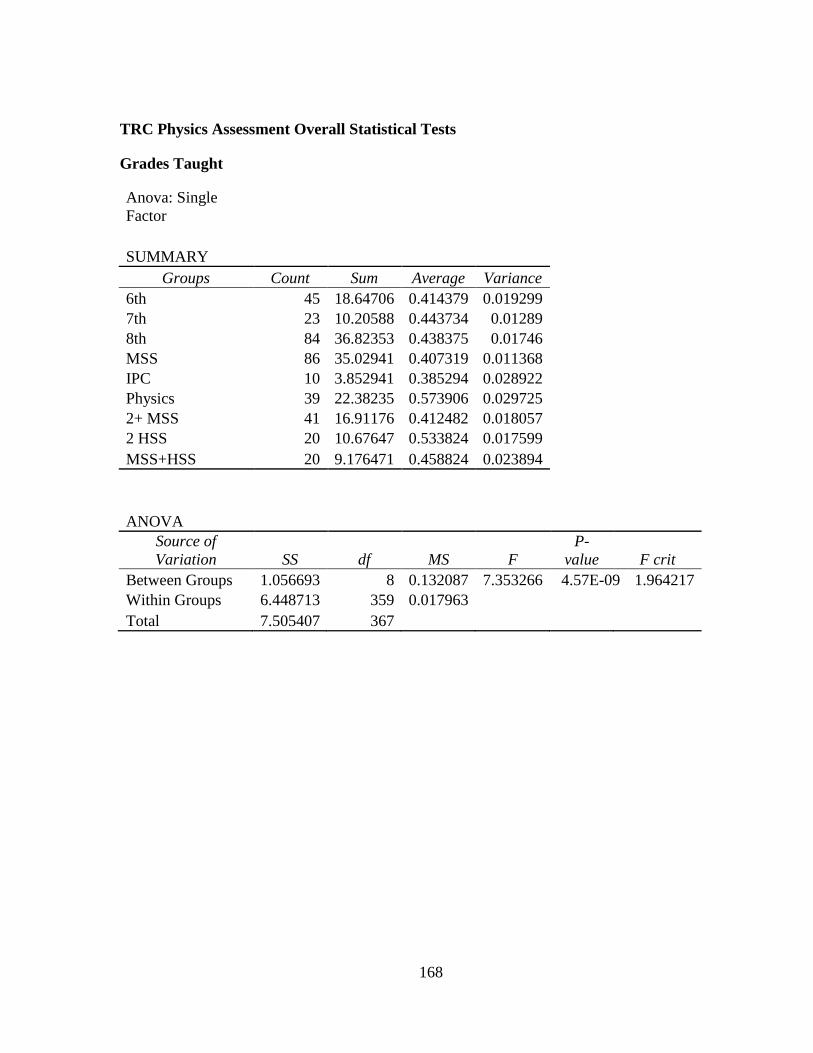
168
TRC Physics Assessment Overall Statistical Tests
Grades Taught
Anova: Single
Factor
SUMMARY
Groups Count Sum Average Variance
6th 45 18.64706 0.414379 0.019299
7th 23 10.20588 0.443734 0.01289
8th 84 36.82353 0.438375 0.01746
MSS 86 35.02941 0.407319 0.011368
IPC 10 3.852941 0.385294 0.028922
Physics 39 22.38235 0.573906 0.029725
2+ MSS 41 16.91176 0.412482 0.018057
2 HSS 20 10.67647 0.533824 0.017599
MSS+HSS 20 9.176471 0.458824 0.023894
ANOVA
Source of
Variation SS df MS F
P-
value F crit
Between Groups 1.056693 8 0.132087 7.353266 4.57E-09 1.964217
Within Groups 6.448713 359 0.017963
Total 7.505407 367
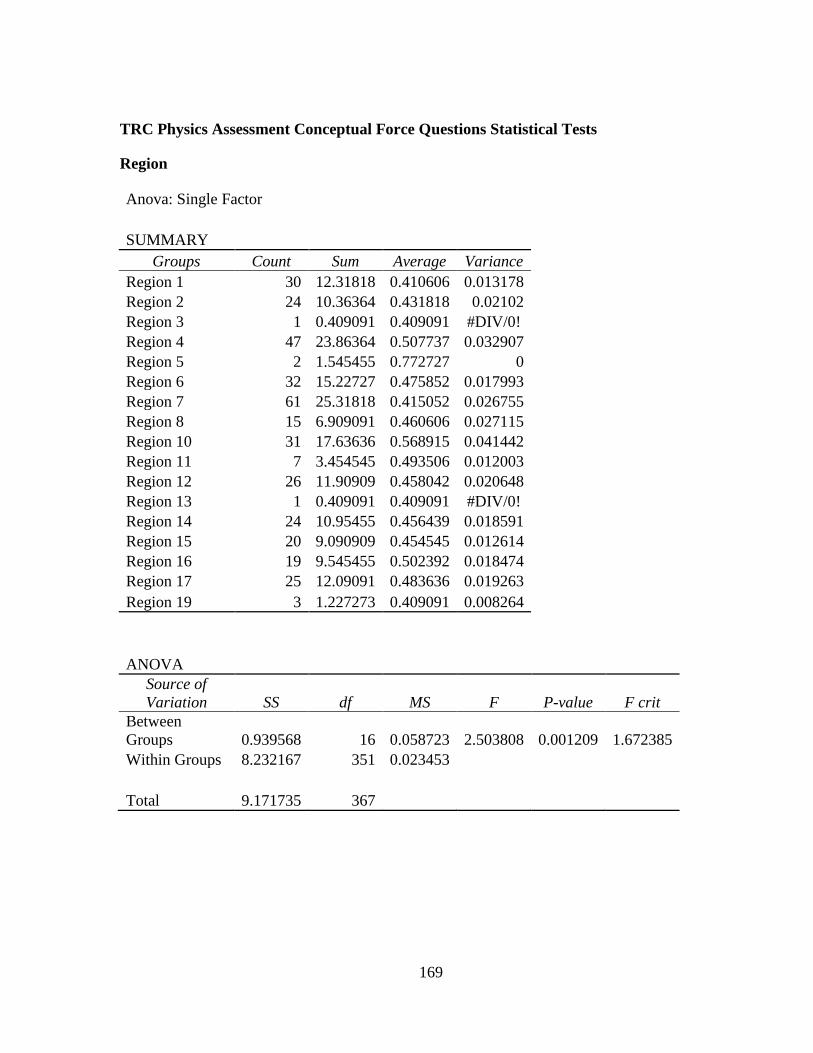
169
TRC Physics Assessment Conceptual Force Questions Statistical Tests
Region
Anova: Single Factor
SUMMARY
Groups Count Sum Average Variance
Region 1 30 12.31818 0.410606 0.013178
Region 2 24 10.36364 0.431818 0.02102
Region 3 1 0.409091 0.409091 #DIV/0!
Region 4 47 23.86364 0.507737 0.032907
Region 5 2 1.545455 0.772727 0
Region 6 32 15.22727 0.475852 0.017993
Region 7 61 25.31818 0.415052 0.026755
Region 8 15 6.909091 0.460606 0.027115
Region 10 31 17.63636 0.568915 0.041442
Region 11 7 3.454545 0.493506 0.012003
Region 12 26 11.90909 0.458042 0.020648
Region 13 1 0.409091 0.409091 #DIV/0!
Region 14 24 10.95455 0.456439 0.018591
Region 15 20 9.090909 0.454545 0.012614
Region 16 19 9.545455 0.502392 0.018474
Region 17 25 12.09091 0.483636 0.019263
Region 19 3 1.227273 0.409091 0.008264
ANOVA
Source of
Variation SS df MS F P-value F crit
Between
Groups 0.939568 16 0.058723 2.503808 0.001209 1.672385
Within Groups 8.232167 351 0.023453
Total 9.171735 367
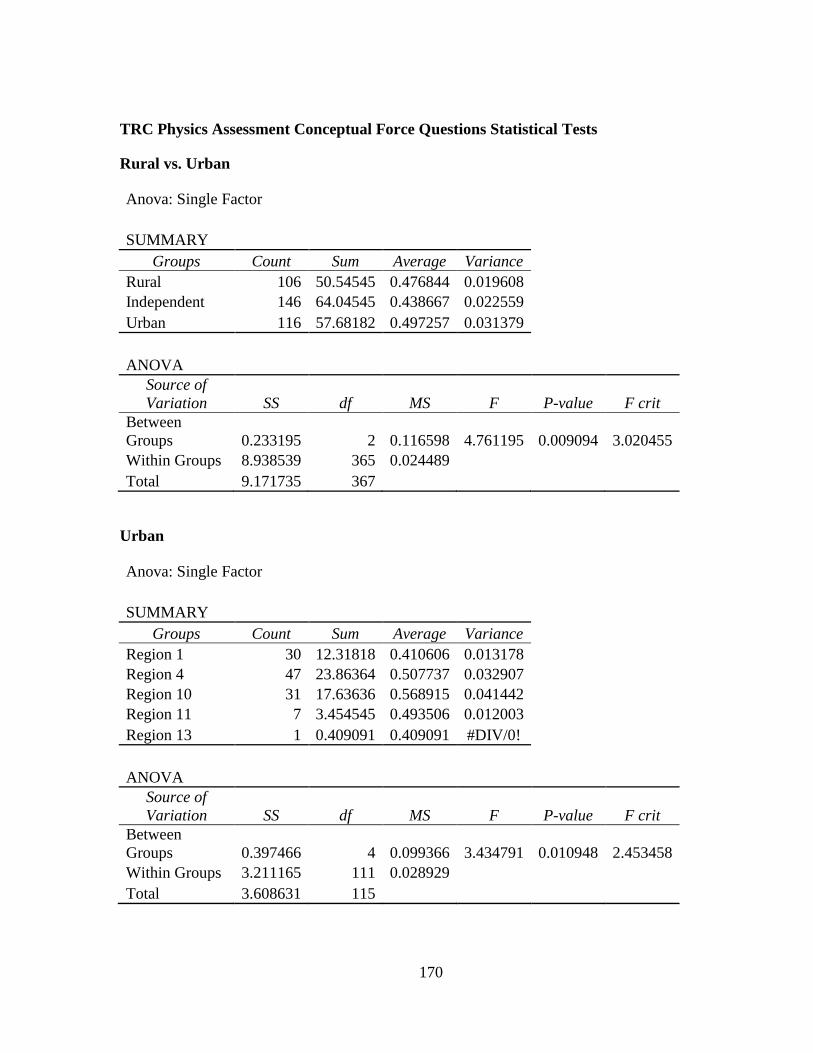
170
TRC Physics Assessment Conceptual Force Questions Statistical Tests
Rural vs. Urban
Anova: Single Factor
SUMMARY
Groups Count Sum Average Variance
Rural 106 50.54545 0.476844 0.019608
Independent 146 64.04545 0.438667 0.022559
Urban 116 57.68182 0.497257 0.031379
ANOVA
Source of
Variation SS df MS F P-value F crit
Between
Groups 0.233195 2 0.116598 4.761195 0.009094 3.020455
Within Groups 8.938539 365 0.024489
Total 9.171735 367
Urban
Anova: Single Factor
SUMMARY
Groups Count Sum Average Variance
Region 1 30 12.31818 0.410606 0.013178
Region 4 47 23.86364 0.507737 0.032907
Region 10 31 17.63636 0.568915 0.041442
Region 11 7 3.454545 0.493506 0.012003
Region 13 1 0.409091 0.409091 #DIV/0!
ANOVA
Source of
Variation SS df MS F P-value F crit
Between
Groups 0.397466 4 0.099366 3.434791 0.010948 2.453458
Within Groups 3.211165 111 0.028929
Total 3.608631 115
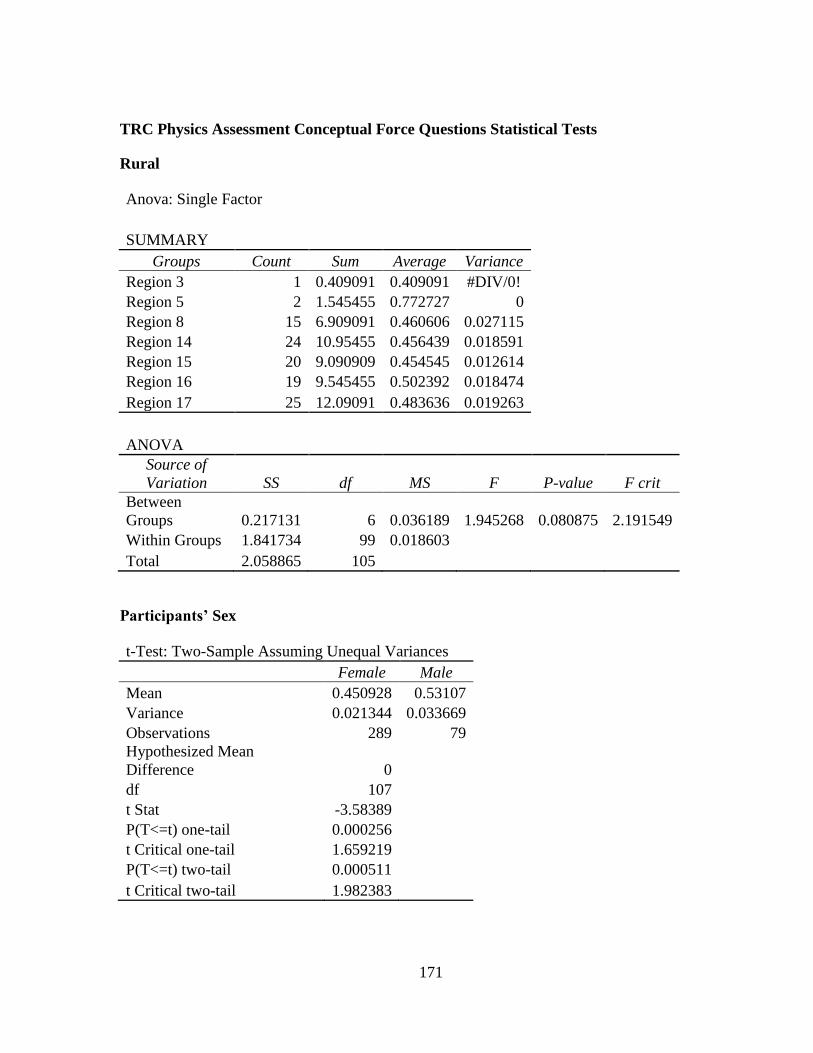
171
TRC Physics Assessment Conceptual Force Questions Statistical Tests
Rural
Anova: Single Factor
SUMMARY
Groups Count Sum Average Variance
Region 3 1 0.409091 0.409091 #DIV/0!
Region 5 2 1.545455 0.772727 0
Region 8 15 6.909091 0.460606 0.027115
Region 14 24 10.95455 0.456439 0.018591
Region 15 20 9.090909 0.454545 0.012614
Region 16 19 9.545455 0.502392 0.018474
Region 17 25 12.09091 0.483636 0.019263
ANOVA
Source of
Variation SS df MS F P-value F crit
Between
Groups 0.217131 6 0.036189 1.945268 0.080875 2.191549
Within Groups 1.841734 99 0.018603
Total 2.058865 105
Participants’ Sex
t-Test: Two-Sample Assuming Unequal Variances
Female Male
Mean 0.450928 0.53107
Variance 0.021344 0.033669
Observations 289 79
Hypothesized Mean
Difference 0
df 107
t Stat -3.58389
P(T<=t) one-tail 0.000256
t Critical one-tail 1.659219
P(T<=t) two-tail 0.000511
t Critical two-tail 1.982383
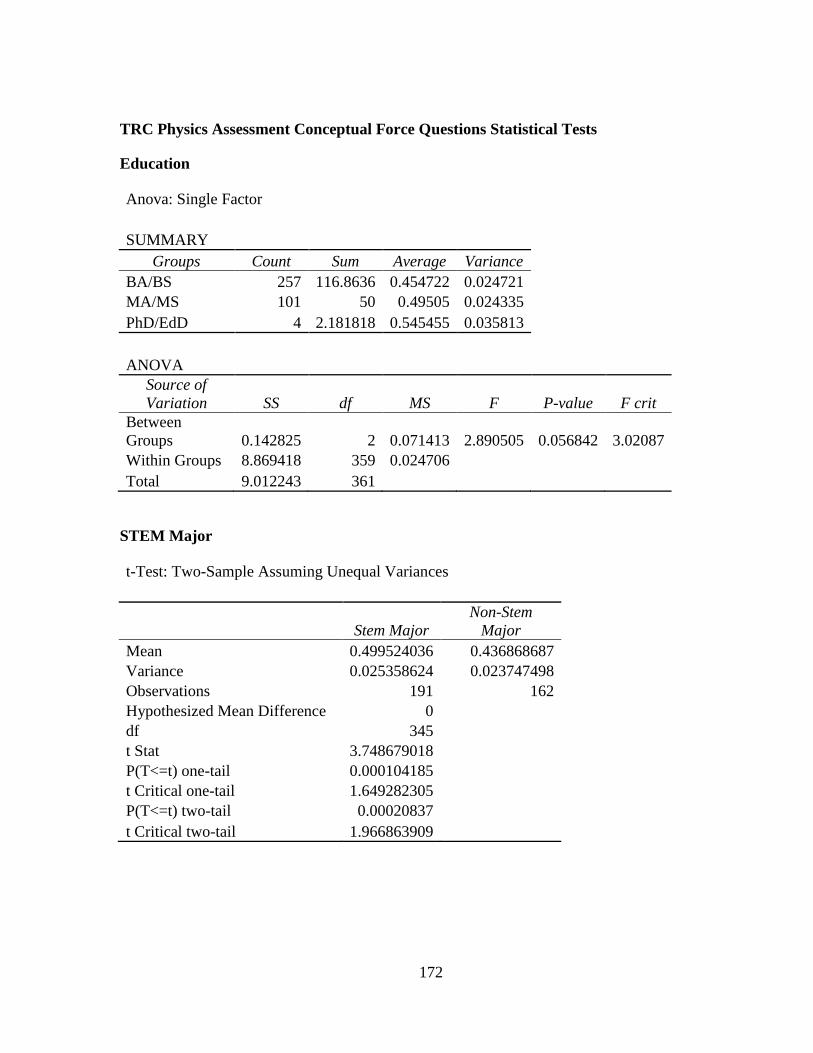
172
TRC Physics Assessment Conceptual Force Questions Statistical Tests
Education
Anova: Single Factor
SUMMARY
Groups Count Sum Average Variance
BA/BS 257 116.8636 0.454722 0.024721
MA/MS 101 50 0.49505 0.024335
PhD/EdD 4 2.181818 0.545455 0.035813
ANOVA
Source of
Variation SS df MS F P-value F crit
Between
Groups 0.142825 2 0.071413 2.890505 0.056842 3.02087
Within Groups 8.869418 359 0.024706
Total 9.012243 361
STEM Major
t-Test: Two-Sample Assuming Unequal Variances
Stem Major
Non-Stem
Major
Mean 0.499524036 0.436868687
Variance 0.025358624 0.023747498
Observations 191 162
Hypothesized Mean Difference 0
df 345
t Stat 3.748679018
P(T<=t) one-tail 0.000104185
t Critical one-tail 1.649282305
P(T<=t) two-tail 0.00020837
t Critical two-tail 1.966863909
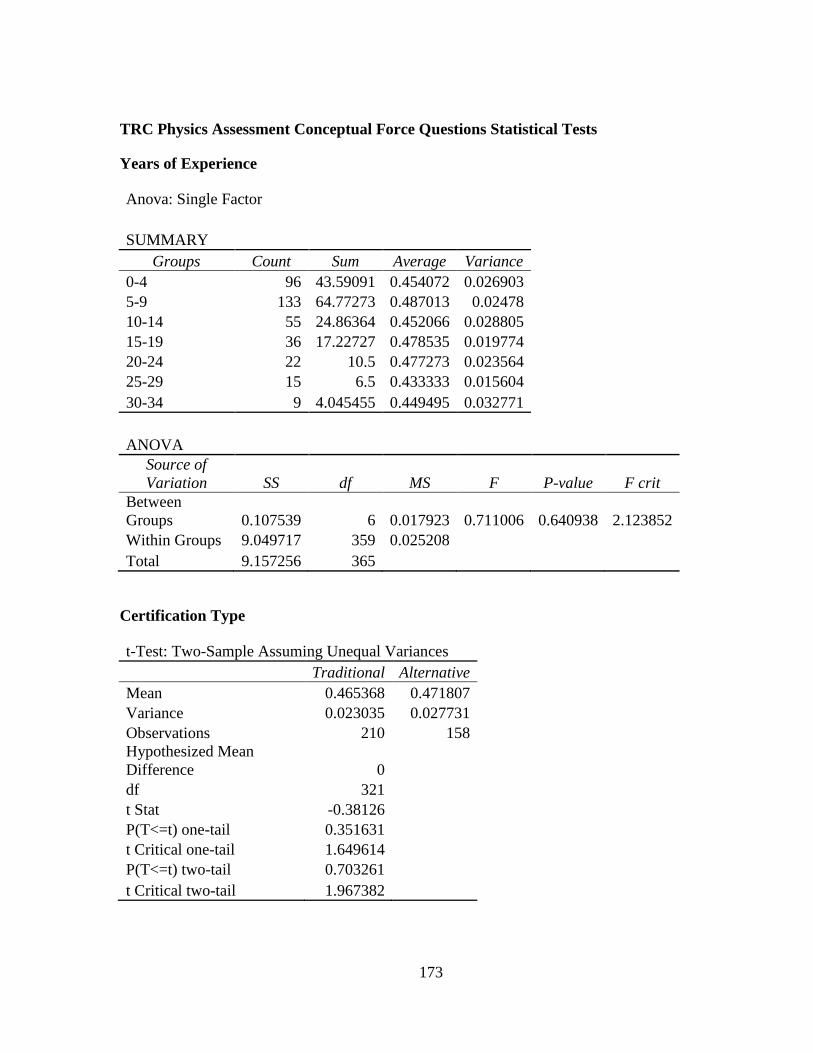
173
TRC Physics Assessment Conceptual Force Questions Statistical Tests
Years of Experience
Anova: Single Factor
SUMMARY
Groups Count Sum Average Variance
0-4 96 43.59091 0.454072 0.026903
5-9 133 64.77273 0.487013 0.02478
10-14 55 24.86364 0.452066 0.028805
15-19 36 17.22727 0.478535 0.019774
20-24 22 10.5 0.477273 0.023564
25-29 15 6.5 0.433333 0.015604
30-34 9 4.045455 0.449495 0.032771
ANOVA
Source of
Variation SS df MS F P-value F crit
Between
Groups 0.107539 6 0.017923 0.711006 0.640938 2.123852
Within Groups 9.049717 359 0.025208
Total 9.157256 365
Certification Type
t-Test: Two-Sample Assuming Unequal Variances
Traditional Alternative
Mean 0.465368 0.471807
Variance 0.023035 0.027731
Observations 210 158
Hypothesized Mean
Difference 0
df 321
t Stat -0.38126
P(T<=t) one-tail 0.351631
t Critical one-tail 1.649614
P(T<=t) two-tail 0.703261
t Critical two-tail 1.967382
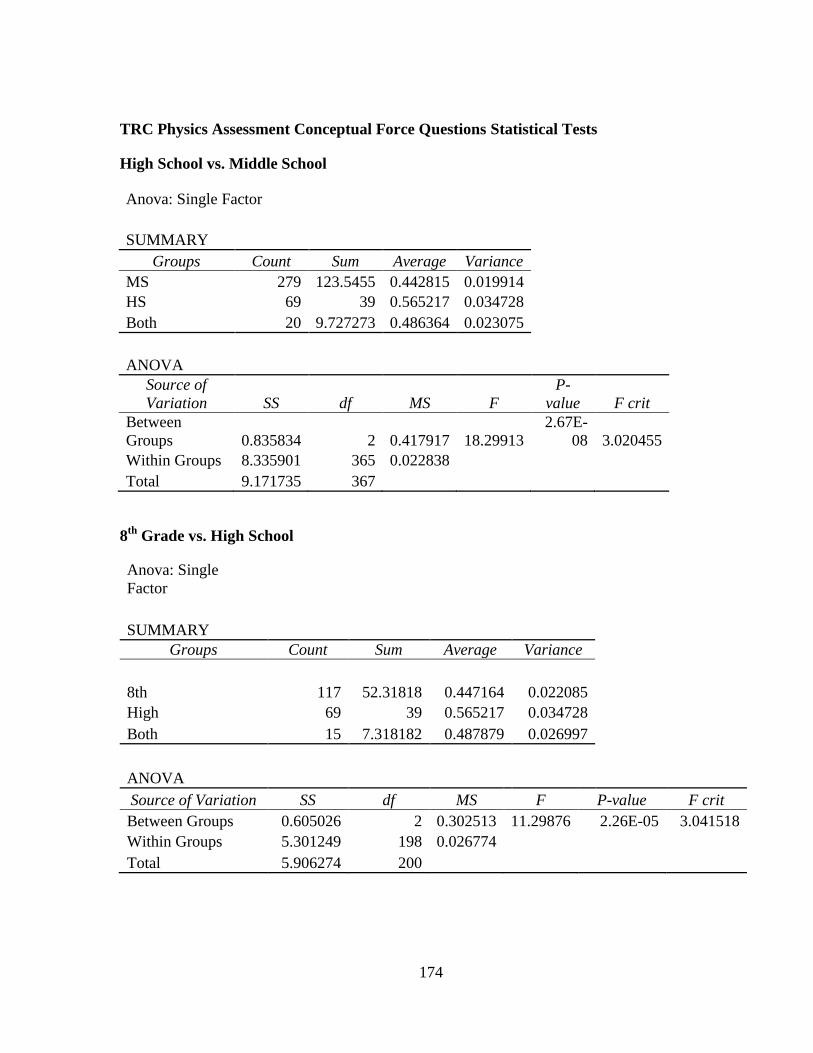
174
TRC Physics Assessment Conceptual Force Questions Statistical Tests
High School vs. Middle School
Anova: Single Factor
SUMMARY
Groups Count Sum Average Variance
MS 279 123.5455 0.442815 0.019914
HS 69 39 0.565217 0.034728
Both 20 9.727273 0.486364 0.023075
ANOVA
Source of
Variation SS df MS F
P-
value F crit
Between
Groups 0.835834 2 0.417917 18.29913
2.67E-
08 3.020455
Within Groups 8.335901 365 0.022838
Total 9.171735 367
8th
Grade vs. High School
Anova: Single
Factor
SUMMARY
Groups Count Sum Average Variance
8th 117 52.31818 0.447164 0.022085
High 69 39 0.565217 0.034728
Both 15 7.318182 0.487879 0.026997
ANOVA
Source of Variation SS df MS F P-value F crit
Between Groups 0.605026 2 0.302513 11.29876 2.26E-05 3.041518
Within Groups 5.301249 198 0.026774
Total 5.906274 200
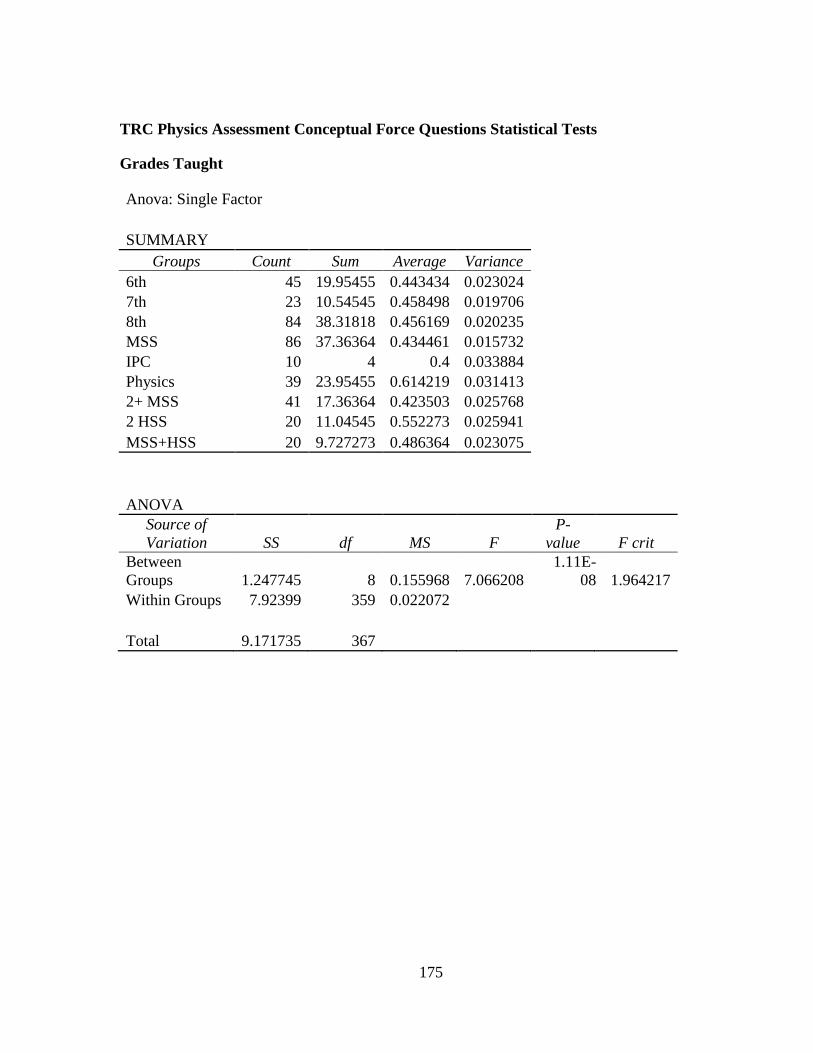
175
TRC Physics Assessment Conceptual Force Questions Statistical Tests
Grades Taught
Anova: Single Factor
SUMMARY
Groups Count Sum Average Variance
6th 45 19.95455 0.443434 0.023024
7th 23 10.54545 0.458498 0.019706
8th 84 38.31818 0.456169 0.020235
MSS 86 37.36364 0.434461 0.015732
IPC 10 4 0.4 0.033884
Physics 39 23.95455 0.614219 0.031413
2+ MSS 41 17.36364 0.423503 0.025768
2 HSS 20 11.04545 0.552273 0.025941
MSS+HSS 20 9.727273 0.486364 0.023075
ANOVA
Source of
Variation SS df MS F
P-
value F crit
Between
Groups 1.247745 8 0.155968 7.066208
1.11E-
08 1.964217
Within Groups 7.92399 359 0.022072
Total 9.171735 367
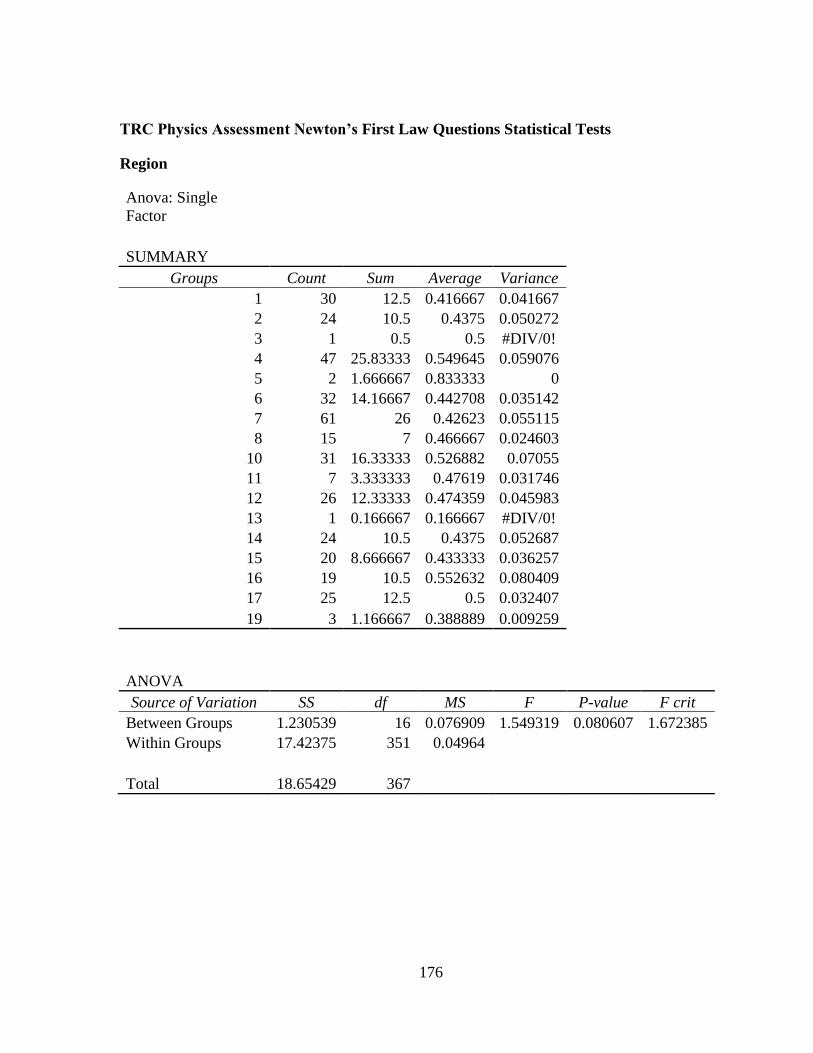
176
TRC Physics Assessment Newton’s First Law Questions Statistical Tests
Region
Anova: Single
Factor
SUMMARY
Groups Count Sum Average Variance
1 30 12.5 0.416667 0.041667
2 24 10.5 0.4375 0.050272
3 1 0.5 0.5 #DIV/0!
4 47 25.83333 0.549645 0.059076
5 2 1.666667 0.833333 0
6 32 14.16667 0.442708 0.035142
7 61 26 0.42623 0.055115
8 15 7 0.466667 0.024603
10 31 16.33333 0.526882 0.07055
11 7 3.333333 0.47619 0.031746
12 26 12.33333 0.474359 0.045983
13 1 0.166667 0.166667 #DIV/0!
14 24 10.5 0.4375 0.052687
15 20 8.666667 0.433333 0.036257
16 19 10.5 0.552632 0.080409
17 25 12.5 0.5 0.032407
19 3 1.166667 0.388889 0.009259
ANOVA
Source of Variation SS df MS F P-value F crit
Between Groups 1.230539 16 0.076909 1.549319 0.080607 1.672385
Within Groups 17.42375 351 0.04964
Total 18.65429 367
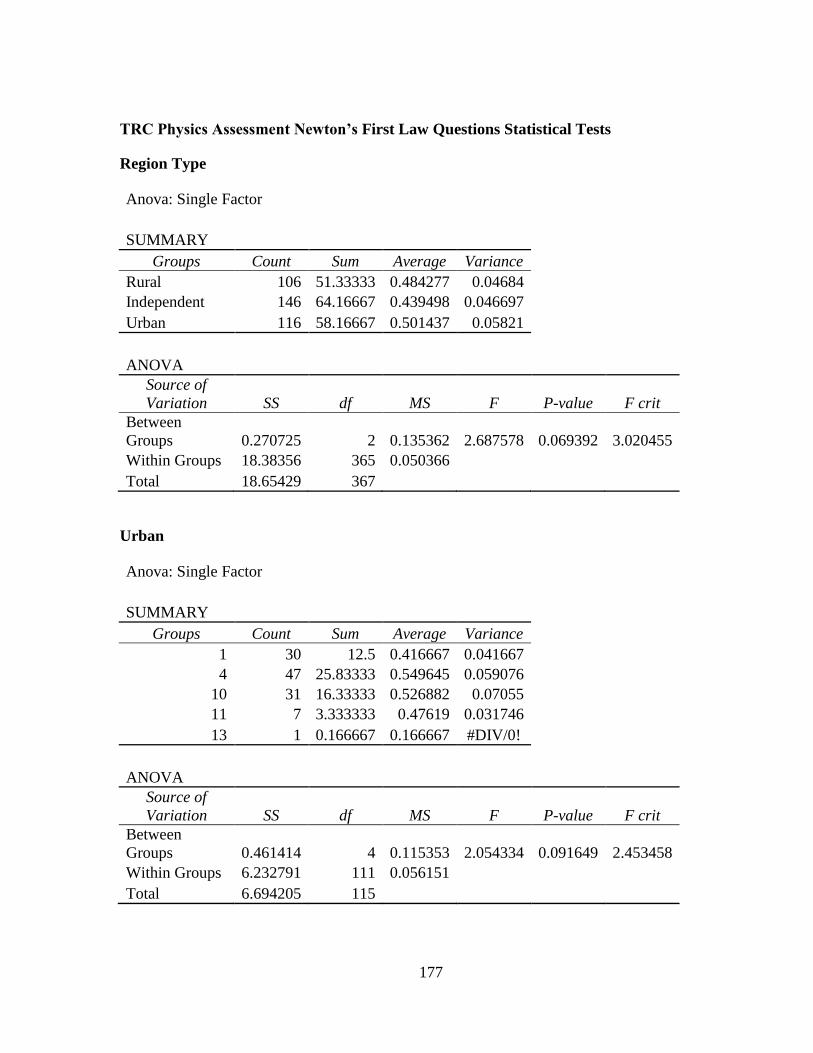
177
TRC Physics Assessment Newton’s First Law Questions Statistical Tests
Region Type
Anova: Single Factor
SUMMARY
Groups Count Sum Average Variance
Rural 106 51.33333 0.484277 0.04684
Independent 146 64.16667 0.439498 0.046697
Urban 116 58.16667 0.501437 0.05821
ANOVA
Source of
Variation SS df MS F P-value F crit
Between
Groups 0.270725 2 0.135362 2.687578 0.069392 3.020455
Within Groups 18.38356 365 0.050366
Total 18.65429 367
Urban
Anova: Single Factor
SUMMARY
Groups Count Sum Average Variance
1 30 12.5 0.416667 0.041667
4 47 25.83333 0.549645 0.059076
10 31 16.33333 0.526882 0.07055
11 7 3.333333 0.47619 0.031746
13 1 0.166667 0.166667 #DIV/0!
ANOVA
Source of
Variation SS df MS F P-value F crit
Between
Groups 0.461414 4 0.115353 2.054334 0.091649 2.453458
Within Groups 6.232791 111 0.056151
Total 6.694205 115
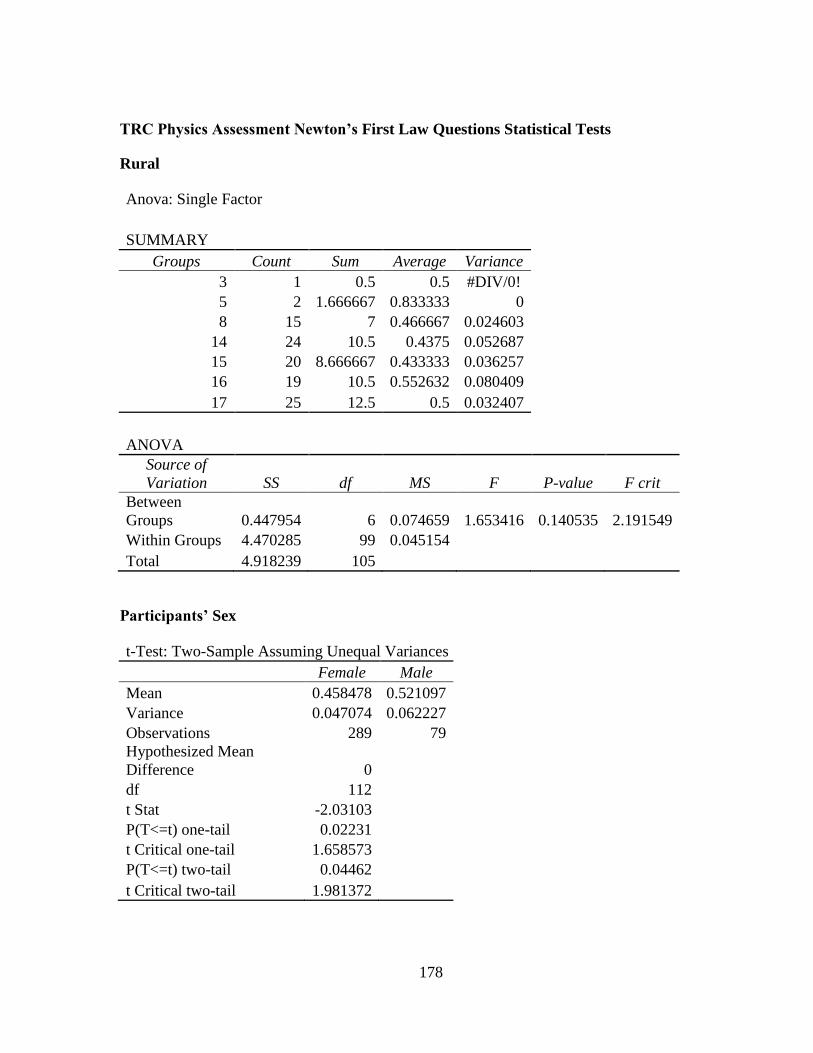
178
TRC Physics Assessment Newton’s First Law Questions Statistical Tests
Rural
Anova: Single Factor
SUMMARY
Groups Count Sum Average Variance
3 1 0.5 0.5 #DIV/0!
5 2 1.666667 0.833333 0
8 15 7 0.466667 0.024603
14 24 10.5 0.4375 0.052687
15 20 8.666667 0.433333 0.036257
16 19 10.5 0.552632 0.080409
17 25 12.5 0.5 0.032407
ANOVA
Source of
Variation SS df MS F P-value F crit
Between
Groups 0.447954 6 0.074659 1.653416 0.140535 2.191549
Within Groups 4.470285 99 0.045154
Total 4.918239 105
Participants’ Sex
t-Test: Two-Sample Assuming Unequal Variances
Female Male
Mean 0.458478 0.521097
Variance 0.047074 0.062227
Observations 289 79
Hypothesized Mean
Difference 0
df 112
t Stat -2.03103
P(T<=t) one-tail 0.02231
t Critical one-tail 1.658573
P(T<=t) two-tail 0.04462
t Critical two-tail 1.981372
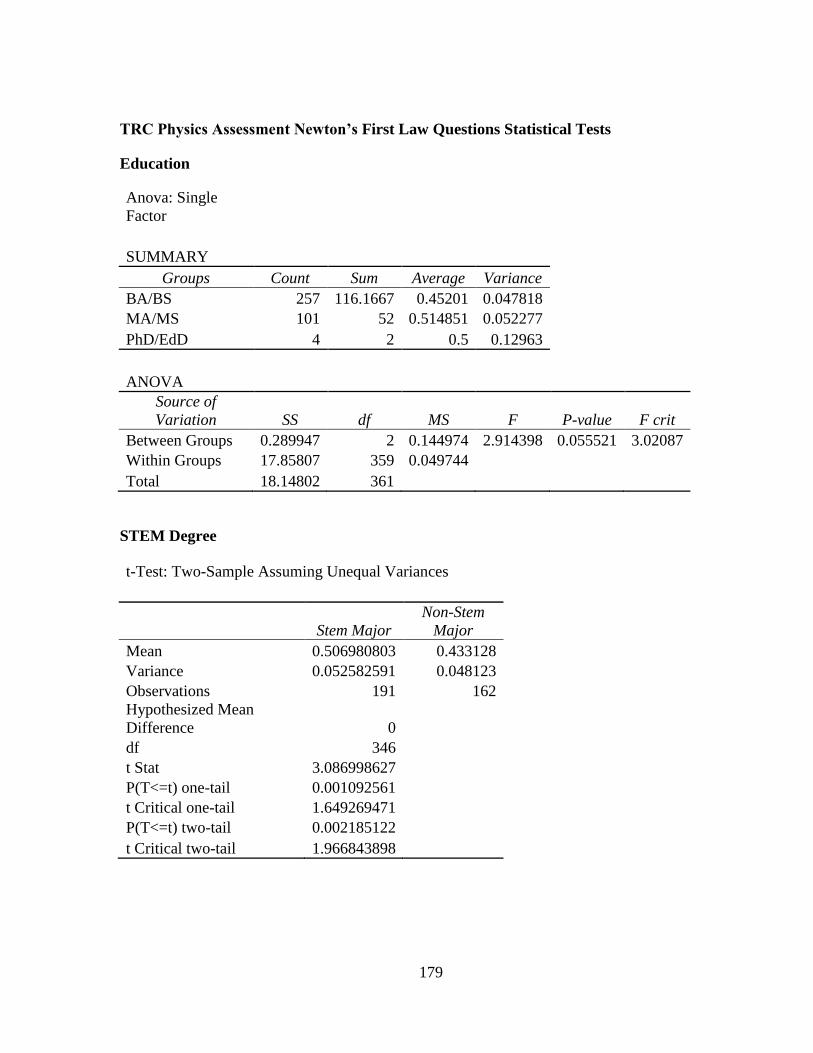
179
TRC Physics Assessment Newton’s First Law Questions Statistical Tests
Education
Anova: Single
Factor
SUMMARY
Groups Count Sum Average Variance
BA/BS 257 116.1667 0.45201 0.047818
MA/MS 101 52 0.514851 0.052277
PhD/EdD 4 2 0.5 0.12963
ANOVA
Source of
Variation SS df MS F P-value F crit
Between Groups 0.289947 2 0.144974 2.914398 0.055521 3.02087
Within Groups 17.85807 359 0.049744
Total 18.14802 361
STEM Degree
t-Test: Two-Sample Assuming Unequal Variances
Stem Major
Non-Stem
Major
Mean 0.506980803 0.433128
Variance 0.052582591 0.048123
Observations 191 162
Hypothesized Mean
Difference 0
df 346
t Stat 3.086998627
P(T<=t) one-tail 0.001092561
t Critical one-tail 1.649269471
P(T<=t) two-tail 0.002185122
t Critical two-tail 1.966843898
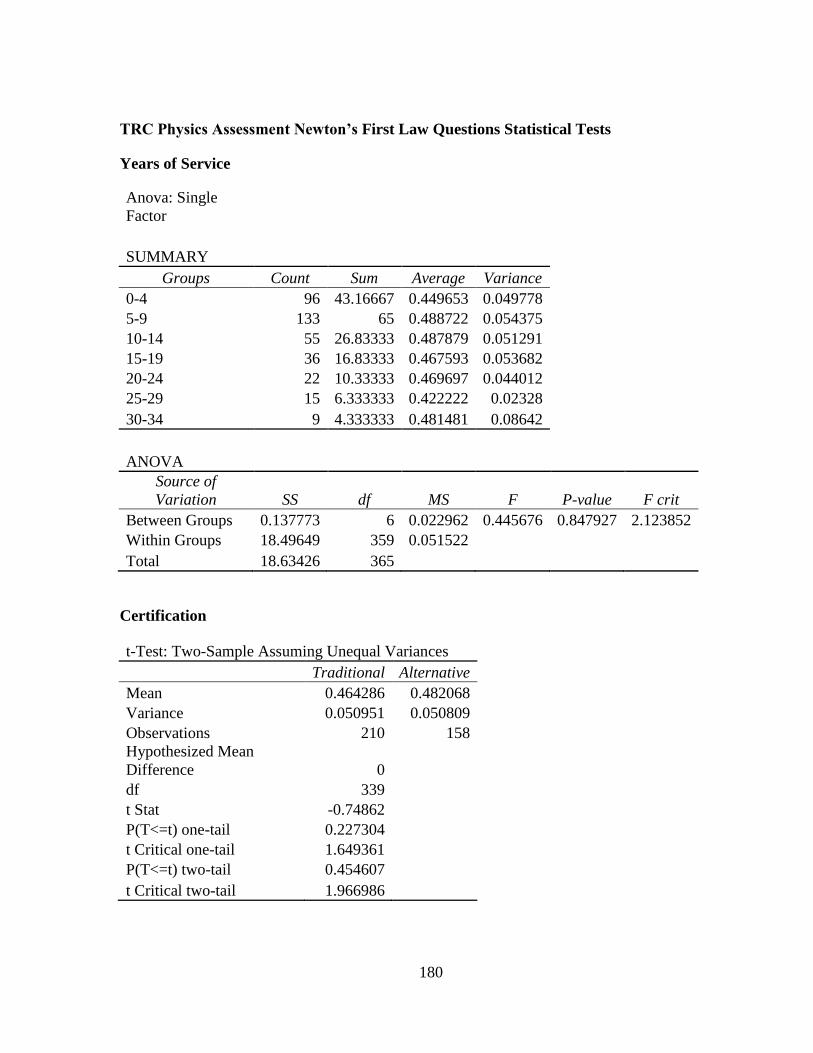
180
TRC Physics Assessment Newton’s First Law Questions Statistical Tests
Years of Service
Anova: Single
Factor
SUMMARY
Groups Count Sum Average Variance
0-4 96 43.16667 0.449653 0.049778
5-9 133 65 0.488722 0.054375
10-14 55 26.83333 0.487879 0.051291
15-19 36 16.83333 0.467593 0.053682
20-24 22 10.33333 0.469697 0.044012
25-29 15 6.333333 0.422222 0.02328
30-34 9 4.333333 0.481481 0.08642
ANOVA
Source of
Variation SS df MS F P-value F crit
Between Groups 0.137773 6 0.022962 0.445676 0.847927 2.123852
Within Groups 18.49649 359 0.051522
Total 18.63426 365
Certification
t-Test: Two-Sample Assuming Unequal Variances
Traditional Alternative
Mean 0.464286 0.482068
Variance 0.050951 0.050809
Observations 210 158
Hypothesized Mean
Difference 0
df 339
t Stat -0.74862
P(T<=t) one-tail 0.227304
t Critical one-tail 1.649361
P(T<=t) two-tail 0.454607
t Critical two-tail 1.966986
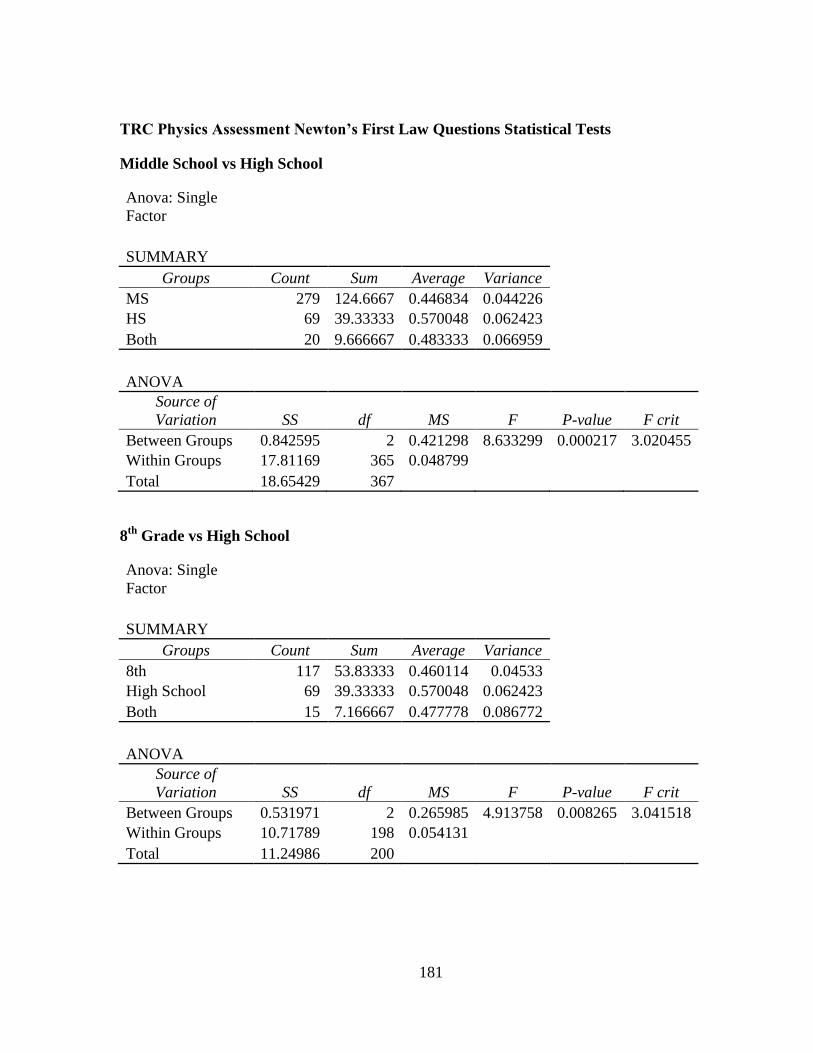
181
TRC Physics Assessment Newton’s First Law Questions Statistical Tests
Middle School vs High School
Anova: Single
Factor
SUMMARY
Groups Count Sum Average Variance
MS 279 124.6667 0.446834 0.044226
HS 69 39.33333 0.570048 0.062423
Both 20 9.666667 0.483333 0.066959
ANOVA
Source of
Variation SS df MS F P-value F crit
Between Groups 0.842595 2 0.421298 8.633299 0.000217 3.020455
Within Groups 17.81169 365 0.048799
Total 18.65429 367
8th
Grade vs High School
Anova: Single
Factor
SUMMARY
Groups Count Sum Average Variance
8th 117 53.83333 0.460114 0.04533
High School 69 39.33333 0.570048 0.062423
Both 15 7.166667 0.477778 0.086772
ANOVA
Source of
Variation SS df MS F P-value F crit
Between Groups 0.531971 2 0.265985 4.913758 0.008265 3.041518
Within Groups 10.71789 198 0.054131
Total 11.24986 200
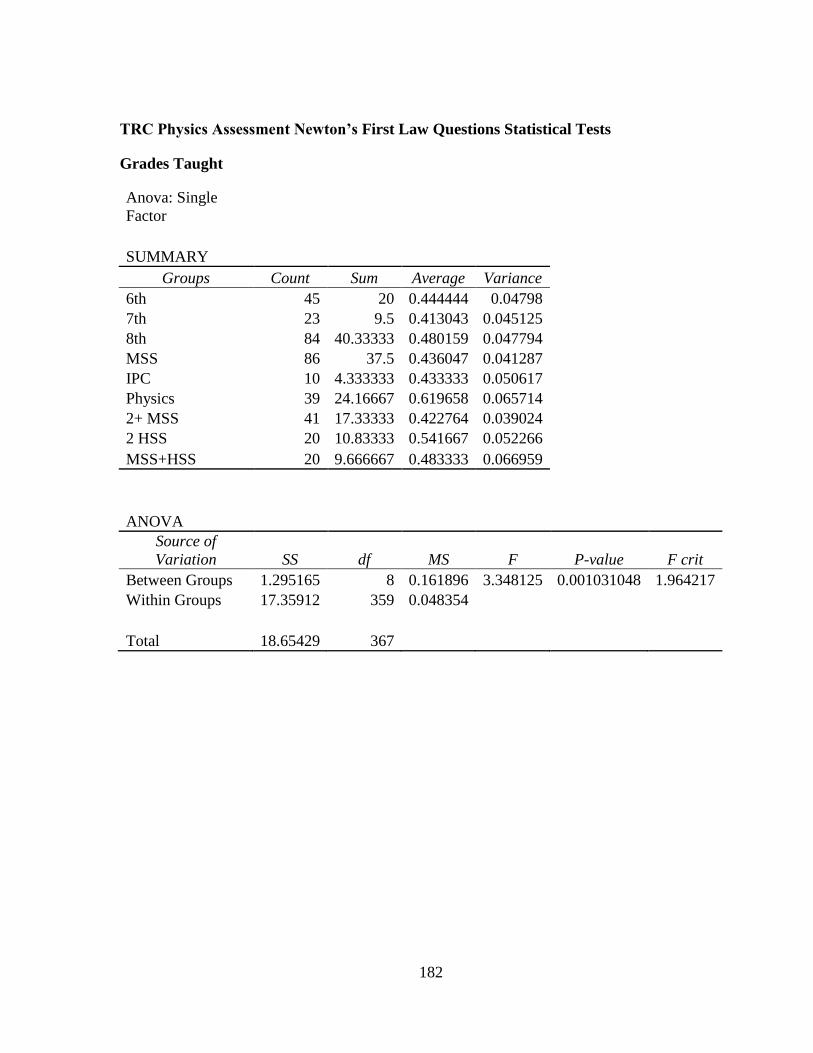
182
TRC Physics Assessment Newton’s First Law Questions Statistical Tests
Grades Taught
Anova: Single
Factor
SUMMARY
Groups Count Sum Average Variance
6th 45 20 0.444444 0.04798
7th 23 9.5 0.413043 0.045125
8th 84 40.33333 0.480159 0.047794
MSS 86 37.5 0.436047 0.041287
IPC 10 4.333333 0.433333 0.050617
Physics 39 24.16667 0.619658 0.065714
2+ MSS 41 17.33333 0.422764 0.039024
2 HSS 20 10.83333 0.541667 0.052266
MSS+HSS 20 9.666667 0.483333 0.066959
ANOVA
Source of
Variation SS df MS F P-value F crit
Between Groups 1.295165 8 0.161896 3.348125 0.001031048 1.964217
Within Groups 17.35912 359 0.048354
Total 18.65429 367
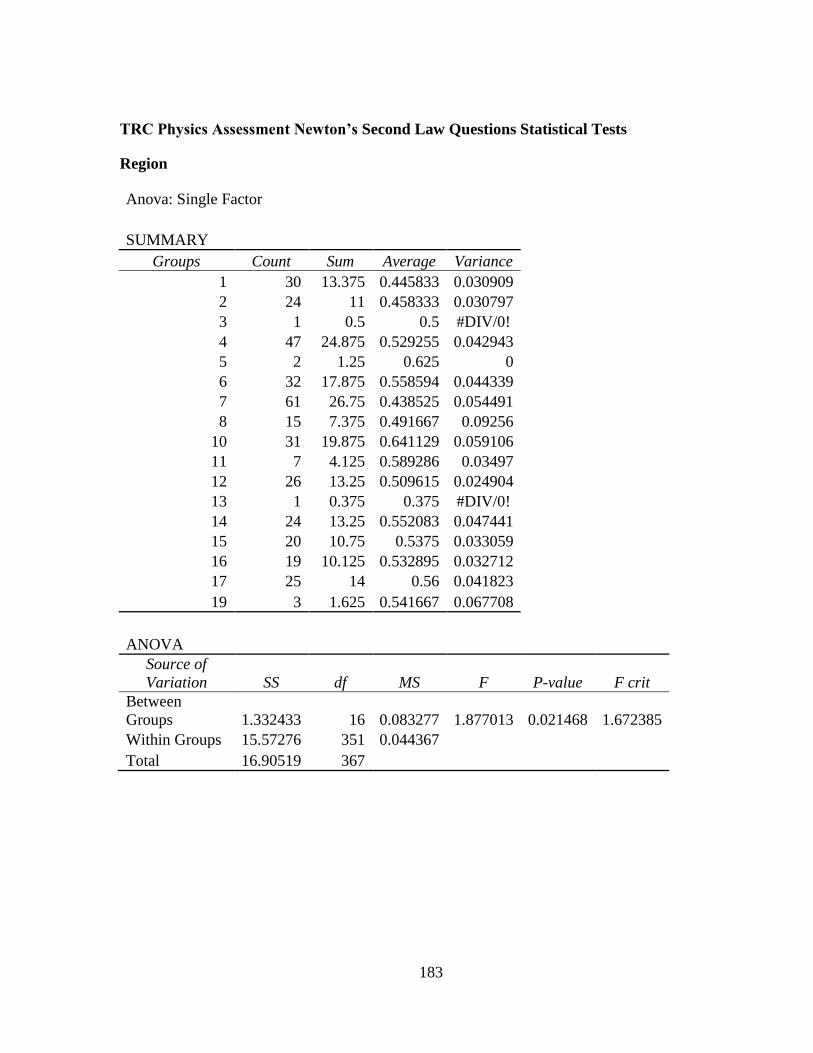
183
TRC Physics Assessment Newton’s Second Law Questions Statistical Tests
Region
Anova: Single Factor
SUMMARY
Groups Count Sum Average Variance
1 30 13.375 0.445833 0.030909
2 24 11 0.458333 0.030797
3 1 0.5 0.5 #DIV/0!
4 47 24.875 0.529255 0.042943
5 2 1.25 0.625 0
6 32 17.875 0.558594 0.044339
7 61 26.75 0.438525 0.054491
8 15 7.375 0.491667 0.09256
10 31 19.875 0.641129 0.059106
11 7 4.125 0.589286 0.03497
12 26 13.25 0.509615 0.024904
13 1 0.375 0.375 #DIV/0!
14 24 13.25 0.552083 0.047441
15 20 10.75 0.5375 0.033059
16 19 10.125 0.532895 0.032712
17 25 14 0.56 0.041823
19 3 1.625 0.541667 0.067708
ANOVA
Source of
Variation SS df MS F P-value F crit
Between
Groups 1.332433 16 0.083277 1.877013 0.021468 1.672385
Within Groups 15.57276 351 0.044367
Total 16.90519 367
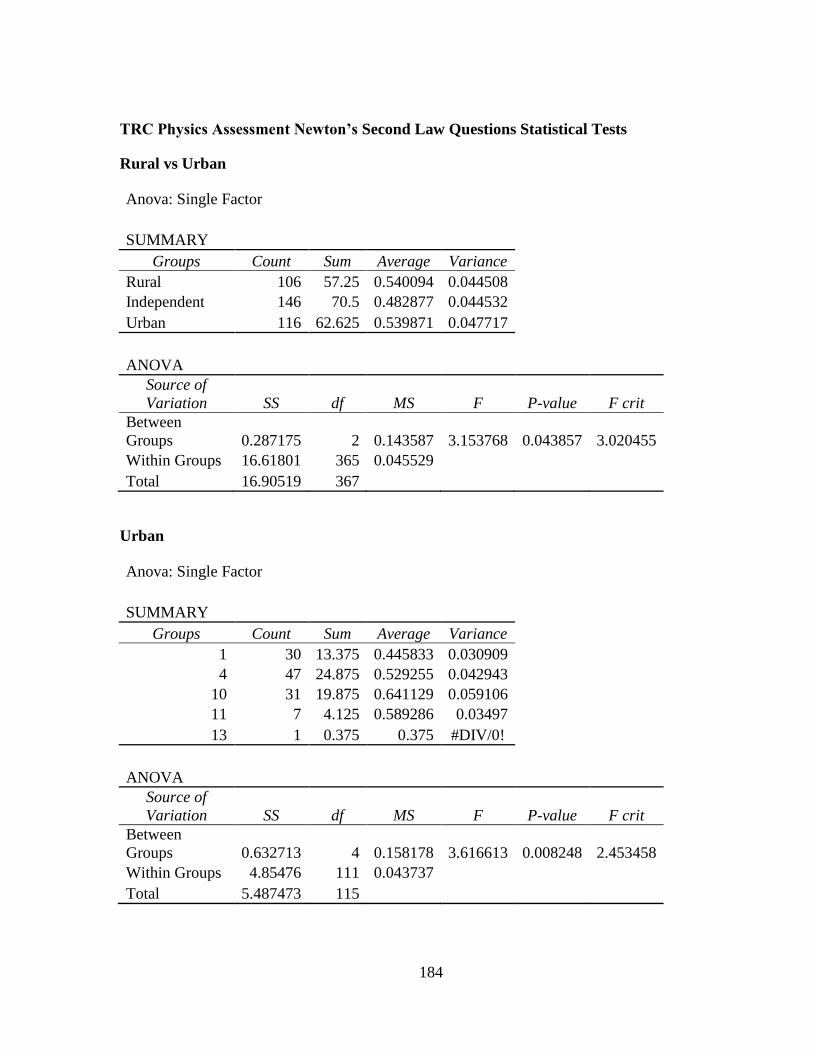
184
TRC Physics Assessment Newton’s Second Law Questions Statistical Tests
Rural vs Urban
Anova: Single Factor
SUMMARY
Groups Count Sum Average Variance
Rural 106 57.25 0.540094 0.044508
Independent 146 70.5 0.482877 0.044532
Urban 116 62.625 0.539871 0.047717
ANOVA
Source of
Variation SS df MS F P-value F crit
Between
Groups 0.287175 2 0.143587 3.153768 0.043857 3.020455
Within Groups 16.61801 365 0.045529
Total 16.90519 367
Urban
Anova: Single Factor
SUMMARY
Groups Count Sum Average Variance
1 30 13.375 0.445833 0.030909
4 47 24.875 0.529255 0.042943
10 31 19.875 0.641129 0.059106
11 7 4.125 0.589286 0.03497
13 1 0.375 0.375 #DIV/0!
ANOVA
Source of
Variation SS df MS F P-value F crit
Between
Groups 0.632713 4 0.158178 3.616613 0.008248 2.453458
Within Groups 4.85476 111 0.043737
Total 5.487473 115
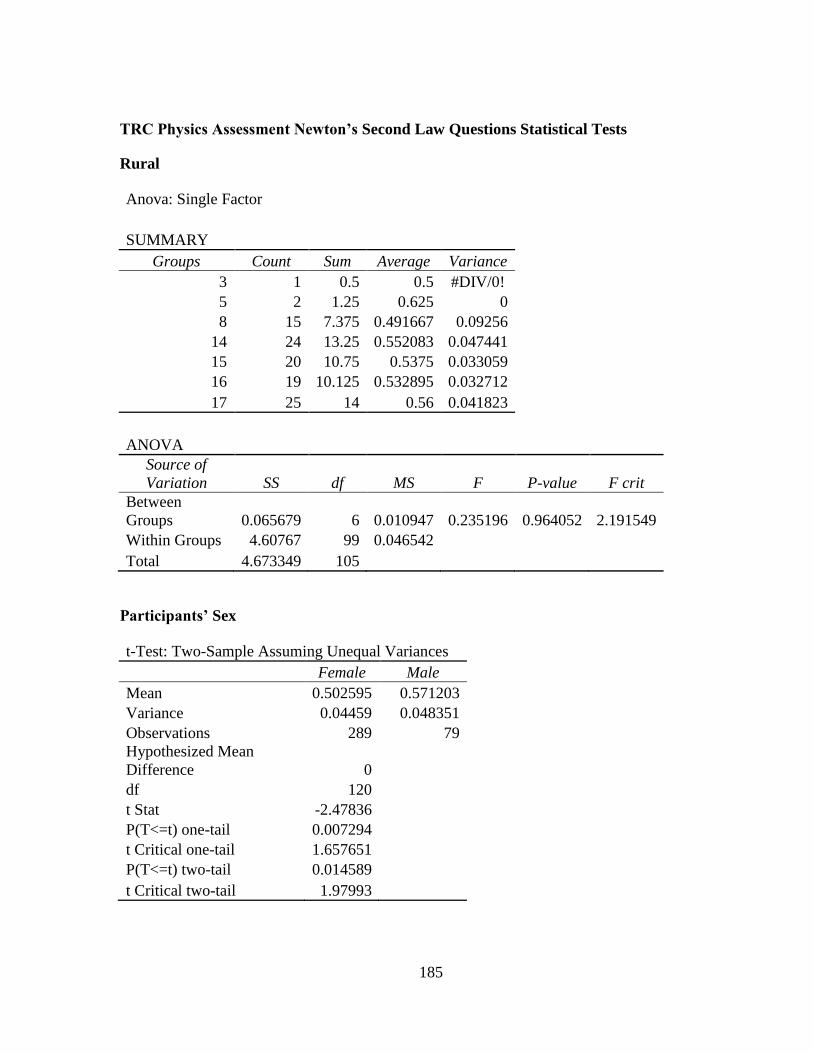
185
TRC Physics Assessment Newton’s Second Law Questions Statistical Tests
Rural
Anova: Single Factor
SUMMARY
Groups Count Sum Average Variance
3 1 0.5 0.5 #DIV/0!
5 2 1.25 0.625 0
8 15 7.375 0.491667 0.09256
14 24 13.25 0.552083 0.047441
15 20 10.75 0.5375 0.033059
16 19 10.125 0.532895 0.032712
17 25 14 0.56 0.041823
ANOVA
Source of
Variation SS df MS F P-value F crit
Between
Groups 0.065679 6 0.010947 0.235196 0.964052 2.191549
Within Groups 4.60767 99 0.046542
Total 4.673349 105
Participants’ Sex
t-Test: Two-Sample Assuming Unequal Variances
Female Male
Mean 0.502595 0.571203
Variance 0.04459 0.048351
Observations 289 79
Hypothesized Mean
Difference 0
df 120
t Stat -2.47836
P(T<=t) one-tail 0.007294
t Critical one-tail 1.657651
P(T<=t) two-tail 0.014589
t Critical two-tail 1.97993
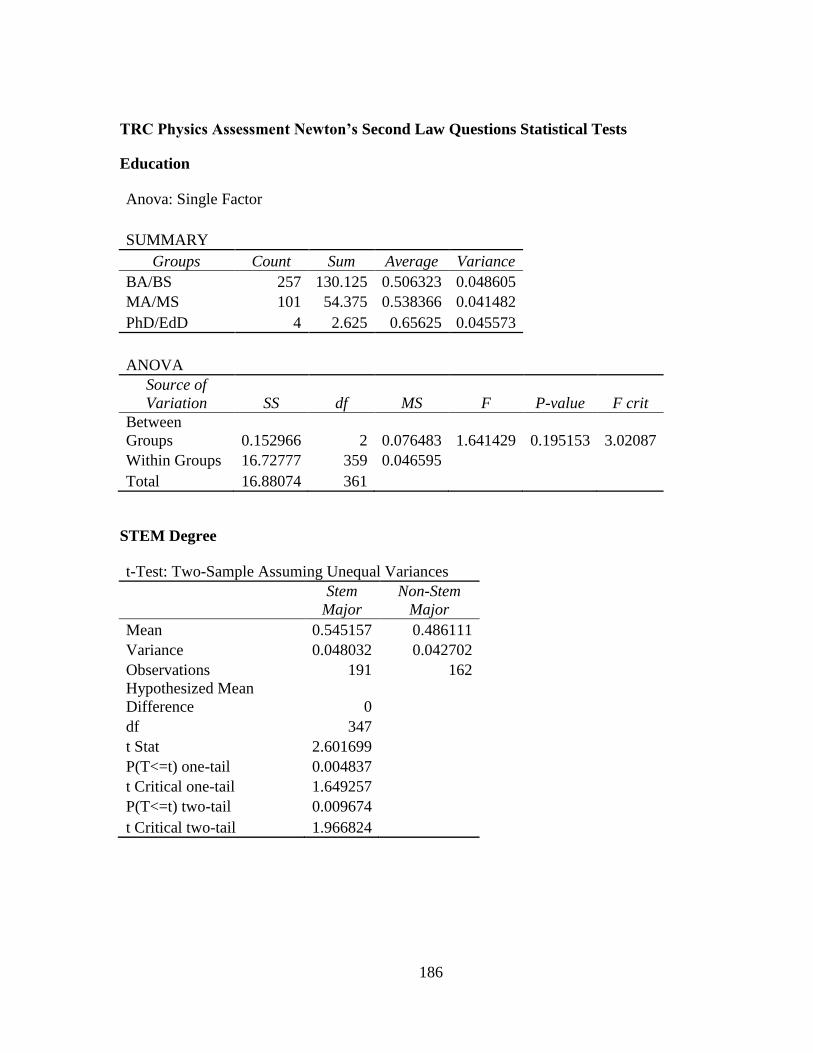
186
TRC Physics Assessment Newton’s Second Law Questions Statistical Tests
Education
Anova: Single Factor
SUMMARY
Groups Count Sum Average Variance
BA/BS 257 130.125 0.506323 0.048605
MA/MS 101 54.375 0.538366 0.041482
PhD/EdD 4 2.625 0.65625 0.045573
ANOVA
Source of
Variation SS df MS F P-value F crit
Between
Groups 0.152966 2 0.076483 1.641429 0.195153 3.02087
Within Groups 16.72777 359 0.046595
Total 16.88074 361
STEM Degree
t-Test: Two-Sample Assuming Unequal Variances
Stem
Major
Non-Stem
Major
Mean 0.545157 0.486111
Variance 0.048032 0.042702
Observations 191 162
Hypothesized Mean
Difference 0
df 347
t Stat 2.601699
P(T<=t) one-tail 0.004837
t Critical one-tail 1.649257
P(T<=t) two-tail 0.009674
t Critical two-tail 1.966824
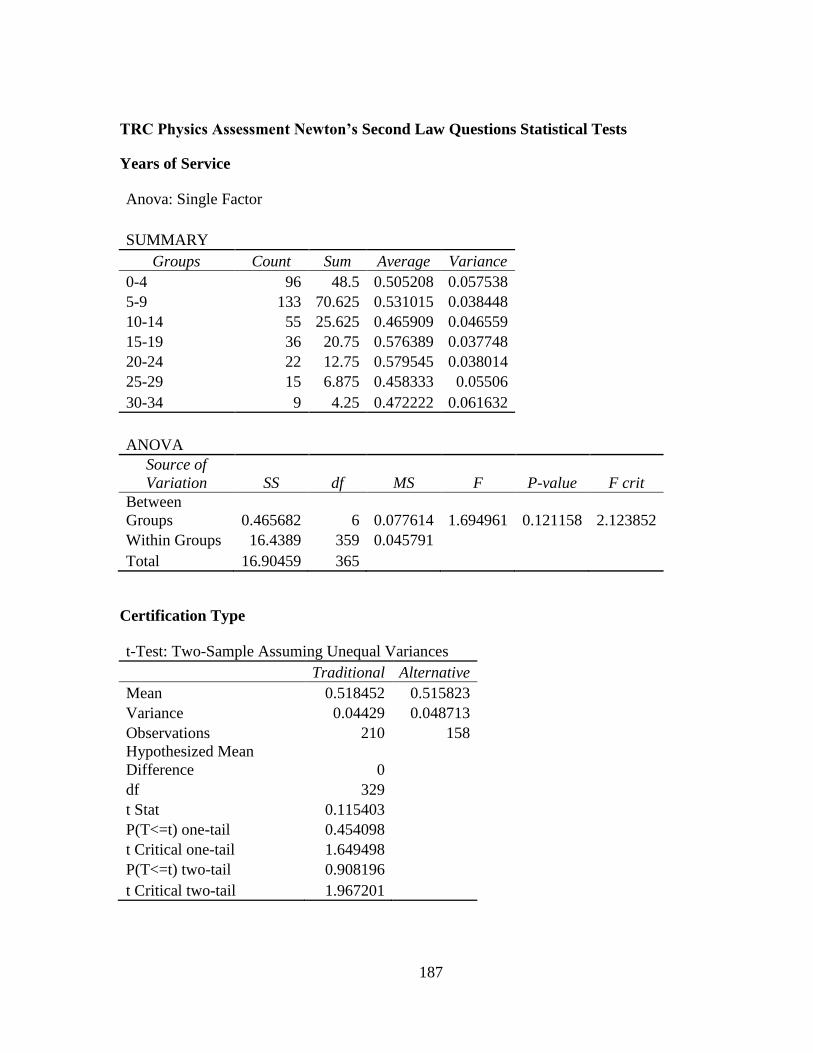
187
TRC Physics Assessment Newton’s Second Law Questions Statistical Tests
Years of Service
Anova: Single Factor
SUMMARY
Groups Count Sum Average Variance
0-4 96 48.5 0.505208 0.057538
5-9 133 70.625 0.531015 0.038448
10-14 55 25.625 0.465909 0.046559
15-19 36 20.75 0.576389 0.037748
20-24 22 12.75 0.579545 0.038014
25-29 15 6.875 0.458333 0.05506
30-34 9 4.25 0.472222 0.061632
ANOVA
Source of
Variation SS df MS F P-value F crit
Between
Groups 0.465682 6 0.077614 1.694961 0.121158 2.123852
Within Groups 16.4389 359 0.045791
Total 16.90459 365
Certification Type
t-Test: Two-Sample Assuming Unequal Variances
Traditional Alternative
Mean 0.518452 0.515823
Variance 0.04429 0.048713
Observations 210 158
Hypothesized Mean
Difference 0
df 329
t Stat 0.115403
P(T<=t) one-tail 0.454098
t Critical one-tail 1.649498
P(T<=t) two-tail 0.908196
t Critical two-tail 1.967201
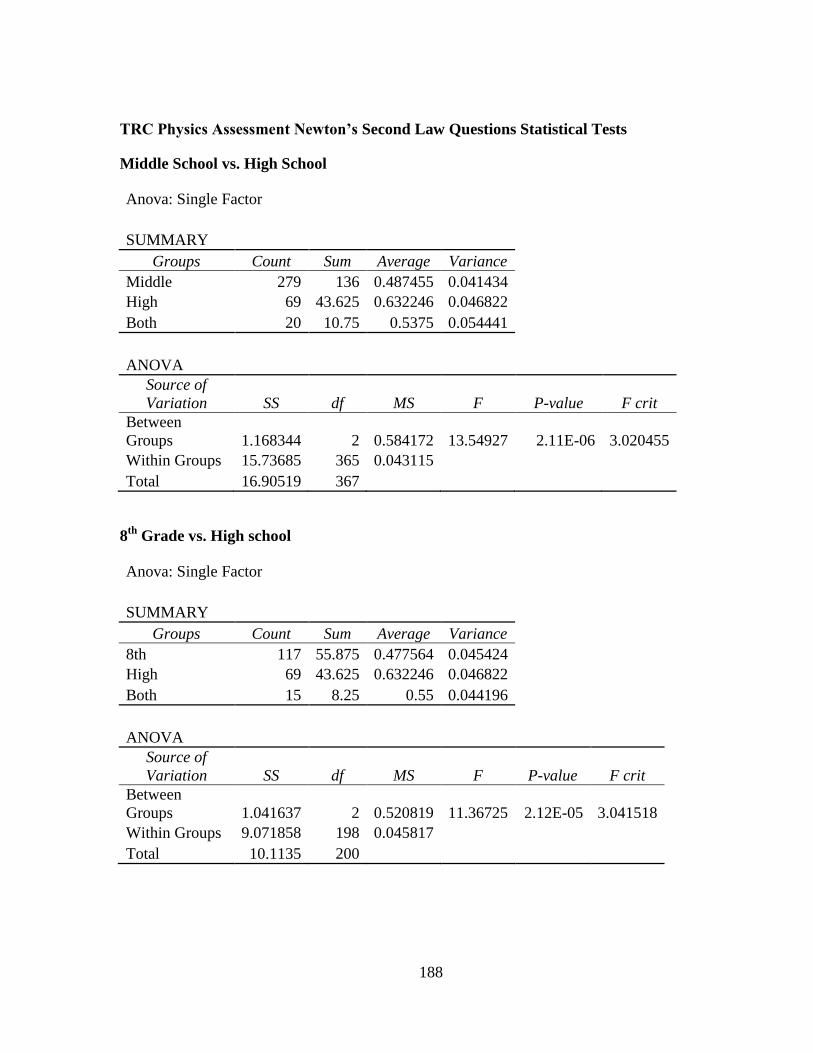
188
TRC Physics Assessment Newton’s Second Law Questions Statistical Tests
Middle School vs. High School
Anova: Single Factor
SUMMARY
Groups Count Sum Average Variance
Middle 279 136 0.487455 0.041434
High 69 43.625 0.632246 0.046822
Both 20 10.75 0.5375 0.054441
ANOVA
Source of
Variation SS df MS F P-value F crit
Between
Groups 1.168344 2 0.584172 13.54927 2.11E-06 3.020455
Within Groups 15.73685 365 0.043115
Total 16.90519 367
8th
Grade vs. High school
Anova: Single Factor
SUMMARY
Groups Count Sum Average Variance
8th 117 55.875 0.477564 0.045424
High 69 43.625 0.632246 0.046822
Both 15 8.25 0.55 0.044196
ANOVA
Source of
Variation SS df MS F P-value F crit
Between
Groups 1.041637 2 0.520819 11.36725 2.12E-05 3.041518
Within Groups 9.071858 198 0.045817
Total 10.1135 200
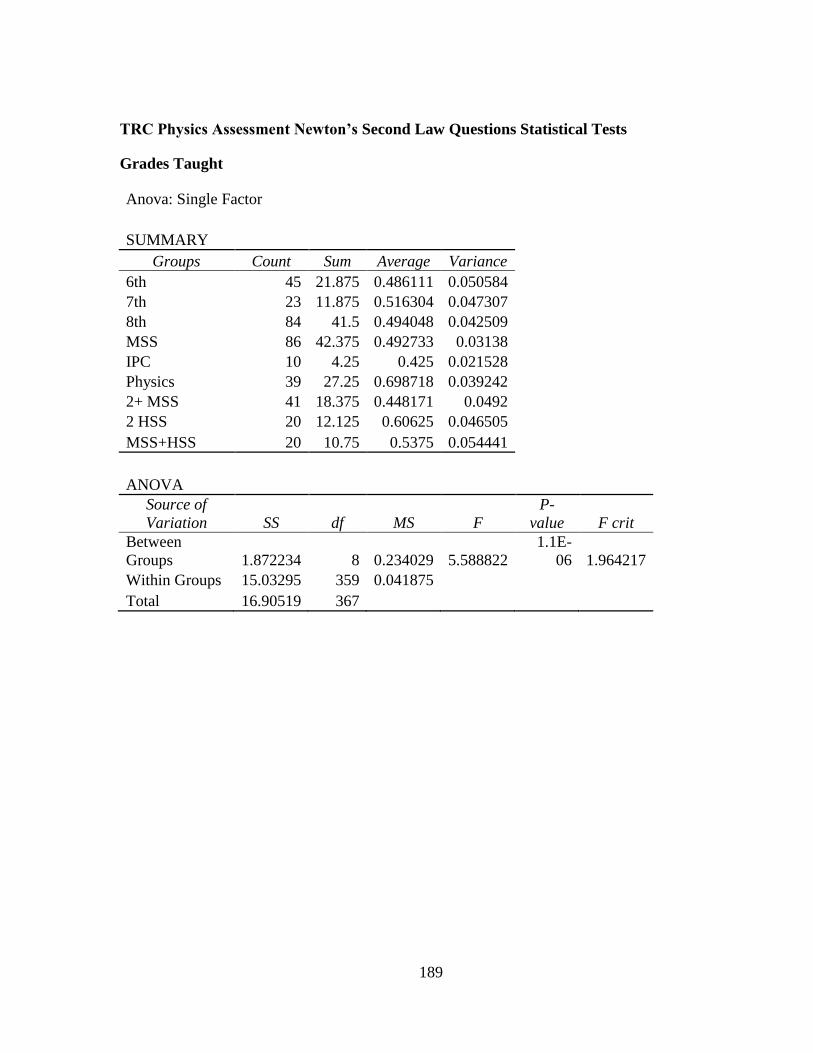
189
TRC Physics Assessment Newton’s Second Law Questions Statistical Tests
Grades Taught
Anova: Single Factor
SUMMARY
Groups Count Sum Average Variance
6th 45 21.875 0.486111 0.050584
7th 23 11.875 0.516304 0.047307
8th 84 41.5 0.494048 0.042509
MSS 86 42.375 0.492733 0.03138
IPC 10 4.25 0.425 0.021528
Physics 39 27.25 0.698718 0.039242
2+ MSS 41 18.375 0.448171 0.0492
2 HSS 20 12.125 0.60625 0.046505
MSS+HSS 20 10.75 0.5375 0.054441
ANOVA
Source of
Variation SS df MS F
P-
value F crit
Between
Groups 1.872234 8 0.234029 5.588822
1.1E-
06 1.964217
Within Groups 15.03295 359 0.041875
Total 16.90519 367
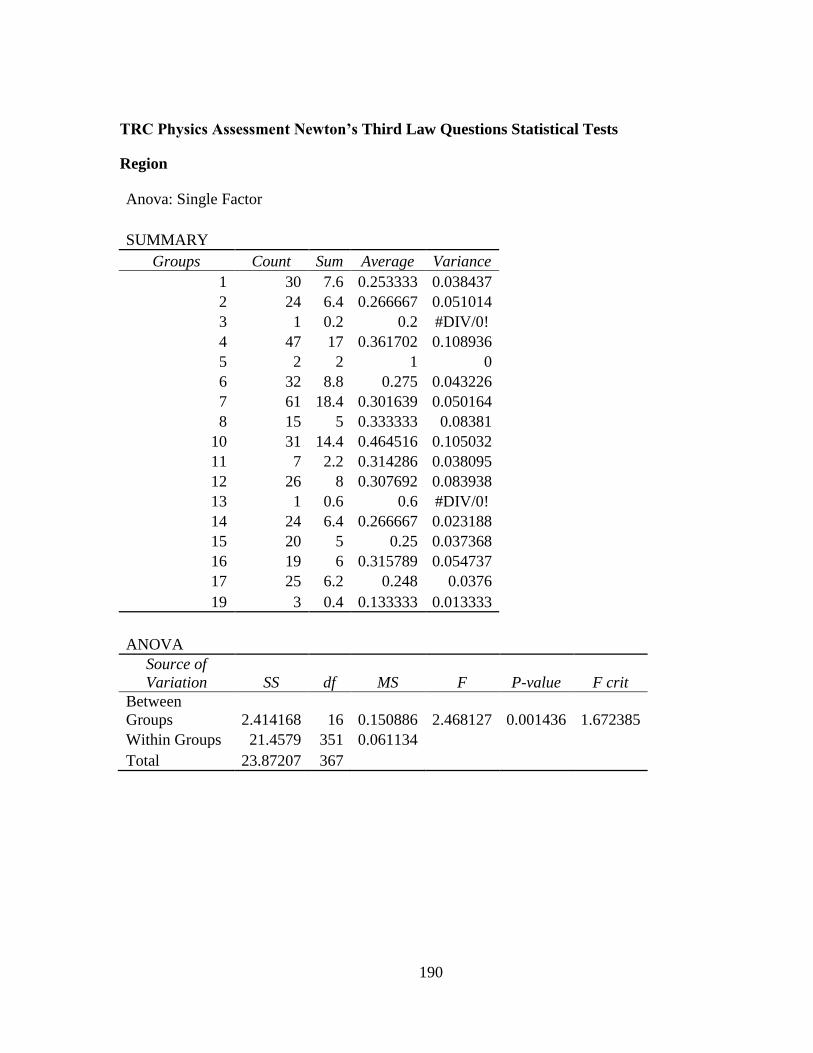
190
TRC Physics Assessment Newton’s Third Law Questions Statistical Tests
Region
Anova: Single Factor
SUMMARY
Groups Count Sum Average Variance
1 30 7.6 0.253333 0.038437
2 24 6.4 0.266667 0.051014
3 1 0.2 0.2 #DIV/0!
4 47 17 0.361702 0.108936
5 2 2 1 0
6 32 8.8 0.275 0.043226
7 61 18.4 0.301639 0.050164
8 15 5 0.333333 0.08381
10 31 14.4 0.464516 0.105032
11 7 2.2 0.314286 0.038095
12 26 8 0.307692 0.083938
13 1 0.6 0.6 #DIV/0!
14 24 6.4 0.266667 0.023188
15 20 5 0.25 0.037368
16 19 6 0.315789 0.054737
17 25 6.2 0.248 0.0376
19 3 0.4 0.133333 0.013333
ANOVA
Source of
Variation SS df MS F P-value F crit
Between
Groups 2.414168 16 0.150886 2.468127 0.001436 1.672385
Within Groups 21.4579 351 0.061134
Total 23.87207 367
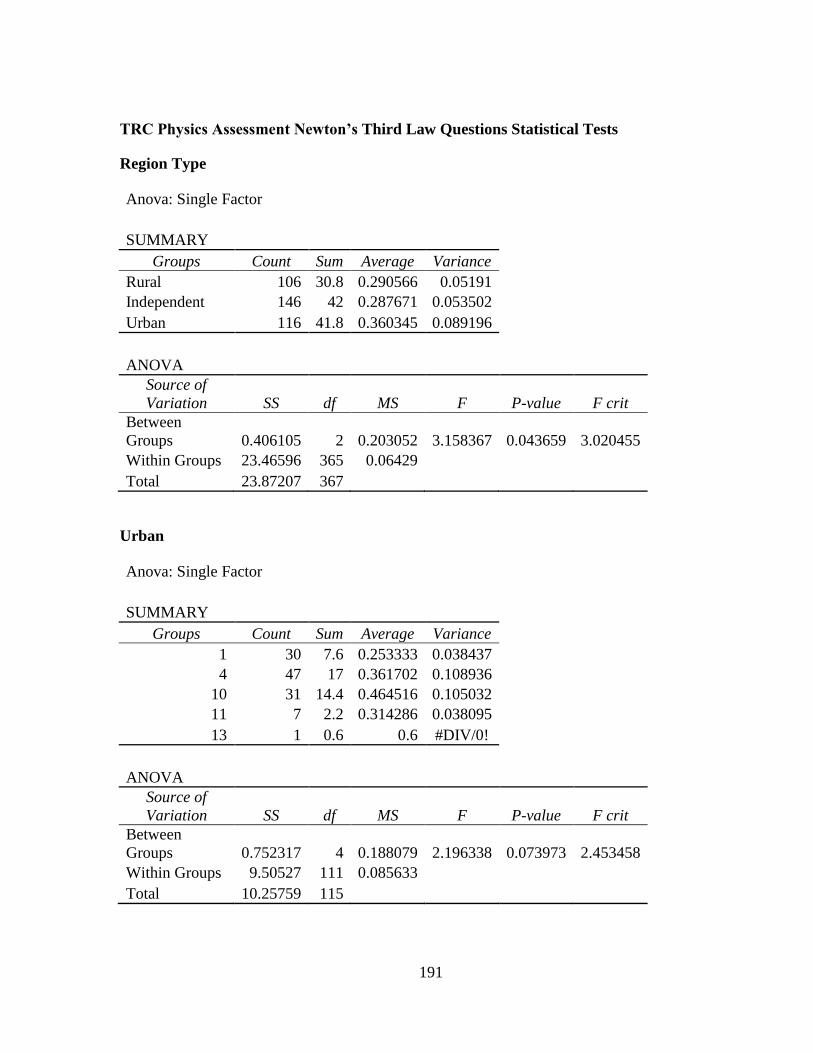
191
TRC Physics Assessment Newton’s Third Law Questions Statistical Tests
Region Type
Anova: Single Factor
SUMMARY
Groups Count Sum Average Variance
Rural 106 30.8 0.290566 0.05191
Independent 146 42 0.287671 0.053502
Urban 116 41.8 0.360345 0.089196
ANOVA
Source of
Variation SS df MS F P-value F crit
Between
Groups 0.406105 2 0.203052 3.158367 0.043659 3.020455
Within Groups 23.46596 365 0.06429
Total 23.87207 367
Urban
Anova: Single Factor
SUMMARY
Groups Count Sum Average Variance
1 30 7.6 0.253333 0.038437
4 47 17 0.361702 0.108936
10 31 14.4 0.464516 0.105032
11 7 2.2 0.314286 0.038095
13 1 0.6 0.6 #DIV/0!
ANOVA
Source of
Variation SS df MS F P-value F crit
Between
Groups 0.752317 4 0.188079 2.196338 0.073973 2.453458
Within Groups 9.50527 111 0.085633
Total 10.25759 115
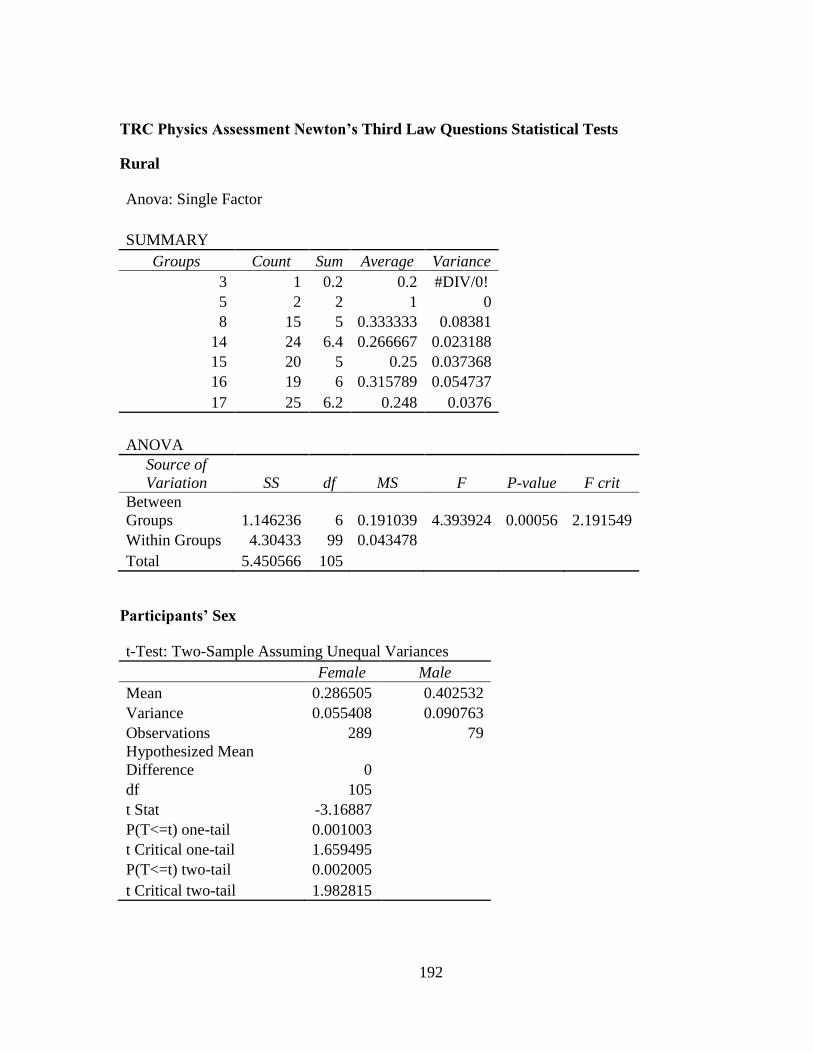
192
TRC Physics Assessment Newton’s Third Law Questions Statistical Tests
Rural
Anova: Single Factor
SUMMARY
Groups Count Sum Average Variance
3 1 0.2 0.2 #DIV/0!
5 2 2 1 0
8 15 5 0.333333 0.08381
14 24 6.4 0.266667 0.023188
15 20 5 0.25 0.037368
16 19 6 0.315789 0.054737
17 25 6.2 0.248 0.0376
ANOVA
Source of
Variation SS df MS F P-value F crit
Between
Groups 1.146236 6 0.191039 4.393924 0.00056 2.191549
Within Groups 4.30433 99 0.043478
Total 5.450566 105
Participants’ Sex
t-Test: Two-Sample Assuming Unequal Variances
Female Male
Mean 0.286505 0.402532
Variance 0.055408 0.090763
Observations 289 79
Hypothesized Mean
Difference 0
df 105
t Stat -3.16887
P(T<=t) one-tail 0.001003
t Critical one-tail 1.659495
P(T<=t) two-tail 0.002005
t Critical two-tail 1.982815
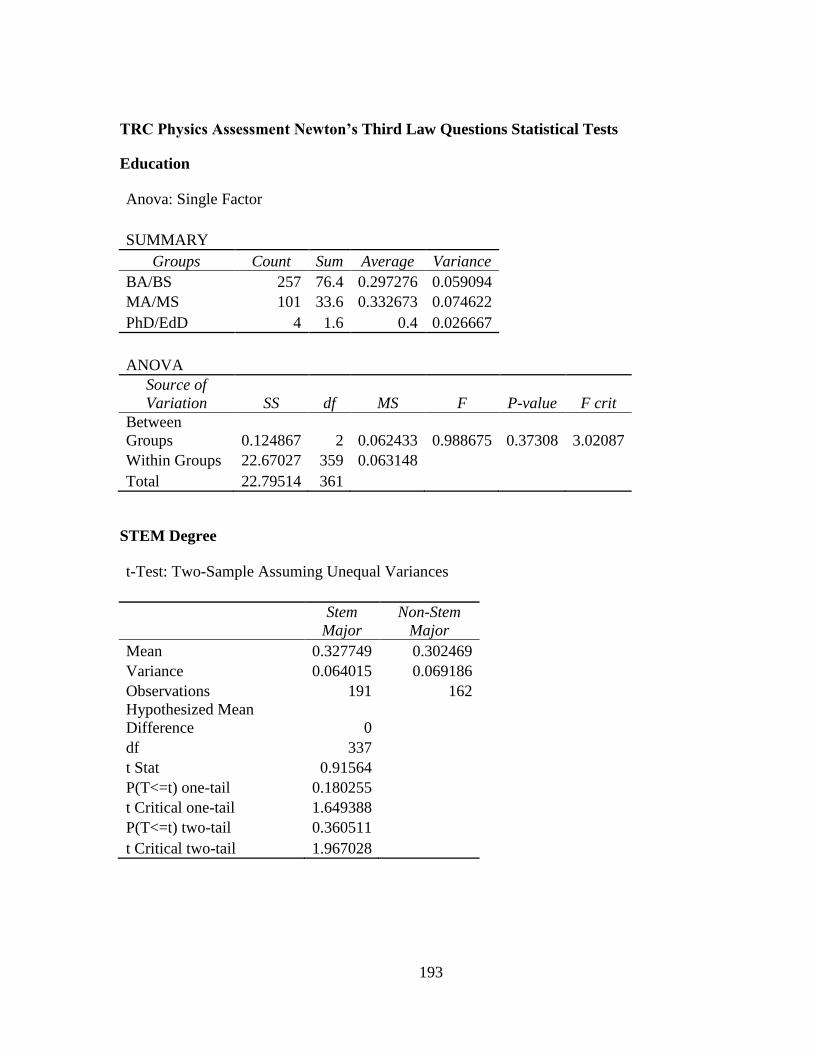
193
TRC Physics Assessment Newton’s Third Law Questions Statistical Tests
Education
Anova: Single Factor
SUMMARY
Groups Count Sum Average Variance
BA/BS 257 76.4 0.297276 0.059094
MA/MS 101 33.6 0.332673 0.074622
PhD/EdD 4 1.6 0.4 0.026667
ANOVA
Source of
Variation SS df MS F P-value F crit
Between
Groups 0.124867 2 0.062433 0.988675 0.37308 3.02087
Within Groups 22.67027 359 0.063148
Total 22.79514 361
STEM Degree
t-Test: Two-Sample Assuming Unequal Variances
Stem
Major
Non-Stem
Major
Mean 0.327749 0.302469
Variance 0.064015 0.069186
Observations 191 162
Hypothesized Mean
Difference 0
df 337
t Stat 0.91564
P(T<=t) one-tail 0.180255
t Critical one-tail 1.649388
P(T<=t) two-tail 0.360511
t Critical two-tail 1.967028
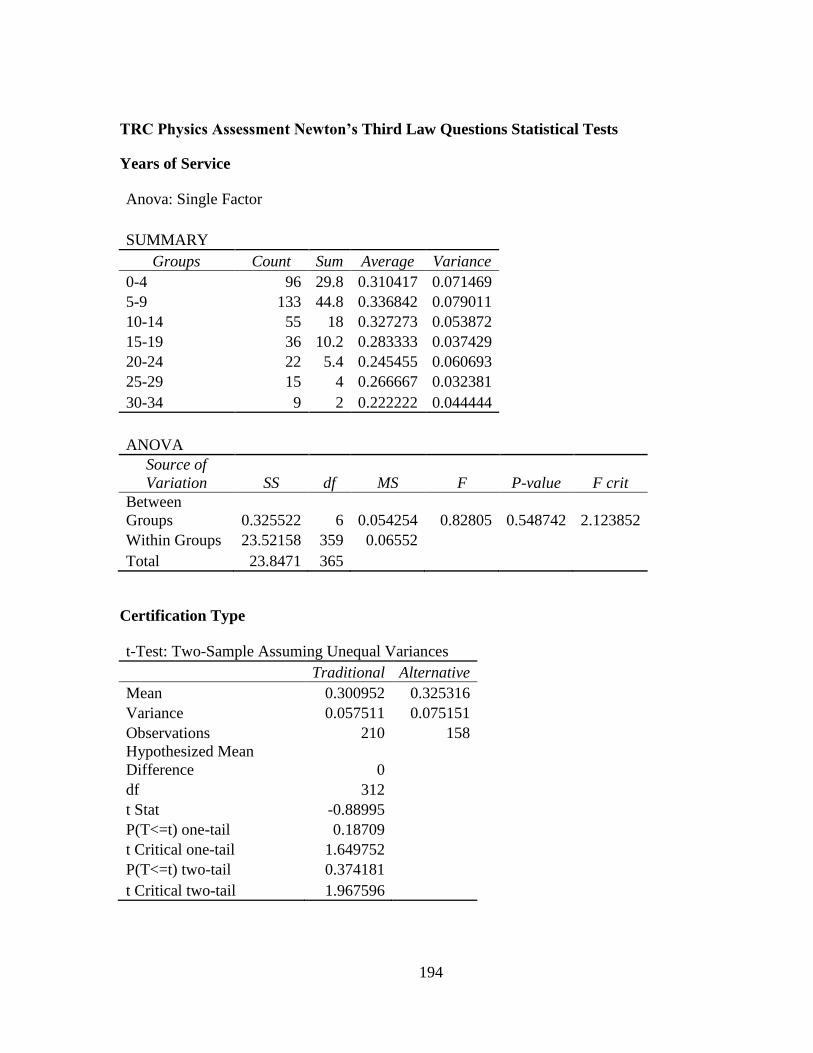
194
TRC Physics Assessment Newton’s Third Law Questions Statistical Tests
Years of Service
Anova: Single Factor
SUMMARY
Groups Count Sum Average Variance
0-4 96 29.8 0.310417 0.071469
5-9 133 44.8 0.336842 0.079011
10-14 55 18 0.327273 0.053872
15-19 36 10.2 0.283333 0.037429
20-24 22 5.4 0.245455 0.060693
25-29 15 4 0.266667 0.032381
30-34 9 2 0.222222 0.044444
ANOVA
Source of
Variation SS df MS F P-value F crit
Between
Groups 0.325522 6 0.054254 0.82805 0.548742 2.123852
Within Groups 23.52158 359 0.06552
Total 23.8471 365
Certification Type
t-Test: Two-Sample Assuming Unequal Variances
Traditional Alternative
Mean 0.300952 0.325316
Variance 0.057511 0.075151
Observations 210 158
Hypothesized Mean
Difference 0
df 312
t Stat -0.88995
P(T<=t) one-tail 0.18709
t Critical one-tail 1.649752
P(T<=t) two-tail 0.374181
t Critical two-tail 1.967596
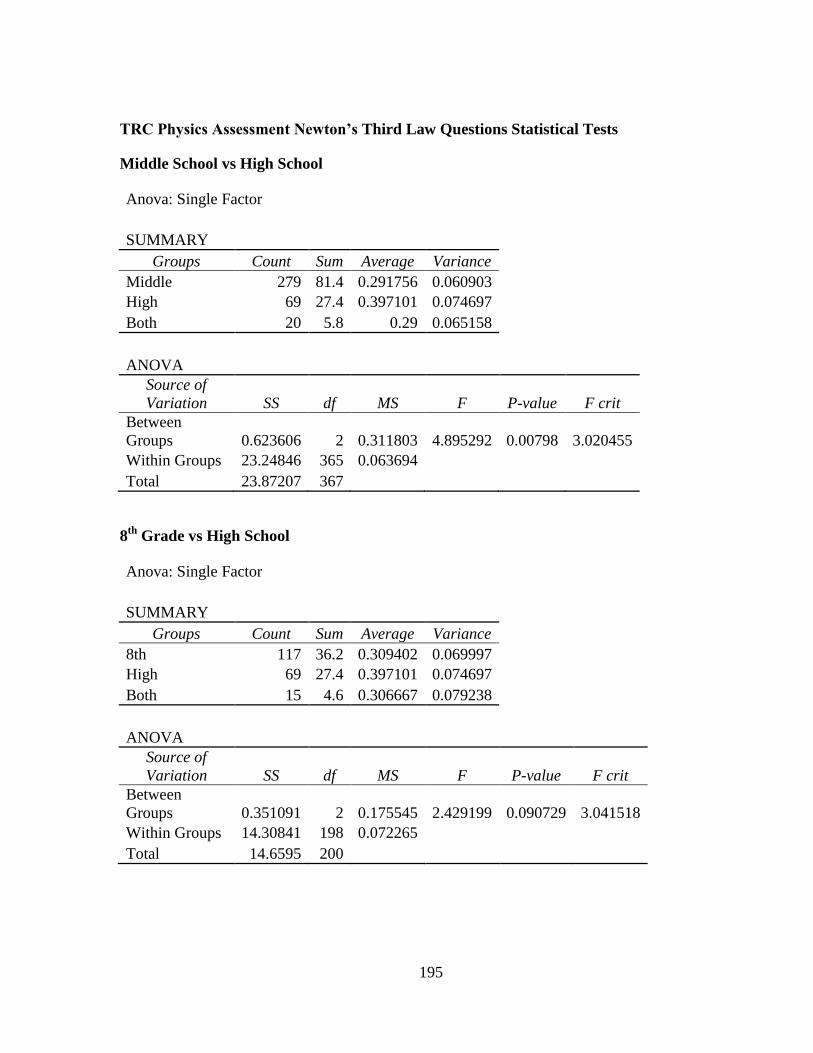
195
TRC Physics Assessment Newton’s Third Law Questions Statistical Tests
Middle School vs High School
Anova: Single Factor
SUMMARY
Groups Count Sum Average Variance
Middle 279 81.4 0.291756 0.060903
High 69 27.4 0.397101 0.074697
Both 20 5.8 0.29 0.065158
ANOVA
Source of
Variation SS df MS F P-value F crit
Between
Groups 0.623606 2 0.311803 4.895292 0.00798 3.020455
Within Groups 23.24846 365 0.063694
Total 23.87207 367
8th
Grade vs High School
Anova: Single Factor
SUMMARY
Groups Count Sum Average Variance
8th 117 36.2 0.309402 0.069997
High 69 27.4 0.397101 0.074697
Both 15 4.6 0.306667 0.079238
ANOVA
Source of
Variation SS df MS F P-value F crit
Between
Groups 0.351091 2 0.175545 2.429199 0.090729 3.041518
Within Groups 14.30841 198 0.072265
Total 14.6595 200
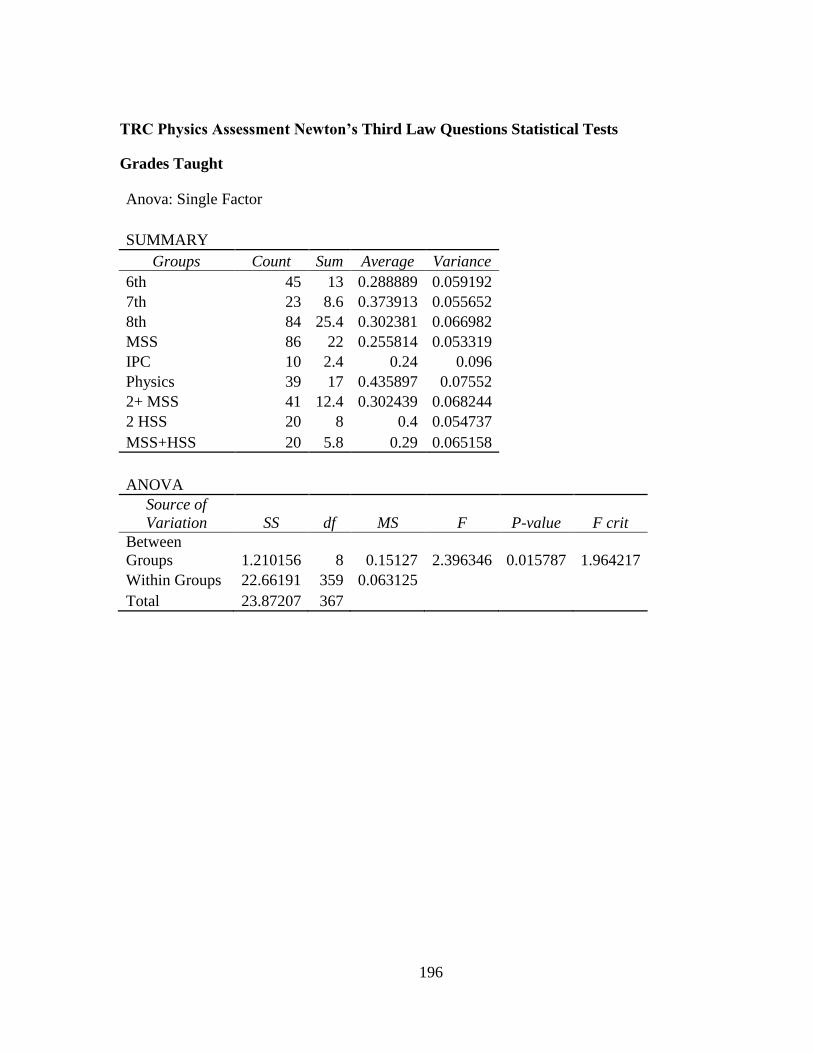
196
TRC Physics Assessment Newton’s Third Law Questions Statistical Tests
Grades Taught
Anova: Single Factor
SUMMARY
Groups Count Sum Average Variance
6th 45 13 0.288889 0.059192
7th 23 8.6 0.373913 0.055652
8th 84 25.4 0.302381 0.066982
MSS 86 22 0.255814 0.053319
IPC 10 2.4 0.24 0.096
Physics 39 17 0.435897 0.07552
2+ MSS 41 12.4 0.302439 0.068244
2 HSS 20 8 0.4 0.054737
MSS+HSS 20 5.8 0.29 0.065158
ANOVA
Source of
Variation SS df MS F P-value F crit
Between
Groups 1.210156 8 0.15127 2.396346 0.015787 1.964217
Within Groups 22.66191 359 0.063125
Total 23.87207 367
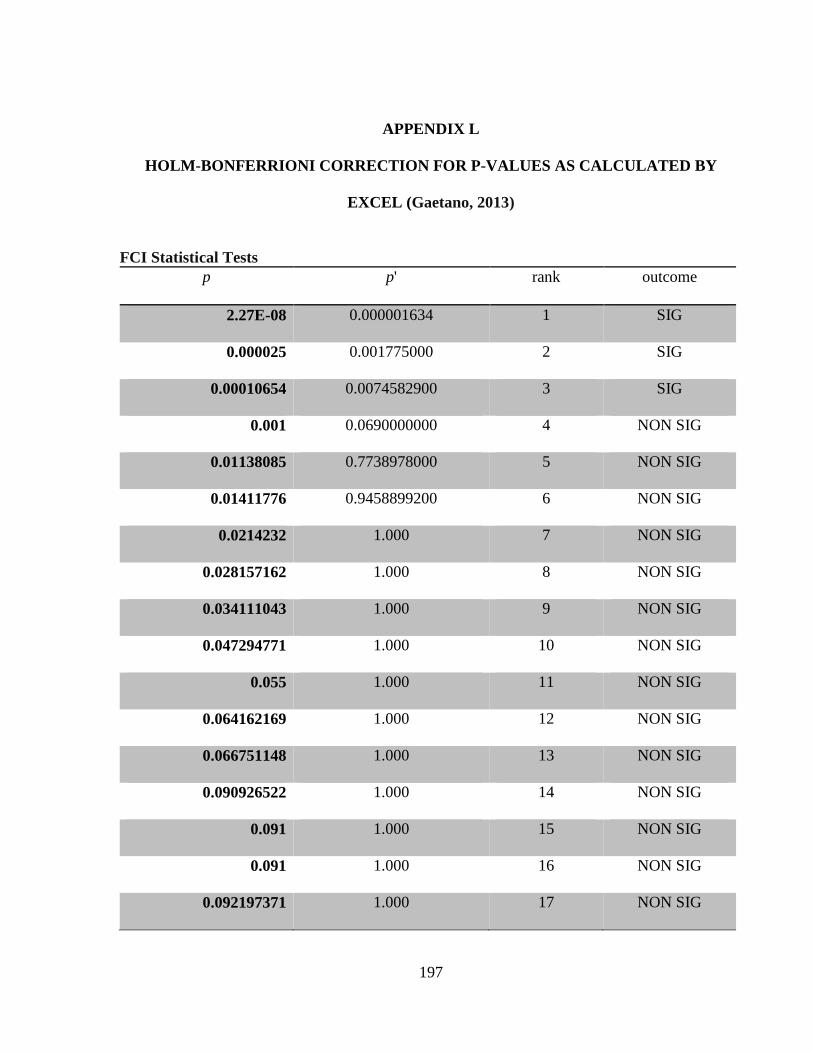
197
APPENDIX L
HOLM-BONFERRIONI CORRECTION FOR P-VALUES AS CALCULATED BY
EXCEL (Gaetano, 2013)
FCI Statistical Tests
p p' rank outcome
2.27E-08 0.000001634 1 SIG
0.000025 0.001775000 2 SIG
0.00010654 0.0074582900 3 SIG
0.001 0.0690000000 4 NON SIG
0.01138085 0.7738978000 5 NON SIG
0.01411776 0.9458899200 6 NON SIG
0.0214232 1.000 7 NON SIG
0.028157162 1.000 8 NON SIG
0.034111043 1.000 9 NON SIG
0.047294771 1.000 10 NON SIG
0.055 1.000 11 NON SIG
0.064162169 1.000 12 NON SIG
0.066751148 1.000 13 NON SIG
0.090926522 1.000 14 NON SIG
0.091 1.000 15 NON SIG
0.091 1.000 16 NON SIG
0.092197371 1.000 17 NON SIG
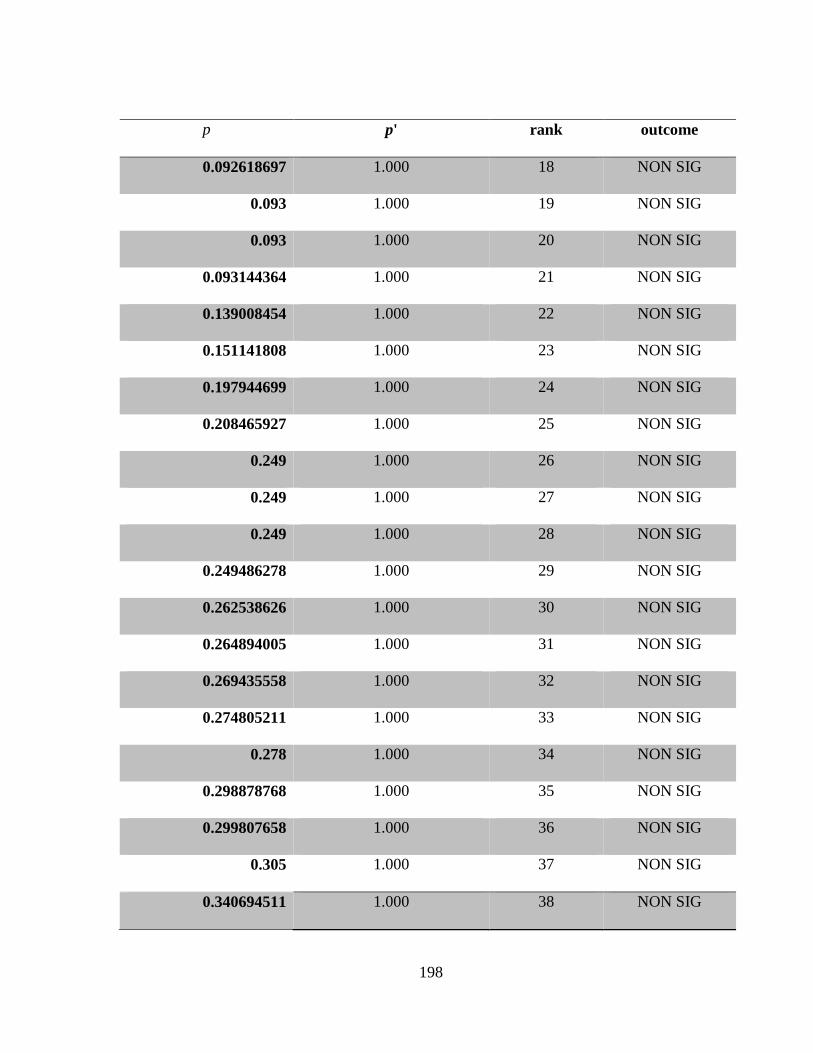
198
p p' rank outcome
0.092618697 1.000 18 NON SIG
0.093 1.000 19 NON SIG
0.093 1.000 20 NON SIG
0.093144364 1.000 21 NON SIG
0.139008454 1.000 22 NON SIG
0.151141808 1.000 23 NON SIG
0.197944699 1.000 24 NON SIG
0.208465927 1.000 25 NON SIG
0.249 1.000 26 NON SIG
0.249 1.000 27 NON SIG
0.249 1.000 28 NON SIG
0.249486278 1.000 29 NON SIG
0.262538626 1.000 30 NON SIG
0.264894005 1.000 31 NON SIG
0.269435558 1.000 32 NON SIG
0.274805211 1.000 33 NON SIG
0.278 1.000 34 NON SIG
0.298878768 1.000 35 NON SIG
0.299807658 1.000 36 NON SIG
0.305 1.000 37 NON SIG
0.340694511 1.000 38 NON SIG
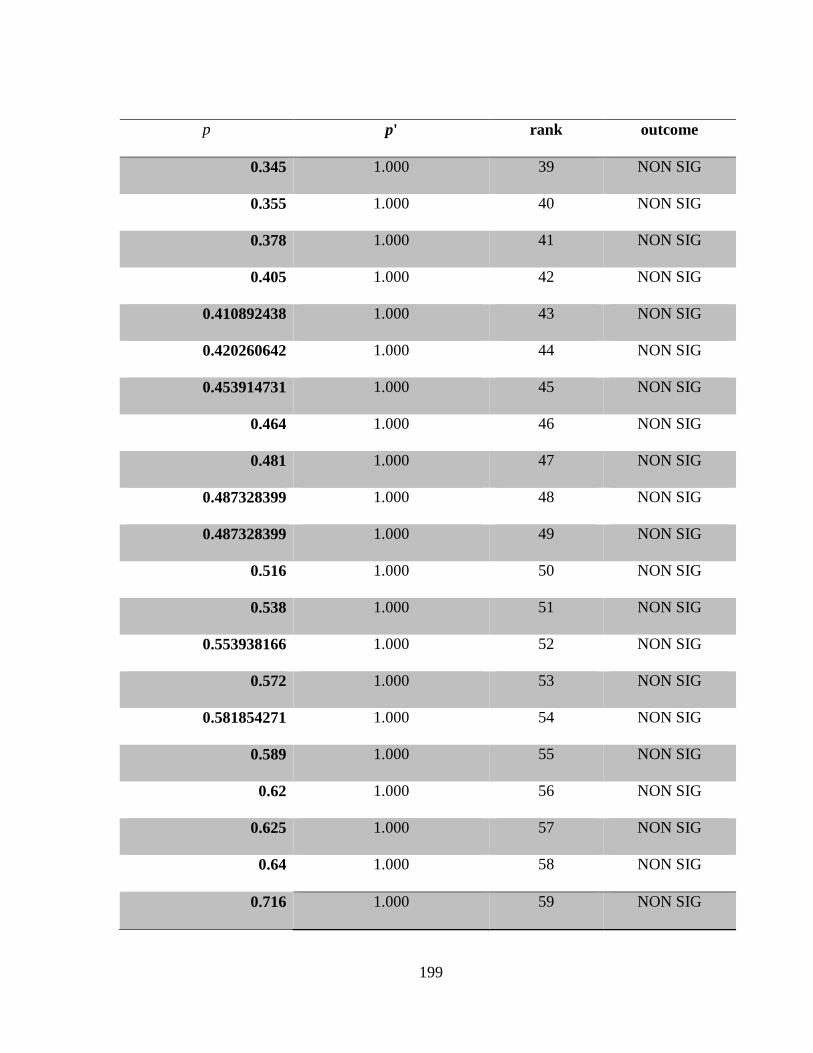
199
p p' rank outcome
0.345 1.000 39 NON SIG
0.355 1.000 40 NON SIG
0.378 1.000 41 NON SIG
0.405 1.000 42 NON SIG
0.410892438 1.000 43 NON SIG
0.420260642 1.000 44 NON SIG
0.453914731 1.000 45 NON SIG
0.464 1.000 46 NON SIG
0.481 1.000 47 NON SIG
0.487328399 1.000 48 NON SIG
0.487328399 1.000 49 NON SIG
0.516 1.000 50 NON SIG
0.538 1.000 51 NON SIG
0.553938166 1.000 52 NON SIG
0.572 1.000 53 NON SIG
0.581854271 1.000 54 NON SIG
0.589 1.000 55 NON SIG
0.62 1.000 56 NON SIG
0.625 1.000 57 NON SIG
0.64 1.000 58 NON SIG
0.716 1.000 59 NON SIG
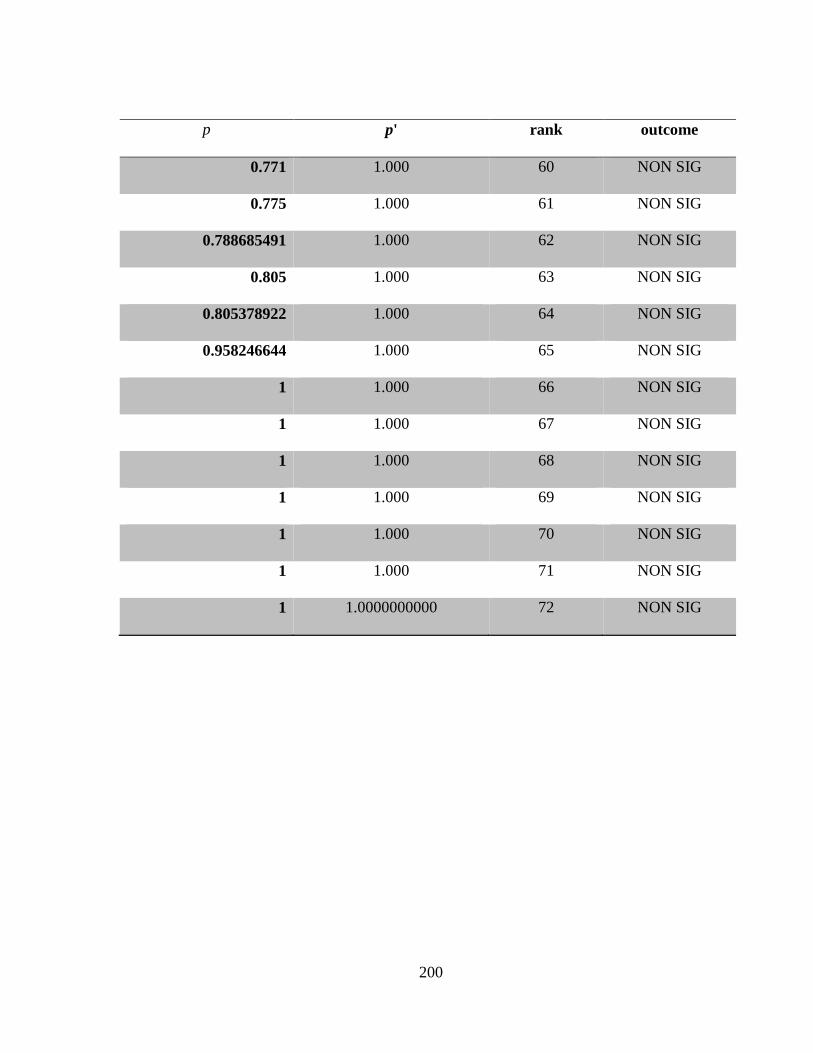
200
p p' rank outcome
0.771 1.000 60 NON SIG
0.775 1.000 61 NON SIG
0.788685491 1.000 62 NON SIG
0.805 1.000 63 NON SIG
0.805378922 1.000 64 NON SIG
0.958246644 1.000 65 NON SIG
1 1.000 66 NON SIG
1 1.000 67 NON SIG
1 1.000 68 NON SIG
1 1.000 69 NON SIG
1 1.000 70 NON SIG
1 1.000 71 NON SIG
1 1.0000000000 72 NON SIG
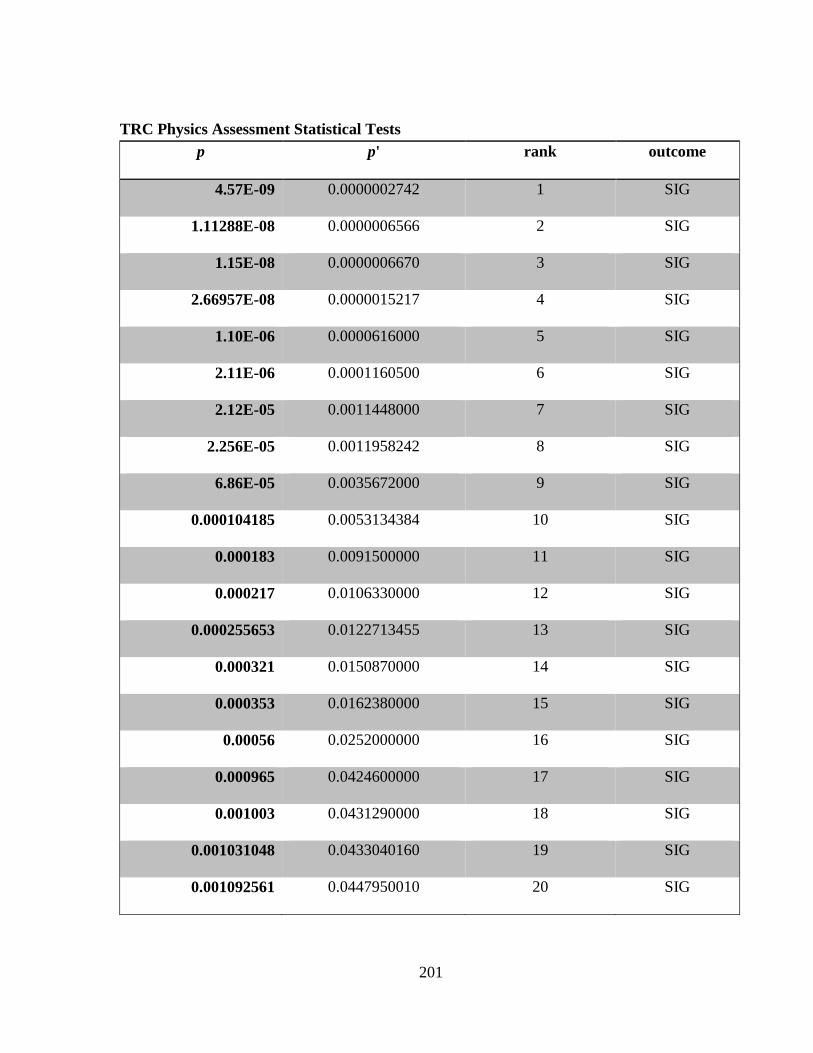
201
TRC Physics Assessment Statistical Tests
p p' rank outcome
4.57E-09 0.0000002742 1 SIG
1.11288E-08 0.0000006566 2 SIG
1.15E-08 0.0000006670 3 SIG
2.66957E-08 0.0000015217 4 SIG
1.10E-06 0.0000616000 5 SIG
2.11E-06 0.0001160500 6 SIG
2.12E-05 0.0011448000 7 SIG
2.256E-05 0.0011958242 8 SIG
6.86E-05 0.0035672000 9 SIG
0.000104185 0.0053134384 10 SIG
0.000183 0.0091500000 11 SIG
0.000217 0.0106330000 12 SIG
0.000255653 0.0122713455 13 SIG
0.000321 0.0150870000 14 SIG
0.000353 0.0162380000 15 SIG
0.00056 0.0252000000 16 SIG
0.000965 0.0424600000 17 SIG
0.001003 0.0431290000 18 SIG
0.001031048 0.0433040160 19 SIG
0.001092561 0.0447950010 20 SIG
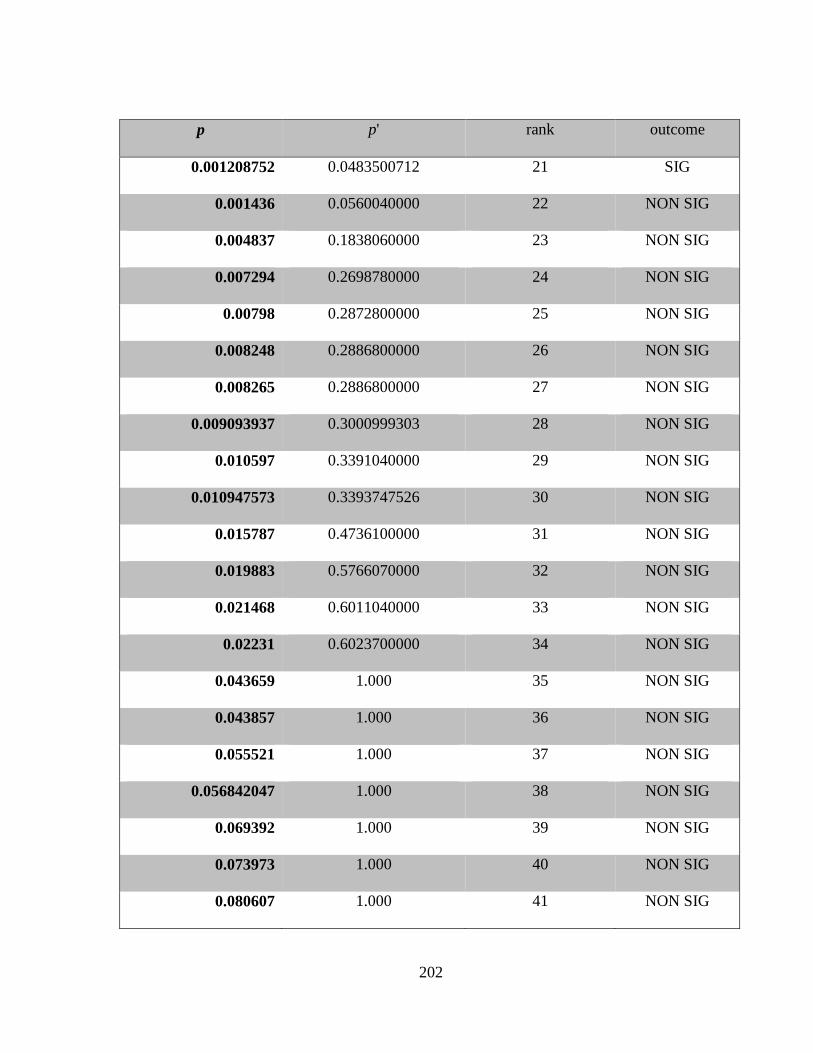
202
p p' rank outcome
0.001208752 0.0483500712 21 SIG
0.001436 0.0560040000 22 NON SIG
0.004837 0.1838060000 23 NON SIG
0.007294 0.2698780000 24 NON SIG
0.00798 0.2872800000 25 NON SIG
0.008248 0.2886800000 26 NON SIG
0.008265 0.2886800000 27 NON SIG
0.009093937 0.3000999303 28 NON SIG
0.010597 0.3391040000 29 NON SIG
0.010947573 0.3393747526 30 NON SIG
0.015787 0.4736100000 31 NON SIG
0.019883 0.5766070000 32 NON SIG
0.021468 0.6011040000 33 NON SIG
0.02231 0.6023700000 34 NON SIG
0.043659 1.000 35 NON SIG
0.043857 1.000 36 NON SIG
0.055521 1.000 37 NON SIG
0.056842047 1.000 38 NON SIG
0.069392 1.000 39 NON SIG
0.073973 1.000 40 NON SIG
0.080607 1.000 41 NON SIG
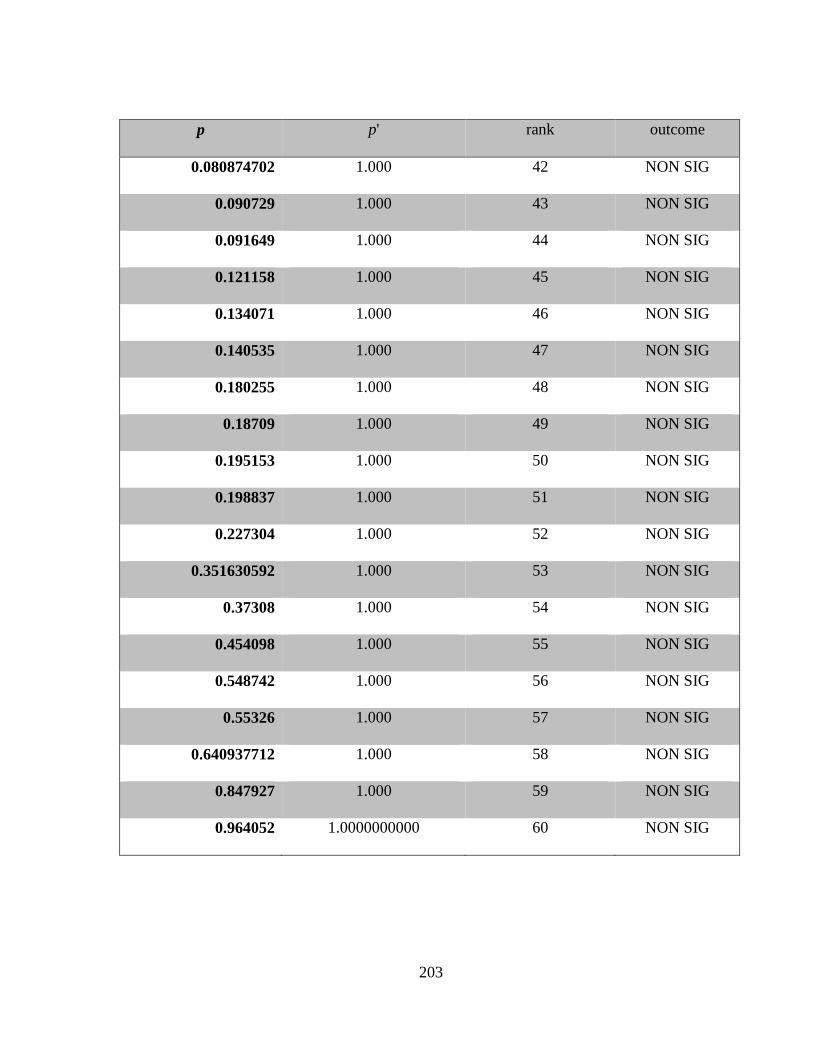
203
p p' rank outcome
0.080874702 1.000 42 NON SIG
0.090729 1.000 43 NON SIG
0.091649 1.000 44 NON SIG
0.121158 1.000 45 NON SIG
0.134071 1.000 46 NON SIG
0.140535 1.000 47 NON SIG
0.180255 1.000 48 NON SIG
0.18709 1.000 49 NON SIG
0.195153 1.000 50 NON SIG
0.198837 1.000 51 NON SIG
0.227304 1.000 52 NON SIG
0.351630592 1.000 53 NON SIG
0.37308 1.000 54 NON SIG
0.454098 1.000 55 NON SIG
0.548742 1.000 56 NON SIG
0.55326 1.000 57 NON SIG
0.640937712 1.000 58 NON SIG
0.847927 1.000 59 NON SIG
0.964052 1.0000000000 60 NON SIG
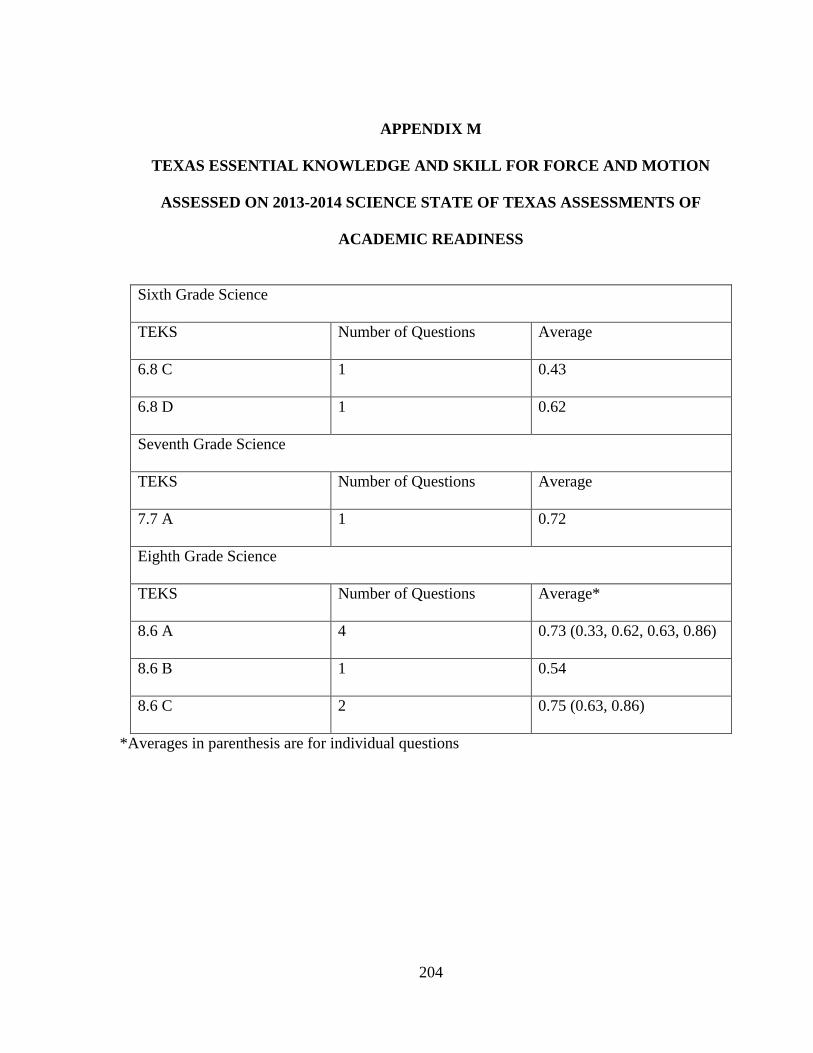
204
APPENDIX M
TEXAS ESSENTIAL KNOWLEDGE AND SKILL FOR FORCE AND MOTION
ASSESSED ON 2013-2014 SCIENCE STATE OF TEXAS ASSESSMENTS OF
ACADEMIC READINESS
Sixth Grade Science
TEKS Number of Questions Average
6.8 C 1 0.43
6.8 D 1 0.62
Seventh Grade Science
TEKS Number of Questions Average
7.7 A 1 0.72
Eighth Grade Science
TEKS Number of Questions Average*
8.6 A 4 0.73 (0.33, 0.62, 0.63, 0.86)
8.6 B 1 0.54
8.6 C 2 0.75 (0.63, 0.86)
*Averages in parenthesis are for individual questions
205
REFERENCES
Abdi, H., (2010). Holm’s Sequential Bonferroni Procedure. In N. Salkind (Ed.), Encyclopedia of
research design. (pp 1-8). Thousand Oaks, CA: Sage.
Abell, S. K., (2007). Research on science teacher knowledge. In S.K. Abell & N. G. Lederman
(Eds.), Handbook of research on science education. (pp 1105-1150). Hillsdale, NJ:
Lawrence Erlbaum.
Allen, M., & Coole, H. (2012). Experimenter confirmation bias and the correction of science
misconceptions. Journal of Science Teacher Education, 23(4), 387-405.
American Association for the Advancement of Science. (1993). Benchmarks for science literacy,
Project 2061. New York: Oxford University Press.
American Association of Physics Teachers. (1988). The role, education, and qualifications of the
high school physics teacher. College Park: AAPT Committee on Special Projects for
High School Physics.
Arzi, H. J., & White, R. T. (2007). Change in teachers’ knowledge of subject matter: A 17- year
longitudinal study. Science Education, 92(2), 221-251.
Asikainen, M. A., & Hirvonen, P. E. (2014). Probing pre- and in-service physics teachers’
knowledge using the double-slit thought experiment. Science & Education, 23(9), 1811-
1833.
Berg, T., & Brouwer, W. (1991). Teacher awareness of student alternate conceptions about
rotational motion and gravity. Journal of Research in Science Teaching, 28(1), 3-18.
Burgoon, J. N., Heddle, M. L., & Duran, E. (2009). Re-examining the similarities between
teacher and student conceptions about physical science. Journal of Science Education,
21(1), 859-872.
Cochran, K., & Jones, L. (1998). The subject matter knowledge of preservice science teachers. In
B. J. Fraser & K. G. Tobin (Eds.), International handbook of science education (pp. 707–
718). Dordrecht, The Netherlands: Kluwer Academic Publishers.
Deng, Z. (2007). Knowing the subject matter of a secondary-school science subject. Journal of
Curriculum Studies, 39(5), 503-505.
Daehler, K. R., Shinohara, M., & Folsom, J. (2011). Making sense of science, Force and motion
for teachers of grades 6-8. San Francisco, CA: WestEd.
206
Etkina, E. (2010). Pedagogical content knowledge and preparation of high school physics
teachers. Physical Review Special Topics- Physics Education Research, 6(2), 020110-1.
Galili, I., & Lehavi, Y. (2006) Definitions of physical concepts: A study of physics teachers’
knowledge and views. International Journal of Science Education, 28(5), 521-541.
Gaetano J. (2013). Holm-Bonferroni sequential correction: An EXCEL calculator (1.2)
[Microsoft Excel workbook].
Ginns, I. S., & Watters, J. J. (1995). An analysis of scientific understandings of preservice
elementary teacher education students. Journal of Research in Science Teaching, 32(2),
205-222.
Gönen, S. (2008). A study on student teachers’ misconceptions and scientifically acceptable
conceptions about mass and gravity. Journal of Science Education & Technology, 17(1),
70-81.
Harrell, P. E. (2010). Teaching an integrated science curriculum: Linking teacher knowledge and
teaching assignments. Issues in Teacher Education, 19(1), 145-165.
Hashweh, M. Z. (1987). Effects of subject-matter knowledge in the teaching of biology and
physics. Teaching & Teacher Education, 3(2), 109-120.
Hestenes, D. & Halloun, I. (1995) Interpreting the force concept inventory: A response to March
1995 critique by Huffman and Heller. The Physics Teacher, 33, 502-506.
Hestenes, D., Wells, M., & Swackhamer, G. (1992). Force concept inventory. The Physics
Teacher, 30, 141-158.
Hill, H. C., Rowan, B., & Ball D. L. (2005). Effects of teachers’ mathematical knowledge for
teaching on student achievement. American Educational Research Journal, 42(2), 371-
406.
Hill, J.G., & Gruber, K. J. (2011). Education and certification qualifications of departmentalized
public high school-level teachers of cores subjects: Evidence from the 2007-08 schools
and staffing survey. U.S. Department of Education. Institute of Education Sciences,
National Center for Education Statistics.
Jackson, J. (2016, October). Evaluation Instruments. Retrieved from
http://modeling.asu.edu/R&E/Research.html.
Kikas, E. (2004). Teachers’ conceptions and misconceptions concerning three natural
phenomena. Journal of Research in Science Teaching, 41(5), 435-448.
207
Kind, V. (2014). A Degree is Not Enough: A quantitative study of aspects of pre-service
teachers’ chemistry content knowledge. International Journal of Science Education,
36(8), 1313-1345.
Kind, V., & Kind P. M. (2011). Beginning to teach chemistry: How personal and academic
characteristics of pre-service science teachers compare with their understandings of basic
chemical ideas. International Journal of Science Education, 33(15), 2123-2158.
Kruger, C., Palacio, D., & Summers, M. (1990). A survey of primary school teachers’
conceptions of force and motion. Educational Research, 32, 83-95.
Kruger, C., Palacio, D., & Summers, M. (1992). Surveys of English primary teachers’
conceptions of force, energy, and materials. Science Education, 76(4), 339-351.
Kruger, C. J., Summers, M. K., & Palacio, D. J. (1990). An investigation of some English
primary school teachers’ understanding of the concepts of force and gravity. British
Educational Research Journal, 16 (4), 383-397.
Mäntylä, T., & Nousiainen (2014). Consolidating pre-service physics teachers’ subject matter
knowledge using didactical reconstructions. Science & Education, 23(8), 1583-1604.
National Research Council. (2005). How students learn: Science in the classroom. Washington,
DC: National Academy Press.
Next Generation Science Standards. (2013). Next Generation Science Standards: For States, By
States MS. Forces and Interactions. Retrieved from http://www.nextgenscience.org/topic-
arrangement/msforces-and-interactions.
Neuschatz, M., & McFarling, M. (2000). Background and professional qualifications of high-
school physics teacher. The Physics Teacher, 38(2), 98-104.
Ohle, A., Boone, W. J., & Fischer, H. E. (2015). Investigating the impact of teachers’ physics ck
on students outcomes. International Journal of Science and Mathematics Education,
13(6), 1211-1233.
Panizzon, D., Westwell, M., & Elliott, K. (2010). Exploring the profile of teachers of secondary
science: What are the emerging issues for future workforce planning? Teaching Science,
56(4), 18-24.
Poutot, G. & Blandin, B. (2015) Exploration of students’ misconception in mechanics using the
FCI. American Journal of Educational Research, 3(2), 116-120.
208
Public Education Information Management System (2017). Student enrollment reports statewide
region totals, 2013-2014. Retrieved from
https://rptsvr1.tea.texas.gov/adhocrpt/adste.html.
Ralya, L. L., & Ralya L. L. (1938). Some misconceptions in science held by prospective
elementary teachers. Science Education, 22(5), 244-251.
Sadler, P. M., Sonnert, G., Coyle, H. P., Cook-Smith, N., & Miller, J. L. (2013). The influence of
teachers’ knowledge on student learning in middle school physical science classrooms.
American Educational Research Journal, 50(5), 1020-1049.
Shapiro, J.R. & Williams, A.M. (2012). The role of stereotype threats in undermining girls’ and
women’s performance and interest in STEM fields. Sex Roles, 66(3), 175-183.
Snyder, T.D., de Brey, C., and Dillow, S.A. (2016). Digest of Education Statistics 2015 (NCES
2016-014). National Center for Education Statistics, Institute of Education Sciences, U.S.
Department of Education. Washington, DC.
Texas Education Agency (2015). Texas Essential Knowledge and Skills. 19 TAC Chapter 231.
Requirements for Public School Personnel Assignments. Retrieved from
http://ritter.tea.state.tx.us/sbecrules/tac/chapter231/index.html.
Texas Education Agency (2010). 19 TAC Chapter 112. Texas Essential Knowledge and Skills for
Science. Retrieved from http://ritter.tea.state.tx.us/rules/tac/chapter112/.
Texas Regional Collaborative for Excellence in Science and Mathematics Teaching (2013).
Texas Regional Collaborative Mathematics and Science RFA 2013-2014 Grants. Austin,
TX: Author.
Thornton, R. K., & Sokoloff, D. R. (1998). Assessing student learning of Newton’s laws: The
force and motion conceptual evaluation and the evaluation of active learning laboratory
and lecture curricula, American Journal of Physics, 66(4), 338-352.
Trumper, R. (1991). A longitudinal study of physics students’ conceptions of force in pre-service
training for high school teachers. European Journal of Teacher Education, 22(2), 247-
256.
Urquhart, M. (2017, April, 4). Email communication with K Busby.
Wayne, J. A., & Youngs, P. (2003). Teacher characteristics and student achievement gains: A
review. Review of Educational Research, 73(1), 89.
209
Weinburgh, M. (1995), Gender differences in student attitudes toward science: A meta-analysis
of the literature from 1970 to 1991. Journal of Research in Science Teaching, 32, 387–
398.
Yip, D. Y., Chung, C. M., & Mak, S. Y. (1998). The subject matter knowledge in physics related
topics of Hong Kong junior secondary science teachers. Journal of Science Education
and Technology, 7(4), 319-328.
210
BIOGRAPHICAL SKETCH
Karin Therese Burk Busby was born in Fort Worth, Texas and raised in Carrollton, Texas. After
completing her schoolwork at Ursuline Academy of Dallas in Dallas, Texas in 2000, Karin
attended Austin College in Sherman, Texas. She received a Bachelor of Arts with a major in
communication arts from Austin College in May 2004. Upon graduation, she attended Dallas
Christian College in Farmers Branch, Texas for teacher preparation. She began teaching 5th
grade
in the fall of 2004. She taught 5th
grade for two years. In September 2006, she entered the
Graduate School of Southern Methodist University where she studied science and gifted
education. She married her husband, David Busby, in July 2007. She received a Master of
Education in science and gifted studies in May 2009. She graduated with honors. She delivered
her first child, Michael David, in January 2011. He was joined by his sister, Anastasia Claire in
September 2012. In July 2013, she entered the Graduate School of The University of Texas at
Dallas where she studied science education. She joined the Texas Regional Collaboratives for
Excellence in Science and Mathematics Teaching in May 2013. While attending graduate school,
she welcomed her third child, a son, Alexander Charles in December 2015. At time of
publication, Karin is expecting twin boys in the spring of 2017.
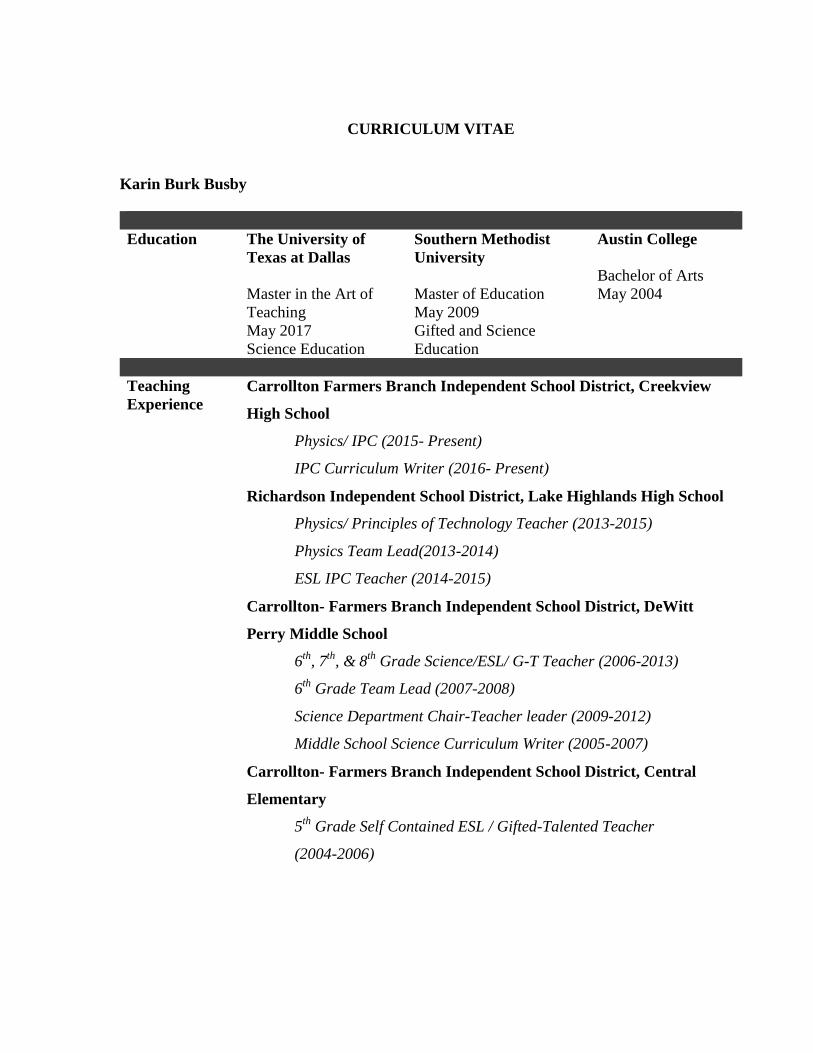
CURRICULUM VITAE
Karin Burk Busby
Education The University of
Texas at Dallas
Master in the Art of
Teaching
May 2017
Science Education
Southern Methodist
University
Master of Education
May 2009
Gifted and Science
Education
Austin College
Bachelor of Arts
May 2004
Teaching
Experience
Carrollton Farmers Branch Independent School District, Creekview
High School
Physics/ IPC (2015- Present)
IPC Curriculum Writer (2016- Present)
Richardson Independent School District, Lake Highlands High School
Physics/ Principles of Technology Teacher (2013-2015)
Physics Team Lead(2013-2014)
ESL IPC Teacher (2014-2015)
Carrollton- Farmers Branch Independent School District, DeWitt
Perry Middle School
6th
, 7th
, & 8th
Grade Science/ESL/ G-T Teacher (2006-2013)
6th
Grade Team Lead (2007-2008)
Science Department Chair-Teacher leader (2009-2012)
Middle School Science Curriculum Writer (2005-2007)
Carrollton- Farmers Branch Independent School District, Central
Elementary
5th
Grade Self Contained ESL / Gifted-Talented Teacher
(2004-2006)
Presentations
TRC Annual Meeting – June 16-18, 2015
Presenter- Just Graph It: Teaching Motion Graphs Conceptually.
Presented 5E lesson creating and evaluating kinematic graphs
conceptual.
Presenter- Is it Science or Math? Strategies to teach mathematical
concepts in the science classroom
Presented and demonstrated four methods to teaching mathematical
skills in the science classroom. Included significant figures,
balancing equations, and formula manipulation.
Presenter- Google it All.
Presented and demonstrated multiple uses for google apps for
education in the classroom
STAT CAST - Nov. 2014
Presenter- Graphing and You: Teaching Motion Graphs
Conceptually. Presented 5E lesson creating and evaluating
kinematic graphs conceptual.
Presenter- Is it Science or Math? Strategies to teach mathematical
concepts in the science classroom

Presentations Dallas/Fort Worth Metroplex MiniCAST- Feb 1, 2014
Presenter- Graphing and You: Teaching Motion Graphs
Conceptually.
Presenter- Don’t Flip out- 5 ways to Flip your Classroom.
Presented and demonstrated 5 ways to integrate technology into the
classroom. Include a variety of methods
Presenter- Is it Science or Math? Strategies to teach mathematical
concepts in the science classroom
World Council for Gifted and Talented Children 17th
Biennial World
Conference 2007 Aug. 5-10, 2007
Presenter- Building Vocabulary.
Presented action research over building science vocabulary for ELL
Gifted Students as part of SMU.
Honors/
Affiliations
Pi Lambda Theta Member
SMU Since 2009
Texas Regional Collaborative for Excellence in Science and
Mathematics
UT Dallas 2013-2016