by: claire riddell. a broken line graph is a graph, where the data points are connected with line...
TRANSCRIPT
Unit One VocabularyBy: Claire Riddell
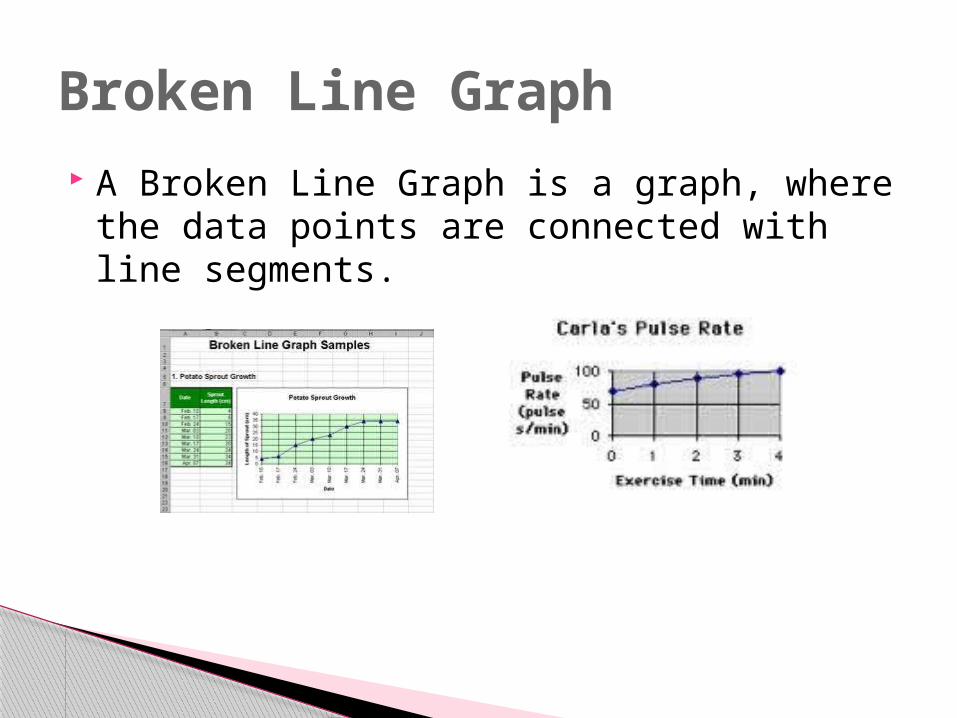
A Broken Line Graph is a graph, where the data points are connected with line segments.
Broken Line Graph
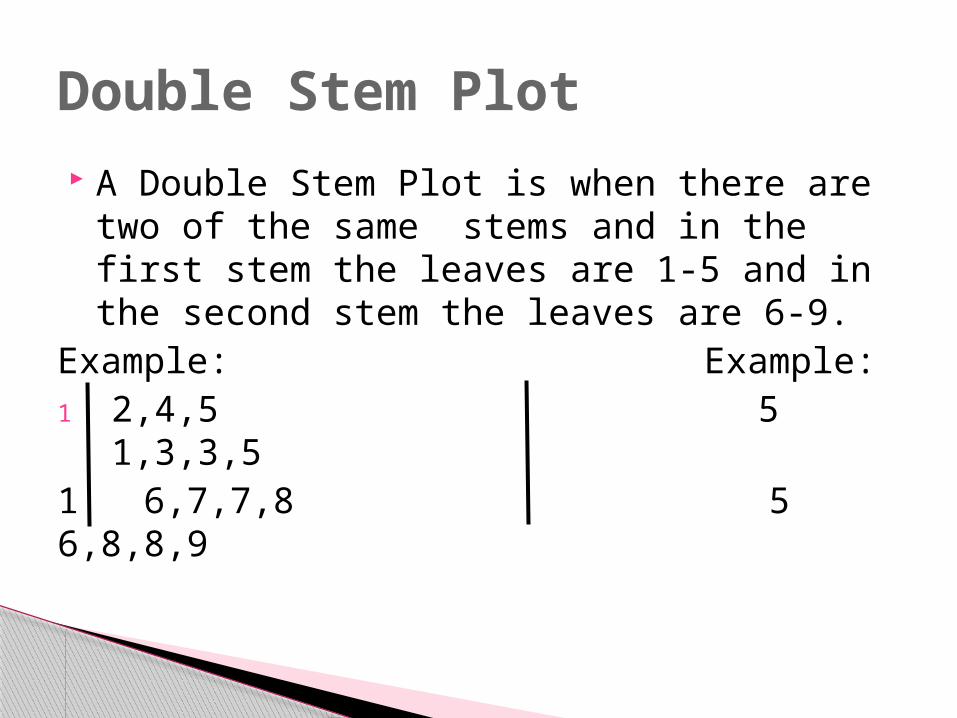
A Double Stem Plot is when there are two of the same stems and in the first stem the leaves are 1-5 and in the second stem the leaves are 6-9.
Example: Example:1 2,4,5 5 1,3,3,51 6,7,7,8 5 6,8,8,9
Double Stem Plot
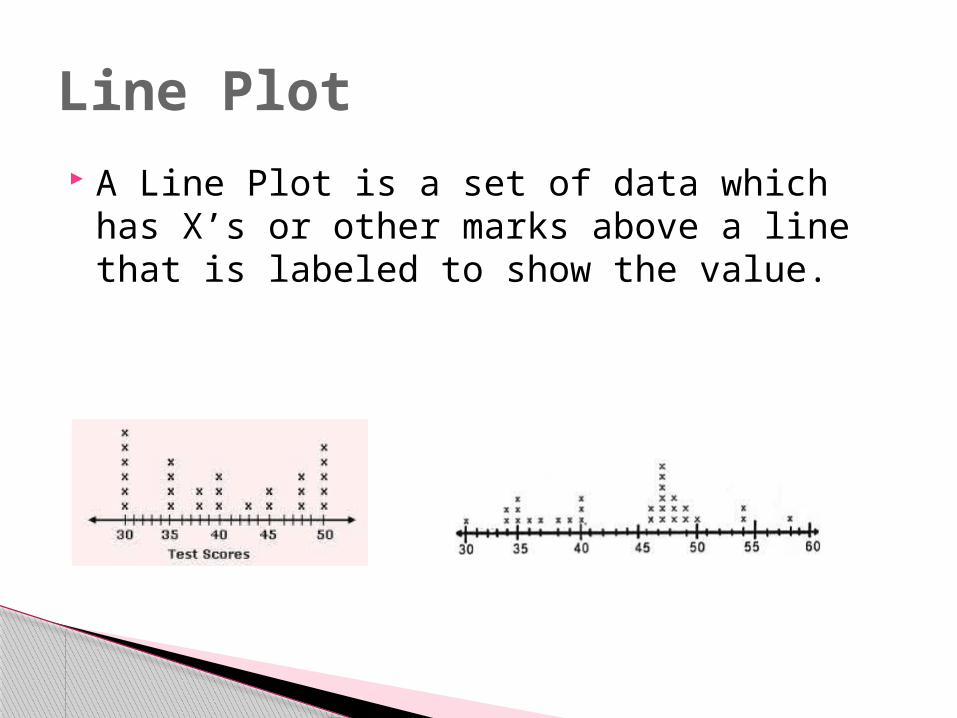
A Line Plot is a set of data which has X’s or other marks above a line that is labeled to show the value.
Line Plot
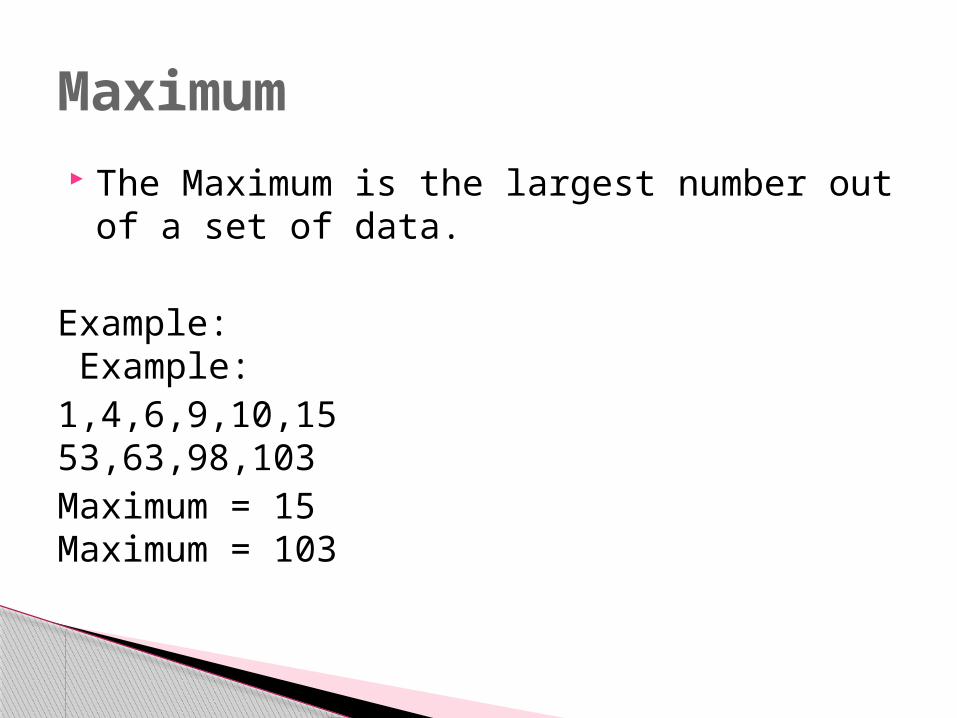
The Maximum is the largest number out of a set of data.
Example: Example:1,4,6,9,10,15 53,63,98,103Maximum = 15 Maximum = 103
Maximum
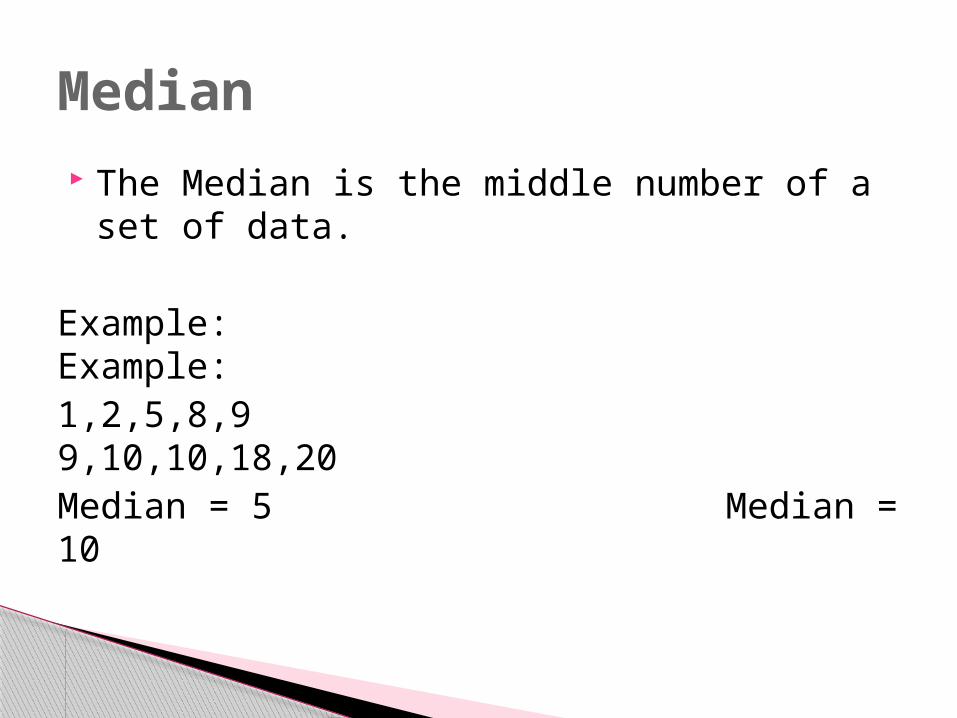
The Median is the middle number of a set of data.
Example: Example:1,2,5,8,9 9,10,10,18,20Median = 5 Median = 10
Median
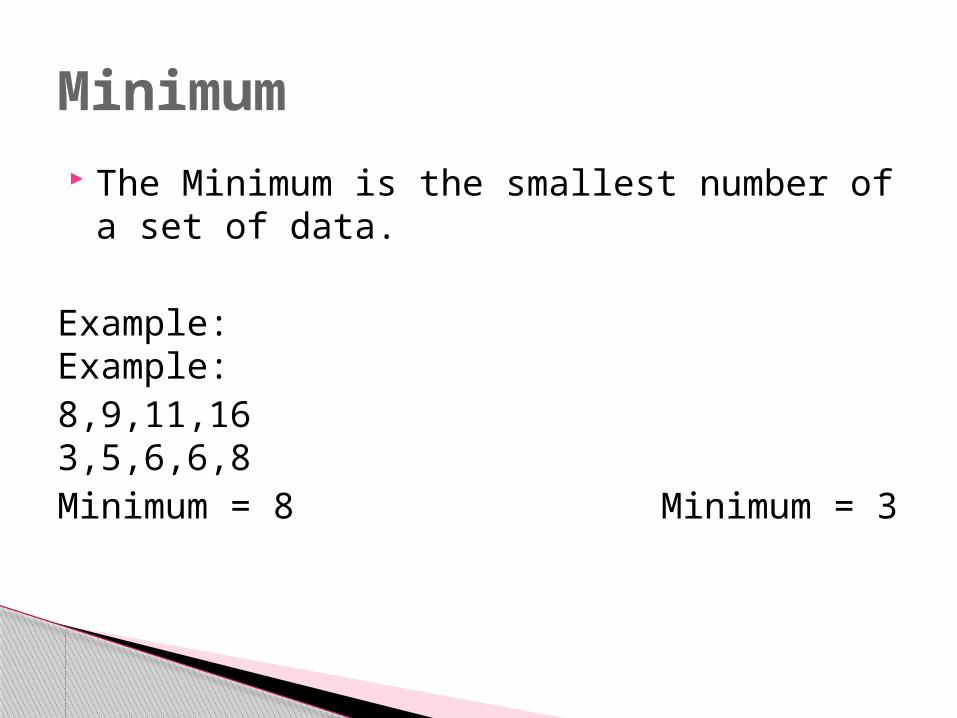
The Minimum is the smallest number of a set of data.
Example: Example:8,9,11,16 3,5,6,6,8Minimum = 8 Minimum = 3
Minimum
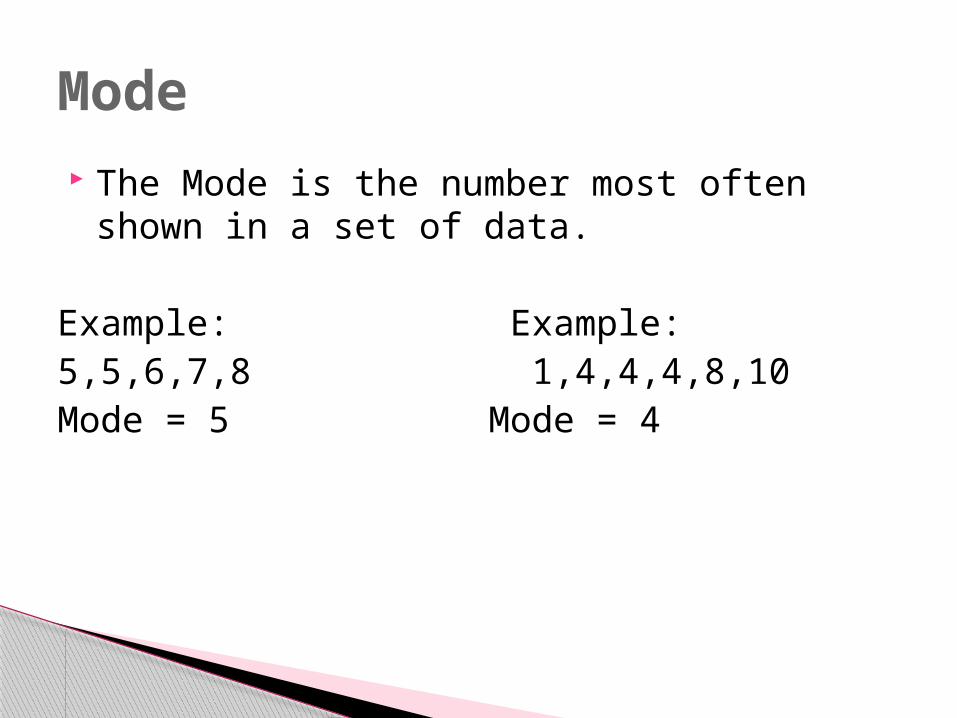
The Mode is the number most often shown in a set of data.
Example: Example:5,5,6,7,8 1,4,4,4,8,10Mode = 5 Mode = 4
Mode
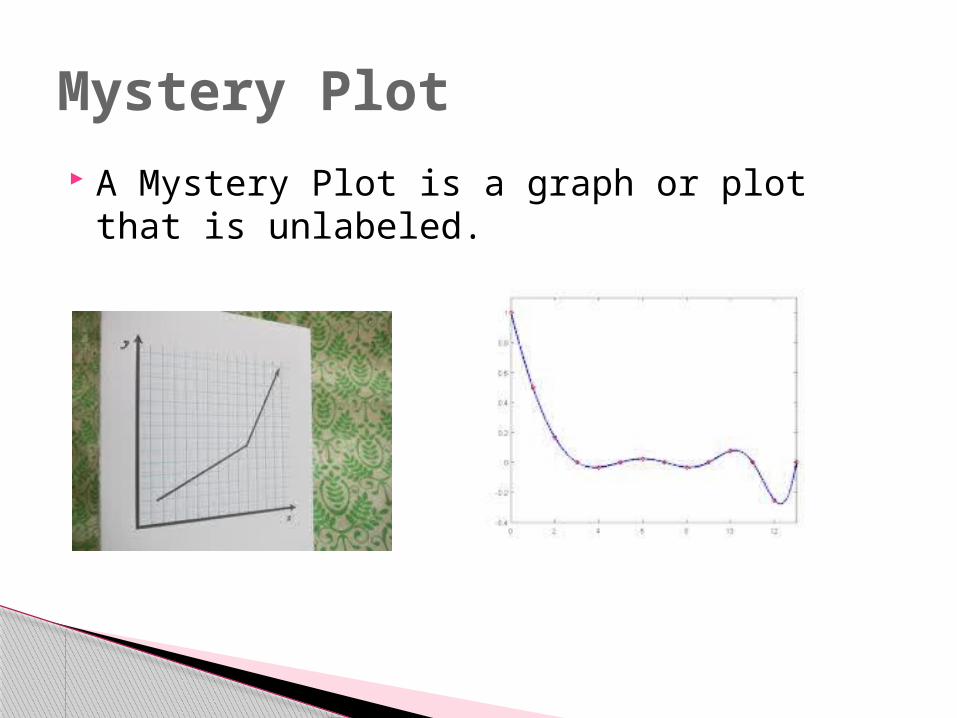
A Mystery Plot is a graph or plot that is unlabeled.
Mystery Plot
A Random Sample is a sample that gives the same amount of chance of being picked.Example:
1. Grab bag – put all the names in a bag and pick one out is a random sample
2. Computer Generated number is a random sample
Random Sample
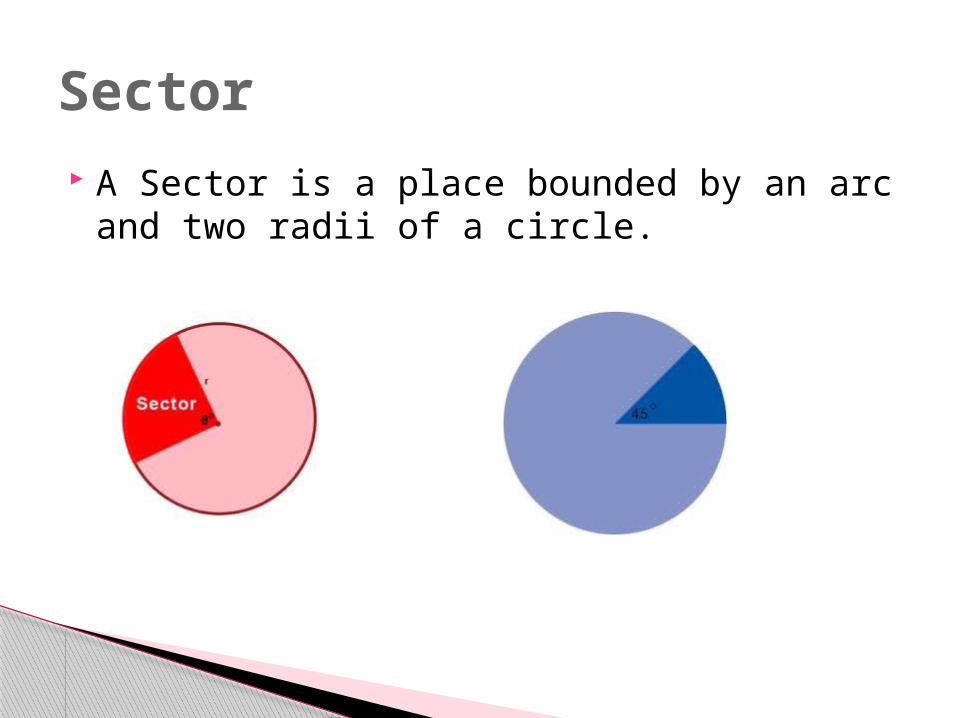
A Sector is a place bounded by an arc and two radii of a circle.
Sector
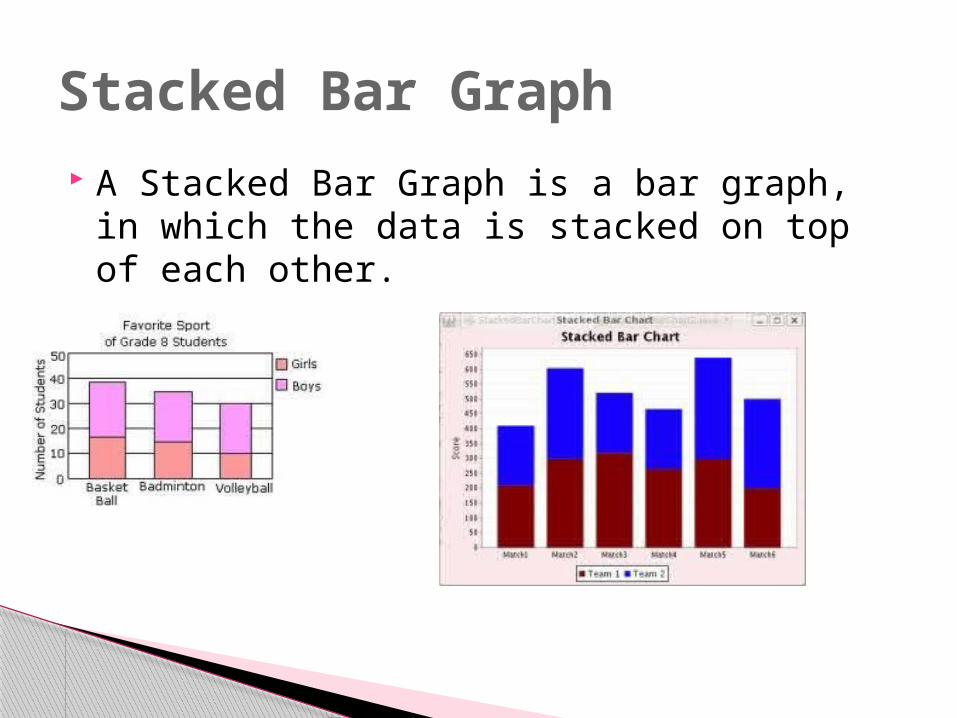
A Stacked Bar Graph is a bar graph, in which the data is stacked on top of each other.
Stacked Bar Graph
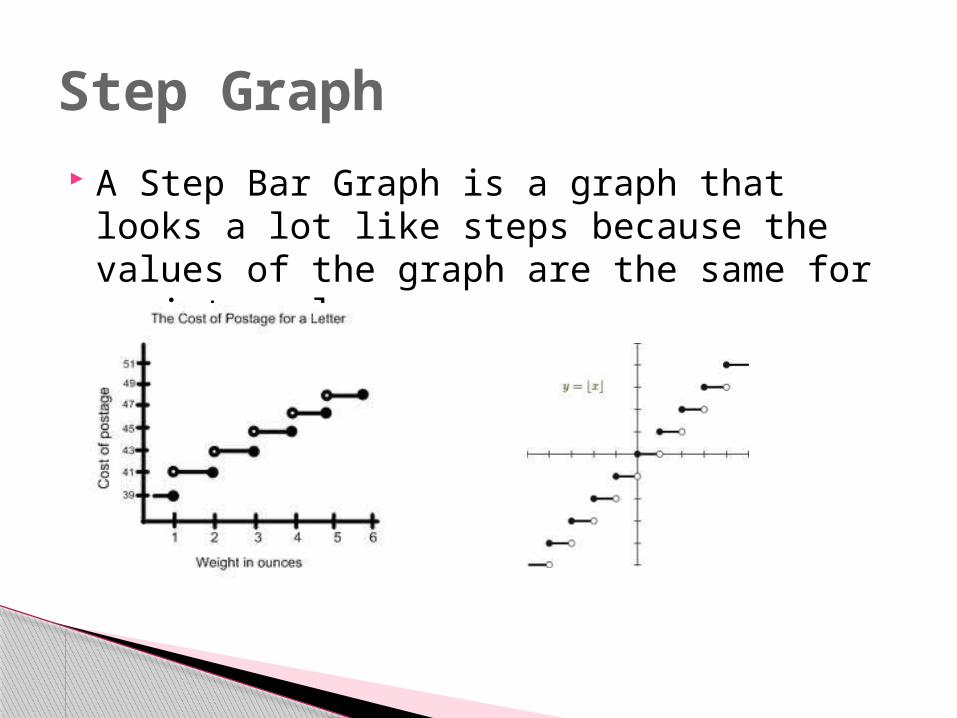
A Step Bar Graph is a graph that looks a lot like steps because the values of the graph are the same for an interval.
Step Graph