buy low, sell high - cmt association · 1 – larry pesavento’s work on gartley and butterfly...
TRANSCRIPT

Buy Low, Sell High The Objective Wave Pattern Edge
www.pattern-trading.com
A Presentation for the Market Technicians Association
Michael Gould

www.pattern-trading.com
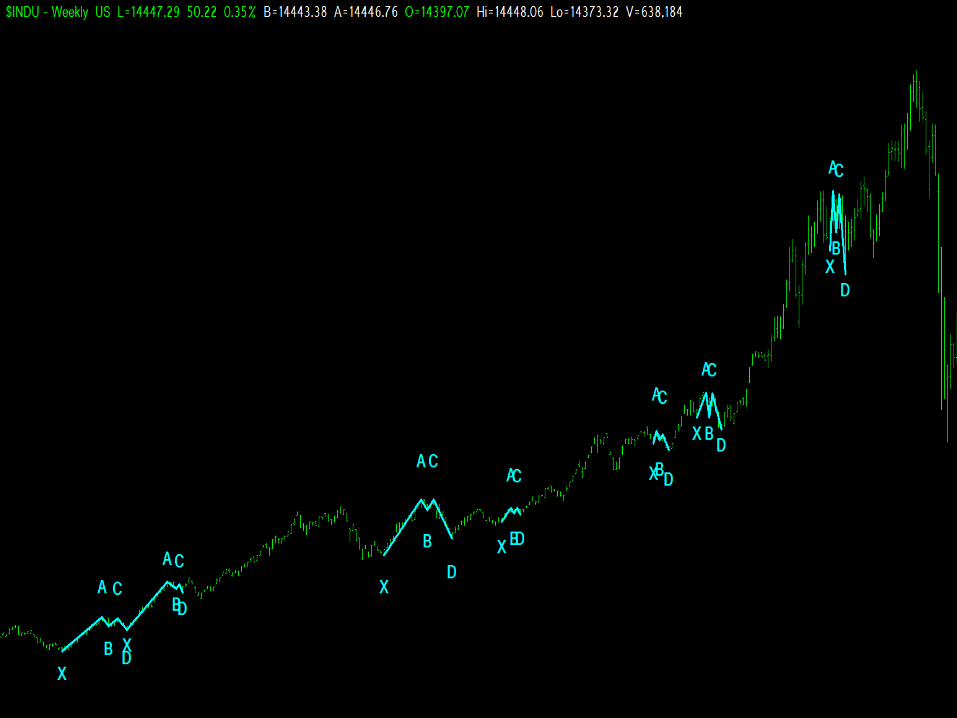
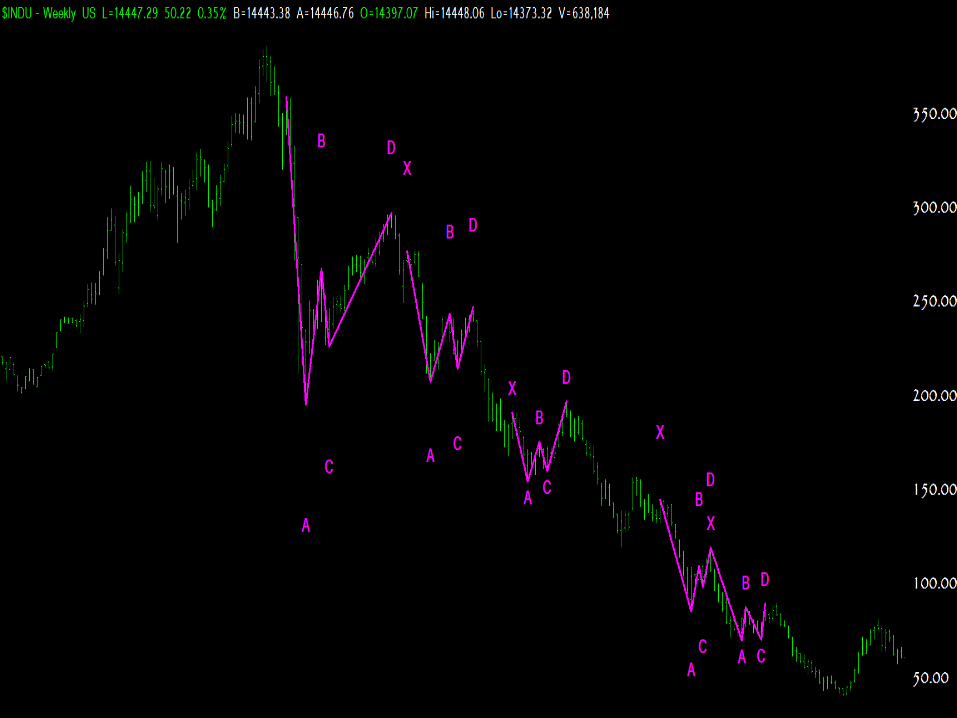
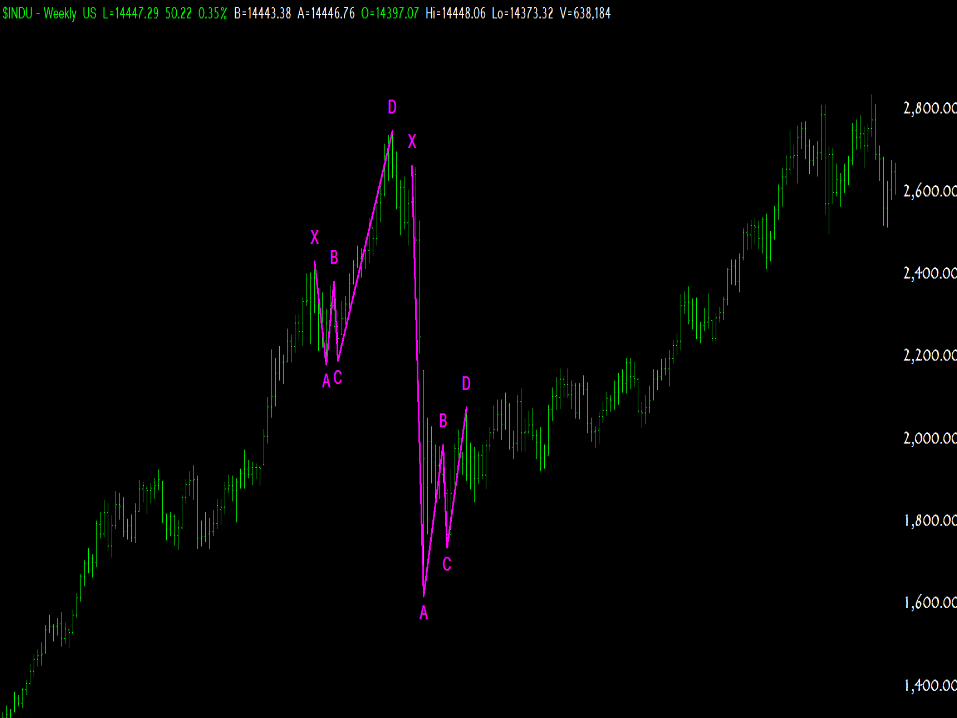
Arthur A. Merrill One of the tools he gave us: Filtered Waves % Swing Filter Volatility instead of Price Renamed Zig-Zag by someone..
www.pattern-trading.com
www.pattern-trading.com
www.pattern-trading.com

www.pattern-trading.com

www.pattern-trading.com
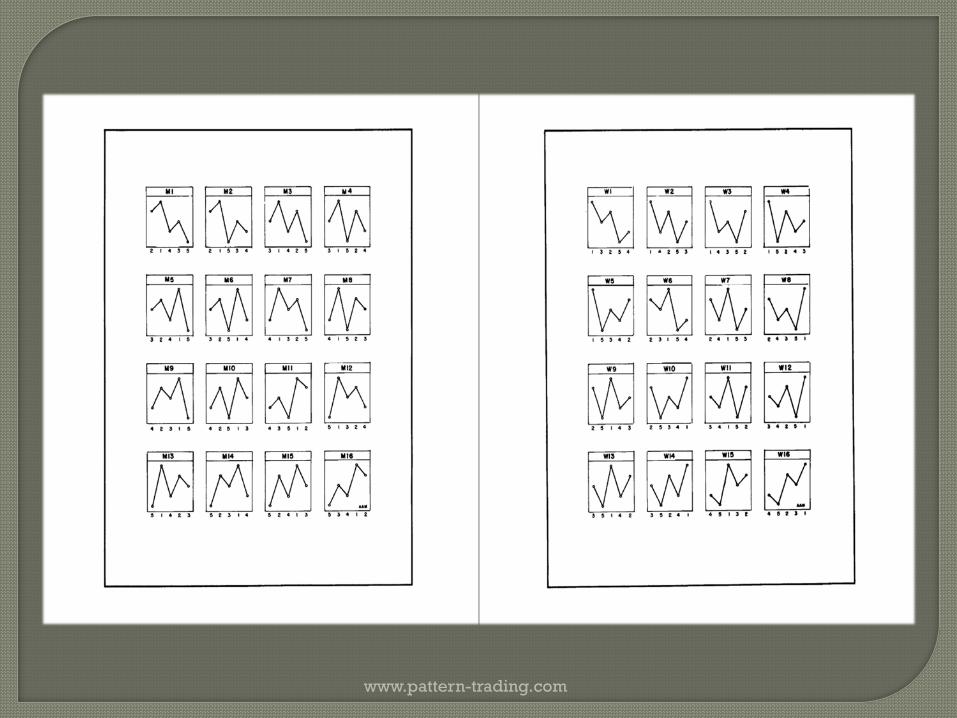
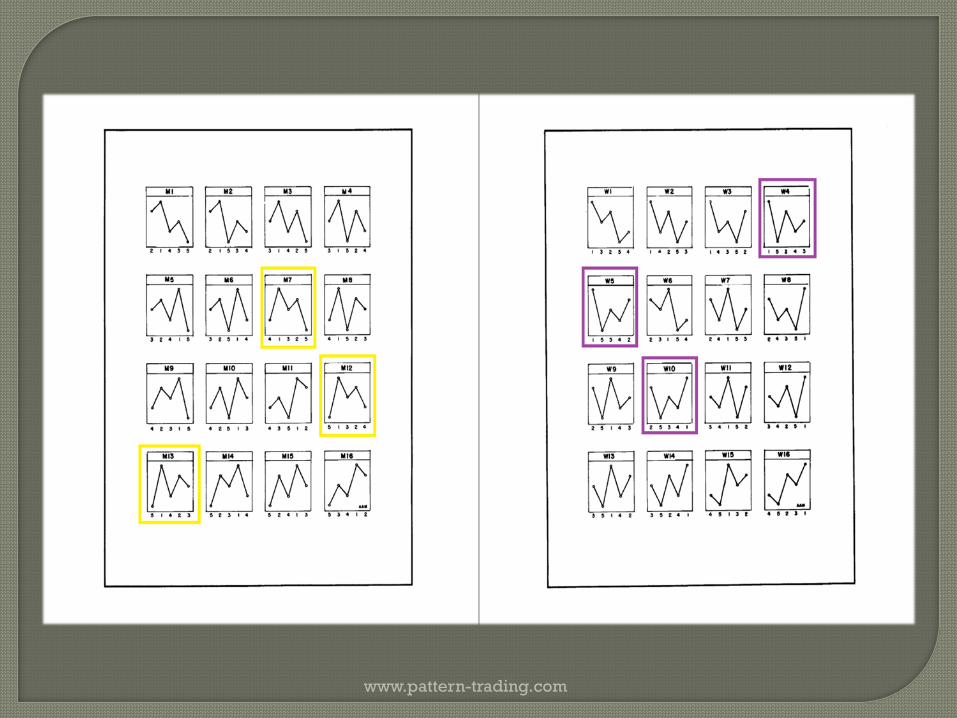
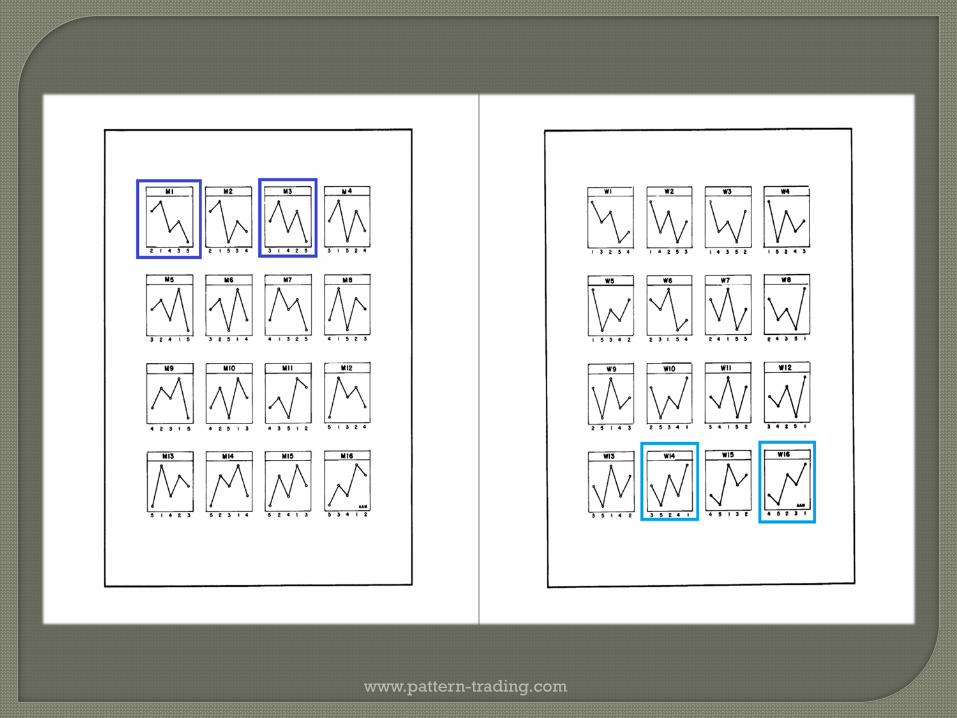
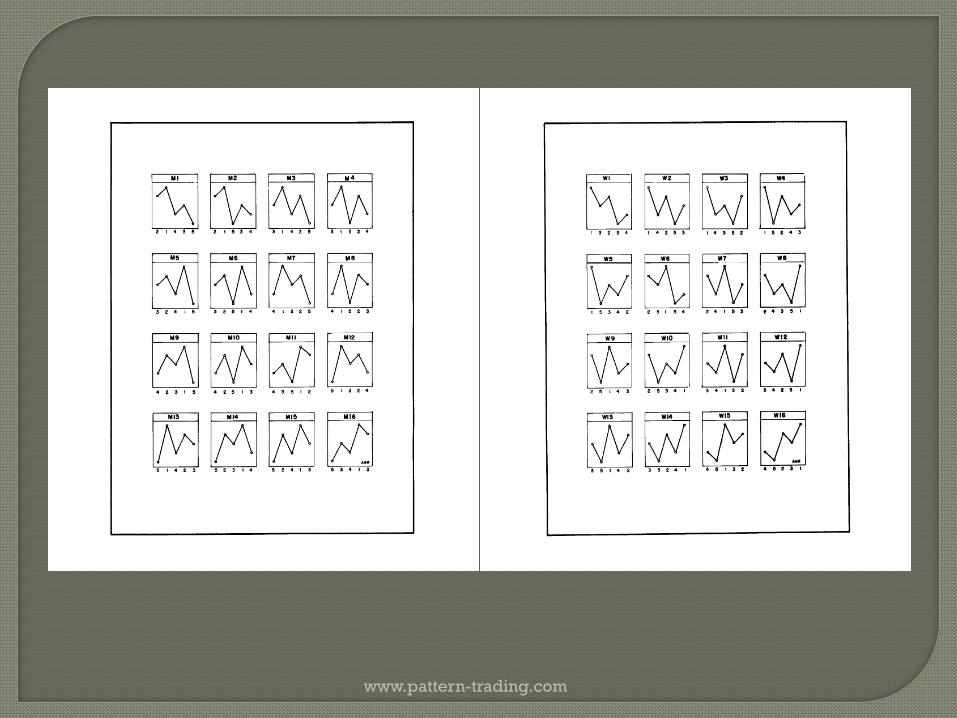
3 Pairs of MW Wave Patterns: M12:W5, M13:W4, M7:W10 M – Bullish W - Bearish 3 Sources: 1 – Larry Pesavento’s work on Gartley and Butterfly patterns 2 – Observation 3- Elliott Wave
www.pattern-trading.com
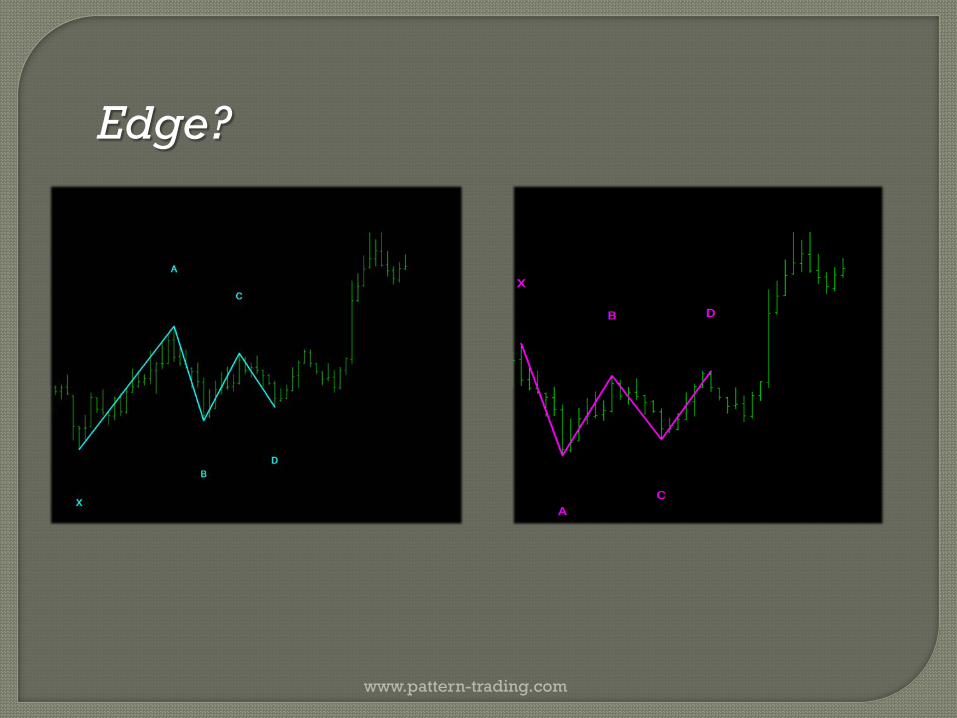
Edge?

www.pattern-trading.com
Edge

Reward to Risk One of the key areas where chart patterns help quite a lot. 1. Can be understood in terms of chart pattern 2. Risk can be defined, Reward can only be estimated 3. Only viable information when win rate is considered (as win
rate also requires Reward to Risk information to be a valuable metric)
www.pattern-trading.com
www.pattern-trading.com
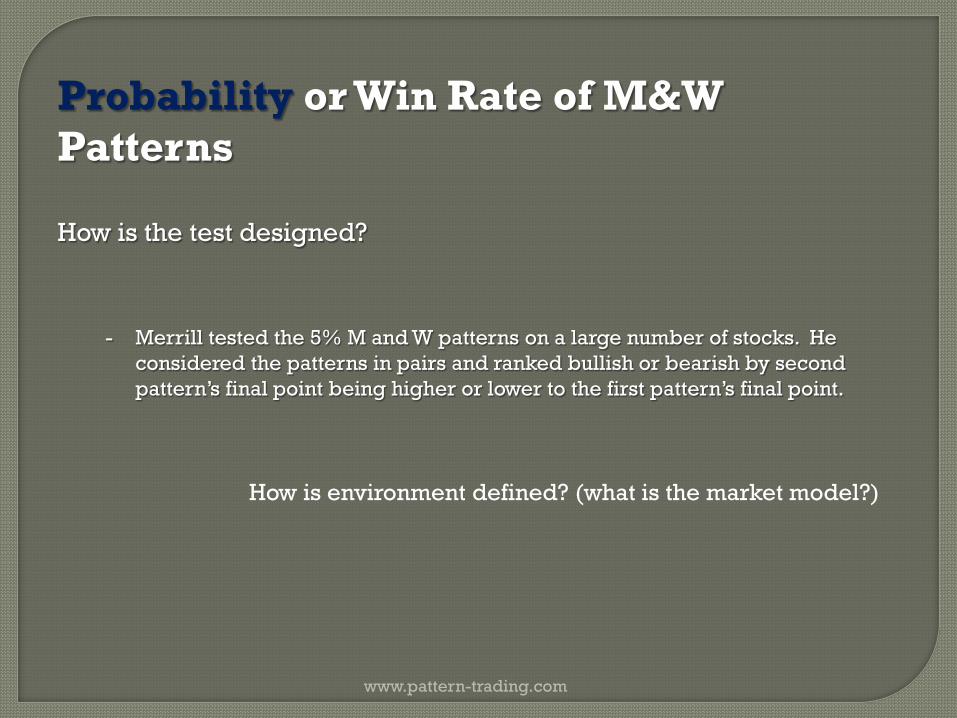
Probability or Win Rate of M&W Patterns
How is the test designed?
- Merrill tested the 5% M and W patterns on a large number of stocks. He considered the patterns in pairs and ranked bullish or bearish by second pattern’s final point being higher or lower to the first pattern’s final point.
How is environment defined? (what is the market model?)

www.pattern-trading.com

www.pattern-trading.com
www.pattern-trading.com
www.pattern-trading.com
www.pattern-trading.com
www.pattern-trading.com
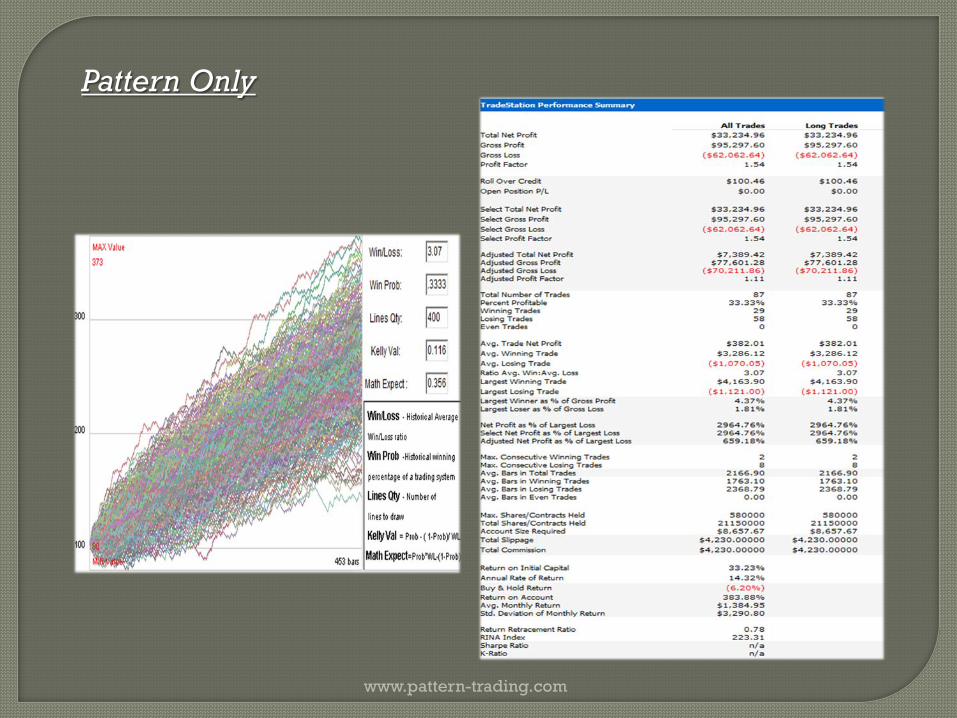
Pattern Only
www.pattern-trading.com
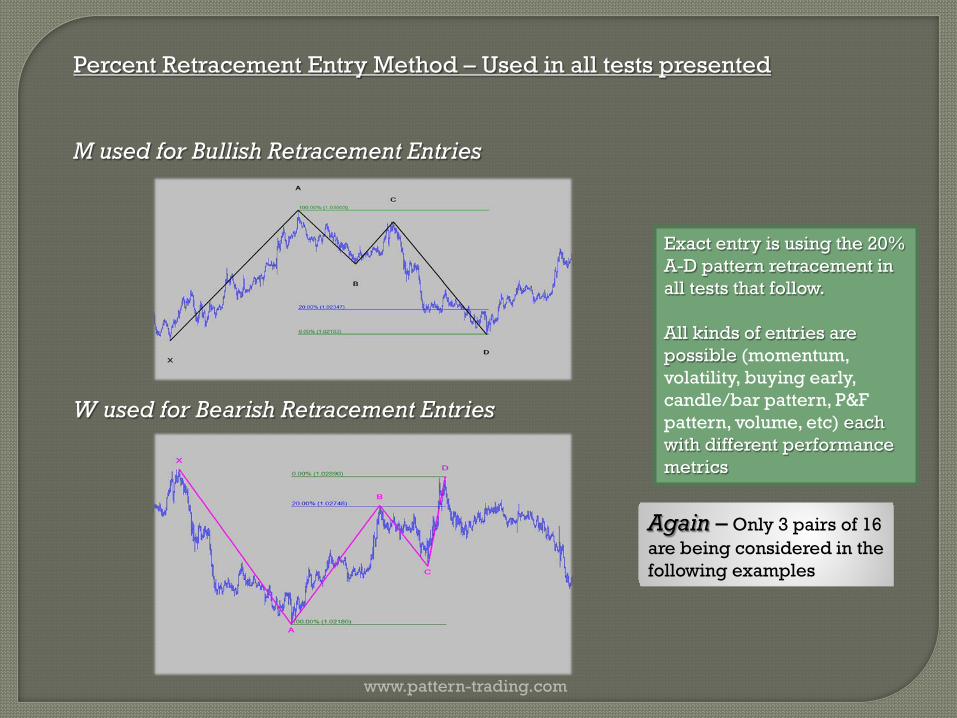
Percent Retracement Entry Method – Used in all tests presented M used for Bullish Retracement Entries W used for Bearish Retracement Entries
Exact entry is using the 20% A-D pattern retracement in all tests that follow. All kinds of entries are possible (momentum, volatility, buying early, candle/bar pattern, P&F pattern, volume, etc) each with different performance metrics
Again – Only 3 pairs of 16 are being considered in the following examples

www.pattern-trading.com

www.pattern-trading.com
www.pattern-trading.com
www.pattern-trading.com

www.pattern-trading.com

www.pattern-trading.com
www.pattern-trading.com
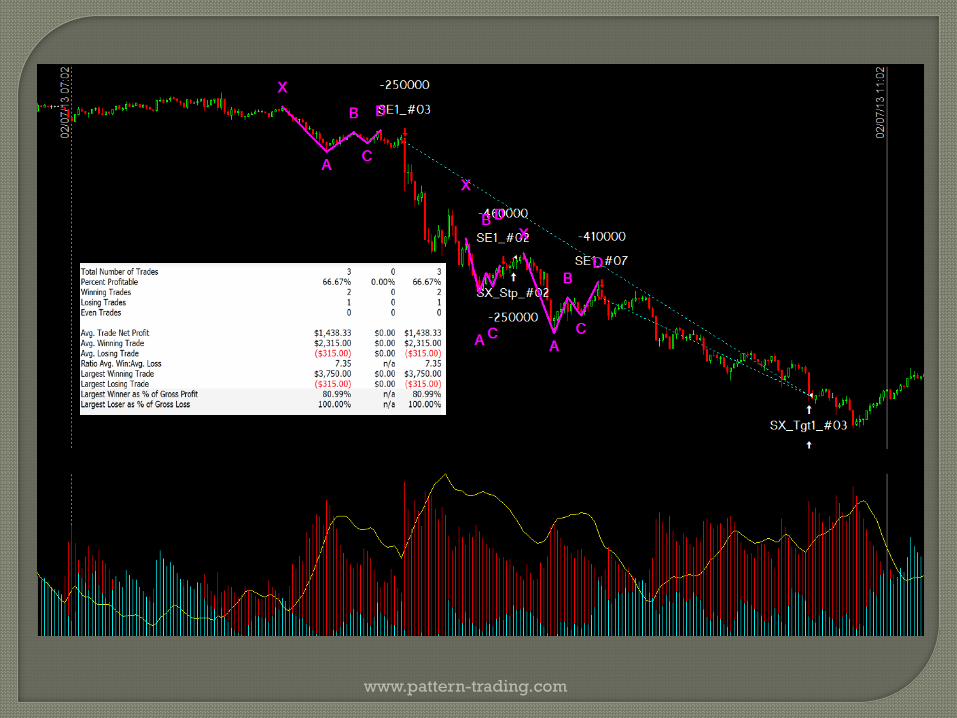
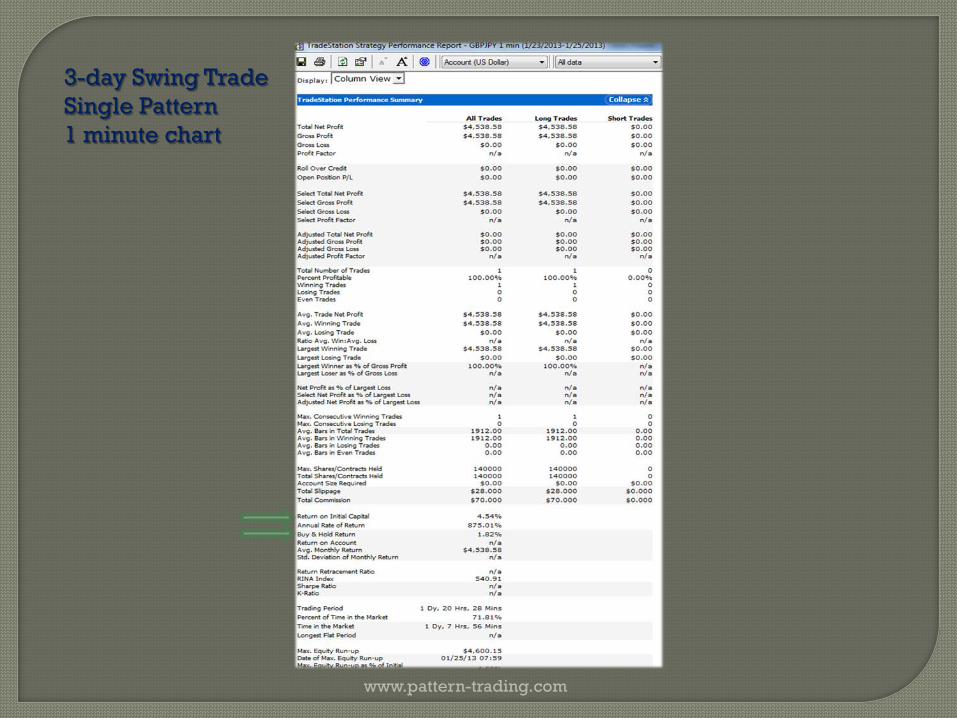
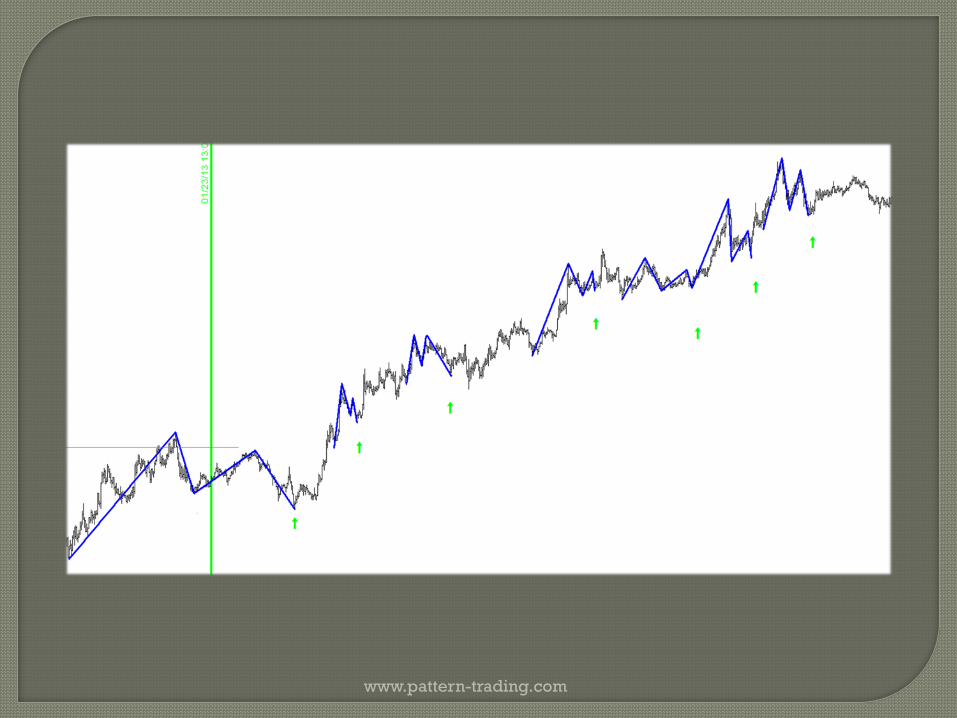
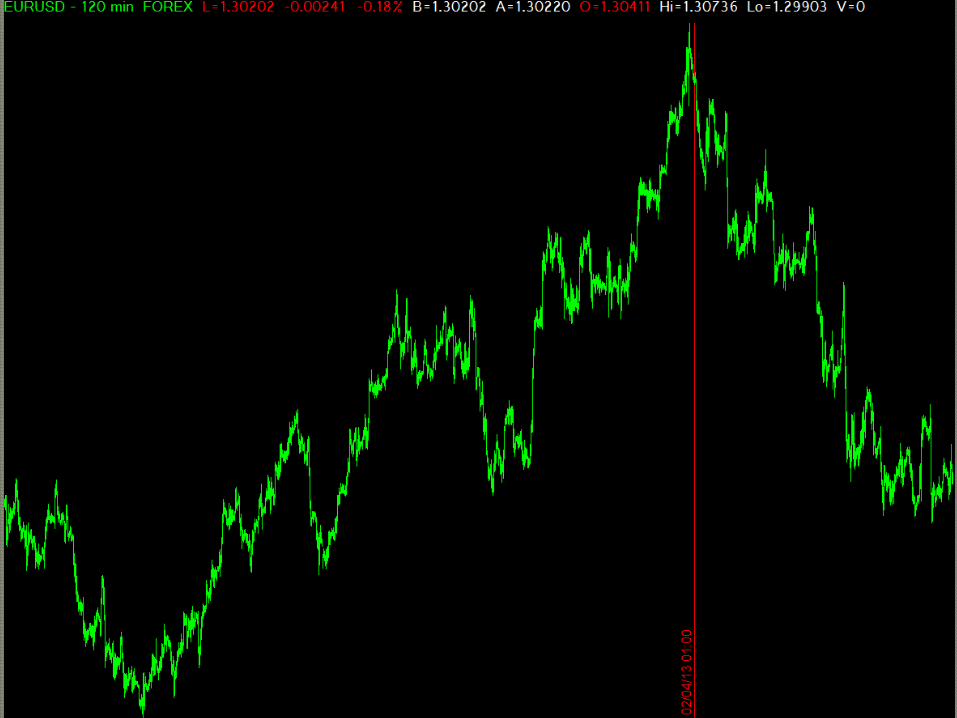
3-day Swing Trade Single Pattern 1 minute chart
www.pattern-trading.com
www.pattern-trading.com
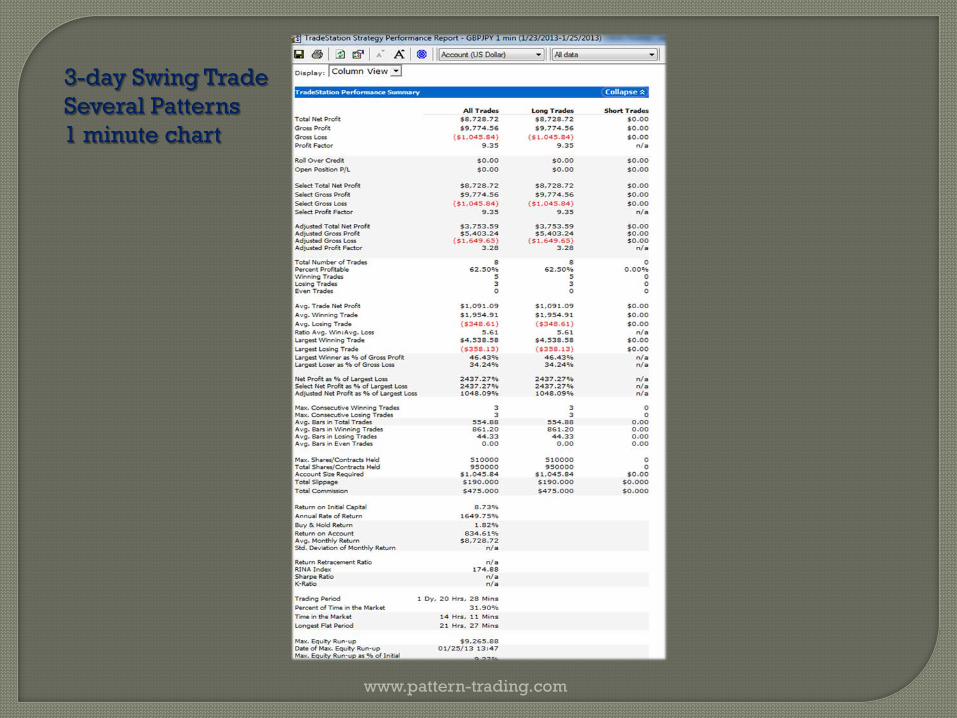
3-day Swing Trade Several Patterns 1 minute chart
www.pattern-trading.com
www.pattern-trading.com

www.pattern-trading.com
www.pattern-trading.com

www.pattern-trading.com
Do Pattern Entries in a trend give us an advantage over random?
www.pattern-trading.com
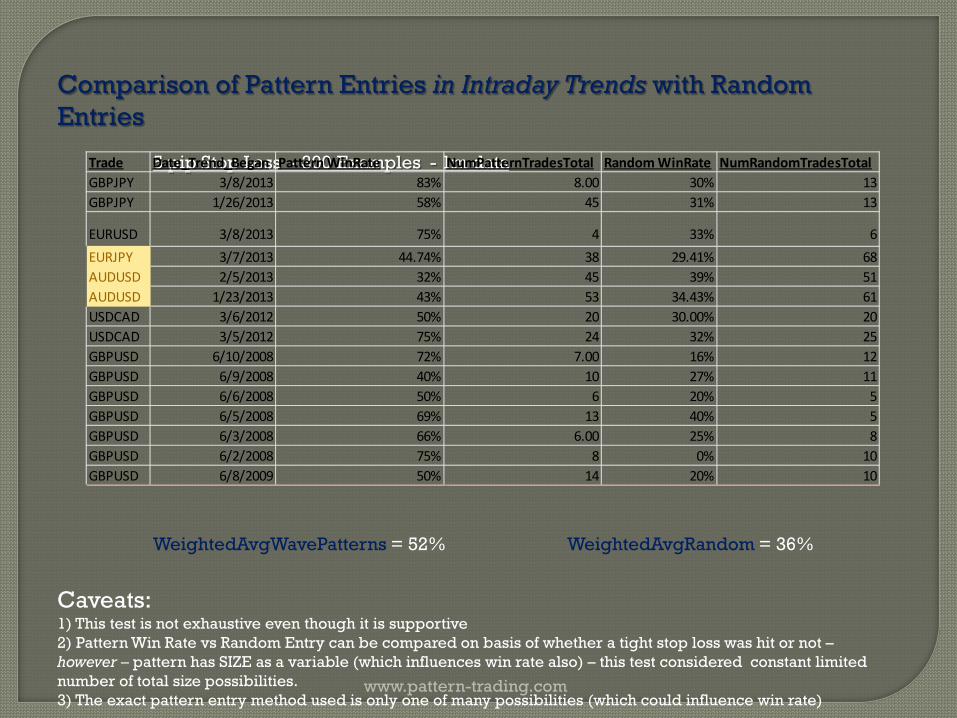
Comparison of Pattern Entries in Intraday Trends with Random Entries 5 pip Stop Loss - 300 Examples - 1m data
WeightedAvgWavePatterns = 52% WeightedAvgRandom = 36%
Caveats: 1) This test is not exhaustive even though it is supportive 2) Pattern Win Rate vs Random Entry can be compared on basis of whether a tight stop loss was hit or not – however – pattern has SIZE as a variable (which influences win rate also) – this test considered constant limited number of total size possibilities. 3) The exact pattern entry method used is only one of many possibilities (which could influence win rate)
Trade Date_Trend_Began Pattern WinRate NumPatternTradesTotal Random WinRate NumRandomTradesTotalGBPJPY 3/8/2013 83% 8.00 30% 13GBPJPY 1/26/2013 58% 45 31% 13
EURUSD 3/8/2013 75% 4 33% 6EURJPY 3/7/2013 44.74% 38 29.41% 68AUDUSD 2/5/2013 32% 45 39% 51AUDUSD 1/23/2013 43% 53 34.43% 61USDCAD 3/6/2012 50% 20 30.00% 20USDCAD 3/5/2012 75% 24 32% 25GBPUSD 6/10/2008 72% 7.00 16% 12GBPUSD 6/9/2008 40% 10 27% 11GBPUSD 6/6/2008 50% 6 20% 5GBPUSD 6/5/2008 69% 13 40% 5GBPUSD 6/3/2008 66% 6.00 25% 8GBPUSD 6/2/2008 75% 8 0% 10GBPUSD 6/8/2009 50% 14 20% 10
www.pattern-trading.com
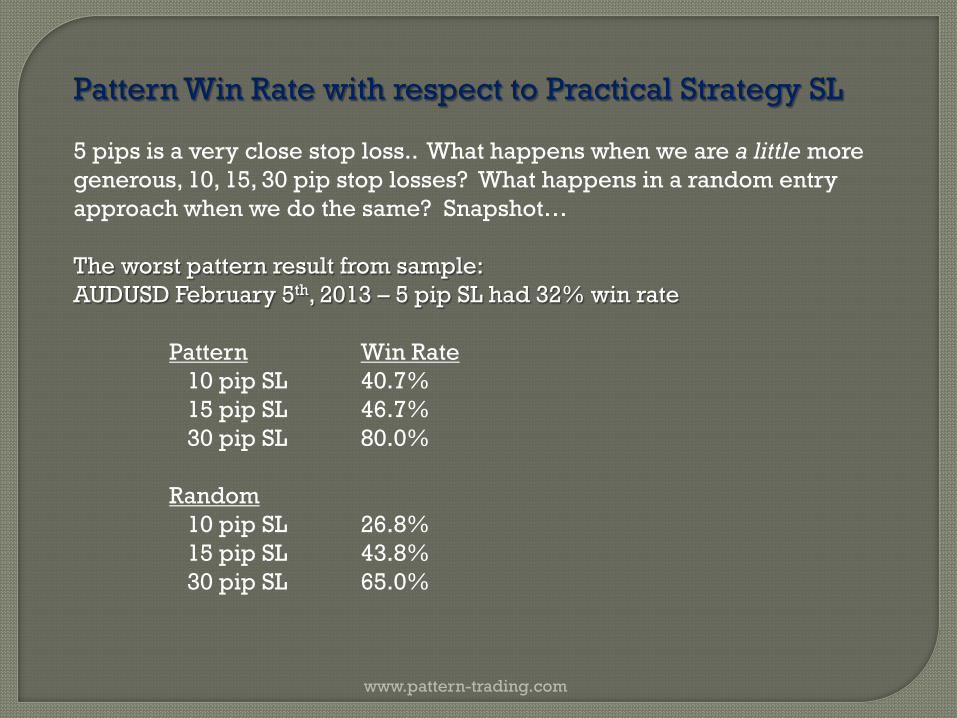
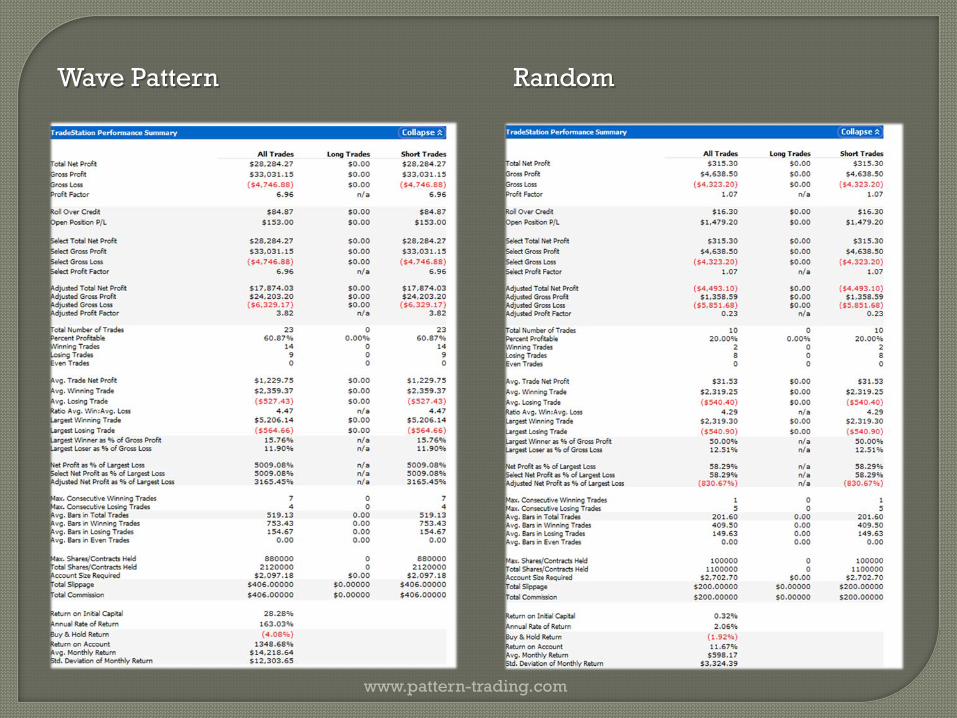
Pattern Win Rate with respect to Practical Strategy SL 5 pips is a very close stop loss.. What happens when we are a little more generous, 10, 15, 30 pip stop losses? What happens in a random entry approach when we do the same? Snapshot… The worst pattern result from sample: AUDUSD February 5th, 2013 – 5 pip SL had 32% win rate Pattern Win Rate 10 pip SL 40.7% 15 pip SL 46.7% 30 pip SL 80.0% Random 10 pip SL 26.8% 15 pip SL 43.8% 30 pip SL 65.0%
www.pattern-trading.com
www.pattern-trading.com
Wave Pattern Random
www.pattern-trading.com
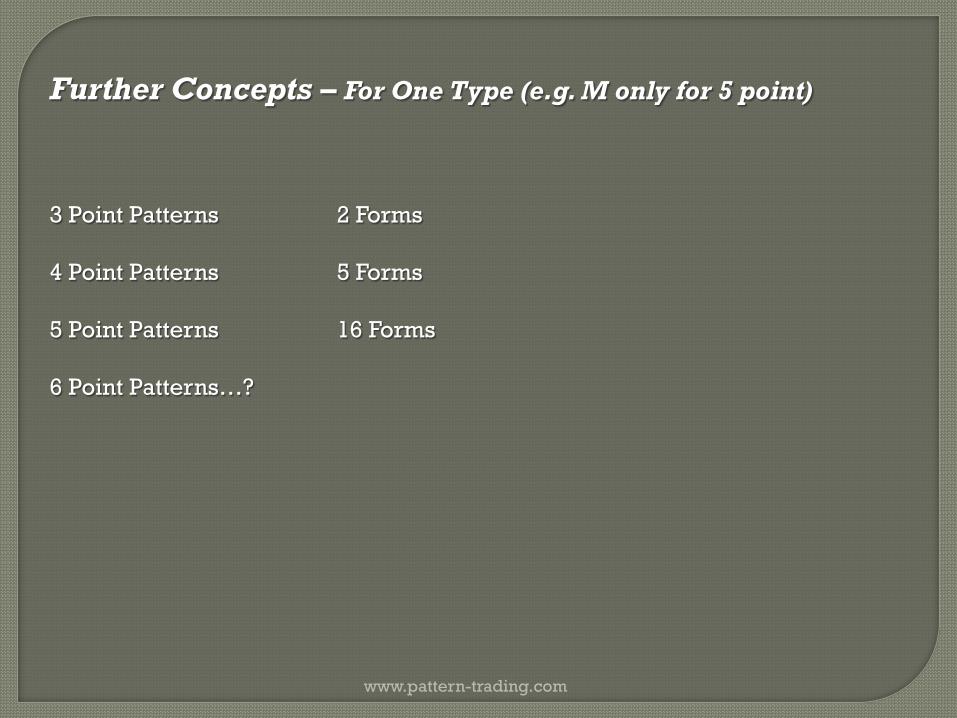
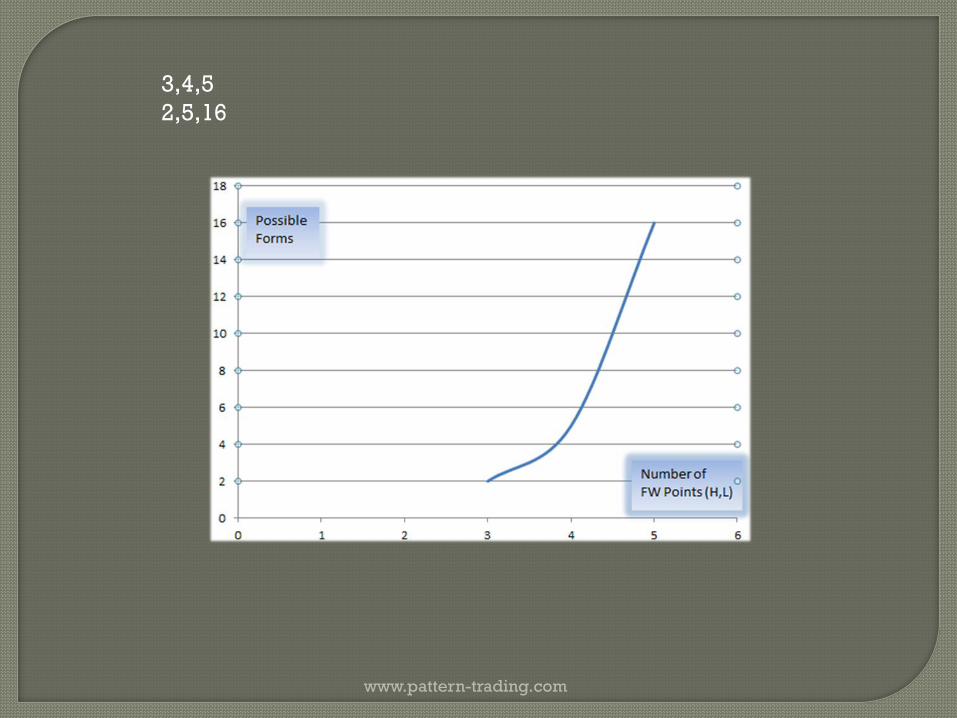
Further Concepts – For One Type (e.g. M only for 5 point) 3 Point Patterns 2 Forms 4 Point Patterns 5 Forms 5 Point Patterns 16 Forms 6 Point Patterns…?

www.pattern-trading.com
www.pattern-trading.com
www.pattern-trading.com
3,4,5 2,5,16
www.pattern-trading.com
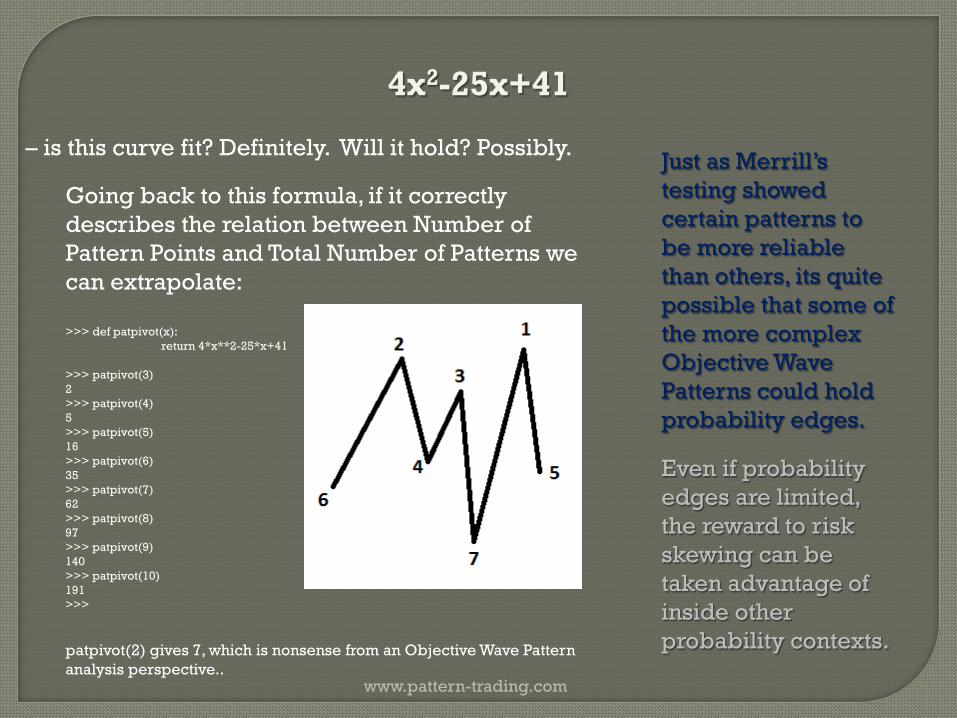
4x2-25x+41
– is this curve fit? Definitely. Will it hold? Possibly.
Going back to this formula, if it correctly describes the relation between Number of Pattern Points and Total Number of Patterns we can extrapolate: >>> def patpivot(x): return 4*x**2-25*x+41 >>> patpivot(3) 2 >>> patpivot(4) 5 >>> patpivot(5) 16 >>> patpivot(6) 35 >>> patpivot(7) 62 >>> patpivot(8) 97 >>> patpivot(9) 140 >>> patpivot(10) 191 >>>
patpivot(2) gives 7, which is nonsense from an Objective Wave Pattern analysis perspective..
Just as Merrill’s testing showed certain patterns to be more reliable than others, its quite possible that some of the more complex Objective Wave Patterns could hold probability edges.
Even if probability edges are limited, the reward to risk skewing can be taken advantage of inside other probability contexts.
www.pattern-trading.com
Michael Gould info@ pattern-trading.com
Chart Pattern Indicators, Strategy for TradeStation & MultiCharts