business statistics - free educational notes,...
TRANSCRIPT

Biyani's Think Tank
Concept based material
Business Statistics (B.Com-I)
Sapna Gupta Revised by: Archana Dursad
Lecturer
Deptt. of Commerce & Management Biyani Girls College, Jaipur

2
Published by :
Think Tanks Biyani Group of Colleges Concept & Copyright :
Biyani Shikshan Samiti Sector-3, Vidhyadhar Nagar,
Jaipur-302 023 (Rajasthan) Ph : 0141-2338371, 2338591-95 Fax : 0141-2338007
E-mail : [email protected] Website :www.gurukpo.com; www.biyanicolleges.org ISBN: 978-93-82801-66-5
First Edition : 2009 Second Edition: 2010 Price: Leaser Type Setted by : Biyani College Printing Department
While every effort is taken to avoid errors or omissions in this Publication, any
mistake or omission that may have crept in is not intentional. It may be taken note of that neither the publisher nor the author will be responsible for any damage or loss of
any kind arising to anyone in any manner on account of such errors and omissions.

Business Statistics 3
Preface
I am glad to present this book, especially designed to serve the needs of
the students. The book has been written keeping in mind the general weakness in understanding the fundamental concepts of the topics. The book is self-
explanatory and adopts the “Teach Yourself” style. It is based on question-answer pattern. The language of book is quite easy and understandable based
on scientific approach.
Any further improvement in the contents of the book by making corrections, omission and inclusion is keen to be achieved based on suggestions from the readers for which the author shall be obliged.
I acknowledge special thanks to Mr. Rajeev Biyani, Chairman & Dr. Sanjay Biyani, Director (Acad.) Biyani Group of Colleges, who are the backbones and main concept provider and also have been constant source of motivation
throughout this Endeavour. They played an active role in coordinating the various stages of this Endeavour and spearheaded the publishing work.
I look forward to receiving valuable suggestions from professors of various educational institutions, other faculty members and students for improvement of
the quality of the book. The reader may feel free to send in their comments and suggestions to the under mentioned address.
Author

4
Syllabus B.Com. Part-I
BUSINESS STATISTICS
SECTION-A 1. Introduction of Statistics : Growth of Statistics, Definition, Scope, Uses, Misuses
and Limitation of Statistics, Collection of Primary & Secondary Data, Approximation and Accuracy, Statistical Errors.
2. Classification and Tabulation of Data : Meaning and Characteristics, Frequency
Distribution, Simple and Manifold Tabulation. 3. Measuring of Central Tendency : Arithmetic Mean (Simple and Weighted),
Median (including quartiles, decides and percentiles), Mode, Geometric and Harmonic Mean – Simple and Weighted, Uses and Limitations of Measures of
Central Tendency.
SECTION-B 4. Measures of Dispersion : Absolute and Relative Measures of Dispersion;
Quartile Deviation, Mean Deviation, Standard Deviation and their Coefficients;
Uses and Interpretation of Measures of Dispersion. 5. Skewness : Measures of Skewness. 6. Index Numbers : Meaning and Uses of Index Numbers, Simple and Weighted
Price Index Numbers, Methods of Construction of Index Numbers, Average of
Relatives and Aggregative Methods, Problems in Construction of Index Numbers, Selection of Variables, Base, Weight, Average and Formula; Fishers Ideal Index Number, Base Shifting, Splicing and Deflating.
SECTION-C 7. Correlation : Meaning and Significance, Scatter Diagram, Correlation Graph,
Karl Pearson‘s Coefficient of Linear Correlation between two Variables in Grouped and Ungrouped Data by Direct and Shortcut Methods, Coefficient of Correlation by Spearman‘s, Rank Differences Method and Concurrent Deviation
Method. 8. Linear Regression. 9. Presentation of Data, Diagrammes/Graphs of Frequency Distribution and
Histograms Ratio Scale Graph.
□ □ □

Business Statistics 5
Content
S.No. Name of Topic Page No.
1. Introduction of Statistics 6- 9
2. Collection and Editing of Data 10-15
3. Classification and Tabulation of Data 16-20
4. Measures of Central Tendency 21-27
5. Measures of Dispersion 28-34
6. Measures of Skewness 35-38
7. Index Numbers 39-47
8. Correlation 48-53
9. Linear Regression 54-57
10. Diagrammatic and Graphic Presentation 58-67
11. Practical Exercise 68 – 73
12. Unsolved Papers 2011 to 2006 74 - 99

6
Introduction of Statistics
Q.1 Define ‘Statistics’ and give characteristics of ‘Statistics’.
Ans.: ‗Statistics‘ means numerical presentation of facts. Its meaning is divided
into two forms - in plural form and in singular form. In plural form,
‗Statistics‘ means a collection of numerical facts or data example price
statistics, agricultural statistics, production statistics, etc. In singular form,
the word means the statistical methods with the help of which collection,
analysis and interpretation of data are accomplished.
Characteristics of Statistics -
a) Aggregate of facts/data
b) Numerically expressed
c) Affected by different factors
d) Collected or estimated
e) Reasonable standard of accuracy
f) Predetermined purpose
g) Comparable
h) Systematic collection.
CHAPTER-I C

Business Statistics 7
Therefore, the process of collecting, classifying, presenting, analyzing and
interpreting the numerical facts, comparable for some predetermined
purpose are collectively known as ―Statistics‖.
Q.2 What is meant by ‘Data’?
Ans.: Data refers to any group of measurements that happen to interest us.
These measurements provide information the decision maker uses. Data are the foundation of any statistical investigation and the job of colleting data is the same for a statistician as collecting stone, mortar, cement, bricks etc. is for a builder.
Q.3 Discuss the Scope of Statistics.
Ans.: The scope of statistics is much extensive. It can be divided into two parts
–
(i) Statistical Methods such as Collection, Classification, Tabulation,
Presentation, Analysis, Interpretation and Forecasting.
(ii) Applied Statistics – It is further divided into three parts:
a) Descriptive Applied Statistics : Purpose of this analysis is to
provide descriptive information.
b) Scientific Applied Statistics : Data are collected with the
purpose of some scientific research and with the help of these data some particular theory or principle is propounded.
c) Business Applied Statistics : Under this branch statistical
methods are used for the study, analysis and solution of various problems in the field of business.
Q.4 Give reasons for distrust in Statistics.
Ans.: By distrust of statistics we mean lack of confidence in statistical statements
and statistical methods. It is often commented by people
“Statistics can prove anything.”

8
“There are three type of lies – lies, damned lies and statistics – wicked in the order of their naming.”
The main reasons for such views are -
a) Figures are convincing, and therefore people are easily led to believe them.
b) Ignorance of limitation of statistics.
c) Lack of test of accuracy.
d) Contradiction of data from actual circumstances.
e) Lack of specific ability to arrive at correct and appropriate results.
f) Can easily be manipulated.
Q.5 Discuss the functions and importance/utility of Statistics.
Ans.: Statistical methods are used not only in the social, economic and political
fields but in every field of science and knowledge. Statistical analysis has become more significant in global relations and in the age of fast developing information technology.
According to Prof. Bowley, “The proper function of statistics is to enlarge individual experiences”.
Following are some of the important functions of Statistics :
a) To provide numerical facts.
b) To simplify complex facts.
c) To enlarge human knowledge and experience.
d) Helps in formulation of policies.
e) To provide comparison.
f) To establish mutual relations.
g) Helps in forecasting.
h) Test the accuracy of scientific theories.
i) To study extensively and intensively.

Business Statistics 9
The use of statistics has become almost essential in order to clearly understand and solve a problem. Statistics proves to be much useful in unfamiliar fields of application and complex situations such as :-
a) Planning
b) Administration
c) Economics
d) Trade & Commerce
e) Production management
f) Quality control
g) Helpful in inspection
h) Insurance business
i) Railways & transport Co
a) Banking Institutions
b) Speculation and Gambling
c) Underwriters and Investors
d) Politicians & social workers.
□ □ □
10
Collection and Editing of Data
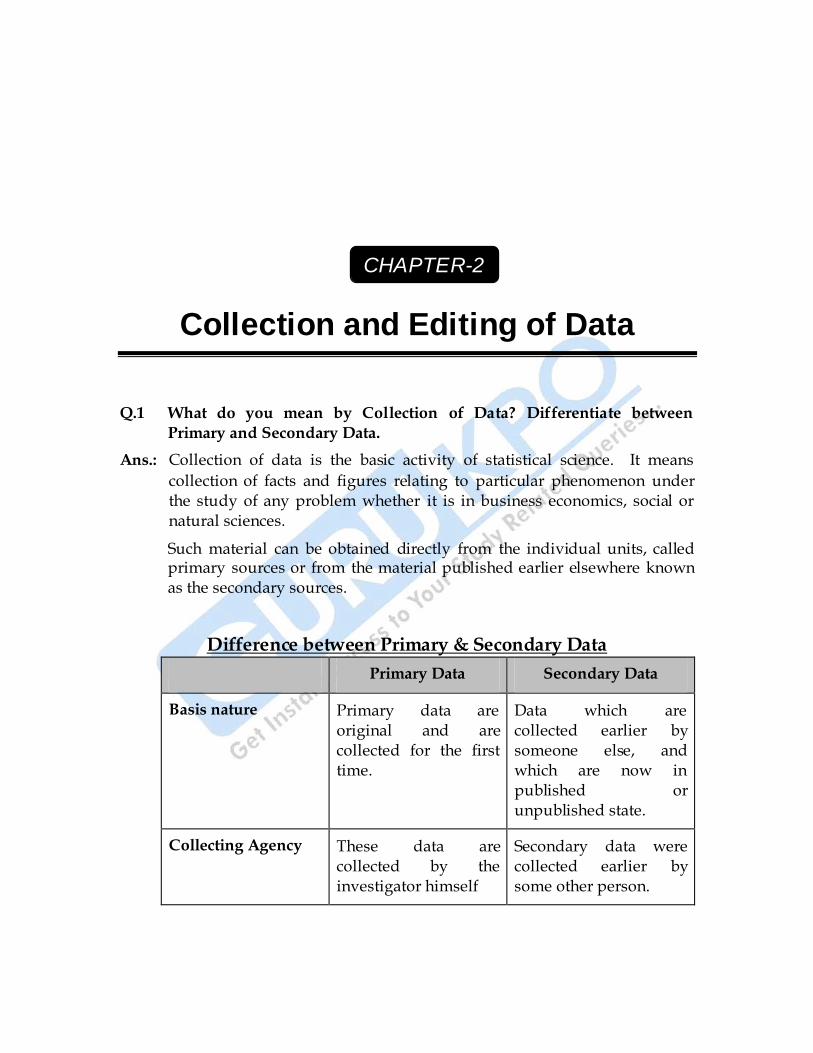
Q.1 What do you mean by Collection of Data? Differentiate between
Primary and Secondary Data.
Ans.: Collection of data is the basic activity of statistical science. It means
collection of facts and figures relating to particular phenomenon under the study of any problem whether it is in business economics, social or natural sciences.
Such material can be obtained directly from the individual units, called primary sources or from the material published earlier elsewhere known as the secondary sources.
Difference between Primary & Secondary Data
Primary Data Secondary Data
Basis nature Primary data are original and are collected for the first time.
Data which are collected earlier by someone else, and which are now in published or unpublished state.
Collecting Agency These data are collected by the investigator himself
Secondary data were collected earlier by some other person.
CHAPTER-2
C

Business Statistics 11
Post collection alterations
These data do not need alteration as they are according to the requirement of the investigation
These have to be analyzed and necessary changes have to be made to make them useful as per the requirements of investi-gation.
Time & Money More time, energy and money has to be spent in collection of these data.
Comparatively less time and money is to be spent.
Q.2 What do you mean by Questionnaire? Give merits of a good Questionnaire.
Ans.: Questionnaire is a document containing questions related to the specific
requirement of a statistical investigation for collection of information
which is filled by the informants personally.
Requirements of a good questionnaire :-
Questions should be simple, clear and short.
Simple alternative or multiple choice questions.
Unambiguous and precise.
Questions should be in sequence.
Directly relative questions.
Test of accuracy.
No restricted questions affecting personal whims.
Assurance of secrecy to the informants.
Probability of a perfect answer.

12
Q.3 What is Law of ‘Statistical Regularity’ and the Law of ’Inertia of Large
Numbers’?
Ans.: Based on the mathematical theory of probability, Law of Statistical
Regularity states that if a sample is taken at random from a population, it
is likely to possess the characteristics as that of the population. A sample
selected in this manner would be representative of the population. If this
condition is satisfied, it is possible for one to depict fairly accurately the
characteristics of the population by studying only a part of it.
The Law of ‗Inertia of Large Numbers‘ is a corollary of the law of
statistical regularity. It states that, other things being equal, larger the size
of sample, more accurate the results are likely to be. This is because when
large numbers are considered, the variations in the component parts tend
to balance each other and, therefore, the variation in the aggregate is
insignificant.
Q.4 What is Random Sampling?
OR
Define Random Sampling.
Ans.: Random Sampling is one in which selection of items is done in such a way
that every item of the universe has an equal chance of being selected.
Random Sampling is based on probability and it is free from bias.
The different methods of Random Sampling are :-
a) Lottery method.
b) Rotating the drum.
c) By systematic arrangement.
d) Routed wheel method
e) By random numbers
Q.5 What do you mean by Statistical Error? Give the difference between Mistake and Error?

Business Statistics 13
Ans.: The difference between the actual value of the figure and its approximated
value is called statistical error. For example if number of students of a
college is 1,255 but in round figures it is written as 1,300, then the
difference is called ‗Statistical error‘. In the words of Prof. Connor, ―In
statistical sense, „error‟ means the difference between the approximate
value and the true or ideal value, accurate determination of which is not
possible”.
Difference between Mistake and Error
Basis Mistake Error
a) Nature Committed
deliberately
Not deliberate
b) Source Due to use of wrong
method
Difference between
actual and
approximate value.
c) Estimation Difficult to estimate Can be estimated
d) Prevention Can be avoided by
carefulness
Cannot be avoided
easily.
e) State of
Occurrence
Can be committed at
any stage
Creeps in only at the
state of collecting,
analysis and
interpretation.
Q.6 Write a note on the Editing of Primary Data and Secondary Data for the purpose of Analysis and Interpretation.
Ans.: Before analysis and interpretation, it is necessary to edit the date to detect
possible errors and inaccuracies, so that accurate and impartial results

14
may be obtained. Thus editing means the process of checking for the
errors and omissions and making corrections, if necessary.
The task of editing is a highly specialized one and requires high level of
skill and carefulness to attain the proper degree of accuracy.
Editing of Primary Data : While editing primary data, the following
points should be considered :-
Editing for consistency
Editing for completeness
Editing for accuracy
Editing for uniformity or homogeneity
Editing of Secondary Data : Since secondary data have already been
obtained, it is highly desirable that a proper scrutiny of such data is made
before they are used by the investigator. Bowley rightly points out that
“secondary data should not be accepted at their face value”.
Hence before using secondary data, the investigators should consider the
following aspects :-
Whether the Data are Suitable for the Purpose of Investigation in
View : Quite often secondary data do not satisfy immediate needs
because they have been compiled for other purpose. The variation
can be in units of measurement, variation in the date/period to
which data is related etc.
Whether the Data is Adequate for the Investigation : Adequacy of
data is to be judged in the light of the requirements of the survey
and the geographical area covered by the available data. For
example if our object is to study ;the wage rates of the workers in
sugar industry in India and the available data cover only the state
of Rajasthan, it would not serve the purpose.

Business Statistics 15
Whether the Data are Reliable : The following points should be
checked to find out the reliability of secondary data -
(i) The collecting agency was unbiased.
(ii) The enumerators are properly trained.
(iii) A proper check on the accuracy of the field work.
(iv) Was the editing, tabulating and analysis carefully and
conscientiously done.
□ □ □

16
Classification and Tabulation of Data
Q.1 What is the meaning of Classification? Give objectives of Classification
and essentials of an ideal classification.
Ans.: Classification is the process of arranging data into various groups, classes
and sub-classes according to some common characteristics of separating them into different but related parts.
Main objectives of Classification :-
(i) To make the data easy and precise
(ii) To facilitate comparison
(iii) Classified facts expose the cause-effect relationship.
(iv) To arrange the data in proper and systematic way
(v) The data can be presented in a proper tabular form only.
Essentials of an Ideal Classification :-
(i) Classification should be so exhaustive and complete that every individual unit is included in one or the other class.
(ii) Classification should be suitable according to the objectives of investigation.
(iii) There should be stability in the basis of classification so that
comparison can be made.
(iv) The facts should be arranged in proper and systematic way.
(v) Data should be classified according to homogeneity.
(vi) It should be arithmetically accurate.
CHAPTER-3
C

Business Statistics 17
Q.2 What is Manifold Classification?
Ans.: When the data are classified into more than two classes according to more
than one attribute, it is called manifold classification.
Q.3 What are Class Limits?
Ans.: The two values which determine a class are known as class limits. First or
the smaller one is known as lower limit (L1) and the greater one is known as upper limit (L2)
Q.4 How many types of Series are there on the basis of Quantitative Classification? Give the difference between Exclusive and Inclusive Series.
Ans.: There are three types of frequency distributions -
(i) Individual Series : In individual series, the frequency of each item
or value is only one for example ;marks scored by 10 students of a class are written individually.
(ii) Discrete Series : A discrete series is that in which the individual
values are different from each other by a different amount.
For example: Daily wages 5 10 15 20
No. of workers 6 9 8 5
(iii) Continuous Series : When the number of items are placed within
the limits of the class, the series obtained by classification of such data is known as continuous series.
For example Marks obtained 0-10 10-20 20-30 30-40
No.of students 10 18 22 25
Difference between Exclusive and Inclusive Series
Exclusive Series Inclusive Series
Limits Upper limit of one class is equal to the lower limit of next class.
The two limits are not equal.

18
Inclusion The value equal to the upper limit is included in the next class.
Both upper & lower limits are included in the same class.
Conversion It does not require any conversion.
Inclusive series is converted into exclusive series for calculation purpose.
Suitability It is suitable in all situations.
It is suitable only when the values are in integers.
Q.5 What is Bivariate Frequency Distribution?
Ans.: A frequency distribution obtained by the simultaneous classification of
data according to two characteristics is known as a bivariate frequency distribution.
Q.6 Give Sturges Formula for determining Magnitude of Classes?
Ans.: According to Prof. A. H. Sturges, class interval can be found using the
following formula.
I = L - S
1 + 3.322 log N
Where -
I = class interval N = No. of observations
L = Largest value S = Smallest value
Q.7 Define Tabulation. State the objectives of Tabulation and kinds of Tables.
Business Statistics 19
Ans.: According to Blair, “Tabulation in its broad sense is an orderly
arrangement of data in columns and rows.”
Tabulation is a process of presenting the collected and classified data in proper order and systematic way in columns and rows so that it can be easily compared and its characteristics can be elucidated.
Objects of Tabulation :
Orderly and systematic presentation of data.
Making data precise and stable.
To facilitate comparison.
To make the problem clear and self evident.
To facilitate analysis & interpretation of data.
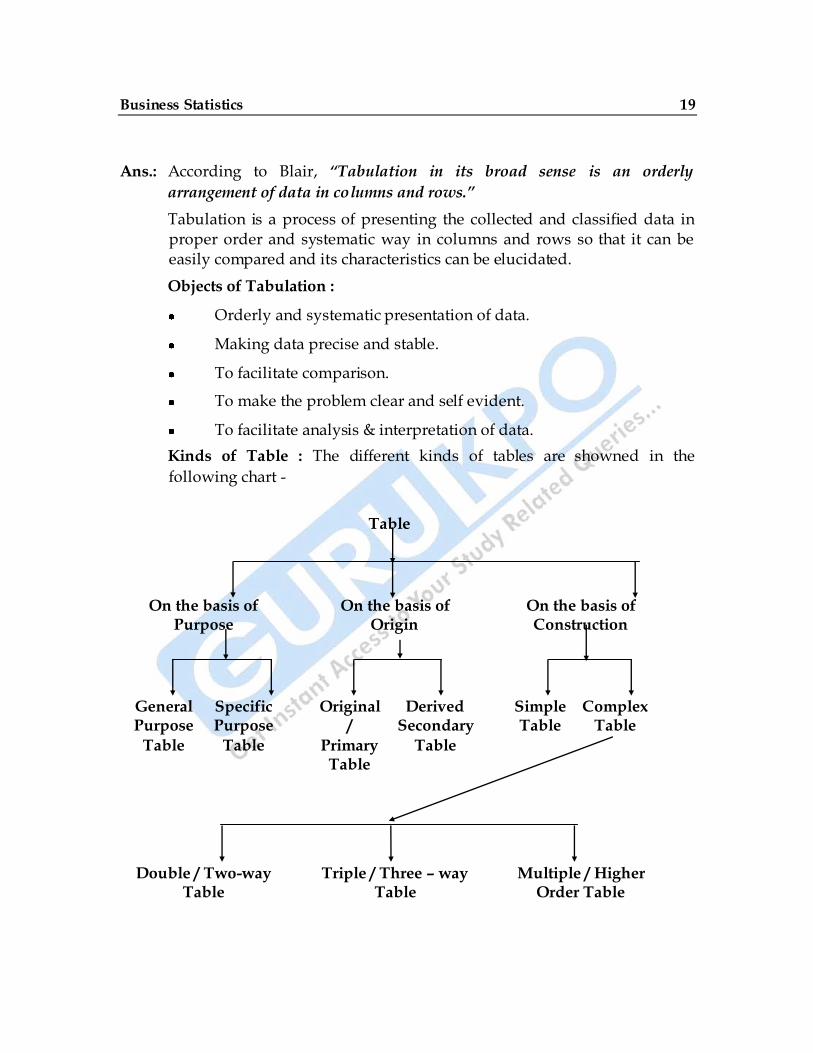
Kinds of Table : The different kinds of tables are showned in the
following chart -
Table
On the basis of Purpose
On the basis of Origin
On the basis of Construction
General Purpose
Table
Specific Purpose
Table
Original /
Primary Table
Derived Secondary
Table
Simple Table
Complex Table
Double / Two-way Table
Triple / Three – way Table
Multiple / Higher Order Table

20
Q.8 What are the main parts of a good Table?
Ans.: The number of parts depends mostly on the nature of the data. However,
a table should have the following parts.
(i) Table No. : Each table should be numbered so that the table may be
referred with that number.
(ii) Title : Every table must be given a suitable title which should be
short, clear and complete.
(iii) Captions : Caption refers to the column heading which explains
what the column represents.
(iv) Stubs : Stubs are the designations of the rows or row headings.
(v) Body : It is the heart of the table. The body of the table contains the
numerical information.
(vi) Ruling and Spacing : Ruling and leaving the space depends on the
needs of the topic and makes the table attractive and beautiful.
(vii) Footnotes : In order to explain the figures shown in the table,
explanatory notes may be given at the end of the table.
(viii) Source : At the end of the table, the source or origin of given data is
mentioned.
□ □ □

Business Statistics 21
Measures of Central Tendency
Q.1 What do you mean by Measures of Central Tendency? Define
Arithmetic Mean, Mediam and Mode.
Ans. : The central tendency of a variable means a typical value around which
other values tend to concentrate; hence this value representing the central tendency of the series is called measures of central tendency or average.
According to Clark, “Average is an attempt to find one single figure to describe whole of figures.”
Arithmetic Mean (X) : The most popular and widely used measure of
representing the entire data by one value is known as arithmetic mean. Its value is obtained by adding together all the items and by dividing this total by the number of items.
Arithmetic mean may be of two types :
Simple Arithmetic mean
Weighted arithmetic mean
Calculation of Arithmetic Mean :
Individual Series Discrete & continuous series
Direct Method :
X = ∑X
N
Where –
Direct Method :
X = ∑f X
N
Where –
CHAPTER-4
C
22
X Values
N No. of Items
fX Values X frequencies
N Total of frequencies
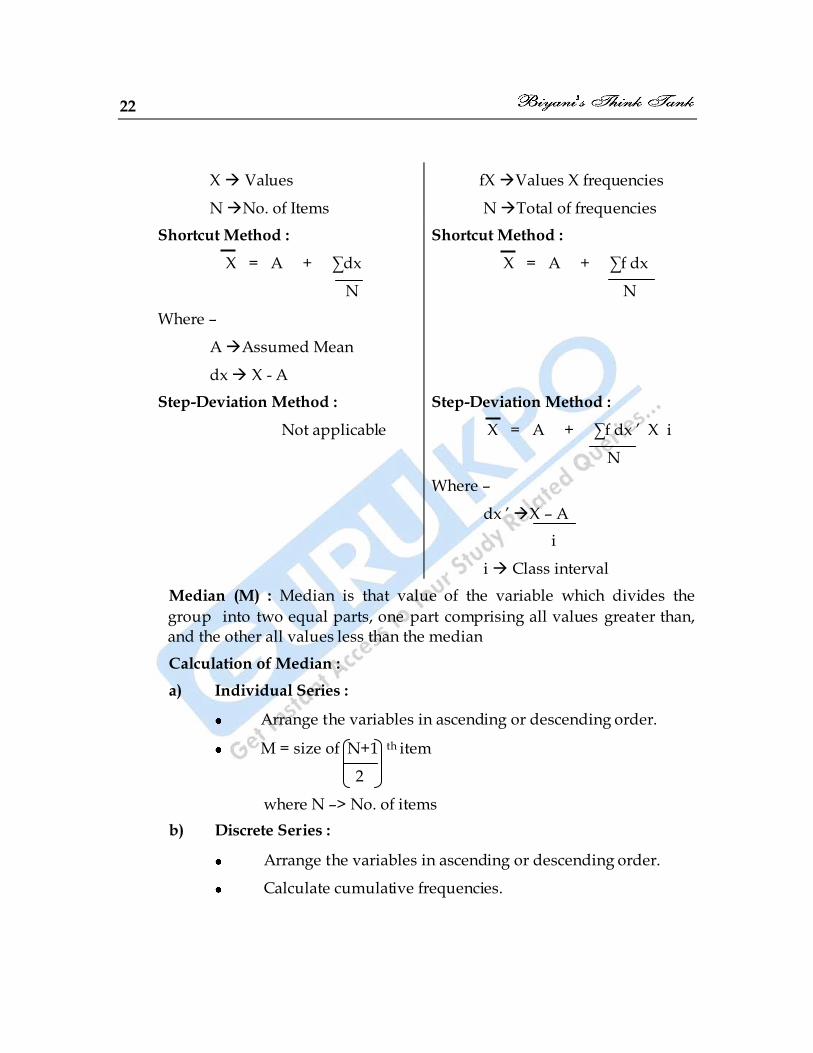
Shortcut Method :
X = A + ∑dx
N
Where –
A Assumed Mean
dx X - A
Shortcut Method :
X = A + ∑f dx
N
Step-Deviation Method :
Not applicable
Step-Deviation Method :
X = A + ∑f dx ‘ X i
N
Where –
dx ‘ X – A
i
i Class interval
Median (M) : Median is that value of the variable which divides the
group into two equal parts, one part comprising all values greater than, and the other all values less than the median
Calculation of Median :
a) Individual Series :
Arrange the variables in ascending or descending order.
M = size of N+1 th item
2
where N –> No. of items
b) Discrete Series :
Arrange the variables in ascending or descending order.
Calculate cumulative frequencies.

Business Statistics 23
Apply formula M = N+1 th item; N = Total of frequency.
2
The value (X) corresponding to this in the cumulative frequency will be the median.
c) Continuous Series :
Arrange the variables in ascending or descending order.
Calculate cumulative frequencies.
Determine median class by using (N/2).
Apply formula –
M = l1 + i (m – c)
f
l1 lower limit of median group
i class interval
m N/2
c cumulative frequency preceding the median group.
f frequency of median group
Mode (Z) : Mode is the value that appears most frequently in a series i.e. it
is the value of the item around which frequencies are most densely concentrated.
Calculation of Mode :
a) Individual Series :
(i) By inspection – value repeated most.
(ii) By converting individual series into discrete series.
(iii) By empirical relationship between the averages -
Z = 3M – 2X
b) Discrete Series :
(i) By inspection – value having highest frequency.

24
(ii) By grouping.
(iii) By empirical relationship.
c) Continuous Series :
(i) First calculate model class by inspection or by grouping.
(ii) Then apply the following formula -
l1 + ∆1
∆1 + ∆2
where l1 lower limit of modal class
∆1 f1 – f0
∆2 f1 – f2
f1 frequency of modal class
f0 frequency of preceding class.
f2 frequency of succeeding class
i class interval
Q.2 What are the essentials of an Ideal Average.
Ans.: (i) Should be easy to understand.
(ii) Clearly and rigidly defined.
(iii) Based on all the observations.
(iv) Simple to compute.
(v) Least affected by fluctuations.
(vi) Capable of further Algebraic treatment.
(vii) Sampling stability.
Q.3 What is Geometric Man? Give Algebraic Characteristics of Geometric Mean and state when Geometric Mean is useful.
Ans.: Geometric mean is the nth root of the product of N items or values.

Business Statistics 25
Calculation of Geometric Mean (G) :
Individual Series Discrete & Continuous Series
G = Antilog ∑ log X
N
G = Antilog ∑f log X
N
Algebraic Characteristics of Geometric Mean :
(i) The product of the items remain unchanged if each item is replaced by geometric mean.
(ii) Geometric mean cannot be found if the value of some item in the series is negative or zero.
(iii) The product of corresponding ratios on either side of the geometric mean is always equal.
(iv) Not affected by changing the sequence of items.
Geometric mean is appropriate or useful :-
- When ratios or percentages are to be found.
- In determining rates of increase or decrease.
- When the different values are at vast difference.
Q.4 What is Harmonic Mean? In which circumstances Harmonic Mean is
used.
Ans.: Harmonic mean of a series is the reciprocal of the arithmetic mean of the
reciprocal of the values of its items.
Calculation of Harmonic Mean (H.M.) :
Individual Series Discrete & Continuous Series
H.M. = Reciprocal ∑ Reci.X
N
H.M. = Reciprocal ∑ (Reci.X .f)
N
Harmonic Mean is used in the following cases :-
- For determining average speed or velocity.
- To find out average price.

26
- If the item given in the question which is variable is to be kept as constant in the answer, or vice versa, then harmonic mean will be calculated.
Q.5 What is Partition Value. Give formula for calculating different Partition Values?
Ans.: Values of the items that divide the series into many parts are known as
partition values. A variable may be divided into four, five, eight, ten and hundred equal parts known as Quartiles, Quintiles, Octiles, Deciles and Percentiles. The aforesaid partition values gives an idea of the formation of the series which are used in the calculation of dispersion and skewness.
Formula used for Calculating Partition Values :
Measures Individual & Discrete Series
Continuous Series
Quartiles :
Q1 Size of N + 1 th item
4
q1 = (N/4) th item & Q1 = l1 + i (q1 – c)
f
Q3 Size of 3 N + 1 th item
4
q3 = 3 (N/4) th item & Q3 = l1 + i (q3 – c)
f
Quintiles :
Qn4
Size of 4 N + 1 th item
5
qn4 = 4 (N/5) th item & Q3 = l1 + i (qn4 – c)
f
Octiles :
O2
Size of 2 N + 1 th item
8
o2 = 2 (N/8) th item & O2 = l1 + i (o2 – c)
f
Deciles :
D7
Size of 7 N + 1 th item
10
d3 = 7 (N/10) th item & D3 = l1 + i (d7 – c)
f
Percentiles:
P75
Size of 75 N + 1 th item
100
775 = 75(N/100)th item & P75 = l1 + i (p75 – c)
f

Business Statistics 27
Q.6 How are Arithmetic Mean, Geometric Mean and Harmonic Mean related to each other? Why is Arithmetic Mean greater than the
Geometric Mean and Geometric Mean is greater than the Harmonic Mean.
Ans.: Relation between arithmetic mean, geometric mean and harmonic mean
can be given by -
(i) X > g > h and (ii) g2 = X.h.
While calculating arithmetic mean, the bigger values are given more weightage than the small values, whereas in harmonic mean the smaller values are given much more weightage than to the larger values. Therefore, arithmetic mean is greater than geometric mean and geometric mean is greater than harmonic mean.
□ □ □

28
Measures of Dispersion
Q.1 What do you mean by Dispersion. Give the meaning of Absolute
Measure and Relative Measure with example.
Ans. : Dispersion is a measure of the extent to which the individual item vary from a central value Dispersion is used in two senses, (i) difference between the extreme items of the series and (ii) average of deviation of items from the mean.
Absolute Measure : The figure showing the limit or magnitude of
dispersion is known as absolute measure and it is shown in the same unit as ;those of the original data, example measures of dispersion in the age of students, their height, weight etc.
Relative Measure : For comparative study the concerning absolute
measure is divided by the corresponding mean or some other characteristic value to obtain a ratio or percentage, which is known as the relative measure.
Q.2 Explain the various methods for measuring Dispersion. Also give their merits and demerits?
Ans.: Following are the important methods of studying dispersion -
(1) Numerical Methods :
a) Methods of limits b) Methods of average deviation:
i) Range i) Quartile Deviation
ii) Inter-quartile range ii) Mean Deviation
CHAPTER-5
C

Business Statistics 29
iii) Percentile Range iii) Standard Deviation
(2) Graphic Method - Lorenz Curve :
i) Range : The difference between the value of the smallest item
and the value of the largest item of the series is called range.
Range = Largest item – Smallest item
Co-efficient of Range = L - S
L + S
Merits of Range :
- Simple and easy to be computed.
- It takes minimum time to calculate.
- Not necessary to know all the values, only smallest and largest value is required.
- Helpful in quality control of products.
Demerits of Range :
- Not based on all the items.
- Subject to fluctuation/uncertain measure.
- Cannot be computed in case of open-end distributions.
- As it is not based on all the values it is not considered as a good or appropriate measure.
ii) Inter-Quartile Range : Inter-quartile range represents the
difference between the third-quartile and the first quartile. It is also known as the range of middle 50% values.
Inter-quartile range = Q3 – Q1
Merits :
- It is easy to calculate.
- Can be measured in open end distributions.
- It is least affected by the uncertainty of the extreme values.
30
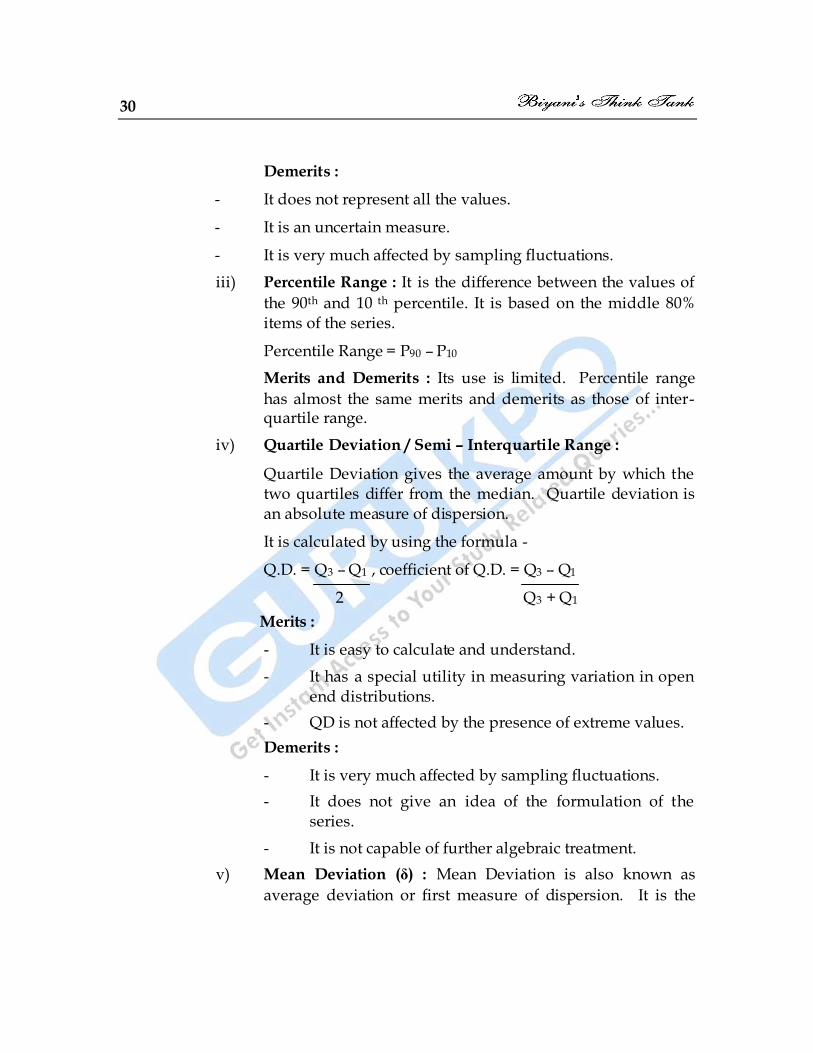
Demerits :
- It does not represent all the values.
- It is an uncertain measure.
- It is very much affected by sampling fluctuations.
iii) Percentile Range : It is the difference between the values of
the 90th and 10 th percentile. It is based on the middle 80% items of the series.
Percentile Range = P90 – P10
Merits and Demerits : Its use is limited. Percentile range
has almost the same merits and demerits as those of inter-quartile range.
iv) Quartile Deviation / Semi – Interquartile Range :
Quartile Deviation gives the average amount by which the two quartiles differ from the median. Quartile deviation is an absolute measure of dispersion.
It is calculated by using the formula -
Q.D. = Q3 – Q1 , coefficient of Q.D. = Q3 – Q1
2 Q3 + Q1
Merits :
- It is easy to calculate and understand.
- It has a special utility in measuring variation in open end distributions.
- QD is not affected by the presence of extreme values.
Demerits :
- It is very much affected by sampling fluctuations.
- It does not give an idea of the formulation of the series.
- It is not capable of further algebraic treatment.
v) Mean Deviation () : Mean Deviation is also known as
average deviation or first measure of dispersion. It is the

Business Statistics 31
average difference between the items in a distribution and the median mean or mode of that series.
Computation of Mean Deviation :
Individual Series Discrete & continuous series
a) Deviation from Mean :
X = ∑│dx│ , │dx│ = │X - X│
N
Coefficient of X = X
X
a) Deviation from Mean :
X = ∑f│dx│
N
b) Mean Deviation from Median :
M = ∑│dM│ ,│dM│ = │X - M│
N
Coefficient of M = M
M
b) Mean Deviation from
Median :
M = ∑f│dM│
N
c) Mean Deviation from Mode :
Z = ∑│dZ│ ,│dZ│ = │X - Z│
N
Coefficient of Z = Z
M
b) Mean Deviation from Mode :
M = ∑f│dZ│
N
Merits :
- It is simple to understand and easy to compute.
- Based on each and every item of the data.
- Least affected by the extreme values.
- It can be computed from any average, mean, median or mode.
Demerits :
- Signs are ignored therefore mathematically it is incorrect and not a significant measure.

32
- Cannot be compared if mean deviations of different series are based on different averages.
- Does not give accurate results.
vi) Standard Deviation (σ) :
Standard Deviation was introduced by Karl Pearson in 1823. It is the most important and widely used measure of studying dispersion, as it is free from those defects from which the earlier methods suffer and satisfies most of the properties of a good measure of dispersion.
Standard Deviation is the square root of the average of the square deviations from the arithmetic mean of a distribution.
Co-efficient of Standard Deviation :
Standard deviation is an absolute measure. When comparison of variability in two or more series is required, relative measure of standard deviation is computed which is called coefficient of standard deviation.
Individual Series Discrete & Continuous Series
Direct Method :
σ = ∑d2
N
Where –
d2 (X – X) 2
N No. of Items
Direct Method :
σ = ∑fd2
N
Shortcut Method :
σ = ∑dx2 - ∑dx 2
N N
Where –
dx2 (X – A) 2
A Assumed Mean
Shortcut Method :
σ = ∑fdx2 - ∑fdx 2
N N

Business Statistics 33
Computation of Standard Deviation :
Coefficient of S.D. = σ / X
Variance = σ2
Coefficient of variation : Coefficient of variation is used for
the comparative study of stability or homogeneity in more than two or more series.
C.V = σ X 100 X
Merits :
- Based on all the items.
- Well-defined and definite measure of dispersion.
- Least affected by sample fluctuations.
- Suitable for algebraic treatment.
Demerits :
- Standard Deviation is comparatively difficult to calculate.
- Much importance is given to the extreme values.
vii) Graphical Method - Lorenz Curve :
This curve was devised by Dr. Max O‘Lorenz. He used this technique to show inequality of wealth and income of a group of people. It is simple, attractive and effective measure of dispersion, yet it is not scientific since it does not provide a figure to measure dispersion.
Merits :
- Easy to understand from the graph.
- Comparison can be done in two or more series.
- Attractive & effective.
- Concentration or density of frequency can be known from the curve.

34
Demerits :
- It is not a numerical measure; therefore it is not definite as a mathematical measure.
- Drawing of curve requires more time and labour.
Q.3 What is the best method of measuring Dispersion. Write the formula for calculating combined S.D.
Ans.: Standard Deviation is the best method of measuring dispersion as deviations taken from mean and algebraic signs are not ignored and it is algebraically correct.
Formula for calculating combined Standard Deviation :
σ12 = N1 (σ12 + D12) + N2 (σ22 + D22) + - - - - - - - - - -
N1 + N2
Where –
N1 & N2 No. of items of two series
σ1 & σ 2 S.D. of the two series
D1 X1 – X12
D2 X2 – X12
X12 Combined arithmetic mean
□ □ □

Business Statistics 35
Measures of Skewness
Q.1 Explain the various methods of measuring Skewness.
Ans.: Measures of skewness are meant to give an idea about the direction and
degree of asymmetry in a variable. These measures can be absolute or relative.
Methods of Measuring Skewness :
(i) Karl Pearson’s Measure : This measure is based on statistical
averages.
(a) Absolute Measure (Skewness) (Sk) :
Sk = X - Z or Sk = 3(X - M)
(b) Relative Measure or Coefficient of Skewness (J) :
J = X - Z or J = 3(X - M)
σ σ
The direction of skewness is represented by algebraic sign, if it is plus, skewness is positive. If it is minus, skewness is negative.
(ii) Bowley’s Measure or Quartiles Measure : Bowley‘s measure of
skewness is called second measure of skewness. This measure is useful in distributions where mode is ill-defined and can also be used in open end distributions.
SkQ = Q3 = Q1—2M
CHAPTER-6
C

36
and Coefficient of skewness (JQ) = Q3 + Q1 - 2M
Q3 - Q1
(iii) Kelly’s Measure : It is based on 90% observations and calculated
from percentiles and deciles.
Skewness = P90 + P10 – P50 or D9 + D1 – D5
and Coefficient of Skewness (Jp) = P90 + P10 – P50 or D9 + D1 – D5
P90 - P10 D9 - D1
Q.2 What is Skewness? Why a Curve is said to be Skewed? How the
Skewness of a Curve measured?
Ans.: Skewness refers to the asymmetry or lack of symmetry in the shape of a
frequency distribution. In other words, skewness describes the shape of a
distribution.
A distribution is said to be ‗skewed‘ when the mean and the median fall at
different points in the distribution, and the centre of gravity is shifted to
one side or the other – to left or right.
The concept of skewness will be clear from the following diagrams –
(i) Normal or Symmetrical
Distribution : The spread of
the frequencies is the same on both sides of the centre point of the curve. The curve drawn for such distribution is bell-shaped. The value of Mean, Median and Mode are equal.
X = M = Z
(ii) Asymmetrical or Skewed Distribution : A distribution which is
not symmetrical is called a skewed distribution. It can be of two types:

Business Statistics 37
(a) Positively Skewed
Distribution : In the
positively skewed distribution, the curve has a longer tail towards the right and the value of mean is maximum and that of mode least and the median lies in between.
Z M X
(b) Negatively Skewed
Distribution : In
negatively skewed distribution, it has a longer tail towards the left and the value of mode is ‗maximum‘ and that of mean least, the median lies in between the two.
X M Z
In order to ascertain whether a distribution is skewed or not the following
tests are applied.
Skewness is present if -
- If mean, median and mode are not equal.
- If the curve is not bell shaped.
- Quartiles are not equidistant from the median.
- If the sum of deviations from median and mode is not zero, and
- If the sum of frequencies on the two sides of the mode are not
equal, the distribution has skewness.

38
Q.3 Give the difference between Dispersion and Skewness.
Ans.:
Basis Dispersion Skewness
Nature Shows the spread of values from the central value
Shows whether series is symmetrical or asymmetrical.
Basis It depend upon the averages of second order.
Depends upon the averages of first and second order.
Relationship with moment
Based on all three moments
Based on first and third moment only.
Variability Study of the Variability Study of concentration in lower and higher variables.
Diagrammatic presentation
Cannot be presented by means of diagrams & graphs.
Skewness can be presented by diagram.
Inference All the measures of dispersion are positive.
Coefficient of skewness can be positive or negative.
□ □ □

Business Statistics 39
Index Numbers
Q.1 What is Index Numbers? Give the importance or utility of Index
Numbers?
Ans.: Index Numbers are specialized averages designed to measure the change
in a group of related variables over a period of time. Index numbers have today become one of the most widely used statistical devices and there is hardly any field where they are not used.
According to Spiegel, “An Index Number is a statistical measure designed to show changes in a variable or a group of related variables with respect to time, geographic location or other characteristics such as income, profession etc.”
Importance of Index Numbers :
(i) Help in Framing Suitable Policies : Index numbers provide guidance in administrative policy determination. For example in determining dearness allowance of the employees cost of living index are used.
(ii) They Reveal Trends : Index numbers are most widely used for
determining the commercial and industrial trends. By examining the index numbers of industrial production of last few years, we can conclude about the trend of production.
(iii) Helps in Comparative Study : Data which cannot be compared
with the help of simple averages, index numbers can be used because they are in relative form.
CHAPTER-7
C

40
(iv) Important in Forecasting : Index numbers are often used in time
series analysis, the historical study of long-term trend, seasonal variations etc.
(v) Universal Application : Index numbers are useful in economic,
commercial, social and in every field such as agriculture etc.
Q.2 What is Base Year. Distinguish between Fixed Base Method and Chain
Base Method.
Ans.: Base year is such a year with which the changes in the current year are
compared. Base year should be normal year from every aspect and it should not be affected by war, famines, inflation etc.
Base year should not be too old. The index for base period is always taken as 100.
In fixed base method, the year selected for construction of index numbers remains constant for all times and the base shall remain fixed.
While in chain base method the base year is changed every year, generally preceding year and not fixed year.
Q.3 Give the types of Weights. Why are Weights used in construction of Index Numbers?
Ans.: The term ‗Weight‘ refers to the relative importance of the different items in the construction of the index. For example in daily use the importance of wheat and rice is more than jute and iron.
Weights can be classified as follows -
(i) Explicit and Implicit weights : Explicit weights are called direct
weight. They may be in the form of quantity or value. In implicit weighing, a commodity or its variety is included in the index a numbers of times.
(ii) Fixed and Fluctuating Weight : If same weights are used from year
to year, they are called fixed weights. If weights are changed from time to time, they are called fluctuating weights.
(iii) Arbitrary and Real Weights : If real quantities or units are used,
then those weights are called real weights.

Business Statistics 41
If some unrealistic weights, according to the own will and assumptions of the investigator are used, they are called arbitrary weights.
Weights are used in construction of Index numbers because all items are not of equal importance and hence it is necessary to device some suitable method where by the varying importance of the different items is taken into account. This is done by allocating weights.
Q.4 Explain the various methods of constructing Index Numbers?
Ans.: Various methods of calculating index numbers can be shown by the
following chart –
Index Numbers (P01)
Unweighted Weighted
Simple
Aggregative
Simple
Average of Relatives
Weighted
Aggregative
Weighted
Average of Relatives
Laspeyse’s Method
Paasche’s Method
Dorbish &
Bowley’s Method
Fishers Ideal
Method
Marshall Edgeworth
Method
Kelly’s Method
(I) Unweighted Index Numbers :
(a) Simple Aggregative Method :
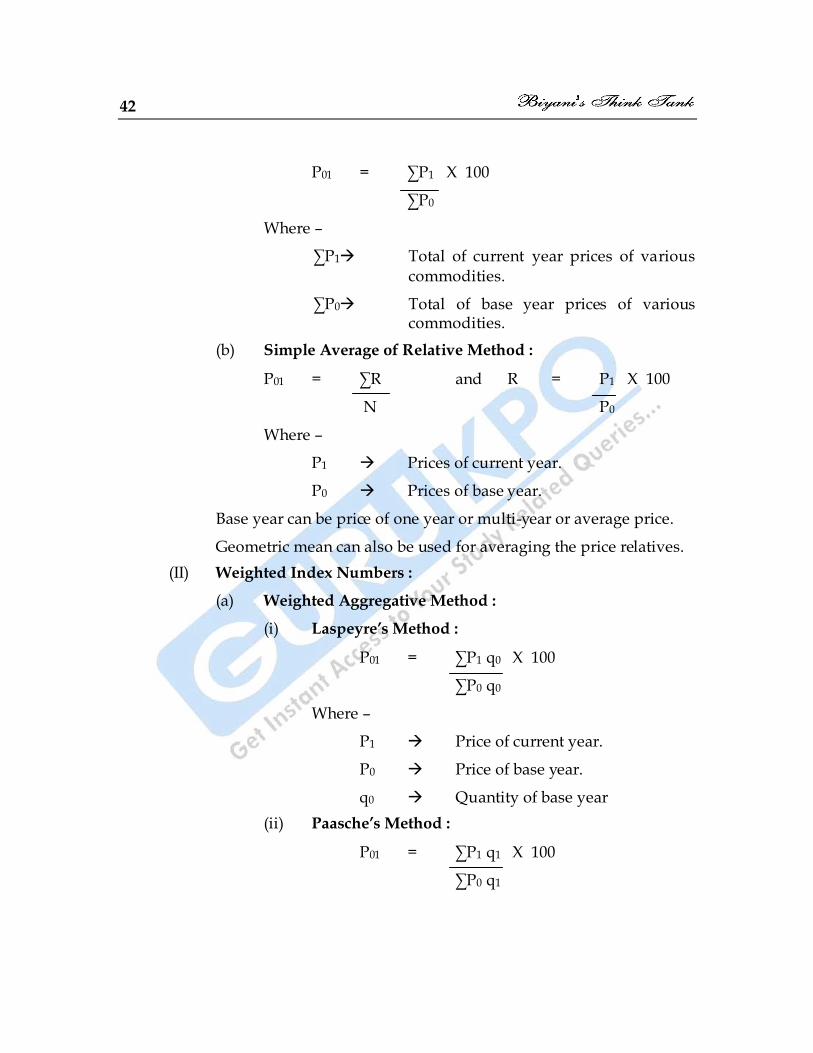
42
P01 = ∑P1 X 100
∑P0
Where –
∑P1 Total of current year prices of various commodities.
∑P0 Total of base year prices of various commodities.
(b) Simple Average of Relative Method :
P01 = ∑R and R = P1 X 100
N P0
Where –
P1 Prices of current year.
P0 Prices of base year.
Base year can be price of one year or multi-year or average price.
Geometric mean can also be used for averaging the price relatives.
(II) Weighted Index Numbers :
(a) Weighted Aggregative Method :
(i) Laspeyre’s Method :
P01 = ∑P1 q0 X 100
∑P0 q0
Where –
P1 Price of current year.
P0 Price of base year.
q0 Quantity of base year
(ii) Paasche’s Method :
P01 = ∑P1 q1 X 100
∑P0 q1

Business Statistics 43
Where –
q1 Quantity of current year.
(iii) Dorbish & Bowley’s Method :
P01 = Laspeyre‘s Index + Paasche‘s Index
2
or P01 = ∑P1 q0 + ∑P1 q1
∑P0 q0 ∑P0 q1 X 100
2
(iv) Marshall - Edgeworth’s Method :
P01 = ∑P1 q0 + ∑P1 q1
∑P0 q0 + ∑P0 q1 X 100
2
(v) Fisher’s Ideal Method :
P01 = ∑P1 q0 X ∑P1 q1 X 100 or L X P
∑P0 q0 ∑P0 q1
(iv) Kelly’s Method :
P01 = ∑P1 q X 100
∑P0 q
Where – q = q0 + q1
2
(b) Weighted Average of Relatives : In this method, the price
relatives for each commodity are obtained and these price relatives are multiplied by the value weights for each item and the product is divided by the total of weights.
Consumer price index = ΣRW
ΣW
Where R = P1 X 100 and W = P0 q0
P0

44
Q.5 Fisher’s Formula is called the Ideal Formula. Why?
Ans.: Fisher‘s formula is called the ideal because of the following reasons:
(i) It is based on geometric mean which is considered best for constructing index numbers.
(ii) It fulfills both the time reversal and factor reversal tests.
(iii) It takes into account both current year as well as base year prices and quantities.
(iv) It is free from bias.
Q.6 Explain the various tests of adequacy of Index Number.
Ans.: Following tests are applied for choosing an appropriate formula -
(i) Time Reversal Test : Time reversal test is a test to determine
whether a given method will work both ways in time, forward and back ward. This test means that if the index number of the current year is computed on the basis of base year (P01) and again the index number of the base year is calculated on the basis of current year (P10), both the index numbers should be reciprocal of each other i.e. product of both of them should be one.
Symbolically, the following relation should be satisfied -
P01 X P10 = 1
(ii) Factor Reversal Test : According to this test, an index of price, if
multiplied by an index of quantity, with the same base, given years and commodities, should be equal to the true value ratio, i.e. equal to the ratio of current year price to total price of the base year.
P01 XQ01 = ΣP1q1
ΣP0q0
If the product is not equal to the value ratio, there is, with reference to this test, an error in one or both of the index numbers.
(iii) Circular Test : This test is just an extension of the time reversal test.
The test requires that if an index is constructed for the year ‗a‘ on base year ‗b‘ and for the year ‘b‘ on base year ‗c‘, we ought to get

Business Statistics 45
the same result as if we calculated directly an index for ‗a‘ on a base year ‗c‘ without going through ‗b‘ as an intermediary. So, if there are three indices P01, P12 and P20, the circular test will be satisfied if :
P01 X P12 X P20 = 1
Q.7 What are the methods of constructing Consumer Price Index or Cost of Living Index Numbers?
Ans.: Consumer price index or cost of living index numbers are designed to
measure the effect of changes in the price of group of commodities and services on the purchasing power of a particular class of society, during any given period with reference to some fixed base. Its object is to find out how much the consumers of a particular class have to pay more for a certain basket of goods and services in a given period as compared to the base period.
Following two methods are used to construct consumer price index numbers -
(i) Family Budget method or weighted average of relatives method.
(ii) Aggregative Expenditure Method.
Family Budget Method : In this method, the price relatives for each
commodity are obtained and these price relatives are multiplied by the value weights for each item and the product is divided by the total of weights.
Consumer price index = ΣRW
ΣW
Where R = P1 X 100 and W = P0 q0
P0
This method is same as weighted average of price relatives method.
Aggregative Expenditure Method : This method is most popular method
for constructing consumer price index numbers. The prices of commodities of current year as well as base year are multiplied by the quantities consumed in the base year. The aggregate expenditure of

46
current year is divided by the aggregate expenditure of the base year and the quotient is multiplied by 100.
Consumer price Index = ΣP1q0 X 100
ΣP0q0
This method is same as Laspeyre‘s method.
Q.8 What do you understand by base Shifting? Give the formula for converting the Fixed Base Index Number to Chain Base Index Number.
Ans.: Sometimes it becomes necessary to change the base year used for
calculating index number of a series from one period to another without returning to the original date. This change of reference base period is usually referred to as ‗shifting the base‘.
Formula for converting Fixed Base Index to Chain Base Index -
Chain Base Index No. = Fixed base Index of Current Year X 100
Fixed base Index of Previous Year
Q.9 What is Splicing?
Ans.: When a series of index numbers is prepared by taking a particular year as base and then it is stopped, and the last year of that series is taken as the base year and another series is prepared. At times, it may be necessary to convert these two series into a continuous series. This procedure is called splicing.
If old series is to be related with new series, this is called forward splicing and to convert old series on the basis of new series is known as backward splicing.
a) Formula for Forward Splicing :
Old Index No. of new base year X Index No. to be adjusted
100
b) Formula for Backward Splicing :
Index No. to be adjusted X 100
Old Index No. of new base year
Business Statistics 47
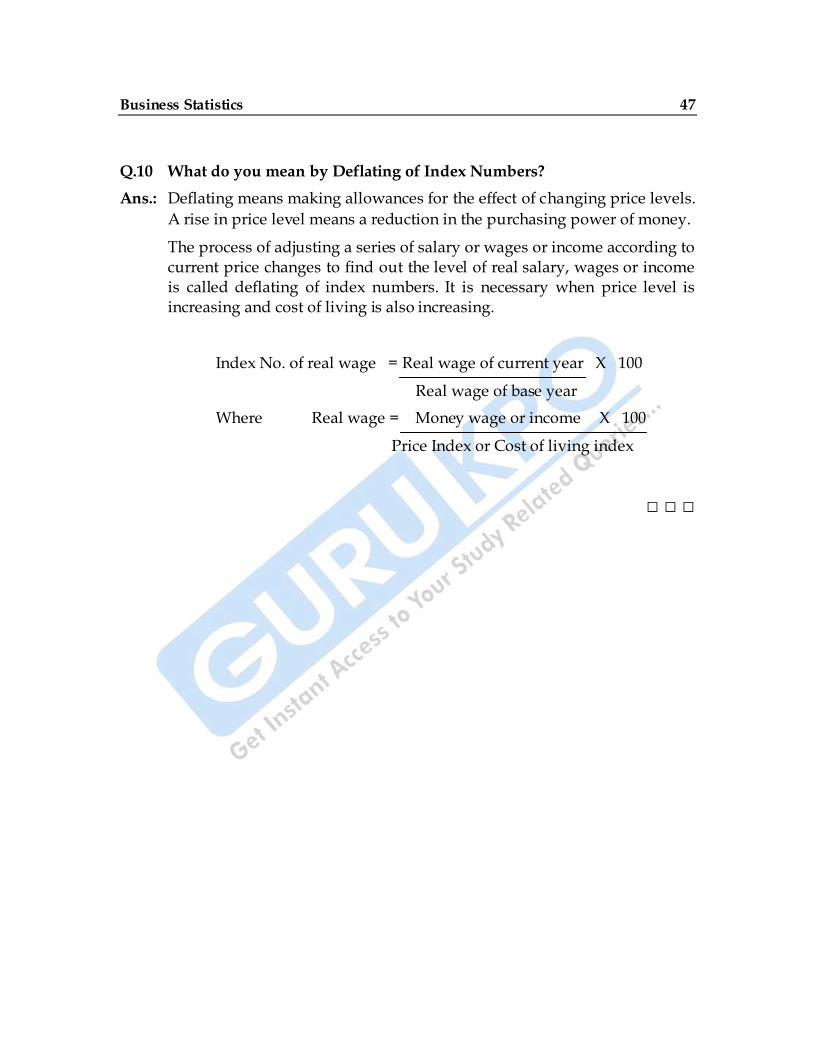
Q.10 What do you mean by Deflating of Index Numbers?
Ans.: Deflating means making allowances for the effect of changing price levels.
A rise in price level means a reduction in the purchasing power of money.
The process of adjusting a series of salary or wages or income according to current price changes to find out the level of real salary, wages or income is called deflating of index numbers. It is necessary when price level is increasing and cost of living is also increasing.
Index No. of real wage = Real wage of current year X 100
Real wage of base year
Where Real wage = Money wage or income X 100
Price Index or Cost of living index
□ □ □

48
Correlation
Q.1 What is Correlation. State the different types and degrees of
Correlation.
Ans.: If two series vary in such a way, that fluctuations in one are accompanied
by the fluctuations in the other, these variables are said to be correlated. Like rise in price of a commodity, reduces its demand and vica-versa.
Some relationship exists between age of husband and wife, rainfall and production. Two variables are said to be correlated if the change in one variable results in a corresponding change in the other variable.
According to A. M. Tuttle, “Analysis of co-variation of two or more variables is usually called correlation”.
Types of Correlation : Correlation can be of following types -
(i) Positive and Negative Correlation : If changes in two connected
series is in the same direction, i.e. increase in one variable is associated with increase in other variable, the correlation is said to be positive. For example increase in father‘s age, increase in son‘s age.
If the two related series change in opposite direction i.e. increase in one variable is associated with the corresponding decrease in other variable, the correlation is said to be negative.
(ii) Linear an Non-Linear : If the amount of change in one variable
tends to bear constant ratio of change in the other variable, the
CHAPTER-8
C

Business Statistics 49
correlation is said to be linear. We get a straight line if the variables of these series are marked on graph paper.
Correlation would be called non-linear or curvilinear if the amount of change in one variable does not bear a constant ratio to the amount of change in the other variable. For example if we double the amount of rainfall the production would not necessarily be doubled.
(iii) Simple, Partial and Multiple Correlation : When only two
variables are studied, it is called simple correlation.
If the common effect of two or more independent variables on one
dependent data series is studied, it is called multiple correlations.
For example if the study of rain, soil, temperature on potato
production per acre is studied then it is multiple correlation.
On the other hand, in partial correlation we recognize more than
two variables, but consider only two variables to be influencing
each other, the effect of other influencing variables being kept
constant.
Degree of Correlation : The interpretation of co-efficient of correlation is
based on the degree of correlation. The coefficient may be in the following
degrees -
(i) Perfect Correlation :
a) Perfect positive correlation (r) = +1
b) Perfect negative correlation (r) = -1
(ii) Absence of Correlation or No Correlation :
r = o
(iii) Limited Degree of Correlation :
(a) High degree positive or negative ±0.75 to 1.00
(b) Moderate degree positive or negative ±0.25 to 0.75
(c) Low degree positive or negative 0 to ±0.25

50
Q.3 Explain the Mathematical Methods of finding out Correlation.
Ans.: Correlation coefficient can be determined by the following methods -
(i) Karl Pearson’s Coefficient of Correlation (r) : Karl Pearson‘s
Coefficient of Correlation is widely used in practice. It is an assumption of Karl Pearson‘s coefficient of correlation that linear relations exist in both the series.
This method is considered as the best measure because it provides the knowledge of directions of changes in data i.e. positive or negative, and also shows the degree of correlation which should always lie between +1 and -1.
Computation of Karl Pearson’s Coefficient of Correlation :
Direct Method Short cut Method
Formula -
(1) r = Σ xy
√(Σx2 X Σy2)
(2) r = Σxy
N. σx. σy
Here x = X - X & Y = Y – Y
N No. of observations
Σx Standard deviation of X-series
σy Standard deviation of Y-series
Formula -
(1) r = Σdxdy – N(X - A) (Y - A)
N. σx. σy
(2) r = N . Σdxdy – (Σdx X Σdy)
√[{N.Σd2 x –(Σdx)2}[{N.Σd2y-(Σdy]2}]
Here dx = X - Ax & dy = Y - Ay
A Assumed mean
(ii) Spearman’s Rank Correlation : When it is not possible to measure
the perfect quantities due to absence of numerical facts, ranking figures are used. These ranks are determined according to the size of the data. Using ranks rather than actual observations gives the coefficient of rank correlation.

Business Statistics 51
This method was developed by the British Psychologist Charles Edward Spearman in 1904. This measure is especially useful to measure honesty, beauty, skill, wisdom etc.
Computation of Rank Correlation :
(a) First assign the ranks to the data of both the series. Rank can be assigned by taking either the highest value as I or the lowest value as 1. But whether we start with the lowest value or the highest value we must follow the same method in case of both the variables.
(b) Take the difference of two ranks (R1-R2) i.e. (D)
(c) Square the rank difference i.e. (D2)
(d) Apply the formula -
rR = 6∑ D2
N(N2 - 1)
Where -
N No. of pairs of observations.
D (R1 – R2)
In case of Tied Ranks or Equal Ranks : If some values are equal in a distribution than average rank is given to those items. The formula for calculation of correlation will be :
RP = 1 – 6 ∑d2 + 1 (m3 - m) +1 (m3 –m) - - - - - - - - - - -
12 12
N (N2 – 1)
M No. of items where ranks are common.
(iii) Concurrent Deviation Method : This method is simplest of all
methods. It is useful to know correlation of short-term changes in time-series. Sometimes it is not necessary to know the actual degree of correlation but it is important to know the direction of correlation i.e. positive or negative. For this purpose concurrent Deviation method is appropriate.

52
Computation of Correlation :
- Compare each item of both the series from its previous item. If the second item is bigger put a (+) sign; if it is smaller put a (-); and if it is equal, put a sign of (=).
- Multiply the signs of both the series.
- Total the positive signs = (C) No. of concurrent deviations.
- Apply the formula :
rc = ± ± (2C - N)
N
Where –
C No. of concurrent deviation
N No. of pairs – 1
Q. 4 What is Probable Error and Standard Error? What are the rules of testing the significance of coefficient of Correlation.
Ans. Probable Error is an expected error in Karl Pearson‘s coefficient of
correlation, which facilitates the upper limit and lower limit of possible correlation. With the help of probable error it is possible to determine the reliability of the value of the coefficient in so far as it depends on the conditions of random sampling. Formula to calculate probable error :
P.E = 0.6745 X (1 - r2)
√N
Where –
r Coefficient of correlation.
N No. of items
Standard Error : Now a days Standard Error is preferred to probable
error. Degree of standard error is standard deviation of sampling distribution in any statistics of random sampling.

Business Statistics 53
Other things remaining the same, it is essential that standard error should be small as far as possible. Smaller the standard error, more uniformity will be there in sampling distribution.
S.E. of r = (1 - r2)
√N
Rules for Testing the Significance of Coefficient of Correlation :
(i) If coefficient of correlation is more than 6 times of probable error (r > 6 P.E), it is significant.
(ii) If r is less than P.E. (r < P.E) it is not significant.
(iii) If r is less than 0.3 P.E (r < 0.3 P.E) it is insignificant.
□□□

54
Linear Regression
Q.1 Define Regression. Why are there two Regression Lines? Under what
conditions can there be only one Regression Line?
Ans.: Regression literally means ―return‖or ―go back‖. In the 19 th century,
Francis Galton at first used regression in his paper ―Regression towards Mediocrity in Hereditary Stature‖ for the study of hereditary characteristics.
Use of regression in modern times is not limited to hereditary characteristics only but it is widely used for the study of expected dependence of one variable on the other.
Therefore, the method by which best probable values of unknown data of a variable are calculated for the known values of the other variable is called regression.
Regression helps in forecasting, decision making and in studying two or more variables in economic field. It also shows the direction, quality and degree of correlation.
Regression Lines :
Regression line is that line which gives the best estimate of dependent variable for any given value of independent variable. If we take the case of two variables X and Y, we shall have two regression lines as the regression of X on Y and the regression of Y on X.
Regression Line X and Y : In this formation, Y is independent and X is
dependent variable, and best expected value of X is calculated corresponding to the given value of Y.
CHAPTER-9
C

Business Statistics 55
Regression Line Y on X : Here Y is dependent and X is independent
variable, best expected value of Y is estimated equivalent to the given value of X.
An important reason of having two regression lines is that they are drawn on least square assumption which stipulates that the sum of squares of the deviations from different points to that line is minimum. The deviations from the points from the line of best fit can be measured in two ways – vertical, i.e. parallel to Y – axis, and horizontal i.e. parallel to X axis.
For minimizing the total of the squares separately, it is essential to have two regression lines.
Single line of Regression : When there is perfect positive or perfect
negative correlation between the two variables (r = ±1) the regression lines will coincide or overlap and will form a single regression line in that case.
Q.2 What is the difference between Regression and Correlation?
Ans.: Difference between Correlation & Regression :
Basis Correlation Regression
Relationship Correlation tells the degree of average relationship between two or more variables.
Using relationship between known variables and unknown variables, the unknown variable is estimated
Cause & Effect Unable to tell which series is the cause and which is the effect, despite high degree of correlation.
The given independent variable is the ‗cause‘ and dependent variable is the effect.
Change in scale Unaffected by the change of origin and scale.
Regression coefficient is affected by change in scale.
Application Limited Application. Wider Application.

56
Q.3 How are Regression Equations derived? Explain.
Ans.: Computation of Regression Equations : Algebraic expression of
regression lines is called regression equations. Like lines equations are also two :
Regression Equation X on Y Regression Equation Y on X
Original Form :
X = a + by
Formula :
X - X = bxy (Y - Y)
Here -
X Mean of x series.
Y Mean of y series.
bxy Regression coefficient X on Y
Original Form :
Y = a + bx
Formula :
Y - Y = byx (X - X)
Here -
X Mean of x series.
Y Mean of y series.
byx Regression coefficient Y on X
Computation of Regression Coefficients :
1. Direct Method :
bxy = Σxy
Σy2
or
bxy = r σx
σy
1. Direct Method :
byx = Σxy
Σx2
or
byx = r σy
σx
2. Short Cut Method :
bxy = N. Σdxdy – (Σdx . Σdy)
N.Σd2y – (Σdy)2
Here - dx = X - A
dy =Y - A
2. Short Cut Method :
bxy = N. Σdxdy – (Σdx . Σdy)
N.Σd2x – (Σdx)2
Here - dx = X - A
dy =Y - A
Q.4 Give the interpretation of Regression Coefficients. How Correlation is calculated from Regression Coefficients?

Business Statistics 57
Ans.: Interpretation of Regression Coefficients :
(i) If both the coefficients are positive correlation coefficient will be positive, and if both the coefficients are negative, the coefficient of correlation will also be negative.
(ii) Both the regression coefficients will have the same sign.
(iii) The product of both the regression coefficients cannot be more than 1.
Calculation of Correlation Coefficient from Regression Coefficient :
r = (bxy) X (byx)
bxy Regression coefficient x on y
byx Regression coefficient y on x.
□□□

58
Diagrammatic and Graphic Presentation
Q.1 What is Diagrammatic Representation? State the importance of
Diagrams.
Ans.: Depicting of statistical data in the form of attractive shapes such as bars,
circles, rectangles is called diagrammatic presentation.
A diagram is a visual form of presentation of statistical data, highlighting
their basic facts and relationship. There are geometrical figures like lines,
bars, squares, rectangles, circles, curves, etc. Diagrams are used with
great effectiveness in the presentation of all types of data.
When properly constructed, they readily show information that might
otherwise be lost amid the details of numerical tabulation.
Importance of Diagrams :
A properly constructed diagram appeals to the eye as well as the mind
since it is practical, clear and easily understandable even by those who are
unacquainted with the methods of presentation. Utility or importance of
diagrams will become clearer from the following points -
(i) Attractive and Effective Means of Presentation : Beautiful lines
;full of various colours and signs attract human sight, and do not
strain the mind of the observer. A common man who does not
CHAPTER-10
C

Business Statistics 59
wish to indulge in figures, get message from a well prepared
diagram.
(ii) Make Data Simple and Understandable : The mass of complex
data, when prepared through diagram, can be understood easily.
According to Shri Morane, “Diagrams help us to understand the
complete meaning of a complex numerical situation at one sight
only”.
(iii) Facilitate Comparison : Diagrams make comparison possible
between two sets of data of different periods, regions or other facts
by putting side by side through diagrammatic presentation.
(iv) Save Time and Energy : The data which will take hours to
understand, becomes clear by just having a look at total facts
represented through diagrams.
(v) Universal Utility : Because of its merits, the diagrams are used for
presentation of statistical data in different areas. It is widely used
technique in economic, business, administration, social and other
areas.
(vi) Helpful in Information Communication : A diagram depicts more
information than the data shown in a table. Information
concerning data to general public becomes more easy through
diagrams and gets into the mind of a person with ordinary
knowledge.
Q.2 Explain in brief the various types of Diagrams?
Ans.: The different types of diagrams can be divided into following heads -
(1) One dimensional diagrams
(2) Two dimensional diagrams
(3) Three dimensional diagrams
60
(4) Pictograms
(5) Cartograms
(1) One Dimensional Diagrams or Bar Diagrams :
Bar diagrams are the most common types of diagram. A bar is a
thick line whose width is shown merely for attention. They are
called one dimensional because it is only the length of the bar that
matters and not the width.
Kinds of Bar Diagrams :
(i) Line Diagrams : When the number of items is large, but the
proportion between the maximum and minimum is low,
lines may be drawn to economise space. Only individual or
time series are represented by these diagrams
(ii) Simple Bar Diagrams : A simple bar diagram is used to
represent only one variable. For example the figures of
sales, production etc. of various years may be shown by
means of simple bar diagram. The bars are of equal width
only the length varies.
These diagrams are appropriate in case of individual series,
discrete series and time series.
(iii) Multiple Bar Diagrams : In a multiple bar diagram, two or
more sets of interrelated data are represented. Different
shades, colors or dots are used to distinguish between the
bars.
These are used to compare two or more related variables
based on time and place.
(iv) Sub-divided Bar Diagrams : If a bar is divided into more
than one parts, it will be called sub-divided bar diagram.
Each component occupies a part of the bar proportional to
its share in the total. For example total expenditure incurred

Business Statistics 61
by a family on various items such as food, clothing,
education, house rent etc can be represented by means of
sub-divided bar diagram.
(v) Percentage Sub-Divided Bar Diagrams : Percentage sub-
divided bars are particularly useful to measure relative
changes of data. When such diagrams are prepared, the
length of the bar is kept equal to 100 and segments are cut in
these bars to represent the components of an aggregate.
(vi) Profit – Loss Diagrams : If relative change of cost & sales or
profit or loss are to be represented with the help of bars, then
profit – loss diagram are constructed. These diagrams are
similar to percentage sub-divided bars and are prepared in
the same way.
(vii) Duo-Directional Bar Diagrams : In duo-directional bar
diagram comparative study of two major parts of data is
represented in a single bar. Such duo directional diagrams
are represented on both sides of the horizontal axis, i.e.
above and below the base line.
(viii) Paired Bars : If two different informations which are in
different units are to be presented then paired bar diagram
are used. These bars are not vertical but horizontal and the
first scale is in the first half and second scale is in the second
half.
(ix) Deviation Bar Diagram : Deviation bars are popularly used
for representing net quantities i.e. net profit, net loss, net
exports or net imports etc. Such bars can have both positive
or negative values. Positive values are shown above the
base line and negative values below it.
(x) Progress Chart or Gant Chart : These charts are mainly
used in factories for comparing the actual production with
targeted production. By looking at it, it can be known how

62
much production has been achieved and how much they are
lacking behind the capacity.
(xi) Pyramid Bar Diagram : These diagrams are constructed to
show population distribution. The distribution of
population according to sex, age, education etc are
represented by this diagram. In this diagram, the base line is
in the middle and its shape is like a pyramid.
(xii) Sliding Bar Diagrams : These bars are like deo-directional
bars but instead of absolute figures percentages of two
variables are shown. One of them is shown on the right side
of the base and the other on its left.
(2) Two Dimensional Diagrams :
In two dimensional diagrams, the height as well as the width of the
bars will be considered. The area of the bars represents the
magnitude of data. Such diagrams are also known as area diagrams
or surface diagrams.
The important types are –
(i) Rectangle diagram
(ii) Square diagram
(iii) Circle or Pie diagram
(i) Rectangle Diagram : Rectangles are often used to represent
the relative magnitude of two or more values. The area of
rectangles is kept in proportion to the values.
They are placed side by side like bars and uniform space is
left between different rectangles.
The rectangles may be of different types -
a) Simple Rectangles
b) Sub-divided Rectangles

Business Statistics 63
c) Percentage sub-divided Rectangles
(ii) Square Diagrams : When there is a large difference between
the extreme values (example the smallest value is 4 and the
biggest value is 800) is such a case square diagram is more
appropriate.
First of all square roots of the given values are calculated
and the sides are taken in the proportion of square roots. The
squares are drawn on the common base line, serially either
in increasing or decreasing heights to have beautiful and
attractive appearance.
For calculating the scale, the area is calculated by squaring
its side, on the basis of that value of 1 sq.cm. is calculated.
(iii) Circle or Pie Diagram : These diagrams are more attractive,
therefore, pie diagrams are preferred to square diagrams.
These diagrams are used to represent data of population,
foreign trade, production etc.
The square roots of the given values are calculated and then
it is divided by some common factor so as to attain the radii
for the circles. The area of the circle is calculated by the
formula - (r2) . The sides for squares are taken as the radii
for different circles.
A circle can also be sub-divided on the basis of angles to be
calculated for each component. There is 360 degree at the
centre of the circle and proportionate sectors are cut taking
the whole data equal to 360 degrees. Such a circle is known
as sub-divided circle or Angular diagram.
(3) Three Dimensional Diagrams :
In three-dimensional diagrams length, width and height (depth)
are taken into consideration. If the difference between the
minimum and maximum value is so wide as it is difficult to

64
represent them by square or circle diagram, then three dimensional
diagram is used. For this cubic roots of the given numbers is
calculated. Three dimensional diagrams include cubes, blocks,
spheres and cylinders etc.
(i) Pictorgrams : Pictograms are used by government and non-
government organizations for the purpose of advertisement
and publicity through appropriate pictures. It is a popular
technique particularly when statistical facts are to be
presented for a layman having no background of
mathematics or statistics.
For representing data relating to social, business and
economic phenomena for general masses in fairs and
exhibitions, this method is used.
(ii) Cartograms : Cartograms or statistical maps are also used to
represent data. Cartograms are simple and elementary form
of visual presentation and are very easy to understand.
While highlighting the regional or geographical
comparisons, mapographs or cartograms are generally used.
Q.3 What is Graphic Presentation?
Ans.: According to M.M. Blair – “ The simplest to understand, the easiest to
make, the most variable and the most widely used type of chart is
graph.”.
Graphic presentation is a visual form of presenting statistical data. Graph
acts as a tool of analysis and makes complex data simple and intelligible.
Graphs are more appropriate in the following cases -
a) If tendency instead of real measurement is important.
b) When comparative study of many data series is required on one
graph.

Business Statistics 65
c) If estimation and interpolation are to be presented by graph.
d) If frequency distribution is presented by two or more curves.
Q.4 What is False Base Line?
Ans.: While making the graph the vertical scale (y-axis) must start from zero
origin. But in some cases adjustment of scale is not possible on (y-axis)
starting with zero since the values are big. If the vertical scale begins with
zero, the curve will be concentrated mostly on the top of the graph paper.
In such cases that portion of the scale from zero to the minimum value of
items to be depicted is omitted. This fact is indicated in the graph paper
itself either by drawing a double saw tooth lines in the empty space or by
a cut in y-axis. This is known as using false base line. It is drawn in this
way to show that Y axis is lost in between.
Q.5 What is Historigram? Give the difference between Absolute
Historigram and Index Historigram.
Ans. The curve drawn on graph paper by presenting variables of time series is
called ‗Historigram‘, because it reveals the past history of data. A time
series is an arrangement of statistical data in a chronological order with
reference to occurrence of time. Time period may be a year, quarter,
month, week, days, hours etc. Such graphs may be drawn on natural
scale or ratio scale.
When actual values of a variable are plotted on a graph paper, it is called
absolute historigram. Absolute historigram can be of (i) one variable (ii)
two or more variables.
Index historigrams are obtained by plotting index numbers of actual
values on a graph paper. If index numbers are not given, the same may be
calculated of the original values. It shows relative changes.

66
Q.6 What are the various types of graphs of frequency distribution?
Ans.: Frequency distribution can also be presented by means of graphs. Such
graphs facilitate comparative study of two or more frequency
distributions as regards their shape and pattern. The most commonly
used graphs are as follows -
(i) Line frequency diagram
(ii) Histogram
(iii) Frequency Polygon
(iv) Frequency curves
(v) cumulative frequency curves or Ogine curves
Line Frequency Diagram : This diagram is mostly used to depict discrete
series on a graph. The values are shown on the X-axis and the frequencies
on the Y axis. The lines are drawn vertically on X-axis against the relevant
values taking the height equal to respective frequencies.
Histogram : It is generally used for presenting continuous series. Class
intervals are shown on X-axis and the frequencies on Y-axis. The data are
plotted as a series of rectangles one over the other. The height of rectangle
represents the frequency of that group. Each rectangle is joined with the
other so as to give a continuous picture.
Histogram is a graphic method of locating mode in continuous series.
The rectangle of the highest frequency is treated as the rectangle in which
mode lies. The top corner of this rectangle and the adjacent rectangles on
both sides are joined diagonally . The point where two lines interact each
other a perpendicular line is drawn on OX-axis. The point where the
perpendicular line meets OX-axis is the value of mode.
Frequency Polygon : Frequency polygon is a graphical presentation of
both discrete and continuous series.
For a discrete frequency distribution, frequency polygon is obtained by
plotting frequencies on Y-axis against the corresponding size of the
variables on X-axis and then joining all the points ;by a straight line.

Business Statistics 67
In continuous series the mid-points of the top of each rectangle of
histogram is joined by a straight line. To make the area of the frequency
polygon equal to histogram, the line so drawn is stretched to meet the
base line (X-axis) on both sides.
Frequency Curve : The curve derived by making smooth frequency
polygon is called frequency curve. It is constructed by making smooth the
lines of frequency polygon.
This curve is drawn with a free hand so that its angularity disappears and
the area of frequency curve remains equal to that of frequency polygon.
Cumulative Frequency Curve or Ogine Curve : This curve is a graphic
presentation of the cumulative frequency distribution of continuous
series. It can be of two types -
(a) Less than Ogive and
(b) More than Ogive.
Less than Ogive : This curve is obtained by plotting less than cumulative
frequencies against the upper class limits of the respective classes. The
points so obtained are joined by a straight line. It is an increasing curve
sloping upward from left to right.
More than Ogive : It is obtained by plotting ‗more than‘ cumulative
frequencies against the lower class limits of the respective classes. The
points so obtained are joined by a straight line to give ‗more than ogive‘.
It is a decreasing curve which slopes downwards from left to right.
Median and partition values can be known from this curve. The point at
which the ‗less than‘ and ‗more than‘ ogive curves intersect gives the
value of median.
□□□

68
Practical Exercise
Q.1 Change the following cumulative frequency into simple frequency -
Marks No. of students
Less than 5 7
Less than 10 20
5 – 15 38
15 & above 55
20 – 25 20
25 & above 5
30 & above 1
Q.2 Prepare a blank table showing distribution of workers according to sex,
age groups, in three big industries of a State during three years. Give proper headings, lines, double lines and columns of uses in your table.
Q.3 Calculate Mean, Median & Mode from the following data –
Wages No. of workers
20 – 60 80
20 – 55 74
20 – 40 40
CHAPTER-11
C

Business Statistics 69
20 – 30 12
20 – 50 67
20 – 45 55
20 – 25 5
20 – 35 22
Q.4 Calculate both the quartiles and 45th percentile from the following data -
Marks less than : 10 20 30 40 50 60 70 80 No. of students : 4 16 40 76 96 112 120 125
Q.5 (A) A machine is assumed to depreciate 20% of its value in first year,
30% in the second year and 20% per annum for the next two years.
Depreciation is calculated on reducing balance system. What is the
average percentage depreciation for four years?
(B) In a class, average weight of 150 students is 80 kilograms. The
average weight of boys and the girls is 85 kilograms and 70
kilograms respectively. Find out the number of boys and girls in
the class.
(C) A man purchases 5 rolls of ribbins each measuring 60 metres @ 4, 6,
10, 12 and 15 metres a rupee respectively. Find the average rate of
ribbins. Will it makes any difference if the man purchases ribbins
worth Rs.4/- from each of the above rolls.
Q.6 Calculate range and semi-inter quartile range and its coefficient -
Central size : 1 2 3 4 5 6 7 8 9 10
Frequency : 2 9 11 14 20 24 20 16 5 2
Q.7 Calculate Mean Deviation, Standard Deviation and coefficient of variation
from the following data -

70
Wages (in Rs.) :
48 & Above
40 & Above
32 – 40 16 – 32 8 – 24 Less than 16
Less than 8
No. of Persons :
5 15 20 45 32 20 8
Q. 8 Calculate coefficient of skewness from the following -
Difference between both the quartiles =8, Median = 10.5, Sum of both the quartiles = 22
Q.9 Calculate Karl Pearson‘s co-efficient of skewness from the following
figures -
Income No. of persons
0 & not exceeding 9 75
10 & not exceeding 19 100
20 & not exceeding 29 302
30 & not exceeding 39 603
40 & not exceeding 49 452
50 & not exceeding 59 63
60 & not exceeding 69 25
Q.10 Calculate Bowley‘s coefficient of skewness -
Size of colour (cm) : 0 2 3 4-5 6-9 10-14 15-25
No. of shirts : 1 3 2 4 7 3 1
Q. 11 From the following data, calculate index numbers (i) taking 2003 as base
year, and (ii) average price as base.
Commodities 2003 2004 2005
A 2 4 6

Business Statistics 71
B 4 4 7
C 5 12 13
D 10 8 12
Q.12 Calculate Index No. for 2006 by -
(i) Aggregative expenditure Method
(ii) Family Budget Method
Items Qty Unit Price in 2005 Price in 2006
Wheat 2 qtl. Qtl. 100 150
Rice 25 kg. Qtl. 200 240
Pulses 10 kg Qtl 160 240
Ghee 10 kg kg 13 15.6
Oil 0.25 qtl. Kg. 4 6.0
Clothing 50 metre Metre 4 4.5
Fuel 4 Qtl Qtl 16 20.0
Rent 1 House House 40 50
Q.13 Construct Laspeyre‘s, Paasche‘s and Fishers Index No. from the following data -
Base Year Current year
Commodity Price Qty Price Qty.
A 5 25 6 30
B 10 5 15 4
C 3 40 2 50
D 6 30 8 35
Q.14 If coefficient of correlation is 0.7 and N=9. Test the significance of
correlation.

72
Q.15 Calculate coefficient of correlation between sickness and death rate.
Age Group No. of persons No. of sick persons No. of deaths
0 – 10 1000 400 200
10-30 5000 1000 250
30-35 8000 2000 800
35-50 10000 7000 5000
50 & above 2000 1600 1200
Q.16 Marks obtained by 15 students in subjects A and B are given in rank
order. Ranks given in brackets represent the rank in subject A and B.
Calculate Rank correlation.
(1, 10) (2, 7) (3, 2) (4, 6) (5, 4) (6, 8) (7, 3) (15, 13) (8, 1) (9, 11) (10, 15)
(11, 9) (12, 5) (13, 14) (14, 12)
Q.17 Is there any inconsistency in the following calculation as regards
regression analysis?
bxy = 0.8 and byx = 1.6
Q.18 Given are the following values regarding X and Y series -
X Y
Arithmetic mean 36 85
Standard Deviation 11 08
Coefficient of Correlation between X and Y = 0.66
(i) Find two regression equations.
(ii) Estimate value of X when Y = 75

Business Statistics 73
Q.19 The heights of fathers and sons are given in the following table -
Height of father (inches) : 65 66 67 67 68 69 71 73
Height of Son (inches) : 67 68 64 68 72 70 69 70
Find the two regression lines and calculate the expected average height of the son when the height of the father is 67.5 inches.
□ □ □

74
B. Com (Part-I) Examination, 2011
(10+2+3 Patterns) (Faculty of Commerce)
Accountancy and Business Statistics Second Paper : Business Statistics
Time : One Hour Objective Part- I Max. Marks.: 40 Attempt All Questions.
1. Answer each of the following questions in not more than 20 words. Each question carries two marks.
(i) Enumerate four main characteristics of Data(statistics).
(ii) State the meaning of secondary data.
(iii) What is an arithmetic average?
(iv) What is meant by unbiased error?
(v) Find out coefficient of variation if:
20, 170, 2N Fx
(vi) What is the formula given by Bowley for measuring skewness?
(vii) State the Fisher’s Formula of Time Reversal Test.
(vii) When should the rank difference method be used,
(ix) If the value of one regression coefficient is more than 1, what should be
the value of an another regression coefficient?
(x) Assumed Mean = 10, sum of product of frequency and deviation
( 50Fx ) , No of items = 10, calculate mean.
2. Answer each of the following questions in not more than 50 words. Each question
carries four marks.
.(i) Calculate Median if 45, 36x z
(ii) Calculate Fisher’s index No:

Business Statistics 75
1 1 0 0
1 1 0 0
2207 1600
2040 1510
p q p q
p q p q
(iii) If variance = 144, 50x , Calculate coefficient of variation.
(iv) If two regression coefficient are 0.5 and 0.9 , find the value of coefficient
of correlation.
(v) What is double bars diagram?
DESCRIPTIVE PART- II
Time: Two Hours Max. Marks: 60
Attempt three questions in all, Selection at least one question from each Section. All
questions carry equal marks of 20 each
Section-A
3. Differentiate between Primary data and Secondary data. Examine critically the
important method of collection of primary data.
4. The following data relate to income of employees of a concern in two different
years:
Income in Rs. Number of Employees
1996 1998
100 - 200 10 15
200 – 300 15 30
300 – 400 20 45
400 – 500 25 50
500 – 600 20 35

76
600 and above 10 25
The total income of 10 employees in the last group in 1996 was Rs. 8,000
whereas of 25 employees in 1998 was Rs 20,000:
(i) Find out the total income of all employees in the year 1996 and 1998
(ii) Ascertain the range of income of middle 50% employee in the year 1996.
Section B
5. Pension payable by company to its employees are as follows:
Age Group Pension
60 – 64 15
64 – 68 20
68 – 72 25
72 – 76 30
76 – 80 35
80 – 84 40
The age of 20 persons who secured pension rights are given below:
61, 64, 62, 70, 72, 73, 75, 78, 82, 83, 80, 66, 71, 70, 65, 77, 81, 63, 69 and 77 Calculate the monthly average pension payable and standard deviation.
6. In 1999 in an enquiry of two towns A and B it was found that the average working class was spending on food and other item as following:
Town A Town B
Food 64% 50%
Other item 36% 50%
In 2001 the consumer price index stood at 279 for town A and 265 for town B
(Base year 1999 = 100) it was known that the rise in price of all articles consumed by the working class was the same for A and B. Calculate the index for:
(i) Food
(ii) Other item for 2001
Section C
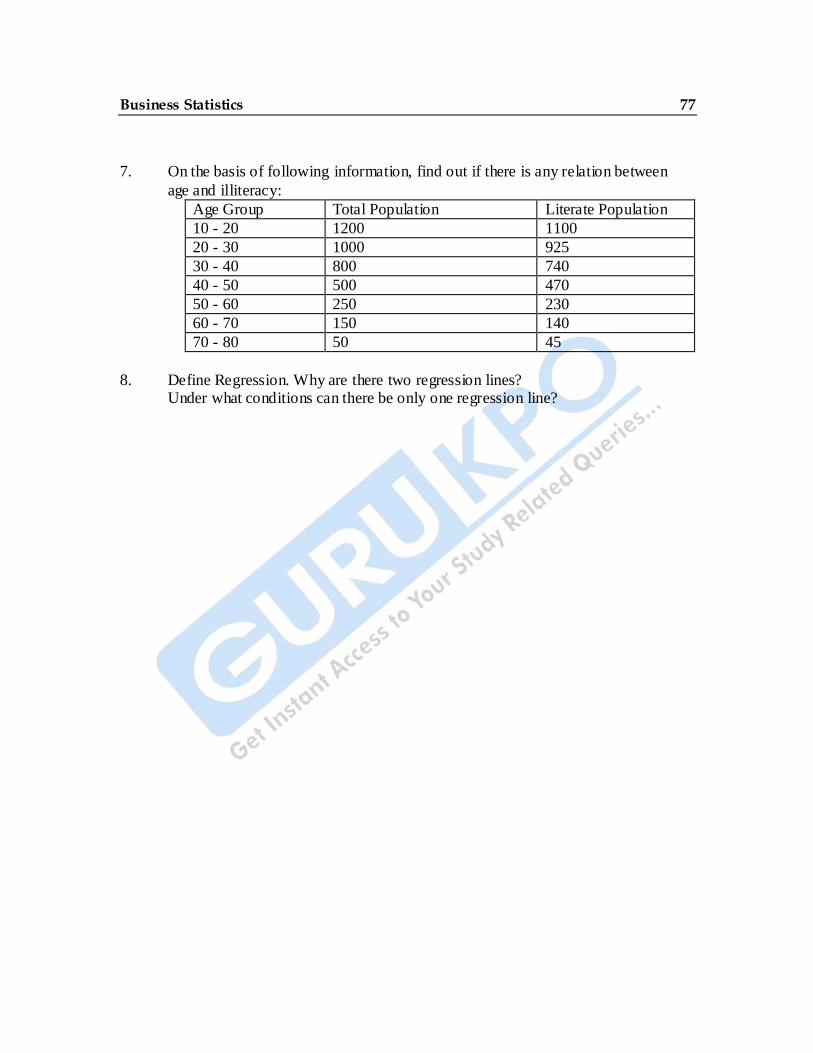
Business Statistics 77
7. On the basis of following information, find out if there is any relation between
age and illiteracy:
Age Group Total Population Literate Population
10 - 20 1200 1100
20 - 30 1000 925
30 - 40 800 740
40 - 50 500 470
50 - 60 250 230
60 - 70 150 140
70 - 80 50 45
8. Define Regression. Why are there two regression lines? Under what conditions can there be only one regression line?

78
B. Com (Part-I) Examination, 2010
(10+2+3 Patterns) (Faculty of Commerce)
Accountancy and Business Statistics Second Paper : Business Statistics
Time : One Hour Objective Part- I Max. Marks.: 40 Attempt All Questions.
1. Answer each of the following questions in not more than 20 words. Each question
carries two marks.
(i) What do you understand by data?
(ii) What do you understand by statistic?
(iii) What are primary data?
(iv) Give main difference between questionnaire and schedule.
(v) What is frequency distribution?
(vi) Find out mode :
Central size: 1 2 3 4 5 6
Frequency : 4 8 20 16 10 6
(vii) What is an arithmetic average?
(viii) State the Fisher's formula of factor reversal test.
(ix) State the Bowley formula for measuring Skewness.
(x) What do you understand by one dimensional diagram?
2. Answer each of the following questions in not more than 50 words. Each question
carries four marks.
(i) What is an inclusive series?
(ii) Write a brief note on law of inertia of large numbers.

Business Statistics 79
(iii) Find out inter-quartile range from the following data:
Size : 10 15 18 40 25 35 50
Frequency : 2 12 20 15 3 5 5
(iv) What do you understand by correlation?
(v) What is meant by Consumer Price Index?
DESCRIPTIVE PART- II
Time: Two Hours Max. Marks: 60
Attempt three questions in all, Selection at least one question from each Section. All
questions carry equal marks of 20 each
Section-A
3. Define 'Statistics'. Discuss its scope and limitations.
4. Calculate median and mode from the following table:
Wages in Rs. No. of Persons
Less than 8 5
Less than 16 12
8 -24 29
24 and above 31
32- 40 8
40 and above 19
48 and above 5
Section- B
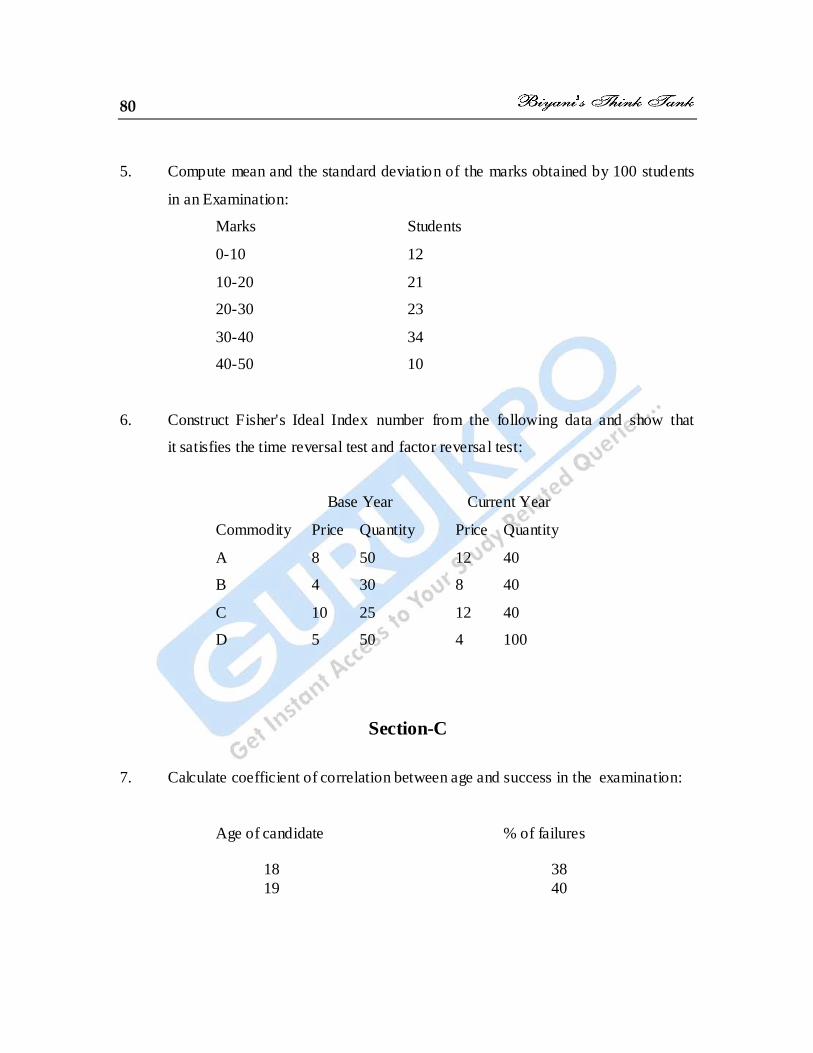
80
5. Compute mean and the standard deviation of the marks obtained by 100 students
in an Examination:
Marks Students
0-10 12
10-20 21
20-30 23
30-40 34
40-50 10
6. Construct Fisher's Ideal Index number from the following data and show that
it satisfies the time reversal test and factor reversal test:
Base Year Current Year
Commodity Price Quantity Price Quantity
A 8 50 12 40
B 4 30 8 40
C 10 25 12 40
D 5 50 4 100
Section-C
7. Calculate coefficient of correlation between age and success in the examination:
Age of candidate % of failures 18 38
19 40

Business Statistics 81
20 35
21 32 22 34 23 37
24 42 25 46
26 52 27 56
8. Calculate the regression equation from the following data:
X Y 1 9
2 8 3 10
4 12 5 11 6 13
7 14 8 16
9 15

82
B. Com (Part-I) Examination, 2009
(10+2+3 Patterns) (Faculty of Commerce)
Accountancy and Business Statistics Second Paper : Business Statistics
Time : One Hour Objective Part- I Max. Marks.: 40 Attempt All Questions.
1. Answer each of the following questions in not more than 20 words. Each question
carries two marks.
(i) Give a main definition of statistics in singular sense.
(ii) State the main functions of statistics.
(iii) Give main difference between questionnaire and schedule.
(iv) What is Census Investigation?
(v) Wages is Census Investigation.?
(vi) Find Harmonic mean, if arithmetic mean is 20 and geometric.
(vii) State the fisher's formula of Time reversal test.
(viii) State the meaning of Correlation.
(ix) State the regression equation of 'X' on 'Y'.
(x) What is false base line?
2. Answer each of the following questions in not more than 50 words. Each question carries four marks.
(i) Distinguish between primary and secondary data.
(ii) Write a brief note on law of inertia of large numbers.
(iii) Explain the difference Skewness and Dispersion.
(iv) Explain the given information find out regression coefficient of 'Y' and 'X'

Business Statistics 83
N=8, ∑dx = 56, ∑dy = 40, ∑d2x = 524, ∑d2y = 256, ∑dxdy = 364
(v) Explain the meaning and types of two dimensional diagrams.
DESCRIPTIVE PART- II
Time: Two Hours Max. Marks: 60
Attempt three questions in all, Selection at least one question from each Section. All questions carry equal marks of 20 each
Section-A
3. What is questionnaire? What precautions should be taken in drafting a good
questionnaire?
4. Calculate the Mean, Median and Mode from the following data;
Wages (Rs.) No. of Workers
20-60 80
20-55 74
20-40 40
20-30 12
20-50 67
20-45 55
20-25 5
20-35 22
Section – B
5. For the frequency distribution given below, calculate the coefficient of Skewness based on quartiles:

84
Wages (Rs.) No. of Workers
10-19 5
20-29 9
30-39 14
40-49 20
50-59 25
60-69 15
70-79 8
80-89 4
6. An association of drinkers consists of 50 members using standard drinks.
Calculate weighted consumer price index for 2008 based on 2007- prices.
Name of
the Drink
Price in 2007
(per bottle Rs.)
Price in 2008
(per bottle Rs.)
Whisky 120 150
Rum 110 121
Gin 80 100
Brandy 60 90
Wine 20 24
Tharra 20 16
Out of 50 members, 10 members prefer to take Whisky, 5 members Gin, 8
members brandy, 7 members Rum, 12 members Wine and the rest prefer to take
Tharra.
Section-C
7. Find out coefficient of correlation between age and playing habit from the
following data:
Age Group No. of Student Regular Players
15-16 200 150
16-17 270 162
17-18 340 170

Business Statistics 85
18-19 360 180
19-20 400 180
20-21 300 120
8. From the given data prepare a cumulative frequency curve with more than type
cumulative frequencies:
Production (in units) No. of Workers
10 – 15 5
15 – 20 8 20 – 25 15
25 – 30 20
30 – 35 16 35 – 40 10
40 – 45 6

86
B. Com (Part-I) Examination, 2008
(10+2+3 Patterns) (Faculty of Commerce)
Accountancy and Business Statistics Second Paper : Business Statistics
Time : One Hour Objective Part- I Max. Marks.: 40 Attempt All Questions.
1. Answer each of the following questions in not more than 20 words. Each question
carries two marks.
(i) "Ram has secured 90 percent marks in Statistics, whereas his height is 1.9
metres and weight 58 kg." Would you call these as data, state with reasons?
(ii) Write two causes of distrust of statistics.
(iii) Name any four sources of collection of secondary data.
(iv) What is bivariate frequency distribution?
(v) The mean wages of 100 laborers working in a factory running two shift of 60
and 40 laborers respectively is Rs. 38, the mean of 60 laborers working in the
morning shift is Rs.40 find the mean wages of 140 laborers working in the
evening shift.
(vi) If the variance of a series is 144 and the mean is 50, find out the coefficient
of variation.
(vii) What is the formula given by Bowley for measuring Skewness?
(viii) What is the meaning of deflating of index numbers?
(ix) Why are there two regression lines?
(x) What is cumulative frequency curve or give curve?
2. Answer each of the following questions in not more than 50 words. Each question carries four marks.

Business Statistics 87
(i) What does the law of statistical regularity show? Explain.
(ii) Draw a blank table to present information regarding the college students
according to :
(a) Faculty – Arts, commerce and science
(b) Sex - Male and female
(c) For 2 years - 2005-2006
(iii) An airplane travels distance of 2,500 1,200 and 500 kms. At speeds 500, 500
and 250 kms. Per hour respectively. Find the average speed for the entire trip.
(iv) When is the false base line used?
(v) What is the difference between historigram and histogram?

88
DESCRIPTIVE PART- II
Time: Two Hours Max. Marks: 60
Attempt three questions in all, Selection at least one question from each Section. All
questions carry equal marks of 20 each.
Section-A
3. What is "Statistical Sampling”? Describe the various methods of statistical
sampling.
4. Find the missing frequency in the following distribution. if N = 100 and median is
30 :
Marks No. of Student
0-10 10
10-20 ?
20-30 25
30-40 30
40-50 ?
50-60 10
Section-B
5. Calculate the standard deviation and its coefficient from the following data:
Wages in Rs. No. of person
48 and above 5
40 and above 15
32-40 20
16-32 45

Business Statistics 89
8-24 32
Less than 16 20
Less than 8 8
6. Construct Fisher's ideal index no. form the following table:
Articles Base Year Current Year
Price Quantity Price Quantity
Food 16 50 24 45
Clothing 18 30 24 25
Rent 20 5 15 8
Fuel 10 6 12 6
Misc. 10 10 14 12
Section-C
7. The results of B.Com. Examination is given below from the following data.
Calculate coefficient of correlation between age and success in the examination.
Age in year’s % of failures
18 38
19 40
20 35
21 32
22 34
23 37

90
24 42
25 46
26 52
27 56
8. From the data given below, find the expected value of X when the value of Y
is 15, and find the expected value of Y when the value of X is 30:
Arithmetic mean of X variable = 40
Arithmetic mean of Y variable = 20
S.D. of X variable ( x) = 5
S.D. of Y variable ( y)= 7
Coefficient of correlation between X and Y variables r = + 0.90

Business Statistics 91
B. Com (Part-I) Examination, 2007
(10+2+3 Patterns) (Faculty of Commerce)
Accountancy and Business Statistics Second Paper : Business Statistics
Time : One Hour Objective Part- I Max. Marks.: 40 Attempt All Questions.
1. Answer each of the following questions in not more than 20 words. Each question
carries two marks.
(i) Enumerate four main characteristics of data (statistics)
(ii) Give main difference between questionnaire and schedule.
(iii) What is the main difference between census and sample investigations?
(iv) State two precautions to be taken into consideration in editing secondary
data.
(v) State the formula of Prof. H.A. sturges to find out the number of classes.
(vi) If in a frequency distribution mean deviation is 12, find the most probable
value of standard deviation and quartile deviation of the distribution.
(vii) If variance of x = 9, byx = 0.8 and r = 0.6 find out value of y ,
(viii) What is cumulative frequency curve or ogive curve?
(ix) State the main difference between Dispersion and Skewness.
(x) State the meaning of correlation.
2. Answer each of the following questions in not more than 50 words. Each question carries four marks

92
(i) The average rainfall of Indore in a week except Sunday was 1.5 cm and
because of heavy rainfall on Sunday, the average of the week increased to 4
cm. How much rainfall was recorded on Sunday?
(ii) Explain three functions of statistics giving examples.
(iii) Write a brief note on law of inertia of large numbers.
(iv) Explain and illustrate the differences between time reversal.
(v) State four limitations of diagrammatic representation.

Business Statistics 93
DESCRIPTIVE PART- II
Time: Two Hours Max. Marks: 60
Attempt any three questions. Each question carries 20 marks.
3. "Statistics are numerical statement of facts, but all facts numerically stated
are not statistics". Clarify this statement and point out briefly which
numerical of facts are statistics.
or
Calculate Median, both the Quartiles, 9th Decile and 45th percentile from the
following data:
Income Rs (Less than): 80 70 60 50 40 30 20 10
No. of worker: 100 90 80 60 32 20 13 5
4. Calculate Karl Pearson's coefficient of Skewness based on mode:
Tempo C No. of days.
– 40 to –30 10
– 30 to –20 28
–20 to –10 30
–10 to 0 42
0 to 10 65
10 to 20 180
20 to 30 10
365
Or

94
From the data given below calculate the cost of living index number for prices for
the year 2004 with 2003 as base by family budget method:-
Group Quantity Unit Price Price
Food grains 3 quintals Per quintal 12.00 18.0
Clothing 12 mts. Per mt. 1.00 0.90
Fuel 40 kg. per quintal 20.00 25.00
House Rent 3 rooms per room 25.00 23.00
Miscellaneous 30 units Per unit 0.40 0.50
5. The competitions in a beauty contest are ranked by three Judges in the following
order:
First Judge 1 6 5 10 3 2 4 9
7 8
Second Judge 3 5 8 4 7 10 2 1
6 8
Third Judge 3 4 9 8 1 2 3 10
5 7
Use the rank correlation to discuss which pair of Judges have the nearest approach
to common taste in beauty.
or
Obtain tow regression equations of the following information and find out the
value of Y when X= 20 and the value of X when Y = 25:-
X : 12 14 18 22 24
Y : 16 20 26 30 32

Business Statistics 95
B. Com (Part-I) Examination, 2006
(10+2+3 Patterns) (Faculty of Commerce)
Accountancy and Business Statistics Second Paper : Business Statistics
Time : One Hour Objective Part- I Max. Marks.: 40 Attempt All Questions.
1. Answer each of the following questions in not more than 20 words. Each question
carries two marks.
(i) Give a main definition of statistics is singular sense.
(ii) How statistics is useful for insurance companies?
(iii) State the meaning of Secondary data.
(iv) What is statistical error?
(v) Wages are given for 50 workers. The maximum and minimum wages are Rs
400 and Rs. 80 respectively and 10 classes of equal class intervals are to be
formed. How will you find out the class interval?
(vi) When geometric mean is useful.
(vii) What is Range?
(viii) State the main difference between dispersion and Skewness.
(ix) If the aggregative prices of current year are 800 and that of base 500
calculate index number for current year?
(x) If two regression coefficients are 0.8 and 0.6 find the value of coefficient of
correlation.
2. Answer each of the following questions in not more than 50 words. Each question
carries four marks

96
(i) State four limitations of statistics.
(ii) Distinguish between primary and secondary data.
(iii) If the mean and standard deviation of a series of 100 values are 60 and 5
respectively, find the sum of item - values and the sum of squares of item
values.
(iv) If r= 0.7, N=9, test the significance of correlation.
(v) When is the false base line used?

Business Statistics 97
DESCRIPTIVE PART- II
Time: Two Hours Max. Marks: 60
Attempt any three questions. Each question carries 20 marks.
3. Cleary distinguish between primary data and secondary data and explain the
various methods of collecting primary data.
or
Calculate mean, median and mode from the following data:
Class Frequency
2 1
3 2
4 2
5-7 3
7-10 5
10-15 10
15-20 8
20-25 4
4. Geeta and Seeta have obtained the marks in six subject of B. Com Final as
under:
Geeta Seeta
50 60
65 61
49 55
54 54
78 75
82 78

98
Find out which girl is more consistent in her studies.
or
Write explanatory notes on the following:
(i) Deflating of index members
(ii) Splicing
(iii) Base Conversion
5. Following data related to demand and price of a commodity:
Demand (kg) Price Per kg (Rs.)
20 10
22 12
24 16
26 18
28 20
30 20
32 22
34 24
36 24
38 24
Calculate the two regression coefficients and find out the two regression equation.
Estimate the average probable price when the demand of the commodity is 31 kg.
or
From the following data calculate Karl Pearson's coefficient of Correlation taking
deviation from actual means 33 and 22 respectively.

Business Statistics 99
S.No. X Y
1 10 5
2 12 7
3 15 13
4 18 15
5 ? 20
6 35 21
7 45 29
8 50 ?
9 55 36
10 65 44
____________