business services for small enterprises in asia ... · pdf filemarkets and measuring...
TRANSCRIPT

Paper # 22 Business Services for Small Enterprises in Asia: Developing
Markets and Measuring Performance
International Conference Hanoi, Vietnam - April 3-6, 2000
The BRAC Poultry Programme in Bangladesh A Performance Measurement Framework Case Study on
Business Development Services for Micro, Small and Medium Enterprises
By Jack Newnham
Enterprise Development Department
Department for International Development
Sponsors
German Agency for Technical Cooperation (GTZ) United States Agency for International Development (USAID)
Mekong Project Development Facility (MPDF) Committee of Donor Agencies for Small Enterprise Development
Department for International Development
The BRAC Poultry Programme in
Bangladesh
A Performance Measurement Framework Case Study on Business Development Services for
Micro, Small and Medium Enterprises
by
Jack Newnham
Enterprise Development Department Department for International Development

BRAC Poultry Programme
1
Acronyms
BDS Business Development Service
DFID Department For International Development
DOC Day Old Chick
EIG Employment and Income Generation
HYV High Yield Variety
IGVGD Income Generation for Vulnerable Group Development
MIS Management Information System
MSME Micro, Small or Medium Enterprise
NGO Non Government Organisation
PMF Performance Measurement Framework
RCP Rural Credit Programme
RDP Rural Development Programme
VO Village Organisation
Acknowledgements
The author wishes to acknowledge the invaluable assistance received from Md. A Saleque and many other staff at BRAC in the preparation of this case study. Extensive use has also been made of a case study prepared last year by Rob Hitchins of Springfield Centre for Business Development looking at the sub-sector approach to developing microenterpirses in Bangladesh that BRAC has used in the poultry sector. Comments received from those that reviewed drafts of the paper have also been very valuable. .
Exchange rate: $US = 51 Taka

BRAC Poultry Programme
2
Contents
1. Introduction ..............................................................................................................................1 1.1 BRAC ...................................................................................................................................1 1.2 BRAC’s Sector Programmes and the Development of Markets for BDS............................1 1.3 Purpose and structure of the case study ...............................................................................2
2. The Package of Services in BRAC’s Poultry Programme (see figure 1 and table 1) ..............2 3. Definitions of Business Development Services and the Market ..............................................5
3.1 Business Development Services...........................................................................................5 3.2 The Market ...........................................................................................................................5
4. BDS Market Development Indicators ......................................................................................6 4.1 Expanding the Market for Business Development Services - Objective 1 ..........................6 4.2 Develop a high quality, diverse, competitive market - Objective 2 .....................................9 4.3 Deepening the market: Reaching under-served groups - Objective 3................................11
5. BDS supplier indicators .........................................................................................................12 5.1 Achieve supplier sustainability - Objective 1 ....................................................................12 5.2 Cost effectiveness of a BDS programme - Objective 2......................................................13
6. BDS customer indicators........................................................................................................14 6.1 Increase customer acquisition of BDS (increase sales) - Objective 1................................14 6.2 Increase customer use of BDS - Objective 2......................................................................14 6.3 Increase customer benefits from BDS - Objective 3..........................................................14
7. Concluding Comments ...........................................................................................................15 7.1 Usefulness and Practicality of PMF Indicators ..................................................................15 7.2 Learning Points from BRAC’s Poultry Programme...........................................................15 7.3 The Future of a Common Framework for Measuring Performance of BDS......................16
Appendices
Appendix I The Economic and Political Context in Bangladesh
Appendix II Notes to the PMF Tables
Appendix III Mini Case Studies from Field Visits
Appendix IV Cost Recovery Data
Appendix V Operations and training Data
Appendix VI Estimates of Benefits to Participants

BRAC Poultry Programme
3
Abstract
This case study analyses the impact of BRAC’s Poultry Sector Programme in Bangladesh on both the poultry market itself and the market for services to the poultry sector. A performance measurement framework (PMF) is applied which examines data relating to the programme and the wider market.
BRAC’s poultry Sector Programme provides its members with agricultural technologies for the production of high yield variety poultry. These include training, equipment, and the inputs of high yield variety chicks, good quality feed, and medical supplies. In addition to direct provision, BRAC also facilitates members to provide services themselves. Members are trained in either basic veterinary techniques, chick rearing, feed production or egg marketing. They provide inoculations, medicines, eight-week birds, feed and marketing services to other BRAC members as well as the wider community.
It is argued that BRAC’s direct participation in the poultry sector has stimulated market development in rural areas which has in turn increased demand for services to the poultry sector. It is also argued that BRAC’s facilitation of service providers has enabled this increasing demand for services and other inputs to be satisfied.
The poultry sector in Bangladesh has been growing fast in recent years. Both large-scale factory production and small-scale village level production have increased and these increases are forecast to continue. There is little evidence in such an environment to suggest that BRAC’s activities are distorting the market, although as the environment changes BRAC will have to be watchful to avoid crowding out private sector providers.
BRAC currently covers a substantial proportion of Programme costs through a service charge to members and cost recovery is increasing. Prospects for the long-term sustainability of the Programme appear good. However, despite the effectiveness of the service charge in recovering costs from members, the normal feedback achieved through services being purchased or not according to perceived value is lost due to the lack of a transparent link between services provided and payment.
The PMF was found to be a useful tool. Measuring the performance of an individual provider of BDS in the context of the wider market encourages a sector wide perspective. Many BDS programmes do not have the impact envisaged at the programme design stage and focusing on the market during the course of the programme helps identify and address unforeseen negative effects as well as build on unforeseen positive effects.

BRAC Poultry Programme
1
Introduction
1.1 BRAC
BRAC (formally the Bangladesh Rural Advancement Committee) was established in 1972 to work with the rural poor in Bangladesh.1 It is now one of the world’s largest NGOs with approximately 3.3 million members, 23,000 full time and 57,000 part time employees. Portfolio growth has averaged 46% per annum since 1989. Total expenditure in the year ended 31 December 1998 was $77 million. Income from interest on loans, service charges, and commercial activities was $49 million during the same period, 64% of total expenditure. The remaining 36% of expenditure was funded by grants.2 BRAC is involved in a wide range of activities. It’s development programme divides into three areas; rural development, health, and primary education. In addition to these development activities BRAC has established a number of commercial enterprises including a printing press, training centre for development management, production centres and a chain of retail outlets, cold storage facilities, diaries, poultry farms and has recently incorporated the BRAC bank. It also has a number of joint ventures including a housing project. Annual income from commercial activities in 1998 was $16 million generating a net surplus of $310,000.3 BRAC’s rural development activities are administered through the Rural Development Programme (RDP). This is a ‘credit plus’ programme with savings and credit supported by a range of BDS in the poultry, livestock, fisheries, agriculture, forestry and sericulture sectors (named the Employment and Income Generating (EIG) Programme but known as the sector programmes). There are also components covering social development, human rights and legal education, environment, and popular theatre. The RDP is run through a branch network of 330 area offices and 300 sub-area offices. These report to 51 regional offices with in turn report to the head office in Dhaka. Membership is organised through Village Organisations (VOs) with 35-45 members (practically all women) in each VO. Each area office works with around 150 VOs, between 6,000 and 7,000 people. Although the BRAC model is group based (groups of 5), income generating activities are run by individuals.
1.2 BRAC’s Sector Programmes and the Development of Markets for BDS
The sector programmes operated by BRAC involve a wide range of services and can be understood as a combination of the direct provision of BDS to its members, and the facilitation of members to act as private sector BDS providers serving both BRAC members and the wider public. This case study examines the poultry sector programme. The primary services of the poultry sector programme are access to improved agricultural technology (training, equipment and inputs). It is argued that both the direct provision of services by BRAC and the facilitation by BRAC of members to provide services themselves stimulates market development for services to the poultry sector.
1 Background on the economic and political context in Bangladesh is included in Appendix I 2 BRAC 1998 Financial Statements 3 BRAC 1998 Financial Statements

BRAC Poultry Programme
2
1.3 Purpose and structure of the case study
The Performance Measurement Framework (PMF) developed from the Committee of Donor Agencies for Small Enterprise Development’s Virtual Conference on Performance Measurement and formalised in Mary McVay’s guideline “Measuring the Performance of Business Development Services for Small Enterprises” (‘the guideline’) has been applied to BRAC’s poultry programme. The distinction between BRAC’s activities as facilitator and direct provider has been emphasised throughout and is important in understanding the methodology used to complete the PMF. Section 2 describes BRAC’s package of services to the poultry sector. Section 3 clarifies the way in which BDS and markets for BDS have been understood in this paper. Sections 4, 5 and 6 follow the structure in the guideline and assess respectively BDS market development indicators, BDS supplier indicators and BDS customer indicators. Section 7 gives some concluding comments and considers learning points from the BRAC experience and the practicality and validity of the PMF.
2. The Package of Services in BRAC’s Poultry Programme (see figure 1 and table 1)
Poultry rearing is a traditional productive activity in Bangladesh with many households keeping several birds that scavenge for food. BRAC’s programme has supported the introduction of High Yield Variety (HYV) birds to VO members in rural communities. Local breeds suffer from high mortality rates and low egg production, but there are a number of problems associated with the introduction of HYV birds. There is an increased need for veterinary care and high quality feed, and the availability of HYV Day Old Chicks (DOCs) has been scarce.4 To address these problems and support the use of HYV birds, BRAC has developed a market infrastructure to provide necessary inputs and training to poultry producers and to assist in marketing eggs. This market system is made up of BRAC subsidised services, BRAC sustainable business activities, and private sector BDS suppliers. In order to address these constraints BRAC has trained some VO members (‘poultry workers’) in basic veterinary techniques to administer vaccines and medicines, and also act as a form of extension worker for the poultry programme. The limited availability of high quality feed has been improved through BRAC run feed mills (there are now 3 in operation) with the feed distributed through a network of VO members trained as ‘feed sellers’ as well as directly through BRAC’s area offices. There are plans to set up a commercial feed company that will sell feed directly to the open market as well as BRAC members. BRAC has also established five large-scale hatcheries producing DOCs that are distributed to trained ‘chick rearers’ along with DOCs from private sector and Government hatcheries. Mini-hatcheries were also developed with VO members trained in hatching techniques, but this is not being expanded with the increased supply of DOCs from large-scale hatcheries. The genetic quality of eggs from large-scale hatcheries is also higher than those from mini-hatcheries, as is reflected in the differing unit prices (see section 4.2.3).
4 BRAC’s interventions have evolved over the years. Initially HYV cocks were introduced in an attempt to improve the gene pool but there were a number of problems and this approach was replaced with the provision of HYV day old chicks.
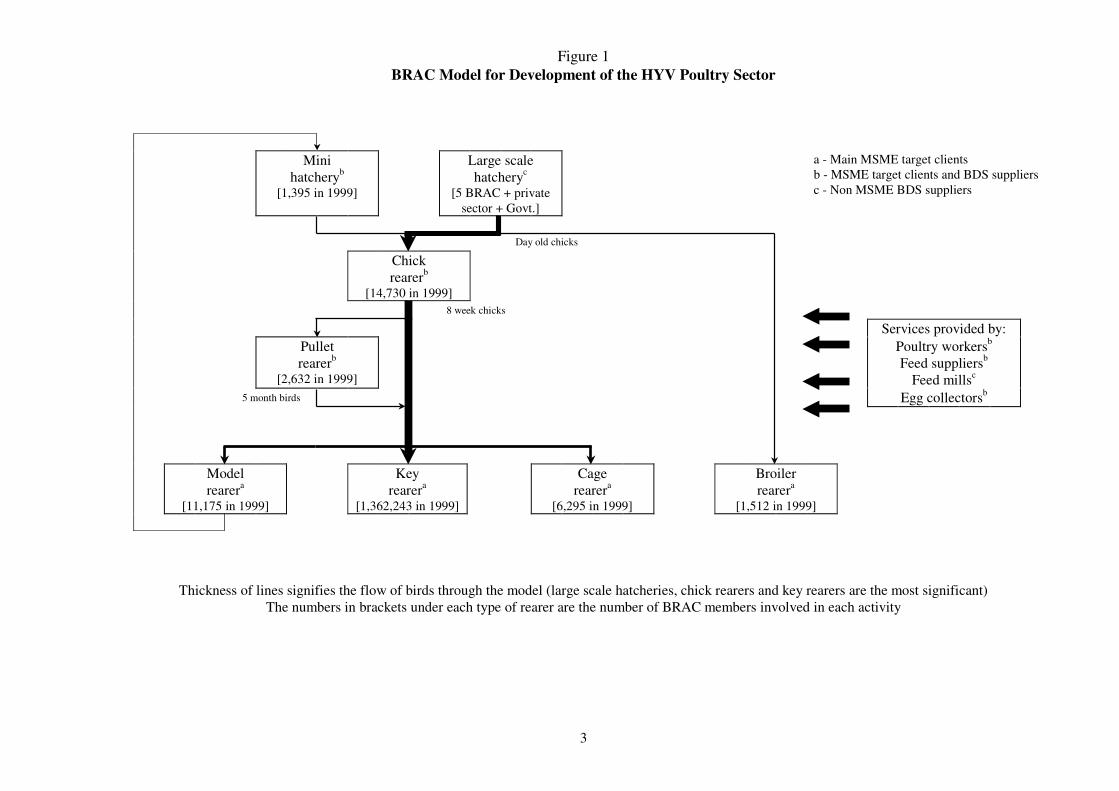
Figure 1 BRAC Model for Development of the HYV Poultry Sector
3
Mini
hatcheryb [1,395 in 1999]
Large scale hatcheryc
[5 BRAC + private sector + Govt.]
a - Main MSME target clients b - MSME target clients and BDS suppliers c - Non MSME BDS suppliers
Day old chicks
Chick rearerb
[14,730 in 1999]
8 week chicks Services provided by: Pullet
rearerb [2,632 in 1999]
Poultry workersb Feed suppliersb
Feed millsc
5 month birds Egg collectorsb
Model
rearera
[11,175 in 1999]
Key rearera
[1,362,243 in 1999]
Cage rearera
[6,295 in 1999]
Broiler rearera
[1,512 in 1999]
Thickness of lines signifies the flow of birds through the model (large scale hatcheries, chick rearers and key rearers are the most significant) The numbers in brackets under each type of rearer are the number of BRAC members involved in each activity

BRAC Poultry Programme
4
Table 1 – Services Provided to Poultry Sector
Ref Facilitator Provider Recipient
Services provided free of charge
1. BRAC donor consortium
BRAC - provides 3 days training in husbandry techniques for HYV poultry (different course for different recipient groups)
Key, cage, model, broiler and pullet rearersa
2. BRAC donor consortium
BRAC - provides 5 day training course on basic veterinary treatment and vaccinations, and a free ‘starter pack’
Poultry workersb
3. BRAC donor consortium
BRAC - provides 5 to 7 days training on rearing chick from day old to 8 weeks
Chick rearersb
4. BRAC donor consortium
BRAC - provides 15 days training on egg hatching
Mini hatcheriesb
5. BRAC donor consortium
BRAC - provides 3 day training course on feed
Feed sellersb
6. BRAC donor consortium
BRAC - provides 1day orientation on egg marketing
Egg collectorsb
Services charged at the market rate
7. BRAC donor consortium
BRAC - provides supplies of vaccines and medicines
Poultry workersb
8. BRAC donor consortium
BRAC - provides day old chicks from BRAC’s own large scale hatcheries as well as private sector and Government hatcheries
Chick and broiler rearersb
9. BRAC donor consortium
BRAC - provides bulk quantities of high quality feed from BRAC’s own feed mills as well as private sector feed mills
Feed sellersb
10. BRAC Poultry workers - provide inoculations and medicines for chicks and adult birds
Key, cage, model, broiler, pullet and chick rearersa
11. BRAC Chick rearers - provide 8 week birds Key, cage, model and pullet rearersa
12. BRAC Mini hatcheries - provide day old chicks Chick rearersb 13. BRAC Feed sellers - provide high quality feed Key, cage, model,
broiler, pullet and chick rearersa
14. BRAC Egg collectors - provide marketing services
Key and cage rearersa
a - Main MSME target clients b - MSME target clients and BDS suppliers
BRAC Poultry Programme
- 5 -
In addition to the above BRAC provides training to VO members in different aspects of poultry rearing. DOCs are supplied to ‘chick rearers’ who rear them until they reach eight weeks of age. Chicks are at their most vulnerable in the first few weeks and BRAC has found that mortality rates are significantly reduced by training specialist chick rearers. When chicks reach eight weeks they sold to ‘key rearers’ (keeping 10-15 birds for egg production), cage rearers (usually 36 birds reared in cages for egg production), broiler rearers (birds reared for slaughter), or model rearers (who supply eggs to mini-hatcheries as well as eggs for sale).5 ‘Pullet rearers’ are also used to rear birds from eight weeks to five months to supply mature birds for egg production to key and model rearers who do not want to take on birds until they are productive and generate income. Other services include egg collectors who provide a marketing service by buying eggs from the rearers and selling them in local markets (see table 1 and figure 1). All training provided by BRAC in the poultry sector is free of charge. However a service charge of TK1 per chick is levied on DOCs that aims to recover BRAC's ongoing operational costs once initial training has been delivered (see section 5). Inputs of high quality feed and DOCs are supplied by BRAC on a commercial basis and BRAC’s feed mills and large-scale hatcheries are profitable.6 Transactions between VO members are all on a commercial basis, with the slight caveat that there may not be a ‘market rate’ for some transactions within the BRAC model. For example mature birds (5 months old) are supplied to the market by the private sector but there is no supply of 8-week birds by the private sector and it is therefore slightly artificial to talk of a market price for 8-week birds.
3. Definitions of Business Development Services and the Market
3.1 Business Development Services
The primary BDS analysed in this case study is technology related to improving home-based poultry production and supporting the use of HYV birds. The BDS analysed in section 4, BDS market development indicators, are only those services that are purchased and include the basic veterinary support provided to poultry rearers by poultry workers, the supply of day old chicks, eight week birds, high quality feed and access to markets. The BDS analysed in section 5, BDS supplier indicators, include training and other support activities of BRAC that are not directly purchased. Access to credit is often provided but this is not considered in this case study.
3.2 The Market
The market in this case study has been taken to be the market for services and other inputs provided to MSMEs operating in the HYV poultry sector in rural Bangladesh. The MSMEs considered are on the whole micro enterprises, although some enterprises may be more significant in size. The programme focuses on small-scale poultry producers, who are easily identified in Bangladesh as there is a significant gap between large scale private poultry farms and MSMEs.
5 In addition to the reduced need for mini-hatcheries due to increased supply from large scale hatcheries, a further reason for not expanding the ‘model rearer’ - ‘mini hatchery’ model of production is that chicks produced from mini-hatcheries have lower quality genes than those produced in large scale hatcheries (as such they are cheaper - 16 cents as opposed to 27 cents - see the PMF table in section 4.2.3). 6 Surpluses earned from feed mills and large scale hatcheries in the year to December 1998 was $US 45,000 and surpluses earned in the nine months to September 1999 were $US 133,000. However capital costs are accounted for separately and the reported surpluses may not fully account for the cost of capital.

BRAC Poultry Programme
- 6 -
4. BDS Market Development Indicators
Due to the range of types of services and inputs involved in the BRAC poultry programme, meaning would be lost if the individual components of the BDS market development indicators were aggregated. For example, it makes little sense when looking at the number of BDS providers (objective 2, indicator 1, section 4.2.1) to add the number of poultry workers (in excess of 40,000) to the number of feed mills (less than 10) as the movement in the number of feed mills over time will be lost in the movement in poultry workers. For this reason a considerable amount of data has been included in this section. Notes to the data in the PMF tables are included in Appendix II.
4.1 Expanding the Market for Business Development Services - Objective 1
4.1.1 Market size (demand): The number of MSMEs purchasing services - Indicator 1
Number of MSMEs purchasing services
1997 1998 1999 (to Sept)
Cumulative / % changea
Notes
Units Units Units Units / %
Poultry workers BRAC 41,228 41,853 42,000 50,499 1
Market 60,000 65,000 70,000 8% 2
Key rearers BRAC 1,190,490 1,271,717 1,362,243 1,461,420
Market 1,490,490 1,671,717 1,862,243 11% 3
Cage rearers BRAC 5,000 5,315 6,295 9,000
Market 7,000 8,500 10,000 18%
Model rearers BRAC 11,195 11,142 11,175 13,124
Market 11,500 11,500 11,500 0% 4
Chick rearers BRAC 14,723 14,723 14,730 20,339 5
Market 21,000 21,000 22,000 5% 6
Broiler rearers BRAC 1,081 1,357 1,512 2,423
Market 2,500 3,500 4,000 14% 7
Pullet rearers BRAC 2,260 2,652 2,632 3,643 8
Market 2,260 2,652 2,632 -1% 9
Mini hatcheries BRAC 1,349 1,364 1,395 1,626 10
Market 1,700 1,750 1,800 3% 11
Feed sellers BRAC 2,450 2,492 2,563 2,888
Market 2,700 2,700 3,000 11% 12
Egg collector BRAC 2,798 3,128 3,142 4,110
Market 3,500 4,000 4,500 13% 13
Total BRAC 1,272,574 1,355,743 1,447,687 1,569,072
Market 1,602,650 1,792,319 1,982,675 11%
BRAC's market share 79% 76% 73% 14
a - % change in estimated market size between 31 December 1998 and 30 September 1999 The BDS considered in this indicator, as specified in the guideline, are only those services and inputs purchased by MSMEs. These include supplies by various BRAC members who provide services on a commercial basis to MSMEs (both MSMEs run by BRAC members and MSMEs run by those unconnected with BRAC), but exclude training services provided by BRAC to its members as these are provided free of charge. Table 1 in section 2 sets out the services provided and received by the range of participants in the sector. The final column of rows 7 to 14 lists the MSMEs that purchase services. Although

BRAC Poultry Programme
- 7 -
poultry workers do not purchase the training they receive from BRAC they do purchase vaccines and medicines from BRAC (at market rates). The different types of poultry rearers purchase services from poultry workers, feed sellers, egg collectors and chick rearers. Chick rearers also purchase services from poultry workers and feed sellers as well as day old chicks through BRAC. Feed sellers purchase feed through BRAC and mini-hatcheries purchase eggs for hatching from model rearers. Egg collectors have been included for completeness. There is an element of double counting in the above data as some BRAC members are involved in more than one activity in the poultry sector (examples in mini case studies in Appendix III). It is estimated that this double counting is not currently significant, but as the programme matures and more members diversify in to more than one poultry activity this will become more of an issue. It is relatively easy to get data on the numbers of MSMEs purchasing services from BRAC facilitated providers, but much harder to estimate the numbers of MSMEs purchasing services in the wider market. This is also true for sales by BDS providers in indicator 2 below. The notes to the PMF tables in Appendix II give details on the methodologies used to calculate market figures but in many cases the only way to come up with a figure was through discussions with informed individuals. Meetings were held with representatives from the private sector and many commented on the lack of market data and how useful it would be if it existed. There is some published data through the Department of Livestock Services but this is out of date and based on the same methodology used here (estimates based on informed opinion). The local trade organisation, the World Poultry Science Association, Bangladesh Branch, does not currently collect market data and it was suggested that the collation of market information would be worthy of donor support. Such support may be an effective way of stimulating private sector markets, as well as providing information that would allow a more accurate understanding of how a donor supported programmes such as BRAC’s fits into the wider market. In addition to the lack of data on the wider market, a further complication is that the BRAC model does not necessarily follow the structure of private sector poultry MSMEs and service providers. For example, chick rearing from day old to 8 weeks and pullet rearing from 8 weeks to 5 months do not exist in the market. There is a market for 5 month birds (the age they become productive) but not 8 week birds. This could be argued as a strength of the PMF as it draws attention to activities that may not be market focused and so may not develop markets for BDS. However, the model adopted by BRAC is designed to achieve the wider goal of stimulating the market for poultry production and this may be best achieved by creating ‘artificial’ activities such as chick and pullet rearing. Estimates of the market size for chick rearing are in excess of the BRAC figures as other NGOs have adopted the BRAC model. The demonstration effect that occurs may encourage the private sector to offer these services as it would appear that demand is present. When applying the PMF to the BRAC model, the comparison of annual figures to cumulative figures gives a different message to that intended in the guideline. The guideline states that the cumulative figure is used to give a sense of the scale of the programme over time, but in this case the comparison of cumulative to annual figures indicates ‘drop outs’ over the courses of the programme. Appendix V reconciles the movement in annual figures year on year through dropouts and achievements (new participants). Such an analysis in important for this type of membership based programme as dropouts are expensive and are important to contain in order to achieve cost recovery and sustainability.
BRAC Poultry Programme
- 8 -
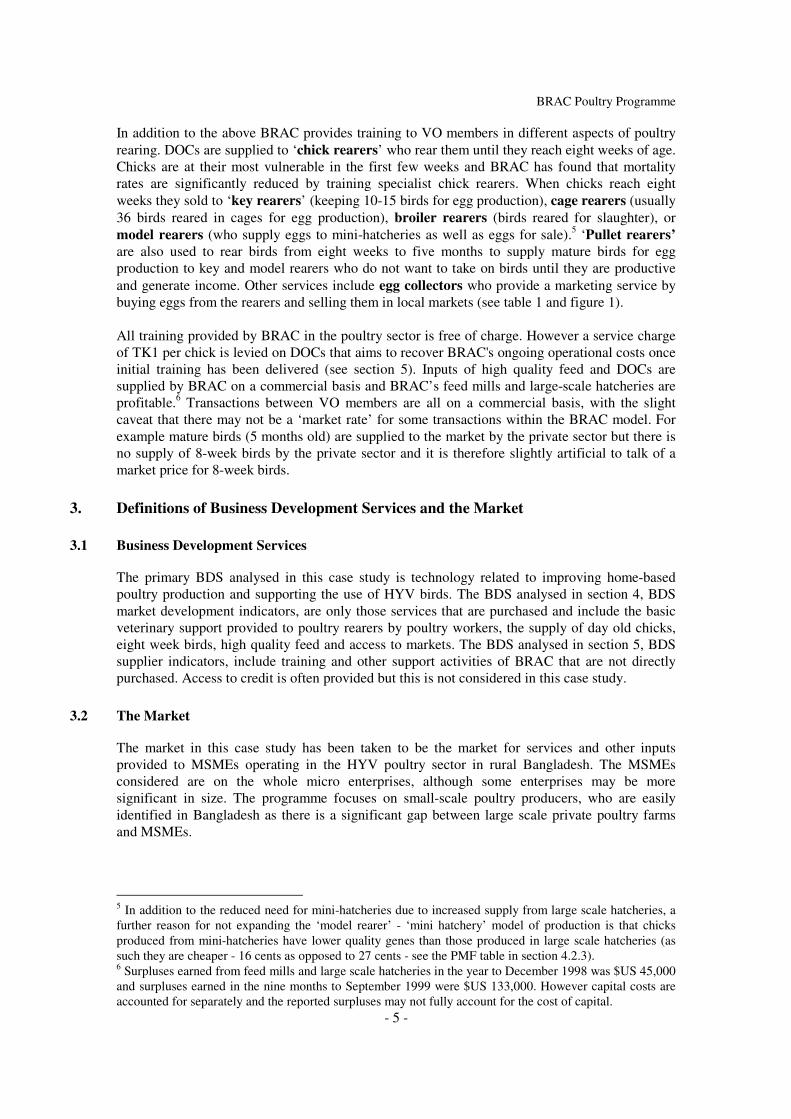
4.1.2 Market size (supply): Annual amount of sales by BDS provider - Indicator 2
Annual sales by BDS providers
1997 1998 1999 (to Sept)
Cumulative / % changea
Notes
$US $US $US $US / %
Poultry workers BRAC 4,365,000 4,924,000 5,435,000 14,725,000 15
(supply of veterinary servs) Market 6,353,000 7,647,000 9,059,000 18% 16
Chick rearers BRAC 14,290,000 14,290,000 14,297,000 42,877,000 17
(supply of 8 week birds) Market 20,328,000 20,328,000 21,353,000 5% 18
Mini hatcheries BRAC 1,666,000 1,926,000 1,970,000 5,561,000 19
(supply of day old chicks) Market 2,100,000 2,162,000 2,224,000 3% 20
Large scale hatcheries BRAC 508,000 578,000 2,195,000 3,281,000 21
(supply of day old chicks) Market 3,725,000 4,510,000 5,490,000 22% 22
Feed sellers BRAC 202,000 234,000 271,000 708,000 23
(supply of high quality feed) Market 222,000 254,000 318,000 25% 24
Feed mills BRAC 1,544,000 1,707,000 1,620,000 4,871,000 25
(supply of high quality feed) Market 5,456,000 6,443,000 7,796,000 21% 26
Egg collectors BRAC 230,000 294,000 333,000 857,000 27
(access favorable markets) Market 288,000 377,000 476,000 26% 28
Total BRAC 22,805,000 23,953,000 26,121,000 72,880,000
Market 38,472,000 41,721,000 46,716,000 12%
BRAC's market share 59% 58% 56% 29
a - the % change in estimated market size between 31 December 1998 and 30 September 1999 As in the first indicator, the BDS providers considered in this indicator are only those that sell their services to MSMEs. These include BDS supplied by the various BRAC members, and inputs sold by BRAC, but exclude training services provided by BRAC free of charge. The value of sales for BRAC facilitated providers has been calculated based on the number of providers and estimated average outputs, rather than extracted directly from BRAC’s Management Information System (MIS). This questions the order of indicators in the PMF as the number of BDS suppliers appears later in indicator 1 for objective 2 (section 4.2.1). As noted above, reliable market data is not available and some estimates are very rough. Nevertheless it is useful to consider BRAC supported providers and BRAC’s own provision in the context of the wider market. This is particularly so with sales of BDS by larger scale BRAC supported organisations (specifically feed mills and large-scale hatcheries) as there is a particular risk of crowding out private sector suppliers. However, in this case the numbers appear to suggest that the market is growing and crowding out is not currently a concern. This is consistent with the understanding that the demand for both chicken meat and eggs in Bangladesh significantly outstrips supply.

BRAC Poultry Programme
- 9 -
4.1.3 Market penetration: Percent of potential MSME market reached with BDS - Indicator 3
Number of BDS providers 1997 1998 1999 (to Sept)
% changea / cumulative
Notes
units / % units / % units / % %
Estimate of potential MSME market in the rural poultry sector
Market
4,500,000
4,800,000
5,000,000
4%
30
Number of MSMEs BRAC 1,272,574 1,355,743 1,477,687 1,569,072
purchasing services Market 1,602,650 1,792,319 1,982,675 11%
Penetration of BRAC 28% 28% 30% 11%
potential market Market 36% 37% 40% 11%
a - the % change in estimated market size between 31 December 1998 and 30 September 1999 As the PMF guidance document notes, this indicator may be subject to manipulation as the extent of market penetration depends on how the market is defined. In this case the potential MSME market has been defined as the number of potential MSMEs in the rural poultry sector in Bangladesh. As this includes MSMEs that do not yet exist, let alone ‘demand’ services, the number is a very rough estimate. Despite the inevitable inaccuracies this indicator is a useful extension of indicator 1 highlighting the potential for growth in the market. The methodology used to estimate the target market includes estimates of the potential demand for poultry meat and eggs. However this demand could be met by large-scale producers and as such the size of the potential MSME market would be less.
4.2 Develop a high quality, diverse, competitive market - Objective 2
4.2.1 Number of BDS providers - Indicator 1
Number of BDS providers 1997 1998 1999 (to Sept)
At start of programme
Notes
Units Units Units Units
Poultry workers (as 4.1.1) BRAC 41,228 41,853 42,000 0
(supply of veterinary servs) Market 60,000 65,000 70,000 5,000 31
Chick rearers (as 4.1.1) BRAC 14,723 14,723 14,730 0
(supply of 8 week birds) Market 21,000 21,000 22,000 n/a
Mini hatcheries (as 4.1.1) BRAC 1,349 1,364 1,395 0
(supply of day old chicks) Market 1,700 1,750 1,800 n/a
Large scale hatcheries BRAC 3 4 5 0
(supply of day old chicks) Market 34 38 42 20 32
Feed sellers (as 4.1.1) BRAC 2,450 2,492 2,563 0
(supply of high quality feed) Market 2,700 2,700 3,000 n/a
Feed mills BRAC 2 2 3 0
(supply of high quality feed) Market 8 9 10 6 33
Egg collectors (as 4.1.1) BRAC 2,798 3,128 3,142 0
(access favourable markets) Market 3,500 4,000 4,500 n/a
In this case study, where suppliers of BDS are often also purchasers of BDS, this data in this indicator repeats much of the data in indicator 1 of objective 1, the number of MSMEs purchasing services (4.1.1). For example, chick rearers are included in the number of MSMEs purchasing services, as they purchase veterinary services from poultry workers and feed from
BRAC Poultry Programme
- 10 -
feed sellers, but they are also included as a BDS provider as they supply 8 week birds to key, cage and model rearers. It is useful to consider the number of BDS providers as well as the value of sales by BDS providers (4.1.2). However, it would be more logical to include the number of suppliers before the value of supplies as the number of providers has to be assessed before considering the value of BDS supplied.
4.2.2 Number of BDS products/service types - Indicator 2
This indicator has not been completed as it is felt that the information is covered in other indicators. There is reference to the service types provided in indicator 2 of objective 1, Market size (supply): Amount of annual sales by BDS providers (4.2.1).
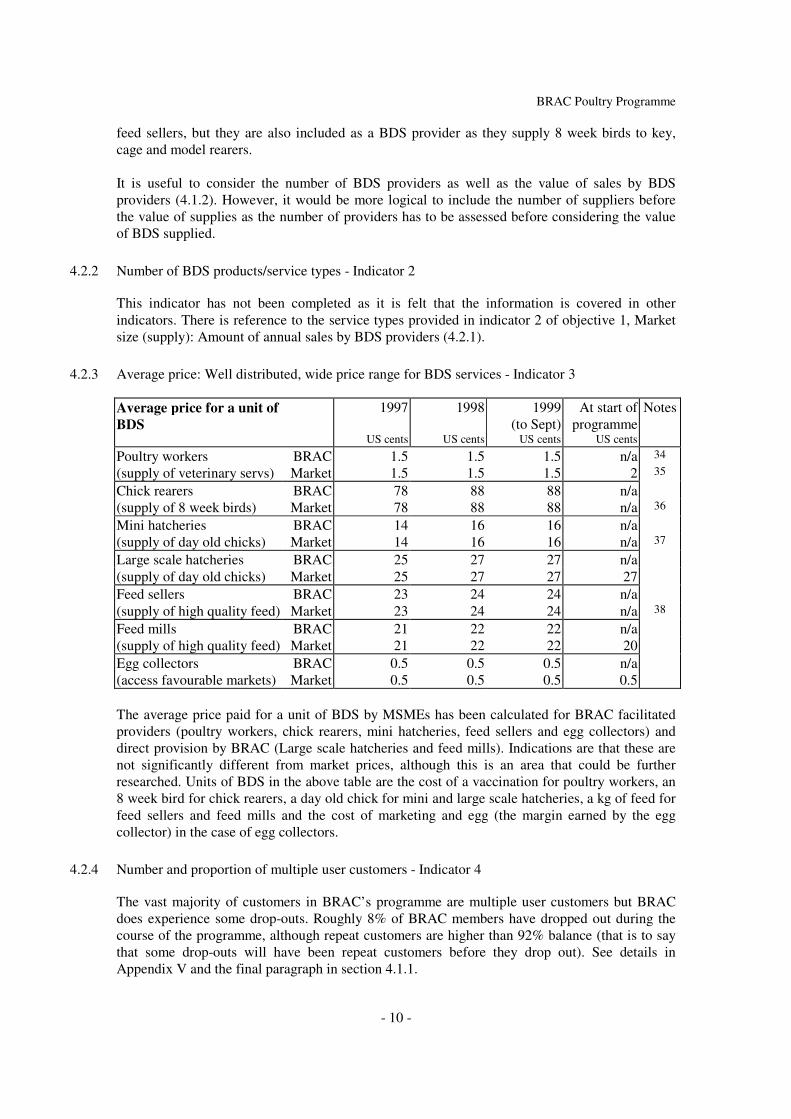
4.2.3 Average price: Well distributed, wide price range for BDS services - Indicator 3
Average price for a unit of BDS
1997 1998 1999 (to Sept)
At start of programme
Notes
US cents US cents US cents US cents
Poultry workers BRAC 1.5 1.5 1.5 n/a 34
(supply of veterinary servs) Market 1.5 1.5 1.5 2 35
Chick rearers BRAC 78 88 88 n/a
(supply of 8 week birds) Market 78 88 88 n/a 36
Mini hatcheries BRAC 14 16 16 n/a
(supply of day old chicks) Market 14 16 16 n/a 37
Large scale hatcheries BRAC 25 27 27 n/a
(supply of day old chicks) Market 25 27 27 27
Feed sellers BRAC 23 24 24 n/a
(supply of high quality feed) Market 23 24 24 n/a 38
Feed mills BRAC 21 22 22 n/a
(supply of high quality feed) Market 21 22 22 20
Egg collectors BRAC 0.5 0.5 0.5 n/a
(access favourable markets) Market 0.5 0.5 0.5 0.5
The average price paid for a unit of BDS by MSMEs has been calculated for BRAC facilitated providers (poultry workers, chick rearers, mini hatcheries, feed sellers and egg collectors) and direct provision by BRAC (Large scale hatcheries and feed mills). Indications are that these are not significantly different from market prices, although this is an area that could be further researched. Units of BDS in the above table are the cost of a vaccination for poultry workers, an 8 week bird for chick rearers, a day old chick for mini and large scale hatcheries, a kg of feed for feed sellers and feed mills and the cost of marketing and egg (the margin earned by the egg collector) in the case of egg collectors.
4.2.4 Number and proportion of multiple user customers - Indicator 4
The vast majority of customers in BRAC’s programme are multiple user customers but BRAC does experience some drop-outs. Roughly 8% of BRAC members have dropped out during the course of the programme, although repeat customers are higher than 92% balance (that is to say that some drop-outs will have been repeat customers before they drop out). See details in Appendix V and the final paragraph in section 4.1.1.
BRAC Poultry Programme
- 11 -
4.2.5 Market distortion: Average subsidy content of a BDS - Indicator 5
This indicator has not been completed as BRAC facilitated providers sell their services and inputs at market rates. BRACs activities as facilitator and provider of BDS are analysed in section 5 on provider sustainability.
4.3 Deepening the market: Reaching under-served groups - Objective 3
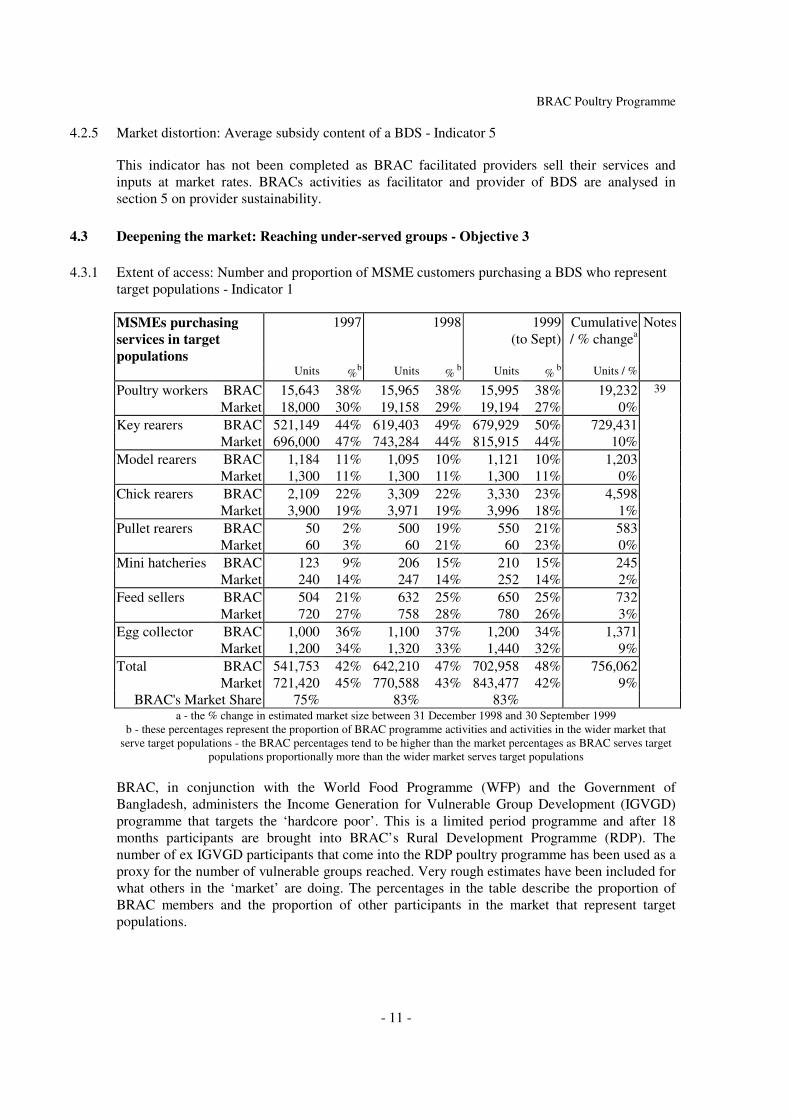
4.3.1 Extent of access: Number and proportion of MSME customers purchasing a BDS who represent target populations - Indicator 1
MSMEs purchasing services in target populations
1997
1998
1999 (to Sept)
Cumulative / % changea
Notes
Units %b Units % b Units % b Units / %
Poultry workers BRAC 15,643 38% 15,965 38% 15,995 38% 19,232 39
Market 18,000 30% 19,158 29% 19,194 27% 0%
Key rearers BRAC 521,149 44% 619,403 49% 679,929 50% 729,431
Market 696,000 47% 743,284 44% 815,915 44% 10%
Model rearers BRAC 1,184 11% 1,095 10% 1,121 10% 1,203
Market 1,300 11% 1,300 11% 1,300 11% 0%
Chick rearers BRAC 2,109 22% 3,309 22% 3,330 23% 4,598
Market 3,900 19% 3,971 19% 3,996 18% 1%
Pullet rearers BRAC 50 2% 500 19% 550 21% 583
Market 60 3% 60 21% 60 23% 0%
Mini hatcheries BRAC 123 9% 206 15% 210 15% 245
Market 240 14% 247 14% 252 14% 2%
Feed sellers BRAC 504 21% 632 25% 650 25% 732
Market 720 27% 758 28% 780 26% 3%
Egg collector BRAC 1,000 36% 1,100 37% 1,200 34% 1,371
Market 1,200 34% 1,320 33% 1,440 32% 9%
Total BRAC 541,753 42% 642,210 47% 702,958 48% 756,062
Market 721,420 45% 770,588 43% 843,477 42% 9%
BRAC's Market Share 75% 83% 83%
a - the % change in estimated market size between 31 December 1998 and 30 September 1999 b - these percentages represent the proportion of BRAC programme activities and activities in the wider market that
serve target populations - the BRAC percentages tend to be higher than the market percentages as BRAC serves target populations proportionally more than the wider market serves target populations
BRAC, in conjunction with the World Food Programme (WFP) and the Government of Bangladesh, administers the Income Generation for Vulnerable Group Development (IGVGD) programme that targets the ‘hardcore poor’. This is a limited period programme and after 18 months participants are brought into BRAC’s Rural Development Programme (RDP). The number of ex IGVGD participants that come into the RDP poultry programme has been used as a proxy for the number of vulnerable groups reached. Very rough estimates have been included for what others in the ‘market’ are doing. The percentages in the table describe the proportion of BRAC members and the proportion of other participants in the market that represent target populations.
BRAC Poultry Programme
- 12 -
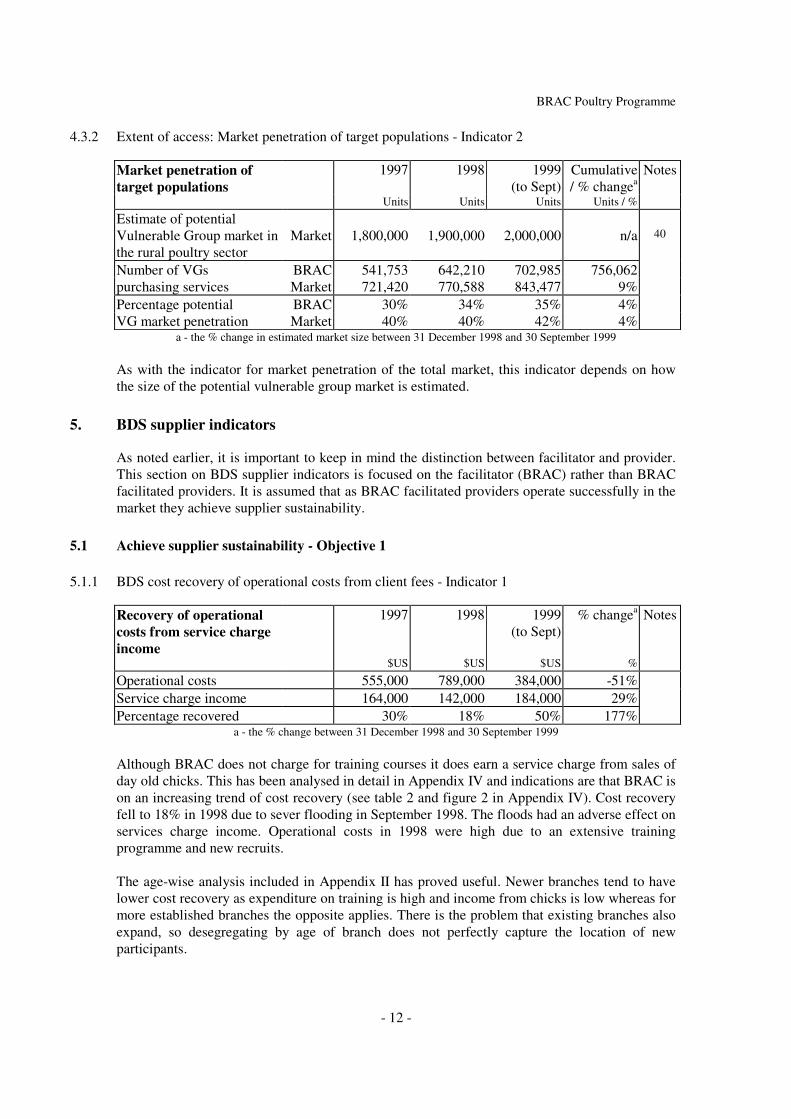
4.3.2 Extent of access: Market penetration of target populations - Indicator 2
Market penetration of target populations
1997 1998 1999 (to Sept)
Cumulative / % changea
Notes
Units Units Units Units / %
Estimate of potential Vulnerable Group market in the rural poultry sector
Market
1,800,000
1,900,000
2,000,000
n/a
40
Number of VGs BRAC 541,753 642,210 702,985 756,062
purchasing services Market 721,420 770,588 843,477 9%
Percentage potential BRAC 30% 34% 35% 4%
VG market penetration Market 40% 40% 42% 4%
a - the % change in estimated market size between 31 December 1998 and 30 September 1999 As with the indicator for market penetration of the total market, this indicator depends on how the size of the potential vulnerable group market is estimated.
5. BDS supplier indicators
As noted earlier, it is important to keep in mind the distinction between facilitator and provider. This section on BDS supplier indicators is focused on the facilitator (BRAC) rather than BRAC facilitated providers. It is assumed that as BRAC facilitated providers operate successfully in the market they achieve supplier sustainability.
5.1 Achieve supplier sustainability - Objective 1
5.1.1 BDS cost recovery of operational costs from client fees - Indicator 1
Recovery of operational costs from service charge income
1997 1998 1999 (to Sept)
% changea Notes
$US $US $US %
Operational costs 555,000 789,000 384,000 -51%
Service charge income 164,000 142,000 184,000 29%
Percentage recovered 30% 18% 50% 177%
a - the % change between 31 December 1998 and 30 September 1999 Although BRAC does not charge for training courses it does earn a service charge from sales of day old chicks. This has been analysed in detail in Appendix IV and indications are that BRAC is on an increasing trend of cost recovery (see table 2 and figure 2 in Appendix IV). Cost recovery fell to 18% in 1998 due to sever flooding in September 1998. The floods had an adverse effect on services charge income. Operational costs in 1998 were high due to an extensive training programme and new recruits. The age-wise analysis included in Appendix II has proved useful. Newer branches tend to have lower cost recovery as expenditure on training is high and income from chicks is low whereas for more established branches the opposite applies. There is the problem that existing branches also expand, so desegregating by age of branch does not perfectly capture the location of new participants.

BRAC Poultry Programme
- 13 -
In a large and diverse organisation such as BRAC with numerous sources of funding it is a challenge to allocate costs to specific services. With an increasing emphasis on costs recovery there is a need to design MISs to deal with these allocations. It is also important to analyse cost recovery in the context of the profile of income and costs during the life cycle of a programme, which is why the age-wise analysis in Appendix IV is necessary. The programme support enterprises (large-scale hatcheries and feed mills) show an increasing surplus. In the nine months to September 1999 a surplus of $US 133,000 was recorded. If this is added to service charge income for 1999 cost recovery increases from 50% to 92%. Yet from discussions with management these surpluses are planned to subsidise other projects and are not intended to cover ongoing costs of the poultry programme. Management also indicated that the service charge is only intended to cover ongoing operational costs and not recover the costs of initial training. Although BRAC's views on cost recovery are as described above, it would appear that the BRAC poultry 'system' has the ability to self finance expansion to new members if the total income earned from programme support enterprises and service charges were ploughed back into the system.
5.2 Cost effectiveness of a BDS programme - Objective 2
5.2.1 Cost-benefit assessment and return on investment, cost per supplier, customer and $1 increase in supplier revenue - Indicators 1, 2, 3 and 4
BDS supplier indicators January 1996 to September 1999 Notes $US / units
Total programme costs $ 2,481,000 41
Cumulative participants 600,000 42
Average benefit per participant $ 45 43
Total benefit $ 27,000,000 44
Cost benefit 1:11 cost:benefit ratio 45
Return on investment 1,100% return on investment
Total programme costs per supplier / customer $ 4.14
Costs per increase $ 1 increase in revenue $ 0.09
Details of the methodology used are included in the notes (Appendix II) and the tables in Appendix VI. Sample interviews were held with a variety of poultry sector MSMEs and results from these have been used in conjunction with wider surveys conducted for BRAC to assess the benefits derived by the MSMEs involved in BRAC’s programme. Total programme costs have been compared to these benefits and various ratios calculated. The results suggest a very successful, cost effective programme. Although it is clearly valuable to consider the issue of the benefits to participants, estimating a figure from available evidence may not be a very scientific process. The calculations for cost recovery and supplier sustainability in the previous section flow directly out of the available data whereas there are a number of ways that benefits to participants could be quantified, with some approaches giving quite different results to others.

BRAC Poultry Programme
- 14 -
These indicators have been completed but the section on cost recovery and supplier sustainability is felt to be much more useful when analysing the performance of this particular programme.
6. BDS customer indicators
BDS customer indicators To September 1999 Notes
Customer satisfaction with a BDS 95% 46
Repeat customers 94% 47
Percentage of customers who reduced costs, found new markets 96% 48
Average change in value added per participant per month $2.50 per month 43
Average change in cumulative value added per participant $45 43
Change in cumulative value added in total $27 million 44
6.1 Increase customer acquisition of BDS (increase sales) - Objective 1
6.1.1 Customer satisfaction with BDS - Indicator 1
No random survey was conducted as suggested in the PMF although the sample interviews referred to above did include questions on satisfaction (some of these are included in Appendix III as mini case studies).
6.1.2 Repeat customers - Indicator 2
Repeat customers are analysed with reference to data on dropouts in Appendix V. For this programme repeat customers is a particularly relevant statistic. Repeat custom is interpreted as staying within the programme, rather than receiving further training from BRAC. There is an issue that poultry workers in particular may receive more refresher training than necessary that contributes to costs unnecessarily. Various reports refer to this.
6.2 Increase customer use of BDS - Objective 2
6.2.1 Percentage of customers who reduced costs, found new markets - Indicator 1
This indicator is also defined as the percentage that changed business practices as intended and defined by the BDS programme. The vast majority of participants will have done this.
6.3 Increase customer benefits from BDS - Objective 3
6.3.1 Change in value added - Indicator 1
This refers back to the figures calculated for the change in value added in objective 2, cost effectiveness of a BDS programme. All these BDS customer indicators do not appear to add much to the data already prepared in the example of this case study.
BRAC Poultry Programme
- 15 -
7. Concluding Comments
7.1 Usefulness and Practicality of PMF Indicators
The market development indicators giving the number of MSMEs served, the number of BDS suppliers and the value of sales at both the programme and market levels are useful indicators of programme performance. An analysis of the outreach to target populations is also worthwhile. It is particularly informative to present the data on the programme in the context of the market as a whole bearing in mind the concern that donor supported BDS may distort the market and/or crowd out private sector providers. The cost recovery and sustainability indicators are also useful although it is important to look at these in the context of the stage the programme is at in the life cycle of its cost and income structure. Attributing impact of BDS programmes is very difficult and the section on cost effectiveness necessarily relies on judgements as to what benefits have actually resulted from BDS interventions. In this case study, where participants have been established in an essentially new area (HYV poultry rearing rather than traditional poultry rearing), it is easier than in most situations to attribute impact to the BDS provided. Cost recovery and sustainability may be more measurable indicators and where they are achieved the need to quantify impact is reduced as there would be no requirement for long term subsidy. In terms of data collection, aside from data on impact, the programme related data should be reasonably easy to collect provided the programme collects the relevant statistics. This is an issue at the programme design stage. The benefits of applying the PMF to a programme may be outweighed by the costs if information systems are not set up to provide the sort of data required. Data on at the market level may often be difficult to obtain. Even where estimates are very rough there is still a value to completing market information. The act that completing market information even when it is inaccurate is worthwhile as it forces at least some form of assessment of the wider market and reduces the risks of distortion mentioned above. Many BDS programmes do not have the impact envisaged at the project design stage. Focusing on the market during the course of the programme may generate a sector-wide perspective that should reduce the chances of unforeseen negative effects and increase the changes of identifying and building on unforeseen positive effects. The collection and dissemination of market information may be a suitable area for donor funding. Not only will this enable donor supported programmes operating in a particular market to measure their performance in the context of more accurate market information, but private sector providers operating in the same market can also make good use of the market information.
7.2 Learning Points from BRAC’s Poultry Programme
The exercise of completing the PMF has brought into sharper focus the interaction of BRAC’s programme with the wider market. BRAC have influenced the market for HYV poultry in rural areas and evidence suggests that they have lead the way where other are following. The development of a broad-based market stimulates other participants. Private sector members of the local poultry trade association felt that it was through BRAC leading the way that poultry larger scale private farms had established themselves outside the greater Dhaka area.

BRAC Poultry Programme
- 16 -
The delivery of this type of BDS in conjunction with an established credit and savings programme appears to be effective. Much of the infrastructure, both human and physical, required to deliver the comprehensive sector wide interventions are in place which reduces the costs of service delivery. All BRAC’s area offices that have not done so already are due to transform from Rural Development Programme offices (RDP) to Rural Credit Programme offices (RCP) within the next couple of years. The principal is that the majority of costs associated with the sector programmes will have been incurred and no ongoing funding will be required. The goal of 100% cost recovery should be achieved as up front training costs will have been incurred and poultry rearers would be in full production maximising the service charge earned from day old chicks. It would only be when BRAC wanted to expand into new areas and work with new groups that funding would be required. Arguable this could financed through profits from the sector support industries, although this is not BRAC's intention. Despite a computerised MIS and a long history of data to analyse, the quality of financial information available at BRAC for analysis is low. This suggests that it is not enough to collect data, for data to be really useful it has to be referred to and presented in a format that encourages use and serves specific needs. The example of BRAC’s poultry programme may be untypical. Bangladesh is a very densely populated country and the scale achieved by BRAC has enabled BDS delivery for a low per capita cost. BRAC is a well-established NGO that is here for the long term. There is no requirement for BRAC to have a strategy to pull out completely from the poultry sector. Other programmes may have a limited period in which to stimulate market development and the approach adopted by BRAC may be inappropriate in these cases. BRAC is unusual as an NGO that it is well suited to the direct provider role that it has played in the poultry sector. Many NGOs would not have the commercial experience or expertise that BRAC does through it's existing range of commercial enterprises described in the introduction. Other development organisations may find they face too many constraints to get so directly involved in the market. Although there is a potential conflict between BRAC's own businesses and the development of the private sector, this only becomes a serious issue if BRAC has an unfair advantage over its competitors. Provided this is not the case BRAC should be in a position to set the example that other will replicate and evidence suggests this may be the case in the poultry sector, with the increase in private sector feed mills and large scale hatcheries. Where BRAC acts as a facilitator it also has the advantage of being able to work through its existing VOs. This may lead to a tendency to set people up in business rather than work to support existing businesses. In the case of poultry rearing this does not seem to be an issue, but for other larger enterprises it may be more problematic.
7.3 The Future of a Common Framework for Measuring Performance of BDS
BRAC’s approach to the poultry sector combines direct provision of BDS (in a manner that stimulates the development of market for BDS) with facilitation of private sector BDS providers. Where BRAC facilitates it does so without directly charging (provision of training) but it also delivers services on a commercial basis (supply of day old chicks, feed and vaccines and medicines). These two approaches are dealt with differently when applying the PMF yet they are both part of the commercial approach to provision.

BRAC Poultry Programme
- 17 -
It may be that the requirement for services included in the market development indicators to include only those services that are purchased is too rigid in some circumstances. Even if services are not directly charged for they may be delivered on a commercial basis and be appropriate to include as ‘sales’ of BDS. It may be appropriate to introduce greater flexibility into the PMF while retaining the focus on commercial delivery of BDS. A useful classification of BDS divides services into transactions related services and strategic services7. Transactional services include more mundane services such as keeping accounts, filing returns and complying with regulations, whereas strategic services relate to non-immediate issues and include advice on longer term business strategies. MSMEs are much more willing to pay for transactional related services than strategic services. A typical provider of both transactional and strategic services in the private sector are firms of accountants. One effective strategy adopted by such firms so as to provide strategic services in addition to the transactional services people are willing to pay for is to provide a ‘management letter’ dealing with more strategic issues than the delivery of audited accounts as part of the audit service. On occasion these are paid for separately but in the majority of circumstances the service is included in the audit fee and provided ‘for free’ along side the transactional services offered. On the strict classification in the PMF these would not be included as commercially provided BDS as they not directly paid for (although costs are certainly indirectly covered through increased audit fees).
The converse argument is that a transparent link between services and payment provides the feedback necessary for BDS providers to provide services that are appropriate. This may be a weakness in the BRAC poultry programme as it is less likely that pressure will be exerted from recipients of training to ensure that it is appropriate and valuable. It may be that poultry workers would be less enthusiastic about attending regular follow up training if they had to directly pay for it.
7 Idea developed in the draft case study for Hanoi 2,000 on BDS services for small scale enterprises in Hyderabad, India
BRAC Poultry Programme
Appendix I
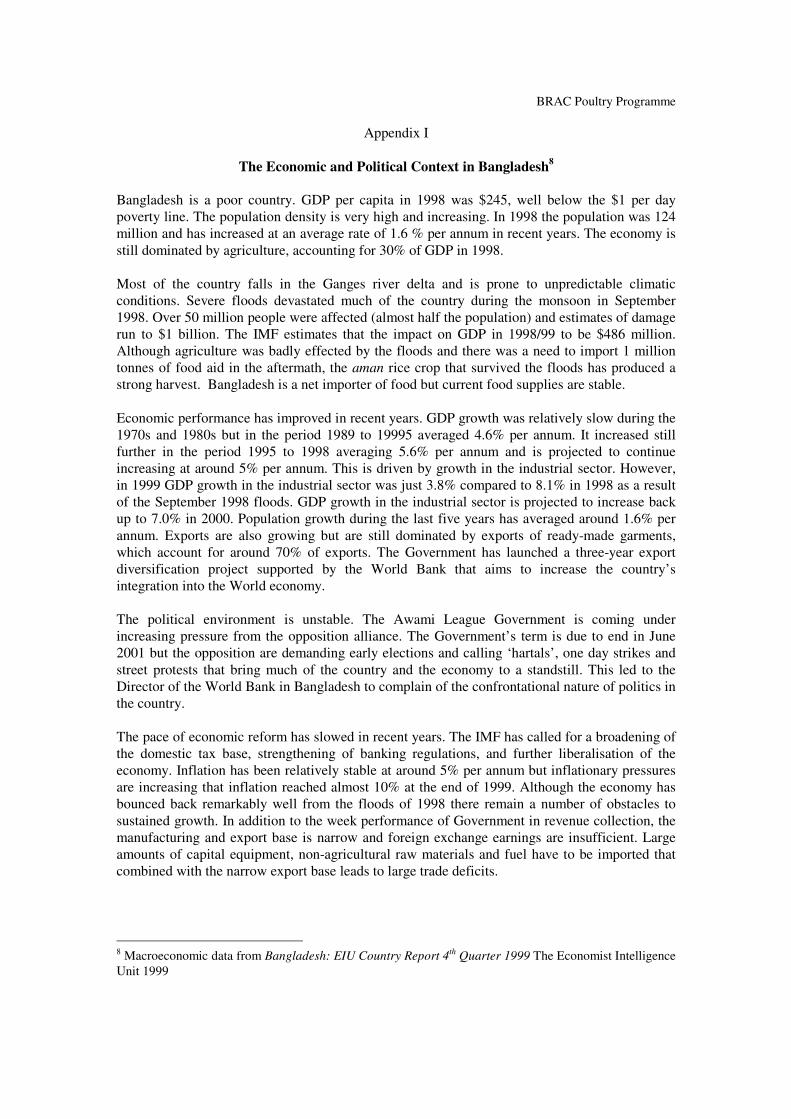
The Economic and Political Context in Bangladesh8 Bangladesh is a poor country. GDP per capita in 1998 was $245, well below the $1 per day poverty line. The population density is very high and increasing. In 1998 the population was 124 million and has increased at an average rate of 1.6 % per annum in recent years. The economy is still dominated by agriculture, accounting for 30% of GDP in 1998. Most of the country falls in the Ganges river delta and is prone to unpredictable climatic conditions. Severe floods devastated much of the country during the monsoon in September 1998. Over 50 million people were affected (almost half the population) and estimates of damage run to $1 billion. The IMF estimates that the impact on GDP in 1998/99 to be $486 million. Although agriculture was badly effected by the floods and there was a need to import 1 million tonnes of food aid in the aftermath, the aman rice crop that survived the floods has produced a strong harvest. Bangladesh is a net importer of food but current food supplies are stable. Economic performance has improved in recent years. GDP growth was relatively slow during the 1970s and 1980s but in the period 1989 to 19995 averaged 4.6% per annum. It increased still further in the period 1995 to 1998 averaging 5.6% per annum and is projected to continue increasing at around 5% per annum. This is driven by growth in the industrial sector. However, in 1999 GDP growth in the industrial sector was just 3.8% compared to 8.1% in 1998 as a result of the September 1998 floods. GDP growth in the industrial sector is projected to increase back up to 7.0% in 2000. Population growth during the last five years has averaged around 1.6% per annum. Exports are also growing but are still dominated by exports of ready-made garments, which account for around 70% of exports. The Government has launched a three-year export diversification project supported by the World Bank that aims to increase the country’s integration into the World economy. The political environment is unstable. The Awami League Government is coming under increasing pressure from the opposition alliance. The Government’s term is due to end in June 2001 but the opposition are demanding early elections and calling ‘hartals’, one day strikes and street protests that bring much of the country and the economy to a standstill. This led to the Director of the World Bank in Bangladesh to complain of the confrontational nature of politics in the country. The pace of economic reform has slowed in recent years. The IMF has called for a broadening of the domestic tax base, strengthening of banking regulations, and further liberalisation of the economy. Inflation has been relatively stable at around 5% per annum but inflationary pressures are increasing that inflation reached almost 10% at the end of 1999. Although the economy has bounced back remarkably well from the floods of 1998 there remain a number of obstacles to sustained growth. In addition to the week performance of Government in revenue collection, the manufacturing and export base is narrow and foreign exchange earnings are insufficient. Large amounts of capital equipment, non-agricultural raw materials and fuel have to be imported that combined with the narrow export base leads to large trade deficits.
8 Macroeconomic data from Bangladesh: EIU Country Report 4th Quarter 1999 The Economist Intelligence Unit 1999

BRAC Poultry Programme
Appendix II Notes to the PMF Tables
1 Cumulative figure a low estimate as calculated by adding dropouts since 1997 to September 1999 total. This applies to all cumulative figures for BRAC.
2 Market totals rough guesses based on estimates of the scale of the activities of extension workers of other NGOs and Government. The private sector has not generally provided such services in rural areas.
3 Market totals for key rearers estimated to include around 500,000 non-BRAC rearers in 1999 (400,000 in 1998 and 300,000 in 1997). These are made up of other NGO's poultry programmes (Proshika and others) and pure private sector rearers.
Many private sector rearers may have copied the models promoted by BRAC and other NGOs. They are provided with services by BRAC members (poultry workers, feed sellers, egg collectors) although they are not BRAC members themselves.
4 Model rearing (producing HYV eggs for hatching) is specific to the BRAC model. So BRAC activities make up almost total market. Estimated a further 300 above BRAC members.
5 Chick rearers appear to have a high dropout rate (compare cumulative total to year on year). It may be that due to the high investment many of those who undertake training (and therefore appear as achievements in the BRAC statistics) do not go into production.
Despite the relative stability in the number of chick rearers it has been estimated that those in production now are producing more than those that were in production in 1997 (see market size - supply - note 23). More key and other rearers are being served by a similar number of chick rearers.
6 It has been estimated that the market for chick rearers is around 7,000 in excess of BRAC supported chick rearers (increased from 6,000 above in 1997 and 1998). Chick rearing is not typically a role that the private sector fulfills.
7 Market size estimated to be 2,000 larger than BRAC operations. Increased from 1,500 in 1997 to 2,000 in excess of BRAC now.
8 The number of pullet rearers has stagnated due to a combination of fewer achievements and increased dropouts. Pullet rearers take on 8-week birds from chick rearers and rear them until they start laying at 5 months. They are then sold to key rearers.
9 Pullet rearing is not a natural activity in the poultry sector. The role has been created in the BRAC model to enable those BRAC members who cannot keep 8-week birds until maturity to purchase productive birds and start earning income immediately.
10 Mini hatcheries are less important in the BRAC model than they were in 1997. Several years ago the supply of day old chicks was one of the major constraints to the increase in HYV poultry husbandry.
Increased capacity of large-scale hatcheries both in the private sector and BRAC's own hatcheries has increased the supply of day old chicks and reduced the need for mini hatcheries. Mini hatcheries also produce chicks with poorer genetic qualities than chicks from large-scale hatcheries.
11 Producing HYV day old chicks on a small scale is not an activity that the market has traditionally performed. It has been estimated that there are around 300 - 400 mini hatcheries other than BRAC's, mostly supported by other NGOs.
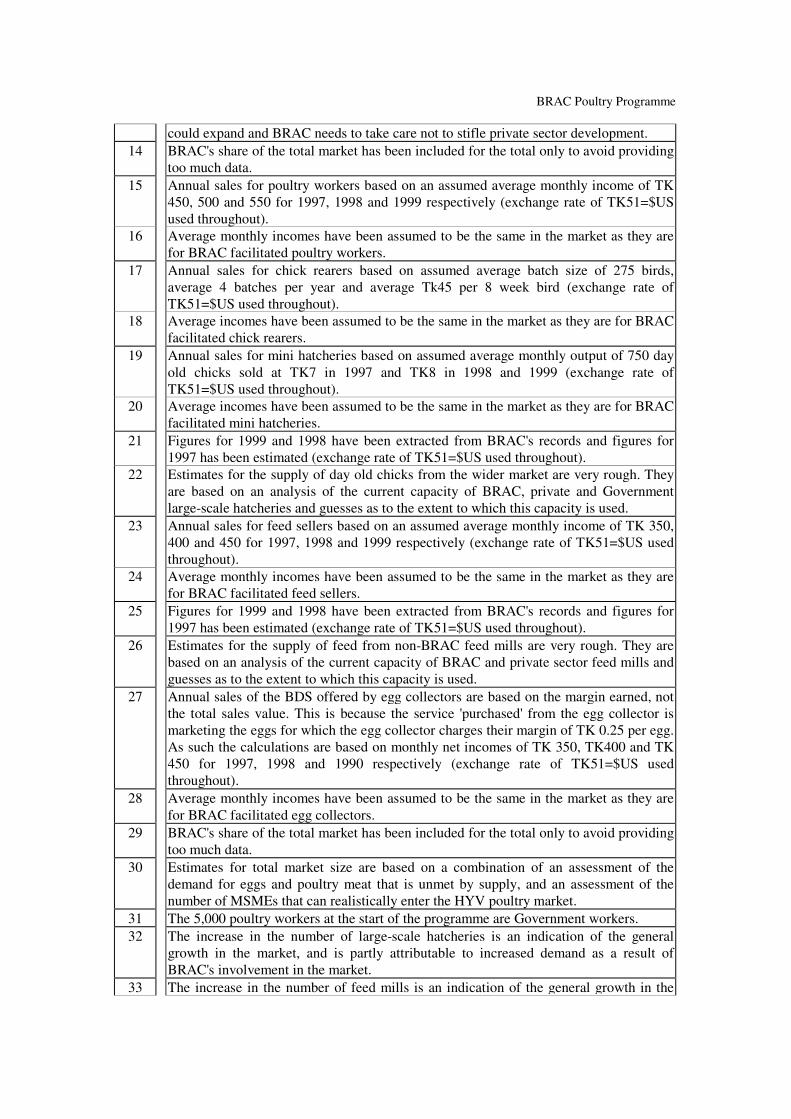
12 It has been estimated that there are around 300 - 400 feed sellers other than BRAC supported feed sellers. This is an area where the private sector could expand and BRAC needs to take care not to stifle private sector development.
13 Market size estimated to be 1,000 larger than BRAC operations. Increased from 700 in 1997 to 1,000 in excess of BRAC now. Again this is an area where the private sector
BRAC Poultry Programme
could expand and BRAC needs to take care not to stifle private sector development. 14 BRAC's share of the total market has been included for the total only to avoid providing
too much data. 15 Annual sales for poultry workers based on an assumed average monthly income of TK
450, 500 and 550 for 1997, 1998 and 1999 respectively (exchange rate of TK51=$US used throughout).
16 Average monthly incomes have been assumed to be the same in the market as they are for BRAC facilitated poultry workers.
17 Annual sales for chick rearers based on assumed average batch size of 275 birds, average 4 batches per year and average Tk45 per 8 week bird (exchange rate of TK51=$US used throughout).
18 Average incomes have been assumed to be the same in the market as they are for BRAC facilitated chick rearers.
19 Annual sales for mini hatcheries based on assumed average monthly output of 750 day old chicks sold at TK7 in 1997 and TK8 in 1998 and 1999 (exchange rate of TK51=$US used throughout).
20 Average incomes have been assumed to be the same in the market as they are for BRAC facilitated mini hatcheries.
21 Figures for 1999 and 1998 have been extracted from BRAC's records and figures for 1997 has been estimated (exchange rate of TK51=$US used throughout).
22 Estimates for the supply of day old chicks from the wider market are very rough. They are based on an analysis of the current capacity of BRAC, private and Government large-scale hatcheries and guesses as to the extent to which this capacity is used.
23 Annual sales for feed sellers based on an assumed average monthly income of TK 350, 400 and 450 for 1997, 1998 and 1999 respectively (exchange rate of TK51=$US used throughout).
24 Average monthly incomes have been assumed to be the same in the market as they are for BRAC facilitated feed sellers.
25 Figures for 1999 and 1998 have been extracted from BRAC's records and figures for 1997 has been estimated (exchange rate of TK51=$US used throughout).
26 Estimates for the supply of feed from non-BRAC feed mills are very rough. They are based on an analysis of the current capacity of BRAC and private sector feed mills and guesses as to the extent to which this capacity is used.
27 Annual sales of the BDS offered by egg collectors are based on the margin earned, not the total sales value. This is because the service 'purchased' from the egg collector is marketing the eggs for which the egg collector charges their margin of TK 0.25 per egg. As such the calculations are based on monthly net incomes of TK 350, TK400 and TK 450 for 1997, 1998 and 1990 respectively (exchange rate of TK51=$US used throughout).
28 Average monthly incomes have been assumed to be the same in the market as they are for BRAC facilitated egg collectors.
29 BRAC's share of the total market has been included for the total only to avoid providing too much data.
30 Estimates for total market size are based on a combination of an assessment of the demand for eggs and poultry meat that is unmet by supply, and an assessment of the number of MSMEs that can realistically enter the HYV poultry market.
31 The 5,000 poultry workers at the start of the programme are Government workers. 32 The increase in the number of large-scale hatcheries is an indication of the general
growth in the market, and is partly attributable to increased demand as a result of BRAC's involvement in the market.
33 The increase in the number of feed mills is an indication of the general growth in the
BRAC Poultry Programme
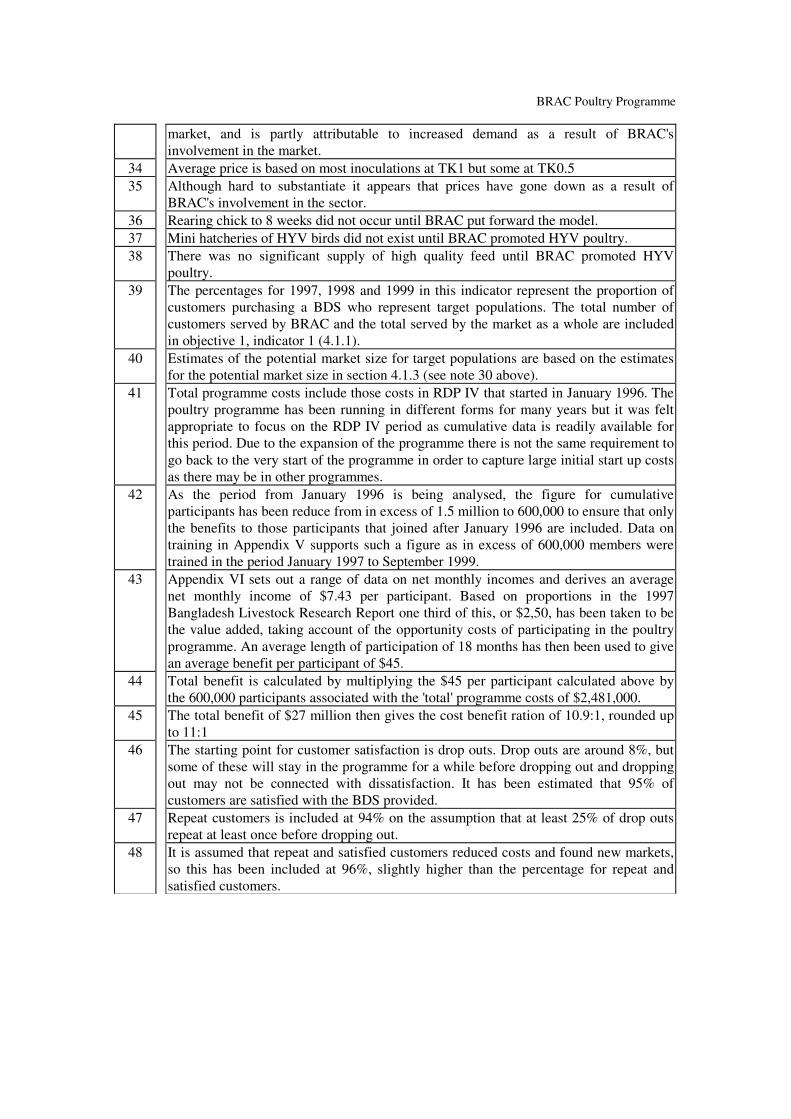
market, and is partly attributable to increased demand as a result of BRAC's involvement in the market.
34 Average price is based on most inoculations at TK1 but some at TK0.5 35 Although hard to substantiate it appears that prices have gone down as a result of
BRAC's involvement in the sector. 36 Rearing chick to 8 weeks did not occur until BRAC put forward the model. 37 Mini hatcheries of HYV birds did not exist until BRAC promoted HYV poultry. 38 There was no significant supply of high quality feed until BRAC promoted HYV
poultry. 39 The percentages for 1997, 1998 and 1999 in this indicator represent the proportion of
customers purchasing a BDS who represent target populations. The total number of customers served by BRAC and the total served by the market as a whole are included in objective 1, indicator 1 (4.1.1).
40 Estimates of the potential market size for target populations are based on the estimates for the potential market size in section 4.1.3 (see note 30 above).
41 Total programme costs include those costs in RDP IV that started in January 1996. The poultry programme has been running in different forms for many years but it was felt appropriate to focus on the RDP IV period as cumulative data is readily available for this period. Due to the expansion of the programme there is not the same requirement to go back to the very start of the programme in order to capture large initial start up costs as there may be in other programmes.
42 As the period from January 1996 is being analysed, the figure for cumulative participants has been reduce from in excess of 1.5 million to 600,000 to ensure that only the benefits to those participants that joined after January 1996 are included. Data on training in Appendix V supports such a figure as in excess of 600,000 members were trained in the period January 1997 to September 1999.
43 Appendix VI sets out a range of data on net monthly incomes and derives an average net monthly income of $7.43 per participant. Based on proportions in the 1997 Bangladesh Livestock Research Report one third of this, or $2,50, has been taken to be the value added, taking account of the opportunity costs of participating in the poultry programme. An average length of participation of 18 months has then been used to give an average benefit per participant of $45.
44 Total benefit is calculated by multiplying the $45 per participant calculated above by the 600,000 participants associated with the 'total' programme costs of $2,481,000.
45 The total benefit of $27 million then gives the cost benefit ration of 10.9:1, rounded up to 11:1
46 The starting point for customer satisfaction is drop outs. Drop outs are around 8%, but some of these will stay in the programme for a while before dropping out and dropping out may not be connected with dissatisfaction. It has been estimated that 95% of customers are satisfied with the BDS provided.
47 Repeat customers is included at 94% on the assumption that at least 25% of drop outs repeat at least once before dropping out.
48 It is assumed that repeat and satisfied customers reduced costs and found new markets, so this has been included at 96%, slightly higher than the percentage for repeat and satisfied customers.
BRAC Poultry Programme
Appendix III Mini Case Studies from Field Visits
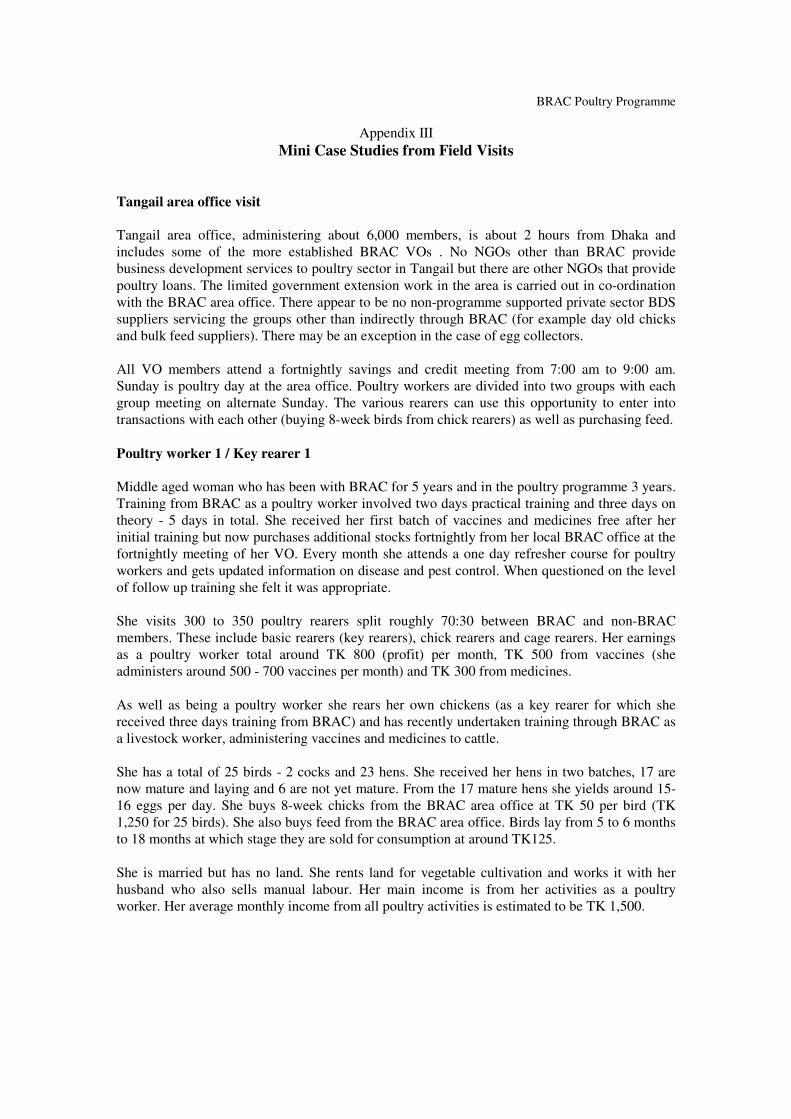
Tangail area office visit Tangail area office, administering about 6,000 members, is about 2 hours from Dhaka and includes some of the more established BRAC VOs . No NGOs other than BRAC provide business development services to poultry sector in Tangail but there are other NGOs that provide poultry loans. The limited government extension work in the area is carried out in co-ordination with the BRAC area office. There appear to be no non-programme supported private sector BDS suppliers servicing the groups other than indirectly through BRAC (for example day old chicks and bulk feed suppliers). There may be an exception in the case of egg collectors. All VO members attend a fortnightly savings and credit meeting from 7:00 am to 9:00 am. Sunday is poultry day at the area office. Poultry workers are divided into two groups with each group meeting on alternate Sunday. The various rearers can use this opportunity to enter into transactions with each other (buying 8-week birds from chick rearers) as well as purchasing feed. Poultry worker 1 / Key rearer 1 Middle aged woman who has been with BRAC for 5 years and in the poultry programme 3 years. Training from BRAC as a poultry worker involved two days practical training and three days on theory - 5 days in total. She received her first batch of vaccines and medicines free after her initial training but now purchases additional stocks fortnightly from her local BRAC office at the fortnightly meeting of her VO. Every month she attends a one day refresher course for poultry workers and gets updated information on disease and pest control. When questioned on the level of follow up training she felt it was appropriate. She visits 300 to 350 poultry rearers split roughly 70:30 between BRAC and non-BRAC members. These include basic rearers (key rearers), chick rearers and cage rearers. Her earnings as a poultry worker total around TK 800 (profit) per month, TK 500 from vaccines (she administers around 500 - 700 vaccines per month) and TK 300 from medicines. As well as being a poultry worker she rears her own chickens (as a key rearer for which she received three days training from BRAC) and has recently undertaken training through BRAC as a livestock worker, administering vaccines and medicines to cattle. She has a total of 25 birds - 2 cocks and 23 hens. She received her hens in two batches, 17 are now mature and laying and 6 are not yet mature. From the 17 mature hens she yields around 15-16 eggs per day. She buys 8-week chicks from the BRAC area office at TK 50 per bird (TK 1,250 for 25 birds). She also buys feed from the BRAC area office. Birds lay from 5 to 6 months to 18 months at which stage they are sold for consumption at around TK125. She is married but has no land. She rents land for vegetable cultivation and works it with her husband who also sells manual labour. Her main income is from her activities as a poultry worker. Her average monthly income from all poultry activities is estimated to be TK 1,500.

BRAC Poultry Programme
Chick rearer Middle aged woman who has been with BRAC for 5 years. Had previously received credit from BRAC for non-poultry purposes and has only been involved in chick rearing for one year. 7 days training in chick rearing from BRAC. Started by using her cookhouse for chick rearing but now has a large purpose built chick rearing coupe financed with a TK 10,000 loan from BRAC. She is making repayments at the rate of TK 500 per fortnight (total repayments TK 11,500 - APR 31.15% - see workings). BRAC staff assisted with the design but she controlled actual construction (the coupe looks very well made). She plans to increase her capacity with another chick rearing coupe adapted from her cookhouse. Her estimated net monthly income before loan repayments is TK1,200 and after loan repayments is TK400. Had previously reared local variety birds which scavenged for food. She buys feed from the BRAC office as well as from the BRAC feed seller from time to time. Has four goats and produces seasonal vegetables on 14 decibels of land. Was motivated to get into chick rearing through observing others do it successfully. Sells most of her 8-week birds to key rearers via the BRAC office but sells a few to neighbours (for the same price). Egg collector Older woman (widow) who has been with BRAC for 8 years and in poultry programme for 5 years. She has 3 sons and 2 daughters and has some help from her eldest son in her market trading. Collects eggs from key rearers and cage rearers and sells at the main market (where prices are higher than at the village market). Buys at TK 3 per egg and sells at TK 3.25 per egg. Buys cash, from non-BRAC people as well as BRAC people (but mostly BRAC people). Turnover is around 100 eggs per day six days per week. With a profit margin of TK 0.25 per egg this translates to an income of around TK 150 per week or TK 650 per month. Faces some competition from outsiders but has good contact with BRAC key/cage rearers and offers guaranteed regular purchases which outsiders do not. Had one-day orientation course from BRAC. In addition to selling eggs at the main market she sells cakes that she makes herself. Her youngest son is currently at school, her three middle children have a little education each and her eldest has very little. Cage rearer 1 Young woman who has been with BRAC 2 years and in the poultry programme one year. Attracted to cage rearing as it offers a regular income (daily income from egg sales) and is more profitable than key rearing (chick rearing is more profitable still but does not offer a regular income and is more complex, more risky and requires more capital). She took out a BRAC loan for TK 3,000 to purchase the cages (12 cages - two birds to a cage) and is paying the loan back at TK 150 per fortnight (total repayments TK 3,450 - effective annual interest rate - 31.15%). She keeps the cages inside her home, with chicken squawking a part of her daily life. She buys feed from the feed seller who gets it from the BRAC office. The cost of TK 30 per week includes transport. At the time of the visit her hens were producing 16 eggs per day but this is expected to rise to 20/22 eggs per day when hems are fully mature (they are currently 4 to 5
BRAC Poultry Programme
months old and not all bird are fully productive). She sells eggs to the egg collector and sometimes a few locally. Eggs to the egg collector sell for TK 3 each (TK 12 for 4) and she generally sells them for the same price on the odd occasion she sells to neighbours, although she has on occasion got TK 13 for 4. Her estimated monthly income from cage rearing is TK 700 before loan repayment and TK 500 after loan repayment. In addition to her poultry work she is a tailor although this work is unpredictable and only earns her irregular income. Gross income from egg sales should reach TK 1,300 - TK 1,400 per month whereas monthly income from tailoring work earns about TK 300. She says that she works harder doing tailoring than keeping her hens yet earns more income from keeping hens (although the harder work in tailoring is sporadic where as the hen work is continuous). She has yet to suffer mortality of her birds. Poultry worker 2 / cage rearer 2 Middle aged woman been with BRAC for 8 years and in the poultry programme for 5 years. She is the VO leader. 5 days training from BRAC and continues to have one day refresher training each month. She feels this ongoing training is appropriate. Services more than 300 key rearers, chick rearers and cage rearers split about 60:40 between BRAC and non-BRAC people. She has no competitors and claims that there is no need for more poultry workers in her area (as one might expect). She administers around 400 - 500 vaccines per month earning TK 1 per vaccine and earns around TK 300 per month from medicines. She has no cash income from other sources but has just started cage rearing with a TK 3,000 loan paid off in 46 weeks in fortnightly instalments of TK 150 (total repayments TK 3,450 - effective annual interest rate - 31.15%). One would expect her earnings from cage rearing to be similar to cage rearer 1 who is a neighbour (Net income TK 700 before loan repayment and TK 500 after loan repayment). Her husband and children assist her with her cage rearing. She received 3 days training on cage rearing. Feed seller Became a BRAC member through the IGVGD programme (18-month food aid programme funded by the World Bank). She was trained as a feed seller within the IGVGD programme and continued to sell feed when her 18 months within the IGVGD finished and she then transferred to the RDP. She received three days training from BRAC which included training in how to mix good quality feed, but in fact she buys ready mixed feed through her BRAC area office which is of higher quality than she can make by purchasing the ingredients separately (when she started felling feed she used to procure and mix the separate ingredients). She buys as required, approximately 16 50kg bag per week. She sells both chick mash (purchased at TK 575per bag) and regular mash (TK 550 per bag). She sells at a profit margin of TK 0.25 per kg. Her estimated net monthly income is TK 750. She is a widow and works with her son who has the other half of her stall selling general goods. The stall belongs to her. She has no land and no other businesses. She has a regular customer base with strong loyalty from customers. She estimates that she sells to BRAC and non-BRAC members in a proportion of around 60:40. She has no competition from other seller in her local area.

BRAC Poultry Programme
Key rearer 2 She has been with the programme 5 years. She raised local variety birds before involvement with BRAC but increased the scale of her poultry activities after being trained as a key rearer. She received three days training when she started but has received no additional training since. There are opportunities to discuss issues at fortnightly BRAC meetings and she does not feel she needs further training. She has 3 cocks and 12 hens. She yields 10 eggs per day, sometimes more. She buys feed (10-12 kg per week) and says she does not let the birds out to scavenge. She also owns ducks (the income from ducks is less than that from hens) and 3 adult goats but has no land. She is a widow with three daughters. They are of school age and she incurs costs such as school uniforms. She uses the services of the local poultry worker and sells eggs both to the egg collector (for TK 3) and to neighbours for hatching (for TK 3.5).
BRAC Poultry Programme
Appendix IV Cost Recovery Data
Costs included in operational costs are the salary, travel and training costs of regional office and area office staff, as well as the costs of training members. No head office costs are apportioned but otherwise the costs that are included are reasonably comprehensive. It is estimated that including head office costs would increase operational costs by around 5-10%. Mature area offices earn surpluses from their credit programmes and the basic running costs of the area offices should be covered by this. Table 2 and figure 2 below summarises the results. Table 2 desegregates the annual cost recovery figures into branches started in 1994, 1995, 1996 and 1997 and then groups them together into branches operating for between 1 and 6 years. These two forms of presenting the information are then plotted in the graphs in figure 2. The weighted average cost recovery plotted in the second graph shows an increasing trend, with a drop for branches 5 years of age. This is because there were 175 branches (those started in 1994 and before) that were 5 years old in 1998, the year of severe flooding in Bangladesh.

BRAC Poultry Programme
Summary Regional office costs Area office costs Mem costs Total Serv chg Cost Salary Travel Training Salary Travel Training Training costs Income recovery
1997 1,989,315 1,373,371 416,968 13,955,601 1,529,541 701,828 8,342,504 28,309,128 8,353,837 30% 1998 4,408,170 2,098,788 770,312 23,879,386 2,668,126 1,104,678 5,302,167 40,231,626 7,251,599 18% 1999 (to September) 1,399,637 656,483 677,880 9,039,326 611,732 342,464 6,942,968 19,670,489 9,395,963 48%
Age-wise analysis 1997 Age Num of Regional office costs Area office costs Mem costs Total Serv chg Cost (years) branches Salary Travel Training Salary Travel Training Training expenses income recovery
1 53 146,415 97,605 48,779 960,765 106,792 82,550 709,369 2,152,275 202,567 9% 2 41 278,716 164,814 67,308 1,996,294 222,721 71,791 1,171,354 3,972,999 720,207 18% 3 61 327,754 252,106 34,675 2,706,567 285,318 133,304 1,361,847 5,101,570 1,298,575 25% 4 & Above 175 1,236,430 858,846 266,206 8,291,975 914,710 414,183 5,099,935 17,082,284 6,132,487 36%
Total 330 1,989,315 1,373,371 416,968 13,955,601 1,529,541 701,828 8,342,504 28,309,128 8,353,837 30%
1998 Age Num of Regional office costs Area office costs Mem costs Total Serv chg Cost (years) branches Salary Travel Training Salary Travel Training Training expenses income recovery
2 53 432,289 216,034 53,890 2,079,363 258,802 97,613 542,051 3,680,041 777,883 21% 3 41 452,423 262,109 142,071 2,563,595 315,990 107,098 379,042 4,222,328 744,545 18% 4 & Above 236 3,523,458 1,620,645 574,351 19,236,428 2,093,335 899,967 4,381,074 32,329,257 5,729,171 18%
Total 330 4,408,170 2,098,788 770,312 23,879,386 2,668,126 1,104,678 5,302,167 40,231,626 7,251,599 18%
1999 (to September) Age Num of Regional office costs Area office costs Mem costs Total Serv chg Cost (years) branches Salary Travel Training Salary Travel Training Training expenses income recovery
3 53 205,136 82,109 74,100 1,553,504 84,054 43,507 977,232 3,019,642 1,076,708 36% 4 & Above 277 1,194,501 574,374 603,780 7,485,822 527,678 298,957 5,965,736 16,650,848 8,319,255 50%
Total 330 1,399,637 656,483 677,880 9,039,326 611,732 342,464 6,942,968 19,670,489 9,395,963 48%
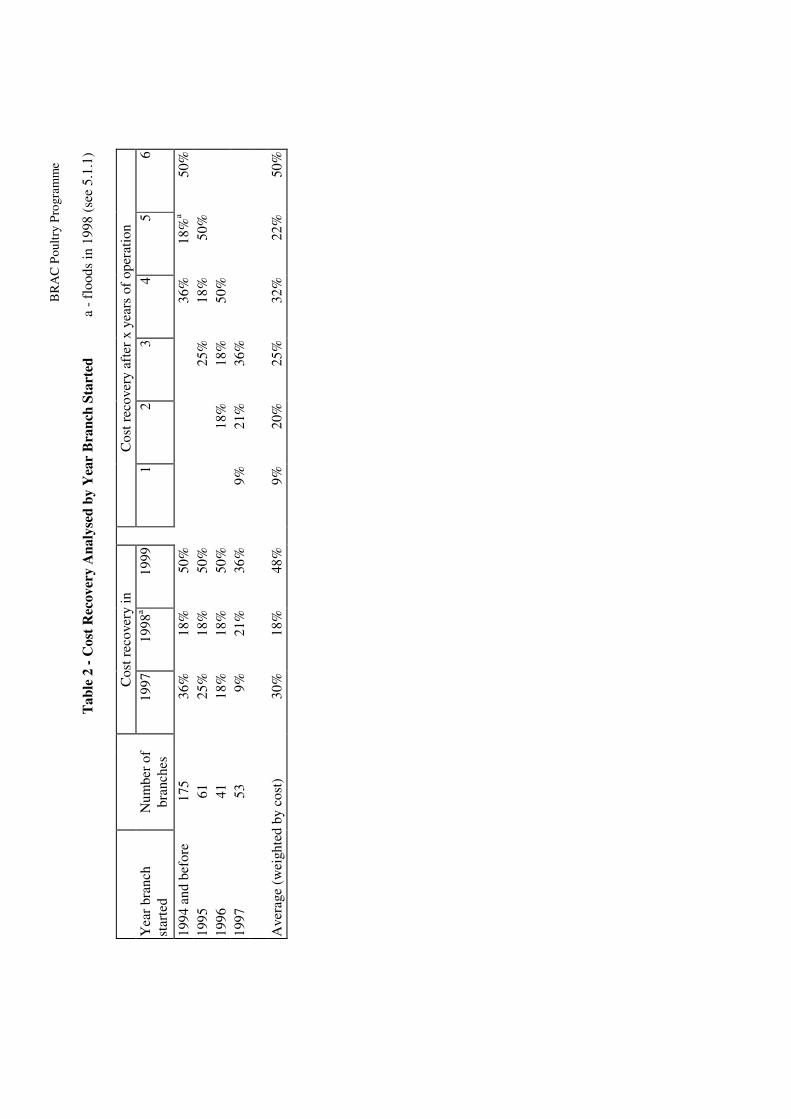
BR
AC
Pou
ltry
Prog
ram
me
Tab
le 2
- C
ost R
ecov
ery
Ana
lyse
d by
Yea
r B
ranc
h St
arte
d a
- flo
ods
in 1
998
(see
5.1
.1)
C
ost r
ecov
ery
in
C
ost r
ecov
ery
afte
r x y
ears
of o
pera
tion
Yea
r bra
nch
star
ted
Num
ber o
f br
anch
es
1997
19
98a
1999
1 2
3 4
5 6
199
4 an
d be
fore
17
5
36%
18
%
50%
36
%
18%
a 50
%
199
5 61
25%
18
%
50%
25%
18
%
50%
199
6 41
18%
18
%
50%
18
%
18%
50
%
199
7 53
9%
21%
36
%
9%
21
%
36%
Ave
rage
(wei
ghte
d by
cos
t)
30
%
18%
48
%
9%
20
%
25%
32
%
22%
50
%

BRAC Poultry Programme
Figure 2 - Cost Recovery Analysed by Years in Operation
Cost recovery desegregating by year branch started
0%
10%
20%
30%
40%
50%
60%
1 2 3 4 5 6
Years in operation
Cos
t rec
over
y
Branches started in 1994and before
Branches started in 1995
Branches started in 1996
Branches started in 1997
Weighted average cost recovery
0%
10%
20%
30%
40%
50%
60%
1 2 3 4 5 6
Years in operation
Cos
t rec
over
y

BR
AC
Pou
ltry
Prog
ram
me
App
endi
x V
O
pera
tions
and
Tra
inin
g D
ata
O
pera
tions
C
umul
ativ
e
New
C
umul
ativ
e
New
C
umul
ativ
e
New
C
umul
ativ
e
to J
an 1
997
Dro
p ou
ts
mem
bers
to
Dec
199
7 D
rop
outs
m
embe
rs
to D
ec 1
998
Dro
p ou
ts
mem
bers
to
Sep
199
9
Poul
try
wor
kers
34
,167
1,
950
9,01
1 41
,228
4,
988
5,61
3 41
,853
1,
561
1,70
8 42
,000
K
ey re
arer
s 87
9,14
2 50
,399
36
1,74
7 1,
190,
490
32,4
94
113,
721
1,27
1,71
7 16
,284
10
6,81
0 1,
362,
243
Chi
ck re
arer
s 11
,342
1,
113
4,49
4 14
,723
2,
033
2,03
3 14
,723
2,
463
2,47
0 14
,730
Pu
llet r
eare
rs
1,30
8 34
2 1,
294
2,26
0 47
0 86
2 2,
652
199
179
2,63
2 M
ini h
atch
erie
s 1,
161
126
314
1,34
9 64
79
1,
364
41
72
1,39
5 Fe
ed s
elle
rs
2,39
7 17
9 23
2 2,
450
79
121
2,49
2 67
13
8 2,
563
Para
vets
2,
571
226
589
2,93
4 32
1 73
8 3,
351
7 30
1 3,
645
93
2,08
8 54
,335
37
7,68
1 1,
255,
434
40,4
49
123,
167
1,33
8,15
2 20
,622
11
1,67
8 1,
429,
208
T
rain
ing
Cum
ulat
ive
C
umul
ativ
e
Cum
ulat
ive
C
umul
ativ
e
to J
an 1
997
Tra
inin
g to
Dec
199
7 T
rain
ing
to D
ec 1
998
Tra
inin
g to
Sep
199
9
Po
ultr
y w
orke
rs
41,9
06
8,87
2 50
,778
4,
454
55,2
32
2,82
1 58
,053
K
ey re
arer
s 94
9,48
8 36
6,75
3 1,
316,
241
270,
767
1,58
7,00
8 22
,665
1,
609,
673
Chi
ck re
arer
s 14
,339
3,
594
17,9
33
4,21
3 22
,146
1,
359
23,5
05
Pulle
t rea
rers
1,
538
951
2,48
9 34
3 2,
832
38
2,87
0 M
ini h
atch
erie
s 2,
212
362
2,57
4 38
0 2,
954
0 2,
954
Feed
sel
lers
4,
261
136
4,39
7 84
4,
481
0 4,
481
Para
vets
2,
715
665
3,38
0 57
8 3,
958
6 3,
964
1,
016,
459
381,
333
1,39
7,79
2 28
0,81
9 1,
678,
611
26,8
89
1,70
5,50
0

BR
AC
Pou
ltry
Prog
ram
me
App
endi
x V
I E
stim
ates
of B
enef
its to
Par
ticip
ants
Po
ultr
y w
orke
rs
Key
re
arer
s C
age
rear
ers
Mod
el
rear
ers
Chi
ck
rear
ers
Bro
iler
rear
ers
Pulle
t re
arer
s M
ini
hatc
heri
es
Feed
se
llers
E
gg
colle
ctor
s
$U
S/m
onth
$U
S/m
onth
$U
S/m
onth
$U
S/m
onth
$U
S/m
onth
$U
S/m
onth
$U
S/m
onth
$U
S/m
onth
$U
S/m
onth
$U
S/m
onth
1994
sur
vey
3 4
15
27
13
6
1997
sur
vey
10
4
28
24
15
B
RA
C's
estim
ates
11
7
11
12
16
40
15
21
16
13
A
utho
rs e
stim
ates
14
8
11
18
16
13
Fi
gure
s us
ed
12
7 11
12
18
40
15
21
16
13
Wei
ghtin
g (x
1,0
00)
42
1,36
2 6
11
15
2 3
2 3
3 1,
449
Wei
ghte
d fi
gure
s 0.
35
6.58
0.
05
0.09
0.
18
0.06
0.
03
0.03
0.
03
0.03
7.
43
• T
he 1
994
surv
ey b
y Sm
allh
olde
r L
ives
tock
Dev
elop
men
t Pro
ject
doe
s no
t inc
lude
the
basi
s fo
r pr
ofita
bilit
y ca
lcul
atio
ns a
nd is
bas
ed o
n a
rela
tivel
y sm
all s
ampl
e.
• T
he 1
997
surv
ey b
y th
e B
angl
ades
h L
ives
tock
Res
earc
h C
omm
issi
on i
nclu
des
mor
e m
etro
logy
and
inv
olve
d in
terv
iew
s w
ith 3
00 B
RA
C m
embe
rs.
Mor
e w
eigh
t is
give
n to
thes
e re
sults
than
the
1994
resu
lts.
• B
RA
C's
estim
ates
are
pro
babl
y th
e m
ost a
ccur
ate
as B
RA
C a
re in
a p
ositi
on o
f exp
erie
nce.
•
The
aut
hors
est
imat
es a
re b
ased
on
a ve
ry li
mite
d sa
mpl
e (a
lthou
gh la
rger
than
the
case
stu
dies
incl
uded
in A
ppen
dix
III)
but
hav
e gi
ven
the
auth
or
com
fort
that
the
abov
e fi
gure
s ar
e no
t unr
easo
nabl
e.
• T
he fi
gure
use
d lin
e gi
ves
the
auth
or's
best
gue
ss o
n th
e ne
t mon
thly
inco
me
earn
ed.
• T
hese
figu
res
used
are
then
wei
ghte
d ac
cord
ing
to th
e nu
mbe
r of p
artic
ipan
ts to
com
e up
with
an
wei
ghte
d av
erag
e m
onth
ly in
com
e of
$7.
43 th
at c
an
be a
pplie
d to
the
tota
l num
ber o
f par
ticip
ants
in th
e pr
ogra
mm
e (s
ee 5
.2.1
)

BRAC Poultry Programme