business rules data validation - the national association ... · pdf filebusiness rules data...
TRANSCRIPT

Business RulesData Validation
-and-Data Quality
National Association of State EMS Officials 2012 Annual Meeting
Boise Centre Boise, IdahoTuesday, September 25, 2012
Presented to the Data Managers Council by Dan LeeIllinois Department of Public HealthDivision of EMS & Highway Safety

Presentation Topics• What is “data quality”?• Attaining quality data
– Pre-collection strategies– Understanding data that’s already been collected
• Illinois overview– Historical– Current
• Applying some simple analytical techniques to an Illinois data sample

Some dimensions of data quality1. Completeness
– Record level• Goal: All applicable fields are completed on each report• Issue: Null values are used to complete a field (or the
field is left blank) when an appropriate non-null value is available
– Database level• Goal: A run report record is submitted to the state for
each reportable activity• Issue: Percentage of submitted reports versus actual
runs difficult to determine—currently no “gold standard” to use for denominator in Illinois

Some dimensions of data quality
2. Accuracy and Validity– The value provided for a data element is accurate
when it reflects what is in fact the case (23 is entered for the age of a person who is actually 23; lights and sirens were on all the way to the scene, and that is what is documented in the report).
– An value is valid if is matches the technical and definitional requirements for data element (13/13/2012 is an invalid date; -5 is an invalid age).
– An accurate value is also valid, but a valid entry is not necessarily accurate.

Some dimensions of data quality3. Consistency
– Record level • Concerned with intra-record relationships among data
element values (for example, the correct sequence of time values)
• Compare with accuracy & validity, which are concerned with stand-alone data element values
– Database level• Concerned with uniformity of meaning across records• Is there a common understanding of data element
definitions, including when and what value to enter?• Issues are best addressed through better definitions,
examples, and/or training

Some dimensions of data quality4. Timeliness
– Concerned with the acceptability of the time interval between a reportable event (e.g., an EMS run) and when the data associated with that event have reached their final destination and are available for use
– An investigation into possible currency issues must include each intermediate step between these two points in time (i.e., the initial event & data availability in final form and location)

Top three data quality strategies

Top three data quality strategies
1. Prevention
2. Prevention
3. Prevention

Top three data quality strategies
1. Prevention2. Prevention3. Prevention
Better to keep errors from entering your database to begin with than to have to identify and clean up issues after the fact.

Two key error prevention tools1. A comprehensive set of rules for error-checking
and data consistency (aka, business rules), and uniform implementation of these rules at all levels:– Point of entry – Transfer into any local databases, all levels– Export utilities– On-line validation tools– The central (i.e., state) database
2. Mandatory completion of a rigorous submitter-level data evaluation and validation process prior to first data submission.

Business Rules• Describe the conditions under which each data
element in a dataset is to be populated (e.g., when, how) and how each is related to other data elements in the dataset.
• A necessary component of software development specifications.
• Basis for point-of-entry and “close call” error-checking.
• Developed through an iterative process:DEFINE TEST/ANALYZE IMPLEMENT
REFINE

Example from Illinois business rules: Patient transported to a hospital by EMS
Since Incident/Patient Disposition = “Treated, Transported by EMS” then– Transport Mode from Scene must be completed– Reason for Choosing Destination must be completed– Depart Scene and Arrive Destination times must be
completed (in addition to other required times)– Destination Type must be completed
And, since Destination Type = “Hospital” then– A valid hospital ID must be entered into
“Destination/Transferred to Code”

Data evaluation and validation• Mandatory for each new submitter organization
software installation combination– For a vendor, validation is needed for each installation
involving a new customer (one-time vendor-level validation has proved inadequate due to wide latitude for customization at the end-user level).
– Likewise, for a submitter, validation is needed when there is a change to new software.
• Important note: Validation is at the submitter level, not the EMS agency level—often one and the same thing but, when data for multiple agencies is exported from a single validated software installation, that is considered one submitter and separate validations are not needed for each agency.
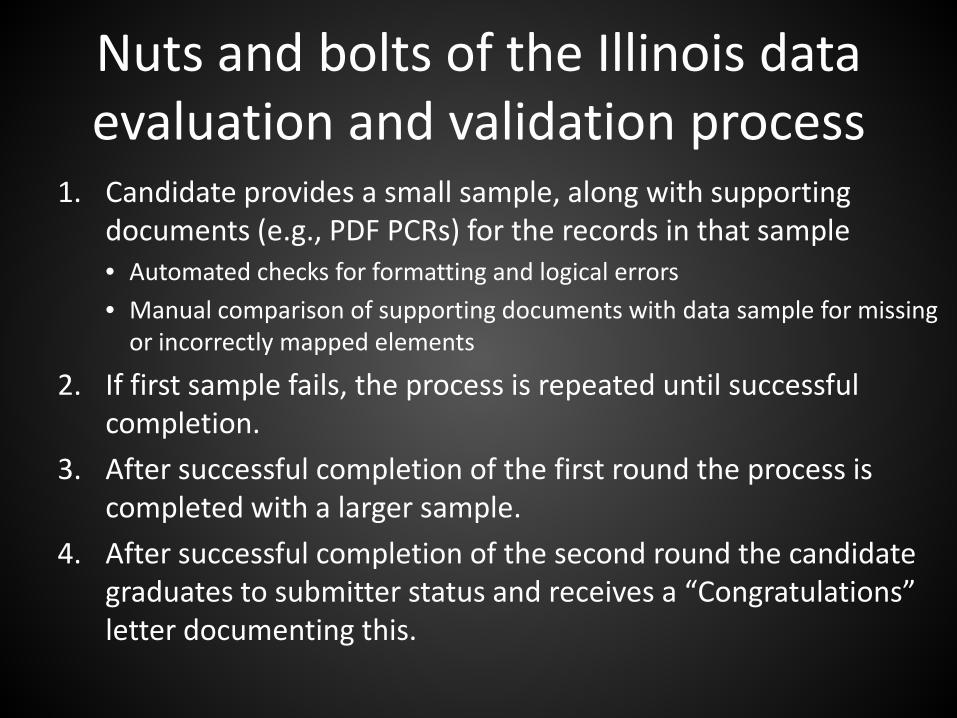
Nuts and bolts of the Illinois data evaluation and validation process
1. Candidate provides a small sample, along with supporting documents (e.g., PDF PCRs) for the records in that sample• Automated checks for formatting and logical errors• Manual comparison of supporting documents with data sample for missing
or incorrectly mapped elements
2. If first sample fails, the process is repeated until successful completion.
3. After successful completion of the first round the process is completed with a larger sample.
4. After successful completion of the second round the candidate graduates to submitter status and receives a “Congratulations” letter documenting this.

Second line of defense• No set of business rules, validation process, or
other error prevention approach is foolproof.• Some bad data will make its way into your
database despite the best prevention efforts.• The second line of defense is to identify emerging
issues and take corrective action, including:– Database level actions (correct bad values, delete bad
values or, as a last resort, delete bad records);– Process improvement (new rules, validation process
improvements, feedback to submitters and vendors).
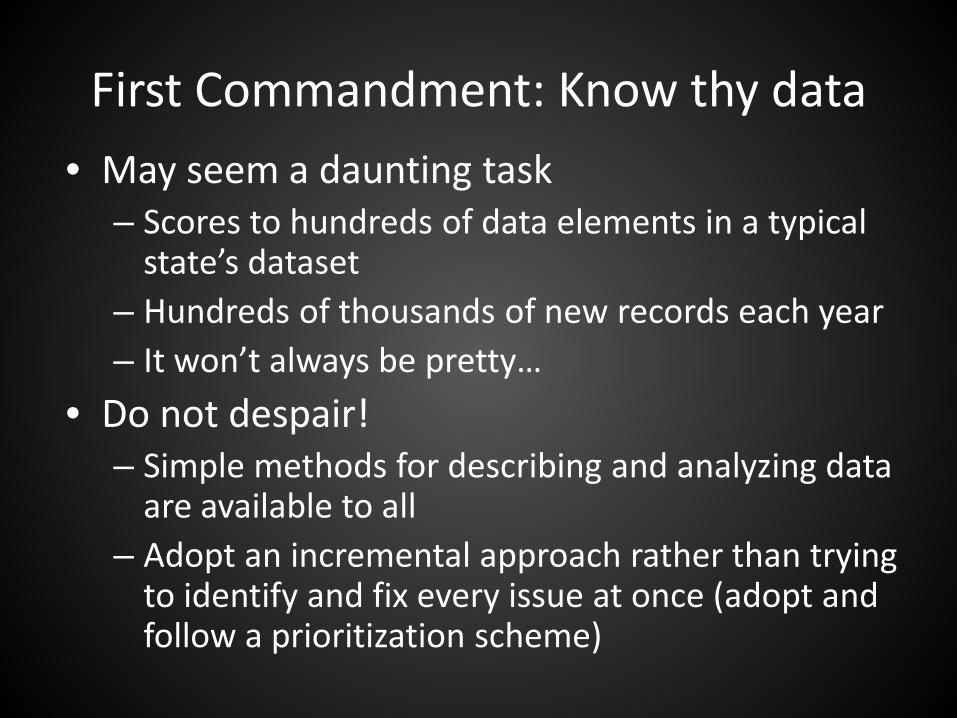
First Commandment: Know thy data• May seem a daunting task
– Scores to hundreds of data elements in a typical state’s dataset
– Hundreds of thousands of new records each year– It won’t always be pretty…
• Do not despair!– Simple methods for describing and analyzing data
are available to all– Adopt an incremental approach rather than trying
to identify and fix every issue at once (adopt and follow a prioritization scheme)

Data Structure BasicsDatabase1
Data elements 2 Records
Values
Notes1. The relationship between records and data elements may be
completely contained in a single table (flat file), or it may be distributed among multiple linked tables.
2. Also called variables or fields. A collection of data elements is called a dataset.

Ways of Classifying Data Elements• There are many ways to classify data elements.• For this discussion, we’ll use just two:
– Categorical • Also known as discrete or qualitative • Can be further classified as nominal, ordinal, or
dichotomous• Examples include symptoms, incident disposition
– Continuous• Also known as quantitative • Examples include age, weight, pulse ox.

Ways of Evaluating Data• Descriptive approach
– Describes only what’s there– Uses concise summary measures to help make sense
of data, such as how values are distributed and the characteristics of that distribution
• Inferential approach– Provides a basis for drawing conclusions or making
predictions about a population based on analysis of one or more samples drawn from that population
• Different tools are used for each approach depending on the type of data (categorical or continuous)
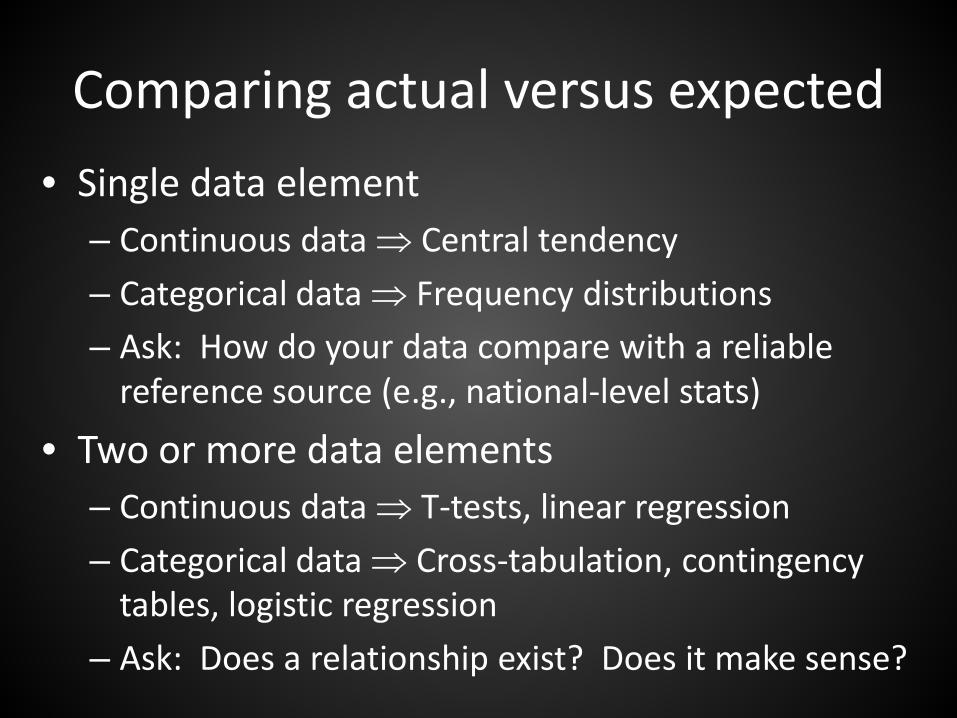
Comparing actual versus expected• Single data element
– Continuous data ⇒ Central tendency– Categorical data ⇒ Frequency distributions– Ask: How do your data compare with a reliable
reference source (e.g., national-level stats)
• Two or more data elements– Continuous data ⇒ T-tests, linear regression– Categorical data ⇒ Cross-tabulation, contingency
tables, logistic regression– Ask: Does a relationship exist? Does it make sense?
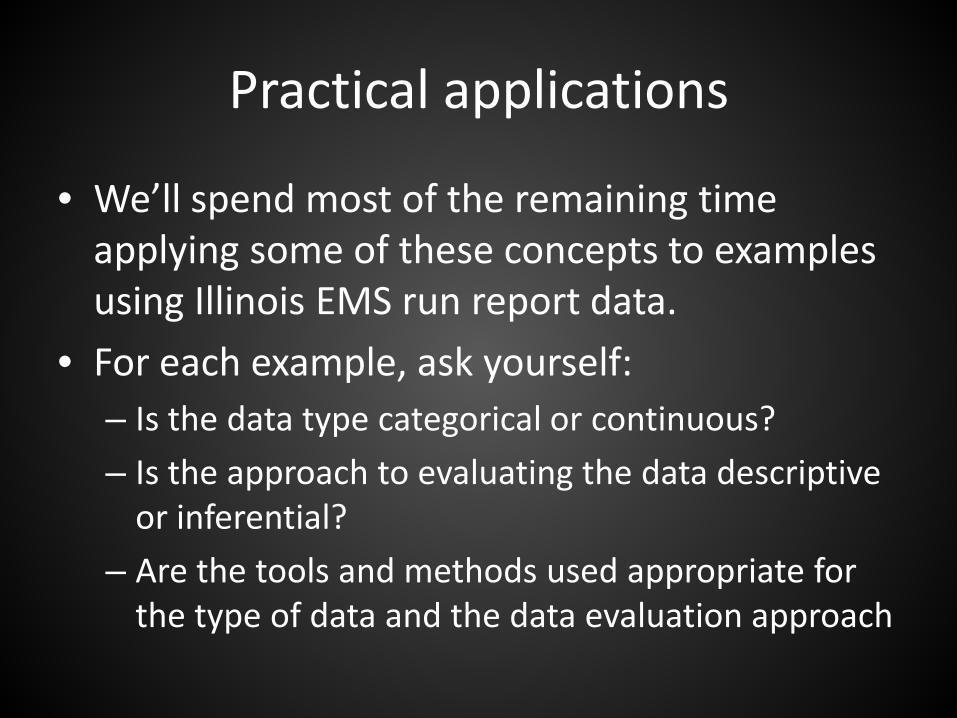
Practical applications
• We’ll spend most of the remaining time applying some of these concepts to examples using Illinois EMS run report data.
• For each example, ask yourself:– Is the data type categorical or continuous?– Is the approach to evaluating the data descriptive
or inferential?– Are the tools and methods used appropriate for
the type of data and the data evaluation approach

But first a digression…• EMS data collection in Illinois began in the
mid-1990s using a state-compiled dataset• Initially paper-based data capture, with the
capability for submitters to convert to electronic collection & submission by purchasing third-party software
• Dataset revised and expanded in 2002 based on input from a committee of EMS community stakeholders formed for that purpose
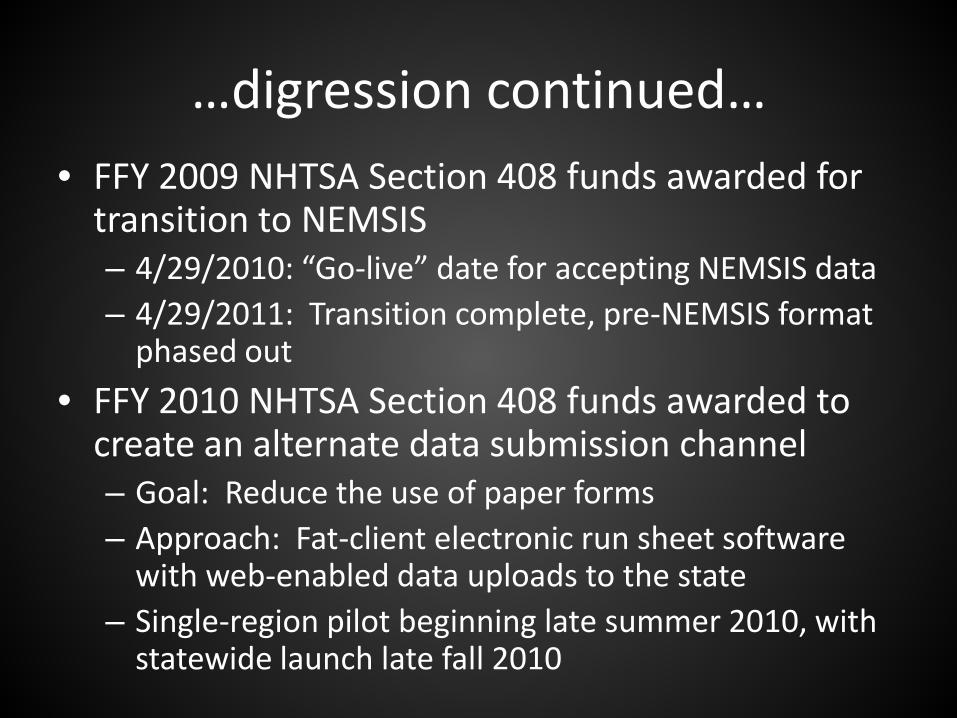
…digression continued…• FFY 2009 NHTSA Section 408 funds awarded for
transition to NEMSIS– 4/29/2010: “Go-live” date for accepting NEMSIS data– 4/29/2011: Transition complete, pre-NEMSIS format
phased out• FFY 2010 NHTSA Section 408 funds awarded to
create an alternate data submission channel– Goal: Reduce the use of paper forms– Approach: Fat-client electronic run sheet software
with web-enabled data uploads to the state– Single-region pilot beginning late summer 2010, with
statewide launch late fall 2010

…digression concluded• Mandatory reporting, but for state-licensed
transport vehicle provider services only (approx. 425 of these)
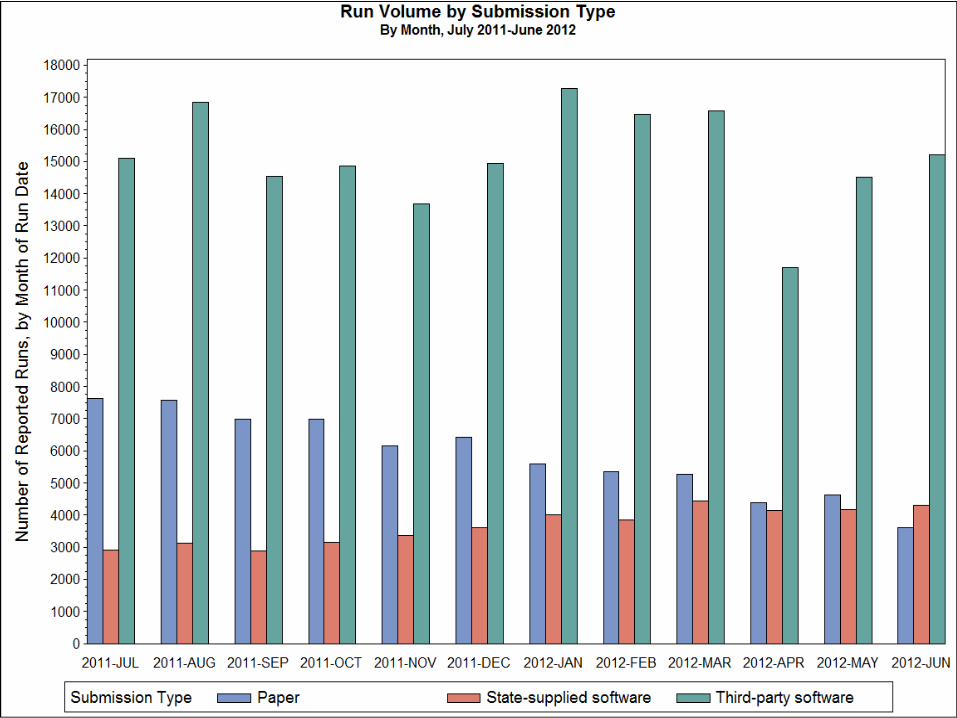
• Three data submission channels– Third-party software/batch submission– State-supplied software/continuous submission– OMR forms/paper-based submission
• IL has been submitting “E” elements to the national EMS database since mid-2011, quarterly thereafter– Run dates from 10/1/2010 forward– 100% of NEMSIS “National” dataset– “D” elements annually

Dataset– All elements are drawn from the NEMSIS
2.2.1 data dictionary unaltered– Relational database structure
• 91 elements in main table (PCR)• 24 other sub-tables for elements with a
many-to-one relationship to the main table (e.g., procedures, medications) or other sub-tables (procedure complications, medication complications)
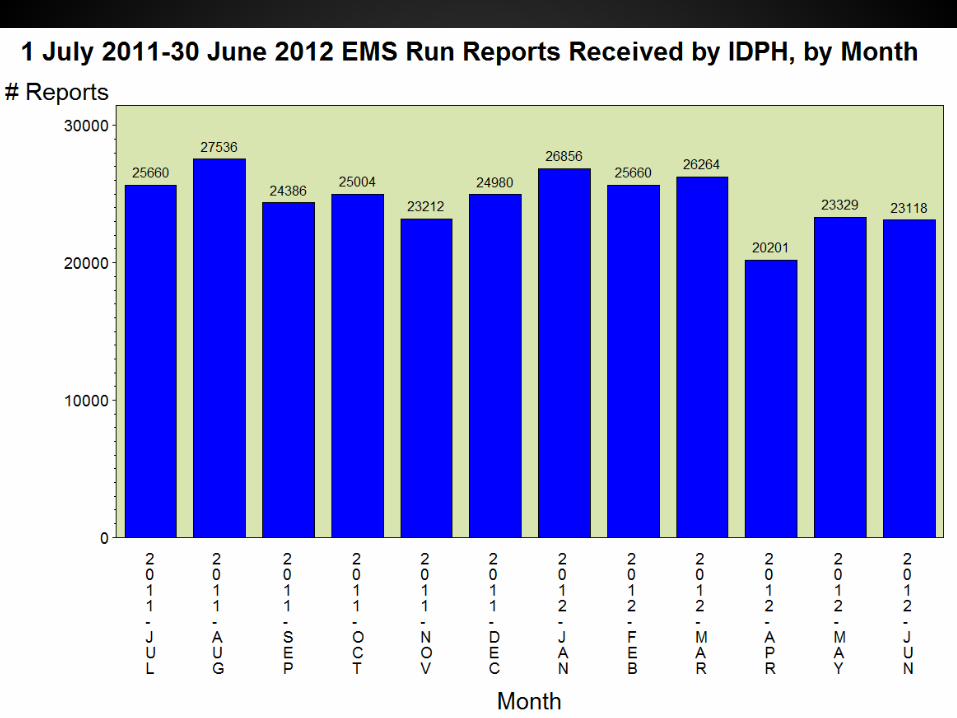
Analysis sample for this presentation– Date range is 1 July 2011—30 Jun 2012– 296206 records

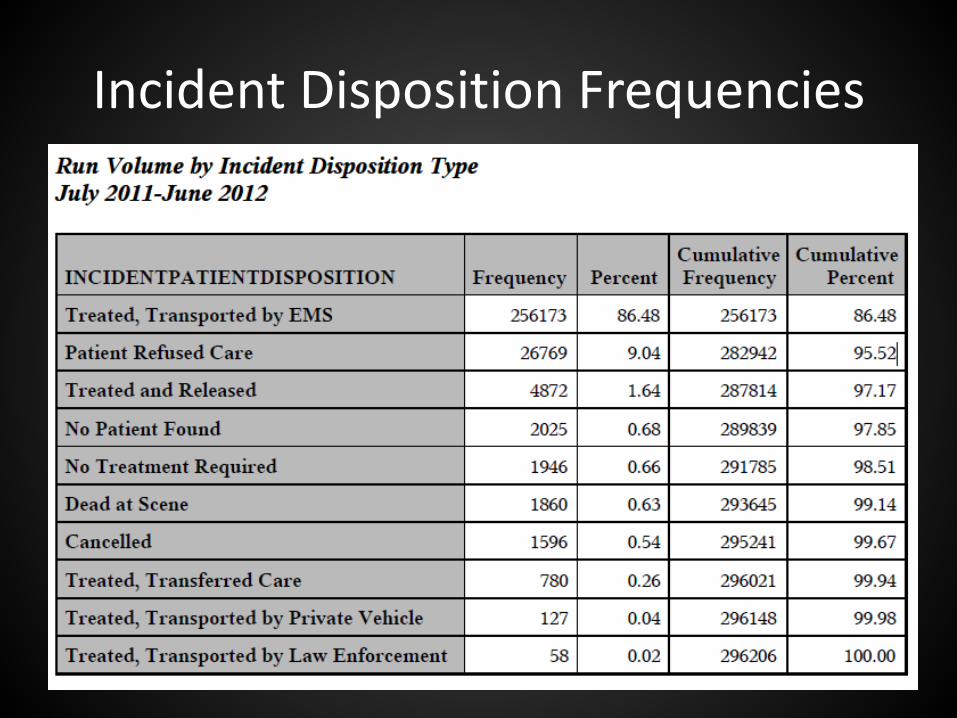
Incident Disposition Frequencies
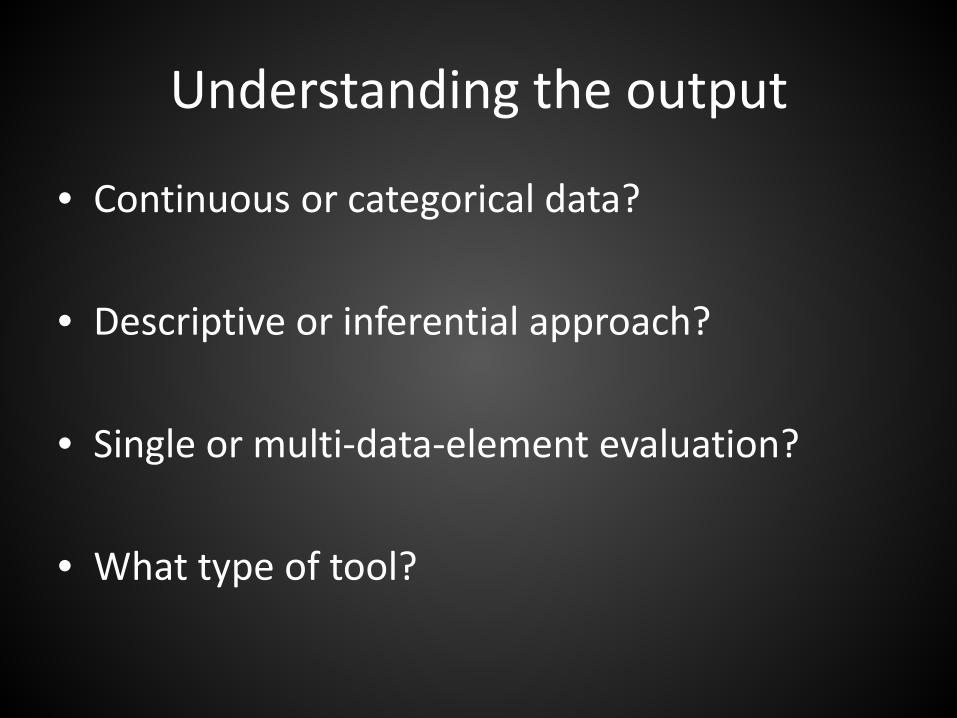
Understanding the output
• Continuous or categorical data?
• Descriptive or inferential approach?
• Single or multi-data-element evaluation?
• What type of tool?

Understanding the output
• Continuous or categorical data?– Categorical
• Descriptive or inferential approach?– Descriptive
• Single or multiple data element evaluation?– Single
• What type of tool?– Frequency distribution


Understanding the output
• Continuous or categorical data?
• Descriptive or inferential approach?
• Single or multi-data-element evaluation?
• What type of tool?

Understanding the output
• Continuous or categorical data?– Categorical
• Descriptive or inferential approach?– Descriptive
• Single or multiple data element evaluation?– Multiple (two in this case)
• What type of tool?– Crosstab (note: display limited to column %)
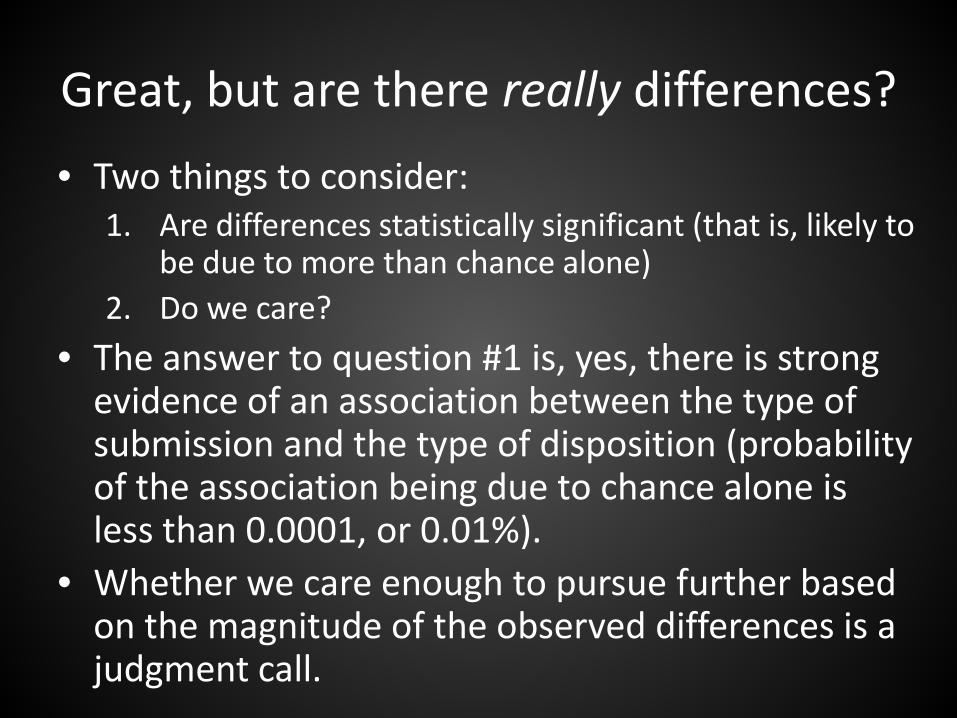
Great, but are there really differences?• Two things to consider:
1. Are differences statistically significant (that is, likely to be due to more than chance alone)
2. Do we care?• The answer to question #1 is, yes, there is strong
evidence of an association between the type of submission and the type of disposition (probability of the association being due to chance alone is less than 0.0001, or 0.01%).
• Whether we care enough to pursue further based on the magnitude of the observed differences is a judgment call.

Excessive null/missing values

Impression Yes/No stratified by s/w type

• Treated and Released• Treated, Transferred Care• Treated, Transported by EMS• Treated, Transported by Law
Enforcement
• Treated, Transported by Private Vehicle
• No Treatment Required• Patient Refused Care• Dead at Scene
Continuous data example:Response Time
Includes only 911 response to scene runs with one of the following incident/patient dispositions:

• Treated and Released• Treated, Transferred Care• Treated, Transported by EMS• Treated, Transported by Law
Enforcement
• Treated, Transported by Private Vehicle
• No Treatment Required• Patient Refused Care• Dead at Scene
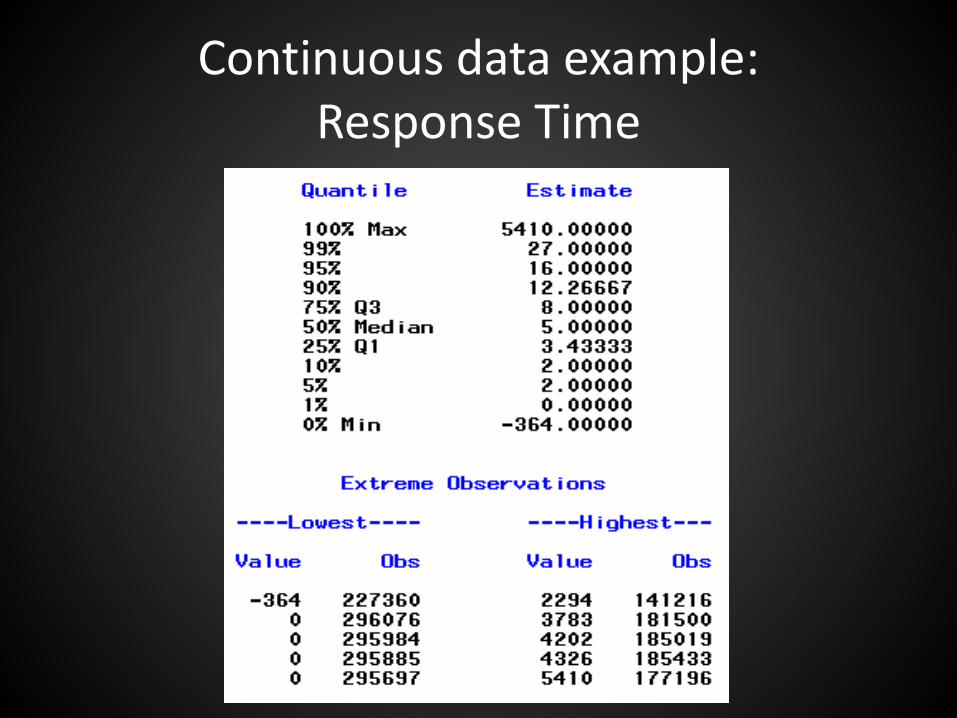
Continuous data example:Response Time
Includes only 911 response to scene runs with one of the following incident/patient dispositions:
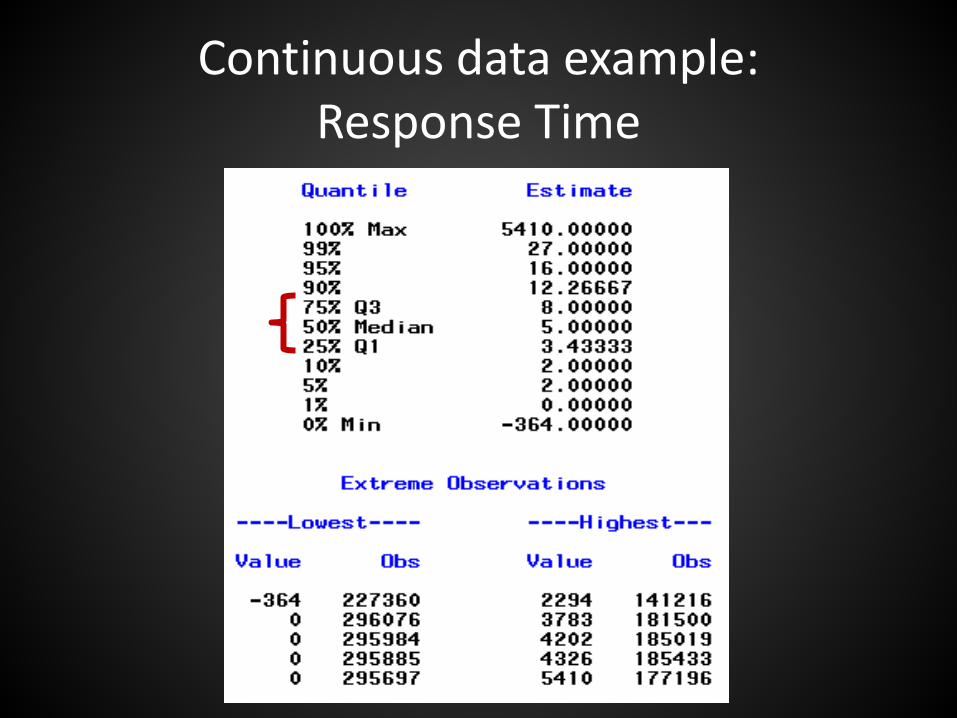
Continuous data example:Response Time
Continuous data example:Response Time
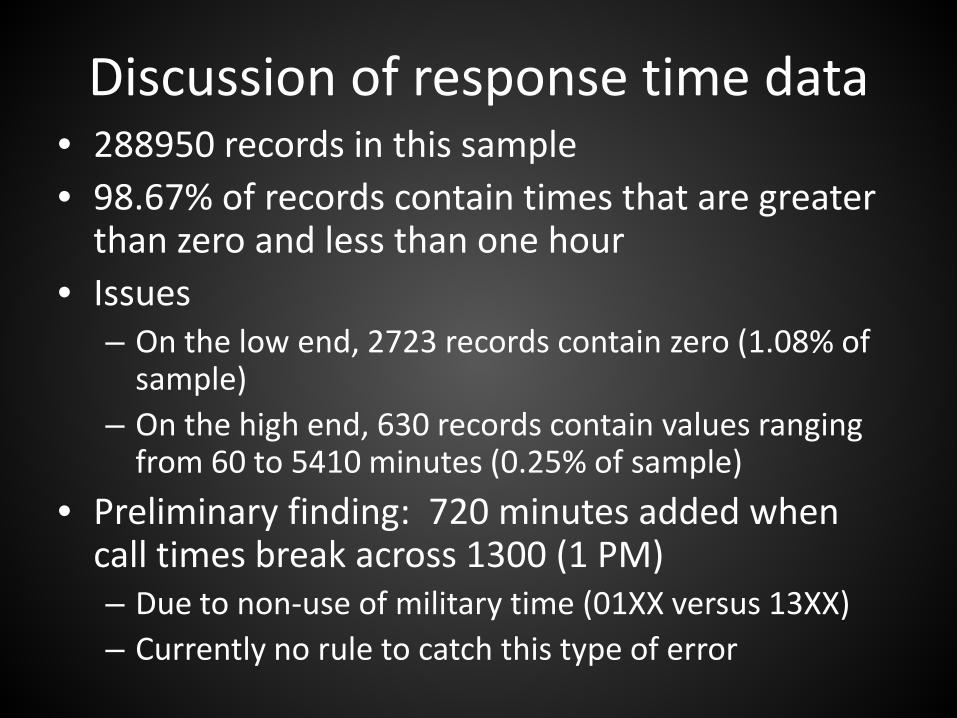
Discussion of response time data• 288950 records in this sample• 98.67% of records contain times that are greater
than zero and less than one hour• Issues
– On the low end, 2723 records contain zero (1.08% of sample)
– On the high end, 630 records contain values ranging from 60 to 5410 minutes (0.25% of sample)
• Preliminary finding: 720 minutes added when call times break across 1300 (1 PM) – Due to non-use of military time (01XX versus 13XX)– Currently no rule to catch this type of error
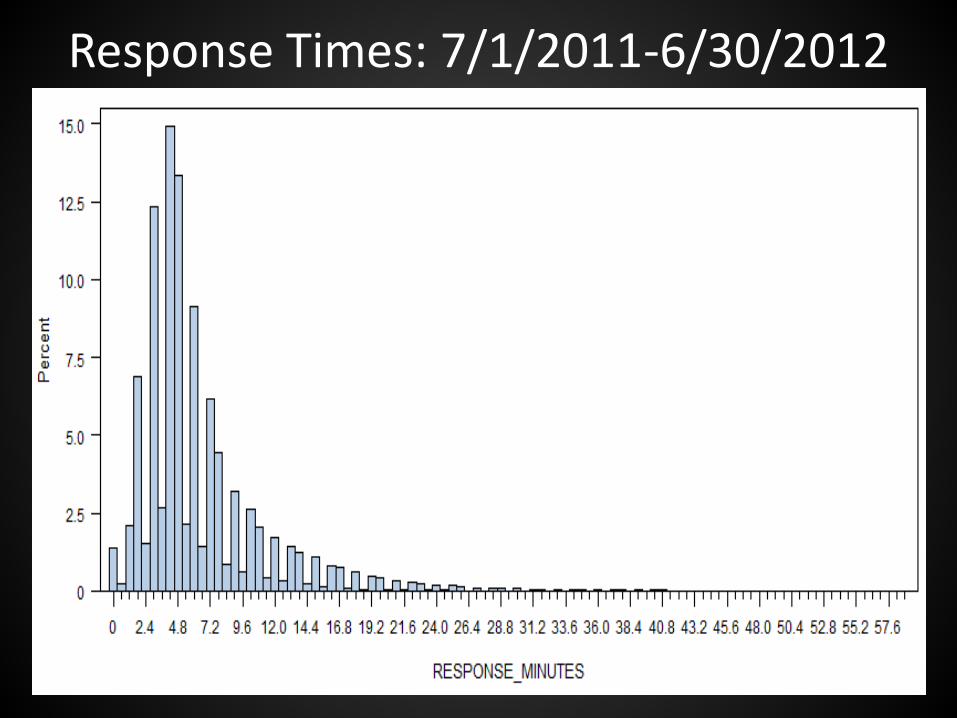
Response Times: 7/1/2011-6/30/2012
Take aways• Just passively collecting and storing data is not
really enough• Take a look at your data• Many tools and techniques are at your
disposal• Start simple, then gain experience and build
expertise at your own pace• Coursera offers free high quality online training
(https://www.coursera.org/)

Dan LeeIllinois Department of Public HealthDivision of EMS and Highway [email protected]