business plan 012106 - athabasca...
TRANSCRIPT

RFind Systems, Inc.
Business Plan
24 January 2006
This document contains confidential information, which is proprietary to RFind Systems, Inc. No part of this document may be used, reproduced, disclosed, or conveyed in whole or in part without the prior authorization of RFind Systems, Inc.
Table of Contents
1 EXECUTIVE SUMMARY................................................................................................................. 3
2 RFIND SYSTEMS FACT SHEET .................................................................................................... 4
3 THE RFIND SYSTEM ....................................................................................................................... 6
3.1 THE NEED .................................................................................................................................... 6 3.2 RFIND’S SOLUTION ...................................................................................................................... 7
3.2.1 The Technology....................................................................................................................... 7 3.2.2 The Hardware......................................................................................................................... 8
3.2.2.1 The Antenna................................................................................................................................. 8 3.2.2.2 Power Management...................................................................................................................... 9 3.2.2.3 Packaging..................................................................................................................................... 9 3.2.2.4 Architecture ................................................................................................................................. 9
3.2.3 The Protocol ......................................................................................................................... 10 3.2.4 The Software Algorithms ...................................................................................................... 10 3.2.5 The Application..................................................................................................................... 11
3.3 INTELLECTUAL PROPERTY ......................................................................................................... 12
4 DEVELOPMENT PLAN ................................................................................................................. 12
5 OPERATIONS PLAN ...................................................................................................................... 12
5.1 PRODUCTION .............................................................................................................................. 12 5.2 IMPLEMENTATION ...................................................................................................................... 13
6 MARKET ANALYSIS ..................................................................................................................... 13
6.1 MARKETS AND SEGMENTS ......................................................................................................... 13 6.2 SPECIAL INITIATIVES.................................................................................................................. 15
6.2.1 Wal-Mart .............................................................................................................................. 15 6.2.2 United States Department of Defense ................................................................................... 15
6.3 STANDARDS AND REGULATIONS ................................................................................................ 16 6.4 COMPETITORS ............................................................................................................................ 17
7 COMPETITIVE BUSINESS STRATEGY..................................................................................... 19
7.1 INTEGRATION ............................................................................................................................. 19 7.2 COST .......................................................................................................................................... 19 7.3 LICENSING.................................................................................................................................. 20
8 MARKETING PLAN ....................................................................................................................... 20
8.1 PRICING...................................................................................................................................... 20 8.2 PROMOTION AND ADVERTISING ................................................................................................. 21
8.2.1 Step 1a: The Local Market ................................................................................................... 21 8.2.2 Step 1b: Large Customer ...................................................................................................... 23 8.2.3 Step 2: Mass Market ............................................................................................................. 24 8.2.4 Promotion ............................................................................................................................. 24
8.2.4.1 Web Site..................................................................................................................................... 24 8.2.4.2 Tradeshows ................................................................................................................................ 24 8.2.4.3 Marketing Budget ...................................................................................................................... 25
8.3 SALES AND DISTRIBUTION ......................................................................................................... 25 8.3.1 Sales Strategy ....................................................................................................................... 25
8.3.1.1 Direct Sales ................................................................................................................................ 25 8.3.1.2 Third Party Sales........................................................................................................................ 25
8.3.1.2.1 Nevalon Technologies .......................................................................................................... 26
9 IMPLEMENTATION SCHEDULE................................................................................................ 26

9.1 SALES AND MARKETING ............................................................................................................ 26 9.2 RISKS AND ASSUMPTIONS .......................................................................................................... 27
10 THE BUSINESS................................................................................................................................ 27
10.1 INCUBATOR ................................................................................................................................ 27 10.1.1 Okanagan Valley Research and Innovation Centre (ORIC) ............................................ 27
11 THE PEOPLE ................................................................................................................................... 28
11.1 MANAGEMENT ........................................................................................................................... 28 11.1.1 Chief Executive Officer - Sharon Barnes ......................................................................... 29 11.1.2 Vice President of Technology – Marty Brooks................................................................. 29
11.2 STAFFING ................................................................................................................................... 30 11.2.1 Director of Sales – Portia Dove....................................................................................... 30 11.2.2 Software Development – John Fitzpatrick ....................................................................... 30
11.3 BOARD OF ADVISORS ................................................................................................................. 31 11.3.1 Alan Foster ...................................................................................................................... 31 11.3.2 David Mayes .................................................................................................................... 31 11.3.3 Peter Haubrich ................................................................................................................ 32
11.4 LEGAL AND ACCOUNTING .......................................................................................................... 32
12 FINANCIALS AND OPPORTUNITY............................................................................................ 33
12.1 FINANCIAL FORECASTS .............................................................................................................. 33 12.1.1 Break Even Analysis ........................................................................................................ 33 12.1.2 Other Projections............................................................................................................. 33
12.2 VALUATION ............................................................................................................................... 34 12.3 INVESTMENT OPPORTUNITY ....................................................................................................... 35 12.4 ROUND 1 .................................................................................................................................... 36 12.5 ROUND 2 – MARKETING AND OPERATIONS ................................................................................ 36 12.6 INTELLECTUAL PROPERTY ......................................................................................................... 36 12.7 POSITIONING FOR SALE .............................................................................................................. 37
13 APPENDIX A: BUSINESS CASE STUDIES................................................................................. 38
13.1 BUSINESS CASE #1 – FINISHED GOODS LOCATING..................................................................... 38 13.2 BUSINESS CASE #2 – LOCATING STAMPING DIES WITHIN A MANUFACTURING FACILITY.......... 40 13.3 BUSINESS CASE #3 – LOCATING SPECIAL RACKING IN A MANUFACTURING FACILITY............... 42
14 APPENDIX B: MANUFACTURING ORGANIZATIONS IN BRITISH COLUMBIA WITH 100 – 1000 EMPLOYEES .......................................................................................................................... 44
15 APPENDIX C: MANUFACTURING ORGANIZATIONS IN CANADA WITH 1000 + EMPLOYEES............................................................................................................................................. 49
16 APPENDIX D: PROJECTED CASH FLOW STATEMENTS BY MONTH – 2006 – 2007...... 54
17 APPENDIX E: PROJECTED INCOME STATEMENTS BY MONTH – 2006 – 2007 ............. 56
18 APPENDIX F: PROJECTED FINANCIAL STATEMENTS BY YEAR.................................... 58
18.1 PROJECTED INCOME STATEMENTS (2005 – 2010) ...................................................................... 58 18.2 PROJECTED CASH FLOW STATEMENTS (2005 – 2010)................................................................ 59 18.3 PROJECTED BALANCE SHEETS (2005 – 2010)............................................................................. 60
19 APPENDIX G: RESUMES FOR SHARON BARNES AND MARTY BROOKS ...................... 61
19.1 RESUME FOR SHARON BARNES .................................................................................................. 61 19.2 RESUME FOR MARTY BROOKS ................................................................................................... 63
Business Plan Confidential Page 3 of 64
1 Executive Summary Manufacturing and warehousing facilities have hundreds and sometimes thousands of items that are needed in specific places at specific times. These items are owned assets, works in process, and finished goods of the organization. Due to the size of these facilities, the challenge is to locate and move items on schedule. RFind Systems, Inc. (RFind) is a new business that answers the question:
“WHERE?” RFind makes use of radio frequency identification (RFID) together with a complete software solution that delivers timely information to the end-user. RFID technology has evolved over several years and has recently reached a point of maturity that makes it a viable technology for solving these types of problems. Organizations interested in implementing RFID into their organization have noted three key reasons for deciding not to proceed:
1) The high cost of implementing RFID systems, 2) The need to develop the software to support the RFID hardware provided by
manufacturers, and; 3) The amount of changes needed in their existing processes prior to implementing
the RFID system. RFind’s solution for the manufacturing sector is complete. It does not require any additional development or any custom work. It is directed specifically at locating and tracking items in manufacturing and warehousing environments. The hardware is designed to survive in harsh environments. RFind has developed a new architecture for the RFID system that reduces the amount of hardware infrastructure required. This results in a lower up front and on-going support costs for the customer. An option to license the infrastructure will provide RFind with an on-going revenue stream while maintaining ownership of the hardware.
Business Plan Confidential Page 4 of 64
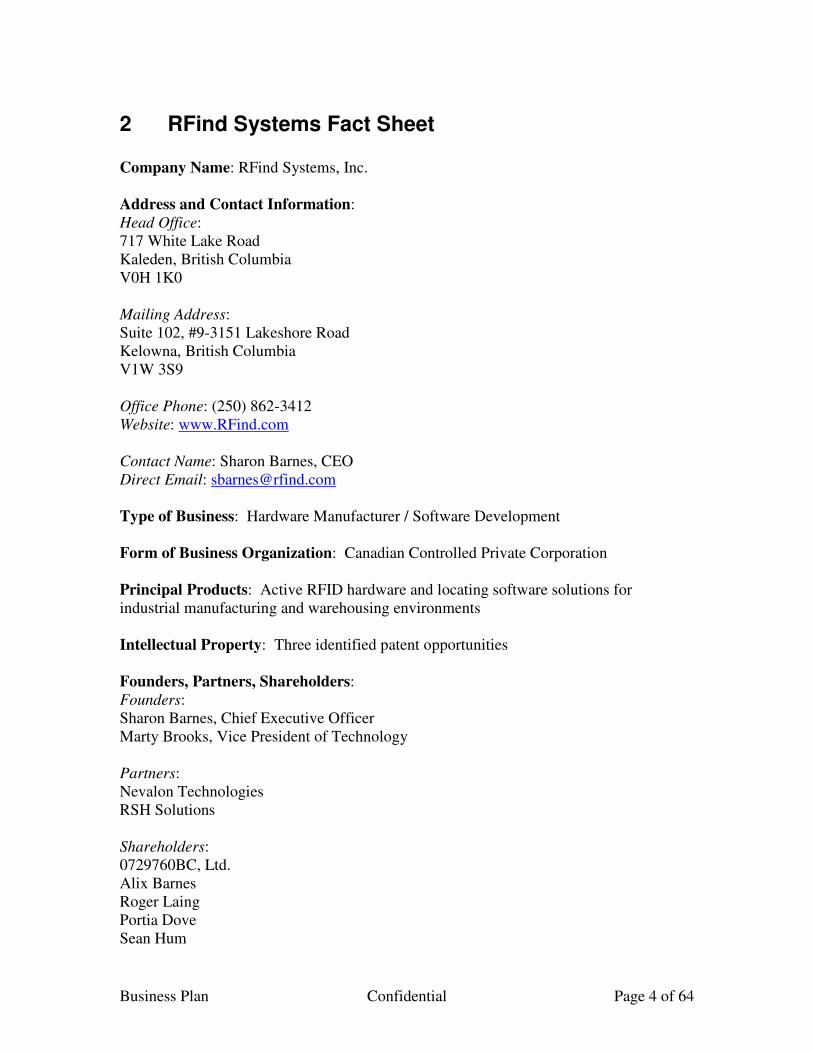
2 RFind Systems Fact Sheet Company Name: RFind Systems, Inc. Address and Contact Information: Head Office: 717 White Lake Road Kaleden, British Columbia V0H 1K0 Mailing Address: Suite 102, #9-3151 Lakeshore Road Kelowna, British Columbia V1W 3S9 Office Phone: (250) 862-3412 Website: www.RFind.com Contact Name: Sharon Barnes, CEO Direct Email: [email protected] Type of Business: Hardware Manufacturer / Software Development Form of Business Organization: Canadian Controlled Private Corporation Principal Products: Active RFID hardware and locating software solutions for industrial manufacturing and warehousing environments Intellectual Property: Three identified patent opportunities Founders, Partners, Shareholders: Founders: Sharon Barnes, Chief Executive Officer Marty Brooks, Vice President of Technology Partners: Nevalon Technologies RSH Solutions Shareholders: 0729760BC, Ltd. Alix Barnes Roger Laing Portia Dove Sean Hum
Business Plan Confidential Page 5 of 64
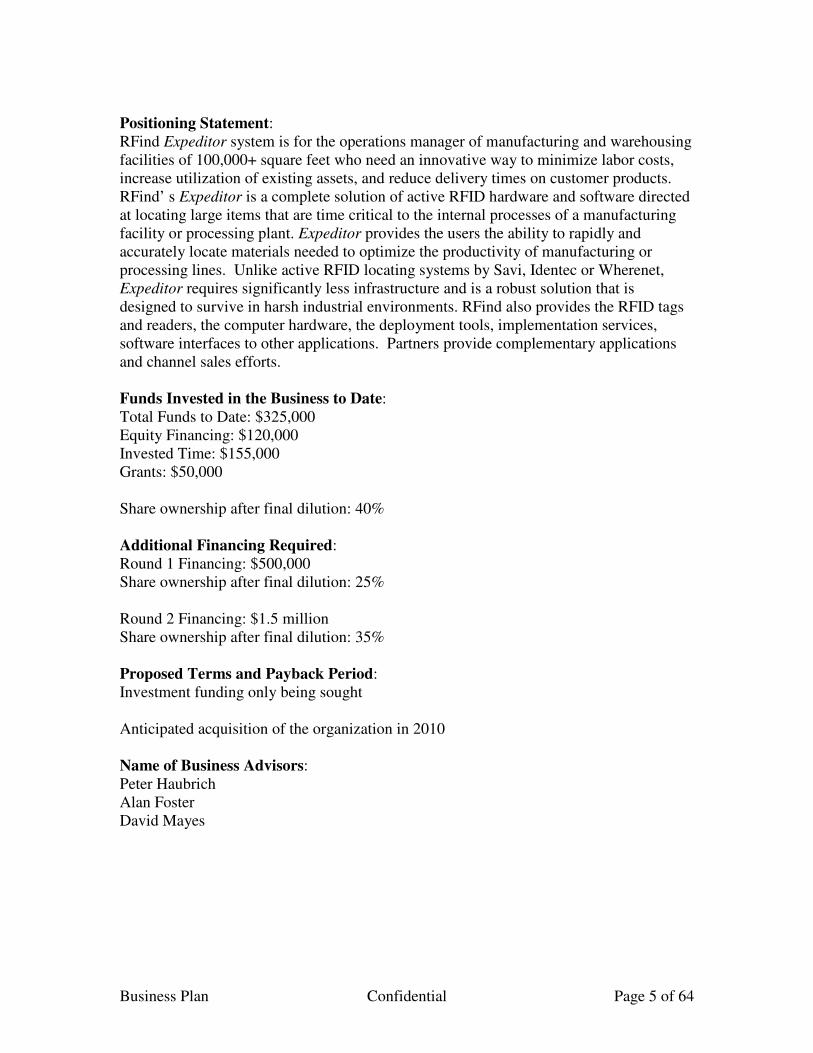
Positioning Statement: RFind Expeditor system is for the operations manager of manufacturing and warehousing facilities of 100,000+ square feet who need an innovative way to minimize labor costs, increase utilization of existing assets, and reduce delivery times on customer products. RFind’ s Expeditor is a complete solution of active RFID hardware and software directed at locating large items that are time critical to the internal processes of a manufacturing facility or processing plant. Expeditor provides the users the ability to rapidly and accurately locate materials needed to optimize the productivity of manufacturing or processing lines. Unlike active RFID locating systems by Savi, Identec or Wherenet, Expeditor requires significantly less infrastructure and is a robust solution that is designed to survive in harsh industrial environments. RFind also provides the RFID tags and readers, the computer hardware, the deployment tools, implementation services, software interfaces to other applications. Partners provide complementary applications and channel sales efforts. Funds Invested in the Business to Date: Total Funds to Date: $325,000 Equity Financing: $120,000 Invested Time: $155,000 Grants: $50,000 Share ownership after final dilution: 40% Additional Financing Required: Round 1 Financing: $500,000 Share ownership after final dilution: 25% Round 2 Financing: $1.5 million Share ownership after final dilution: 35% Proposed Terms and Payback Period: Investment funding only being sought Anticipated acquisition of the organization in 2010 Name of Business Advisors: Peter Haubrich Alan Foster David Mayes

Business Plan Confidential Page 6 of 64
3 The RFind System
3.1 The Need
The primary objective of any manufacturing facility is to produce the highest quality product at the fastest rate possible with the least amount of expense. Achieving this objective involves many things happening at precise moments in time:
• Tools, dies, special containers, and other specific items must be at a particular work station when needed,
• All the raw materials (ranging from bulk metal to finished components) must be at a particular work station when needed,
• Empty containers at work stations need cleared as soon as they are emptied to provide room for people to work,
• Empty containers need refilled and readied for movement into a work station,
• Assembled items need painted, tested, repaired (if needed), labeled, and put through various finishing processes before they are ready to ship,
• Finished goods need stored while awaiting shipment,
• Finished goods need located and shipped on schedule to meet the customer needs. Achieving these events depends on answering one simple question:
“WHERE?” Manufacturing organizations employ many techniques to answer this question including:
• Running additional shifts or extra assembly lines to make up for lost time when required items were not always available,
• Carrying extra inventory of raw materials and components,
• Hiring additional employees tasked with continuously touring facilities and locating items,
• Purchasing more units than necessary of tools, reusable containers, …,
• Paying out penalty charges for late deliveries,
• And many others.1 For a manufacturing organization, the cost of failing to quickly and accurately answer the question “Where?” is seen in:
• Decreased revenue stream,
• Increased warranty costs,
• Increased process costs,
• Increased expenditures, and;
• Increased asset base.
1 See RFind’s Business Cases in Appendix A for examples of these scenarios.
Business Plan Confidential Page 7 of 64
3.2 RFind’s Solution
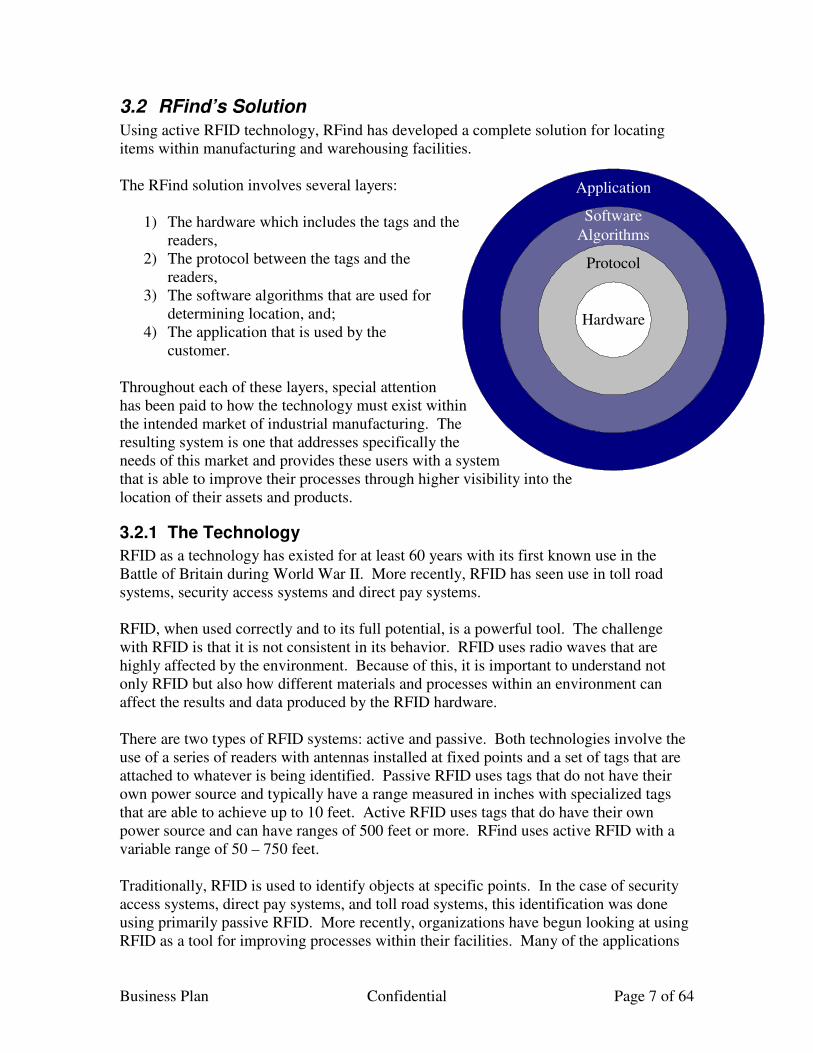
Using active RFID technology, RFind has developed a complete solution for locating items within manufacturing and warehousing facilities. The RFind solution involves several layers:
1) The hardware which includes the tags and the readers,
2) The protocol between the tags and the readers,
3) The software algorithms that are used for determining location, and;
4) The application that is used by the customer.
Throughout each of these layers, special attention has been paid to how the technology must exist within the intended market of industrial manufacturing. The resulting system is one that addresses specifically the needs of this market and provides these users with a system that is able to improve their processes through higher visibility into the location of their assets and products.
3.2.1 The Technology
RFID as a technology has existed for at least 60 years with its first known use in the Battle of Britain during World War II. More recently, RFID has seen use in toll road systems, security access systems and direct pay systems. RFID, when used correctly and to its full potential, is a powerful tool. The challenge with RFID is that it is not consistent in its behavior. RFID uses radio waves that are highly affected by the environment. Because of this, it is important to understand not only RFID but also how different materials and processes within an environment can affect the results and data produced by the RFID hardware. There are two types of RFID systems: active and passive. Both technologies involve the use of a series of readers with antennas installed at fixed points and a set of tags that are attached to whatever is being identified. Passive RFID uses tags that do not have their own power source and typically have a range measured in inches with specialized tags that are able to achieve up to 10 feet. Active RFID uses tags that do have their own power source and can have ranges of 500 feet or more. RFind uses active RFID with a variable range of 50 – 750 feet. Traditionally, RFID is used to identify objects at specific points. In the case of security access systems, direct pay systems, and toll road systems, this identification was done using primarily passive RFID. More recently, organizations have begun looking at using RFID as a tool for improving processes within their facilities. Many of the applications
Hardware
Protocol
Software
Algorithms
Application
Business Plan Confidential Page 8 of 64
that organizations are looking to implement involve the use of RFID technology to locate items within their facilities. In order to locate items within an industrial manufacturing facility, it is necessary to change from the passive RFID technology with limited range to the active RFID technology. The challenges for any wireless communications within industrial manufacturing facilities are:
1) The harshness of the environment in terms of the amount of abusive treatment that any equipment will need to tolerate. Contaminants, shock, vibration, temperature extremes, and chemical exposures all have the ability to negatively impact the survivability of the packaging of any equipment.
2) The high concentration of metal in an industrial manufacturing facility will cause serious multi-path communications problems for all wireless devices. Many of the devices in use within high metal environments cannot overcome these multi-path issues.
3) The constant changes that are made to manufacturing facilities make it challenging for a system to achieve any degree of stability in the environment.
3.2.2 The Hardware
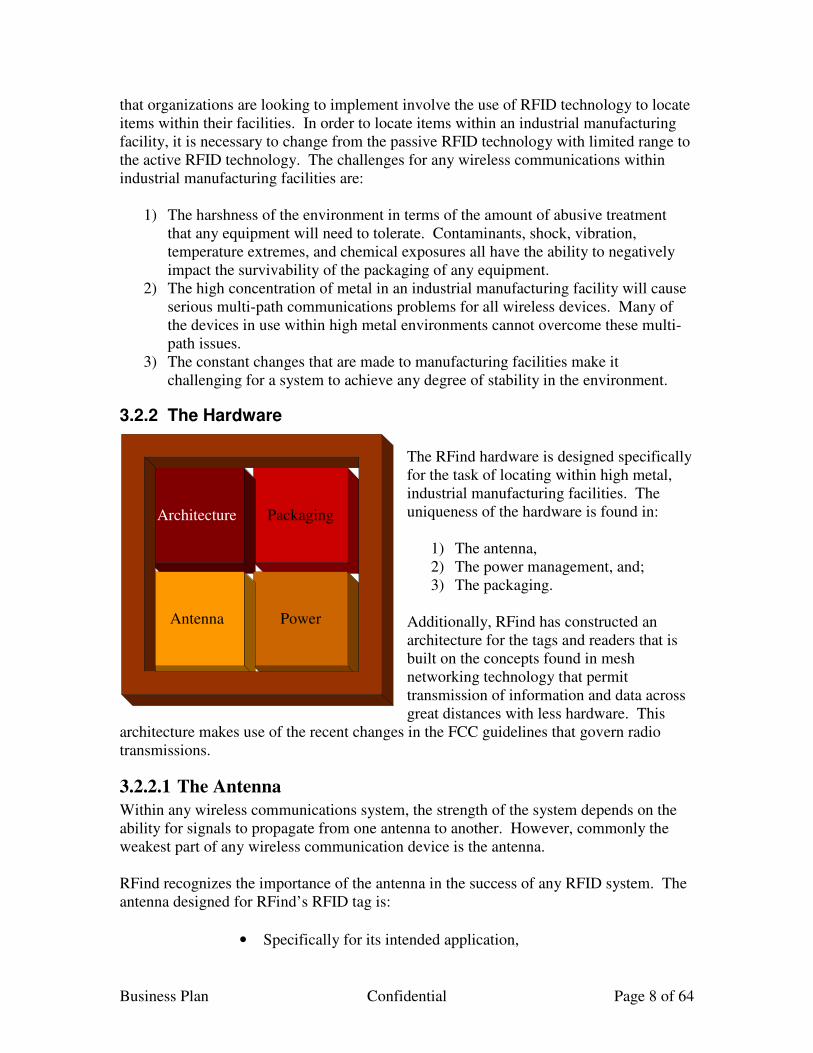
The RFind hardware is designed specifically for the task of locating within high metal, industrial manufacturing facilities. The uniqueness of the hardware is found in:
1) The antenna, 2) The power management, and; 3) The packaging.
Additionally, RFind has constructed an architecture for the tags and readers that is built on the concepts found in mesh networking technology that permit transmission of information and data across great distances with less hardware. This
architecture makes use of the recent changes in the FCC guidelines that govern radio transmissions.
3.2.2.1 The Antenna
Within any wireless communications system, the strength of the system depends on the ability for signals to propagate from one antenna to another. However, commonly the weakest part of any wireless communication device is the antenna. RFind recognizes the importance of the antenna in the success of any RFID system. The antenna designed for RFind’s RFID tag is:
• Specifically for its intended application,
PackagingArchitecture
PowerAntenna
Business Plan Confidential Page 9 of 64
• Small, compact design,
• High gain,
• Orientation independent,
• Designed for manufacturability, and;
• Low production cost.
3.2.2.2 Power Management
The struggle for all active RFID tag manufacturers is how to maximize system performance and maintain consistent results while operating from a battery with a fixed lifetime. RFind understands the challenges and tradeoffs that can be made to optimize the system performance in light of this constantly changing parameter. In this industry, bigger is not always better. The size of the battery has a direct correlation on the size of the finished product. As customers demand smaller RFID tags, RFind must respond with a compact product that will still deliver a long lifetime. RFind is working on numerous mechanisms that will provide substantial power saving techniques. Where traditional locating systems provide 5-7 years of operation on a single battery, RFind has incorporated several features that will result in over 9 years of operation from a single battery of the same size.
3.2.2.3 Packaging
The major challenge facing RFID companies in industry is building a tag with a packaging option that will withstand the environment of a manufacturing facility. There are three distinct points to address for the survivability of any packaging solution:
• Moisture tight,
• Component protection against high vibrations, and;
• Protection against numerous drops. In addition to these points, manufacturability must be considered as well as operation at temperature extremes. RFind has worked with leaders in the field of packaging and have explored numerous alternative packaging designs. Building on this knowledge, RFind is working to select material, shape, and manufacturing methodologies that are sound and cost effective.
3.2.2.4 Architecture
RFind has developed a new architecture for RFID communications based on the concepts found in mesh networking. This architecture dramatically changes the way that tags and readers communicate with one another. The most notable effect of this architecture is increased stability in locating within high metal environments. This new architecture is one of the foundation components of RFind’s unique intellectual property. This architecture is based on a fully patentable process and will be patented by

Business Plan Confidential Page 10 of 64
RFind. As a new process for communications, this architecture is applicable not only to the realm of RFID but to all wireless communications. The consequences of this new architecture are significant with respect to the implementation of RFID systems. In a traditional RFID system where the goal is to locate objects within a 100,000 square foot building, the cost of the setup and configuration of the physical hardware for the system would be approximately $100,000 and would take two weeks or more to install and configure. Using RFind’s new architecture and the same objectives, the cost of the setup and configuration of the physical hardware will be approximately $25,000 and take only a few days to install and configure.
Hardware Costs Accurate to
Traditional RFID $ 100,000 50 feet
RFind's Architecture $ 25,000 20 feet Figure 2: Comparison of the cost and resolution of traditional RFID and RFind’s architecture
As seen in figure 2, the RFind system not only provides for a much lower cost to the implementation of RFID but it also provides for more accurate locating within its system. The cost to increase the accuracy in a traditional system is approximately 50 - 100 times that of increasing the resolution in an RFind system. Additionally, because RFind’s solution requires a dramatically lower amount of hardware within the implementation, the cost of supporting this system is significantly lower.
3.2.3 The Protocol
Between the tags and the readers exists a simple communications protocol designed to ensure the highest transmission rates without compromising the reliability of the signal. Within this protocol, there exists a sophisticated anti-collision algorithm that makes up a second key component of RFind’s intellectual property. This anti-collision algorithm ensures that there is a minimal amount of disturbance in the radio communications and that each radio within the system is provided with the highest opportunity to successfully transmit its data. The anti-collision algorithm is a process used by each of the radios in the RFind system and will be part of the patented intellectual property of RFind.
3.2.4 The Software Algorithms
Many of the active RFID systems today deliver to the customer a set of hardware and some form of interface for the customer or a third party to develop applications specific to the customer. RFind recognizes that the success rate for organizations that seek to develop RFID applications without experience in this area is very low. To increase success, RFind offers customers several entry points into the system that occur at different system levels. The first point of entry is similar to that of many RFID systems in the market today.

Business Plan Confidential Page 11 of 64
The second point of entry allows customers to make use of the sophisticated locating algorithm and be provided with data that has already undergone filtering but not yet put into an application interface for use. The third point of entry is the user interface. This interface is provided to the customer through a web browser and accessed by any system with web capability including: desktop systems, laptop systems, and hand held computing devices. It is RFind’s intent to have the majority of users enter the system at this third entry point.
Key to the success of RFind’s system is its ability to accurately identify the position of the tags within the system. This task is accomplished at the database level. All of the raw data from the RFID system is fed into the RFind database where it is evaluated and a determination of the location of each specific tag is made. The algorithm used to determine location was developed based on the experiences of RFind’s technical group with RF transmissions in similar environments. The algorithm takes into account the accuracy of the data being received and the level of accuracy required by the user. It is a variable algorithm that has a very high tolerance for incomplete data and data that contains elements that are outright inaccurate. This algorithm is another key component of the patentable intellectual property of RFind.
3.2.5 The Application
The RFind application is based on the need of customers to locate assets and products within their facilities. It contains interfaces to support the association of tags to assets and products and to identify on a visual map, the location of those items within the facilities. The RFind application is set up by users through a wizard that asks them to:
1) Describe their environment – the size of the facility, the location of fixed structures, the location of variable structures, the location of key stations or areas where assets move, behavior of mobile equipment, and other variables that are understood by the customer,
2) Describe the assets that they are interested in locating and monitoring – what type of asset is of interest, what its expected travel pattern is within the manufacturing process, and what boundaries exist with respect to the assets’ movement,
3) Describe what action to take when assets are not moving through the process as described – who should be notified, how should notification be made, what type of follow-up is required, and when to escalate the notification, and;
4) Describe where and how to store information about the location of assets – what level of resolution is required, what type of data to store, where to store or transmit data, and what mechanisms should be used to store or transmit data.
Application
Database
(Locating)
Hardware
Point 2
Point 1
Point 3
RFind’s Points of Entry
Business Plan Confidential Page 12 of 64
Through this description, customers will be able to affect the behavior of their system without the need to understand RFID or how it works.
3.3 Intellectual Property
Within the RFind system there is a very key piece of intellectual property surrounding the unique method used to locate the asset tags within the system. This intellectual property will be protected by a patent. The process of applying for this patent has been started and RFind expects to have the provisional patent in place by the end of February.
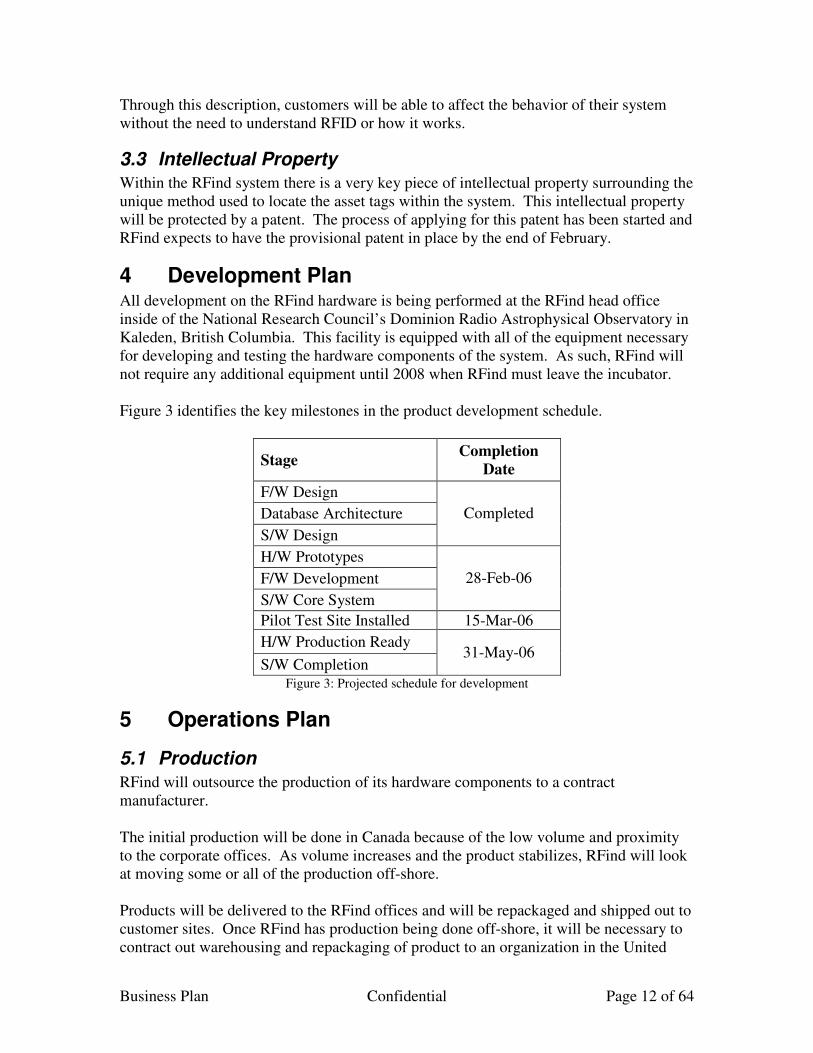
4 Development Plan All development on the RFind hardware is being performed at the RFind head office inside of the National Research Council’s Dominion Radio Astrophysical Observatory in Kaleden, British Columbia. This facility is equipped with all of the equipment necessary for developing and testing the hardware components of the system. As such, RFind will not require any additional equipment until 2008 when RFind must leave the incubator. Figure 3 identifies the key milestones in the product development schedule.
Stage Completion
Date
F/W Design
Database Architecture
S/W Design
Completed
H/W Prototypes
F/W Development
S/W Core System
28-Feb-06
Pilot Test Site Installed 15-Mar-06
H/W Production Ready
S/W Completion 31-May-06
Figure 3: Projected schedule for development
5 Operations Plan
5.1 Production
RFind will outsource the production of its hardware components to a contract manufacturer. The initial production will be done in Canada because of the low volume and proximity to the corporate offices. As volume increases and the product stabilizes, RFind will look at moving some or all of the production off-shore. Products will be delivered to the RFind offices and will be repackaged and shipped out to customer sites. Once RFind has production being done off-shore, it will be necessary to contract out warehousing and repackaging of product to an organization in the United

Business Plan Confidential Page 13 of 64
States so that part of the shipments can be directly delivered into the US. This will reduce the amount of shipping and brokerage charges that are incurred by either RFind or the customer.
5.2 Implementation
RFind will dispatch a configuration team that will be responsible for the installation of the equipment at the customer’s site. This service will be billed to the customer as a paid service. The configuration team will consist of a project manager and a technician who is able to install and configure the equipment and a trainer who can work with the customer to ensure that they are fully versed on the care and use of the system. For the first three sites, the configuration team will be made up of existing RFind employees. This is so that the technical team can carefully observe the behavior of the equipment as it is installed and configured.
6 Market Analysis
6.1 Markets and Segments
The RFID market is a very promising one that is expected to undergo significant growth in the next few years.
“Allied Business Intelligence, a research firm based in Syosset, New York, projects spending in the global RFID market will grow to more than $3.1 billion by 2008, from about $1.3 billion this year 2003.” – RFID Journal,
July 18, 2003. “The market for RFID software, hardware and services will reach $2,195m in 2005, making for a growth rate of 68% over a market in 2004 reckoned to be worth $1,306m. Revenues from the manufacturing industry were said to be more than all other verticals combined in 2004, and still double any other by 2010 according to market researchers at Datamonitor, ComputerWires parent company, who estimate that by 2010 the global RFID market will top $6,138m.” – ComputerWire Staff, June 23, 2005. “The global radio frequency identification (RFID) market may hit US$30bil by 2010, driven by the new wave of Internet technology in changing the retail industry, said Cisco Systems Inc senior vice-president Howard Charney. In his keynote address at Cisco’s Showcase 2006 yesterday, Charney quoted industry analysts' prediction that almost 7 billion RFID tags per year would be used to track consumer goods with another 15 billion a year for the shipping and manufacturing industries in three years.” – The Star Online, January 19, 2006.
The market for RFID is growing rapidly with expectations of the potential size of the market ranging from the above stated $3.1 billion USD by 2008 to more than $30 billion

Business Plan Confidential Page 14 of 64
USD by 2010 depending on the study. Of this, approximately one-third of the market is in Europe, one-third in North America, and one-third throughout the rest of the world. Within this market are two types of RFID: passive and active. At this time, there is little distinction made between the sizes of each of these markets but a conservative guideline is that the active RFID market comprises approximately 25% of the total RFID market. The RFID market is segmented by many researchers in several ways. Figure 4 shows the segmentation based on the Juniper Research report for the European market.
Anticipated RFID Market Segmentation for 2009
Supply Chain
30%
Retail
17%Pharmaceuticals
21%
Mass
Transportation
20%
Other
12% Supply Chain
Retail
Pharmaceuticals
Mass Transportation
Other
Figure 4: Juniper Research estimations on RFID market segmentation for 2009
Although these numbers are based on a European study, they are supported by the Allied Business Intelligence (ABI) study that combines supply chain and retail into the general segment of supply chain:
“ABI projects revenue from RFID implementations geared towards asset and supply chain management will grow to 48 percent of the market, from 20 percent today. Initial spending will be focused on systems designed to track containers for supply chain management, but Rerisi expects to see more in-store trials of RFID technologies in the coming year.” – RFID Journal,
July 18, 2003 RFind will be pursuing the supply chain as its target market. Within this segment of the market, we will be specifically targeting the manufacturing and assembly processes. The key purchasing criteria for potential customers are:
1) Functionality – The primary concern for customers is whether the system is able to tell them where the asset is located quickly, accurately, and in a format that is able to be understood.
2) Cost – Customers have limited access to spending using capital budgets and they need to ensure that the return on investment (ROI) can be justified.
Business Plan Confidential Page 15 of 64
3) Experience and Knowledge – Customers are interested in having their problems solved. They are looking to RFID providers to be the experts in the field and provide them with complete solutions so that they do not need to build a knowledge base around RFID. This will enable them to focus on their core competencies.
6.2 Special Initiatives
In the past few years, there have been two key initiatives in the RFID industry that are expected to drive the adoption rate of RFID. Although both of these initiatives are specifically directed at the passive part of the RFID market, they have long reaching ramifications for the active RFID market for several reasons:
1) As initiatives are brought into place that raise awareness of RFID technology, customers will begin to look deeper into what can be done by the technology as a whole in solving business problems,
2) Many of the initiatives being presented are requiring extensive testing of the passive RFID technology and are helping to define the limits of its capability which in turn defines the role of active RFID and where it lies in the overall picture, and;
3) The on-going testing of RFID in multiple environments is paramount to understanding the operating environments and new technology is being developed that can be used by both passive and active RFID industries in overcoming the environmental challenges.
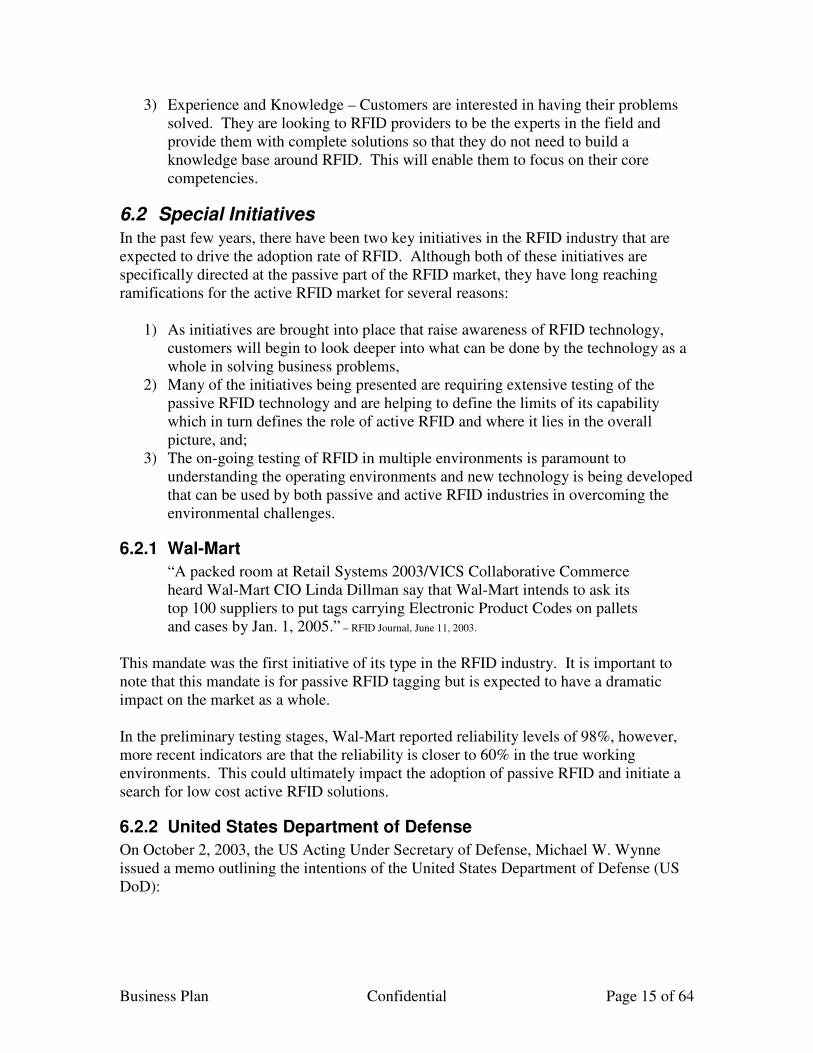
6.2.1 Wal-Mart
“A packed room at Retail Systems 2003/VICS Collaborative Commerce heard Wal-Mart CIO Linda Dillman say that Wal-Mart intends to ask its top 100 suppliers to put tags carrying Electronic Product Codes on pallets and cases by Jan. 1, 2005.” – RFID Journal, June 11, 2003.
This mandate was the first initiative of its type in the RFID industry. It is important to note that this mandate is for passive RFID tagging but is expected to have a dramatic impact on the market as a whole. In the preliminary testing stages, Wal-Mart reported reliability levels of 98%, however, more recent indicators are that the reliability is closer to 60% in the true working environments. This could ultimately impact the adoption of passive RFID and initiate a search for low cost active RFID solutions.
6.2.2 United States Department of Defense
On October 2, 2003, the US Acting Under Secretary of Defense, Michael W. Wynne issued a memo outlining the intentions of the United States Department of Defense (US DoD):

Business Plan Confidential Page 16 of 64
“Our policy will require suppliers to put passive RFID tags on lowest possible piece part/case/pallet packaging by January 2005.” – RFID Journal,
October 3, 2003
This policy is meant to compliment the existing mandate which:
“…directs the military to track all shipments with active (battery-powered) tags. The military has been requiring all freight containers shipped to Afghanistan and the Gulf to have active tags. The new policy expands active RFID tracking to all sustainment cargo, unit movement equipment and cargo, ammunition shipments and pre-positioned materiel and supplies.” – RFID Journal, October 3, 2003
Currently SAVI Technology is the preferred vendor of the US DoD, however all RFID manufacturers are encouraged by the US DoD to submit proposals to their suppliers and have encouraged suppliers to find the right technology for their needs. It is expected that this will further drive the development of low cost active RFID solutions. Although the date of January 2005 has come and gone, compliance with this mandate has not yet been met for several reasons. It is expected that the US DoD will be extending this deadline by several years.
6.3 Standards and Regulations
When a new technology is introduced, the pioneers and early adopters are the first users of the technology. Progress past the early adopter is not achieved in most cases until the technology has been standardized. Examples of this are the 802.11b standard which brought WLAN technology to the mass market and similar standards for VHS, CD, DVD, and HDTV. Following standardization, each of these technologies experienced explosive growth. The RFID industry is governed by several regulatory bodies. RFind will be focusing its effort on meeting the needs of the North American market and will therefore be concerned with two sets of governing bodies:
1) Federal Communications Commission (FCC) & Industry Canada – These bodies are responsible for determining what radio frequency can be used and what power level is to be permitted and under what conditions.
2) Standard Committees – These bodies have been working closely together in recent years to establish a set of standards for the RFID industry. Up to now, they have focused the bulk of their efforts on the standardization of the passive RFID industry and in October of 2004 ratified a standard known as the EPC Global - Gen 2 specification for this part of the industry. This is the third specification (Gen 0 and Gen 1 were the predecessors) aimed at providing a standard set of guidelines that will permit transparency between the tags and readers in the industry. This was significant because it laid the groundwork for all tags to be able to communicate with any reader as long as both are Gen 2 compliant. This is the necessary step to applications like the Wal-Mart initiative (described below)

Business Plan Confidential Page 17 of 64
to be successful. There are several standards committees which could potentially affect RFind and its business:
o IEEE – Institute of Electrical & Electronic Engineers o ANSI – American National Standards Institute o ISO – International Standards Organization o EPC Global – Electronic Products Code
EPC Global and the other regulatory bodies are expected to turn their efforts to the active RFID industry in the near future and begin work on standards for that portion of the industry. It is expected that these efforts will be focused on the radio frequency of the tag communications globally and on the data that is provided by the reader to the back-end systems. When these bodies begin working on the standards for active RFID, RFind will have representatives on the committees who will be able to support our interests in these standards.
6.4 Competitors
There are several companies that are currently working to deliver RFID solutions to the marketplace. Of these, many are focusing their efforts on either delivering hardware or integration services. There are a small number of organizations that have recognized the need to deliver complete solutions that are targeted at solving specific problems. Because of this, the competition for RFind is broken down into three categories:
1) Direct – Includes all organizations that provide complete systems into the manufacturing sector.
2) Indirect – Includes all RFID manufacturers who sell hardware with limited software interfacing and organizations that provide complete systems into non-manufacturing sectors.
3) Secondary – Includes organizations that are providing non-RFID solutions into the manufacturing sector.
To date, there have been no organizations that qualify as direct competitors to RFind however there are several indirect competitors who may become direct competitors and warrant careful attention. These include all of the organizations listed in figure 5.

Busi
nes
s P
lan
Confi
den
tial
Pag
e 18 o
f 64
Co
mp
an
y
Typ
e M
ark
et
Sec
tor
Targ
et
Mark
et
Key
A
ccou
nts
M
ark
et
Aw
are
nes
s P
rici
ng (
US
D)
Siz
e (U
SD
)
Ax
cess
S
olu
tion
Acc
ess
Contr
ol
Gover
nm
ent
Avia
tion
Hom
elan
d
Sec
uri
ty
JFK
Air
port
M
ediu
m
Tag
s -
$10
Q1 0
5 -
$241K
ID S
yst
ems
Solu
tion
Supply
Ch
ain
Fork
truck
M
anag
emen
t
Med
ium
T
ags
$1400
2004 ~
$16 m
illi
on
IDE
NT
EC
S
OL
UT
ION
S
Ven
dor
Supply
Ch
ain
Man
ufa
cturi
ng
Cat
erpil
lar
Gen
eral
E
lect
ric
Volk
swag
en
Hig
h
Tag
s $20 -
70
Rea
der
s $1400 -
4300
S/W
$5000+
40 e
mplo
yee
s 2004 ~
$4 m
illi
on
RF
Code
Ven
dor
Supply
Ch
ain
Mil
itar
y
Hea
lthca
re
Avia
tion
US
DoD
H
igh
Tag
s $20 -
31
Rea
der
s $2700 -
4000
S/W
$5000 -
10K
Sav
i S
olu
tion
Supply
Ch
ain
Gover
nm
ent
Mil
itar
y
Port
Auth
ori
ty
US
DoD
H
igh
Tag
s $20 -
130
Rea
der
s $1000 -
2500
S/W
$10K
- $
500K
2004 >
$100 m
illi
on
Tra
nsc
ore
S
olu
tion
Mas
s T
ransp
ort
atio
n
Toll
Road
s H
om
elan
d
Sec
uri
ty
EZ
Pas
s P
&O
Port
s H
yund
ai
Tra
iler
s
Hig
h
Unav
aila
ble
>
1800 e
mplo
yee
s 2004 >
$300 m
illi
on
Wher
eNet
S
olu
tion
Supply
Ch
ain
Auto
moti
ve
Gover
nm
ent
Port
Sec
uri
ty
BM
W
Ford
G
ener
al
Moto
rs
US
Arm
y
NY
K
Lo
gis
tics
Hig
h
Tag
s $70 -
260
Rea
der
s $2800 -
3700
S/W
$52K
- $
210K
2004 ~
$5 m
illi
on
Fig
ure
5:
Ind
irec
t co
mp
etit
ors
wit
h p
ote
nti
al f
or
bec
om
ing d
irec
t co
mp
etit
ors
Business Plan Confidential Page 19 of 64
7 Competitive Business Strategy RFind Systems will gain its competitive advantage in the market place through three key elements:
1) Integration – RFind will provide a complete solution that addresses the needs of customers to be able to integrate the RFID system into their existing systems, and;
2) Cost – RFind’s unique architecture will significantly reduce the cost of the infrastructure required to implement its RFID system.
3) Licensing – RFind will sell its solution to its customers through a licensing mechanism that will permit organizations to engage in RFID with a monthly fee being paid to RFind.
7.1 Integration
RFID is a very promising technology for many organizations. The problem that many organizations have with using this technology is that it does not easily integrate into any of their existing systems. There are two reasons for this:
1) RFID manufacturers typically develop their products from a hardware perspective and feel that it is up to the software organizations to deal with the integration, and;
2) Many software organizations that are trying to integrate RFID into back-end systems lack the experience with RFID and therefore do not have the knowledgebase for addressing the type of data that is produced by RFID hardware.
A lot of the RFID technology on the market today is very complicated from a hardware standpoint because the designers have attempted to add a lot of extra features into the actual hardware for memory storage, sensor detection, data logging, and other advanced activities. Although available, most implementations of RFID do not make use of any of these features. RFind is proposing to develop a complete RFID system from the perspective of the integration of the data into the back-end systems. By changing the perspective to one that is software driven, RFind will be able to address the needs of the customer with a total system that is designed specifically to work with existing business systems. The hardware that we are proposing for our system will be a substantially stripped down version of what is available in the market today and will utilize newer technologies that will permit longer range with higher reliability. The result will be a significantly lower cost to manufacture the hardware with a substantially higher usability of the overall system.
7.2 Cost
The cost of a traditional RFID systems start at $20,000 for the hardware alone. Because RFID vendors sell the hardware to the customer, this total cost ends up being part of the capital budgets of the customer. These are limited budgets that are often set at the beginning of every fiscal year.
Business Plan Confidential Page 20 of 64
The architecture used by RFind will permit the organization to deploy systems with costs ranging from 20 – 30% of the cost of traditional systems.
7.3 Licensing
RFind is proposing to further counteract cost concerns by offering a monthly licensing fee for the RFID infrastructure. The use of licensing fees in the realm of software is not a new idea and has had a lot of success for organizations trying to break down the cost barrier. This model provides several advantages:
1) The costs for the system are removed from a capital budget and placed into operating budgets which provides a higher level of flexibility and accessibility to decision makers at all levels of an organization,
2) RFind will be able to recover all hardware and installation costs within the first nine months of a deployment and will have a perpetual profit stream thereafter, and;
3) There will be an ability to demonstrate an immediate return on investment to customers as opposed to several years out after the cost of the hardware has been amortized.
In cases where customers want to purchase the equipment, RFind will be able to offer the system to customers at a substantially lower price than that of the competitors without compromising margins. This is because the architecture of the system is dramatically simplified compared to other RFID systems on the market.
8 Marketing Plan
8.1 Pricing
The pricing strategy that RFind will be using is directed at overcoming the objection of customers to the high capital costs associated with the deployment of RFID systems. RFind has implemented a pricing structure for our customers based on the licensing structure used by many software organizations. Using this model, RFind charges customers a monthly licensing fee that is based on the size of their coverage area rounded to the next highest unit of 10,000 sf. The rate that is charged to customers is $175 per 10,000 sf per month. Customers are still required to purchase their tags that are to be attached to objects being located. This pricing model provides customers with the ability to implement RFID in their facilities using a more flexible operating budget and provides RFind with a continuous revenue stream. Alternatively, customers may elect to purchase the hardware that is installed in their facilities. The rate for the actual hardware components will be comparable to the current market rates of the top competitors. A comparison of tag and reader pricing for the leading RFID organizations is shown in figure 6.

Business Plan Confidential Page 21 of 64
Price Comparisons
Organization Tags Readers
RFind Systems $ 45.00 $ 2,500
Identec Solutions $ 56.00 $ 4,200
RF Code $ 20.00 $ 3,400
Savi $ 45.00 $ 3,500
WhereNet $ 125.00 $ 3,000 Figure 6: Price comparisons for tags and readers for leading RFID organizations
When comparing the cost of a full system, it is necessary to look at the implementation requirements for each organization separately. Appendix A includes the price comparisons for three business cases.
8.2 Promotion and Advertising
RFind will approach the marketplace through a two step approach.
8.2.1 Step 1a: The Local Market
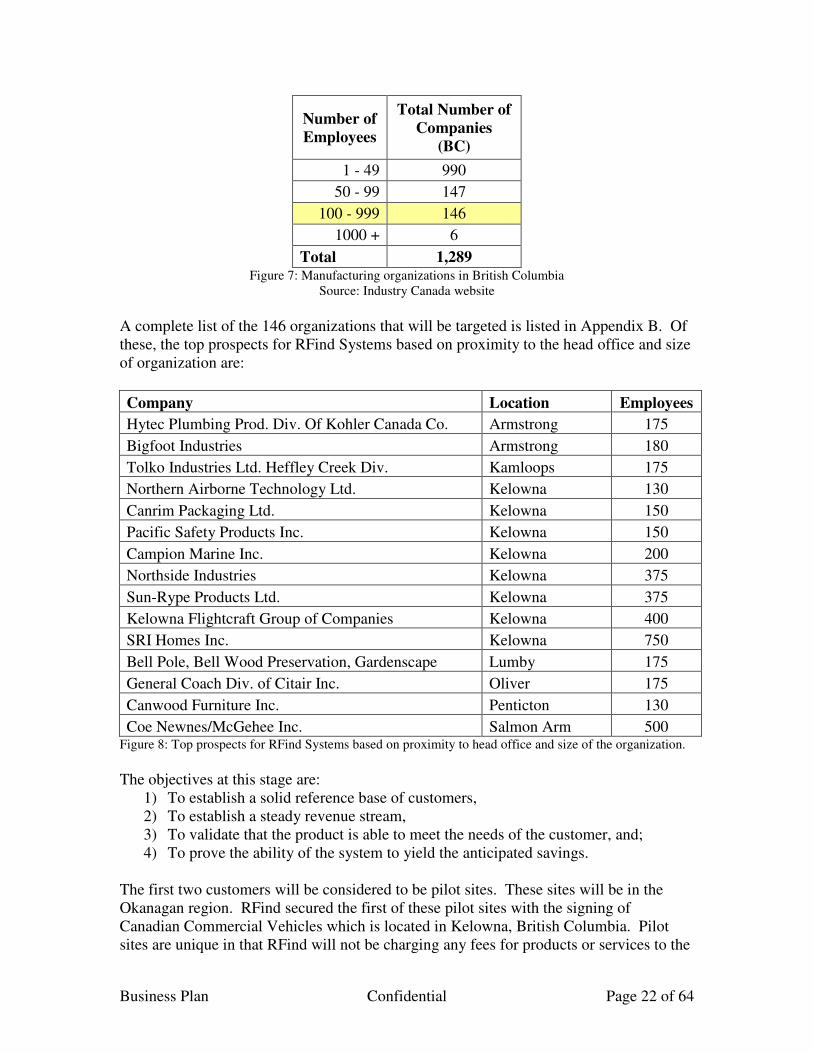
In the first few months, RFind will seek to establish a customer base with organizations that are in close proximity to the head office. The goal is to establish three customers in this local market by the end of 2006. RFind will directly approach the manufacturing organizations in British Columbia. This market is easily accessible and can be supported at a lower cost to RFind. RFind will specifically target the manufacturing organizations with 100 – 1000 employees who have facilities of at least 100,000 square feet. According to Industry Canada records, there are currently 146 organizations that will meet this criterion as indicated in figure 7.
Business Plan Confidential Page 22 of 64
Number of Employees
Total Number of Companies
(BC)
1 - 49 990
50 - 99 147
100 - 999 146
1000 + 6
Total 1,289 Figure 7: Manufacturing organizations in British Columbia
Source: Industry Canada website
A complete list of the 146 organizations that will be targeted is listed in Appendix B. Of these, the top prospects for RFind Systems based on proximity to the head office and size of organization are:
Company Location Employees
Hytec Plumbing Prod. Div. Of Kohler Canada Co. Armstrong 175
Bigfoot Industries Armstrong 180
Tolko Industries Ltd. Heffley Creek Div. Kamloops 175
Northern Airborne Technology Ltd. Kelowna 130
Canrim Packaging Ltd. Kelowna 150
Pacific Safety Products Inc. Kelowna 150
Campion Marine Inc. Kelowna 200
Northside Industries Kelowna 375
Sun-Rype Products Ltd. Kelowna 375
Kelowna Flightcraft Group of Companies Kelowna 400
SRI Homes Inc. Kelowna 750
Bell Pole, Bell Wood Preservation, Gardenscape Lumby 175
General Coach Div. of Citair Inc. Oliver 175
Canwood Furniture Inc. Penticton 130
Coe Newnes/McGehee Inc. Salmon Arm 500 Figure 8: Top prospects for RFind Systems based on proximity to head office and size of the organization.
The objectives at this stage are:
1) To establish a solid reference base of customers, 2) To establish a steady revenue stream, 3) To validate that the product is able to meet the needs of the customer, and; 4) To prove the ability of the system to yield the anticipated savings.
The first two customers will be considered to be pilot sites. These sites will be in the Okanagan region. RFind secured the first of these pilot sites with the signing of Canadian Commercial Vehicles which is located in Kelowna, British Columbia. Pilot sites are unique in that RFind will not be charging any fees for products or services to the
Business Plan Confidential Page 23 of 64
organizations that participate until completion of the pilot testing which will last approximately 6 months.
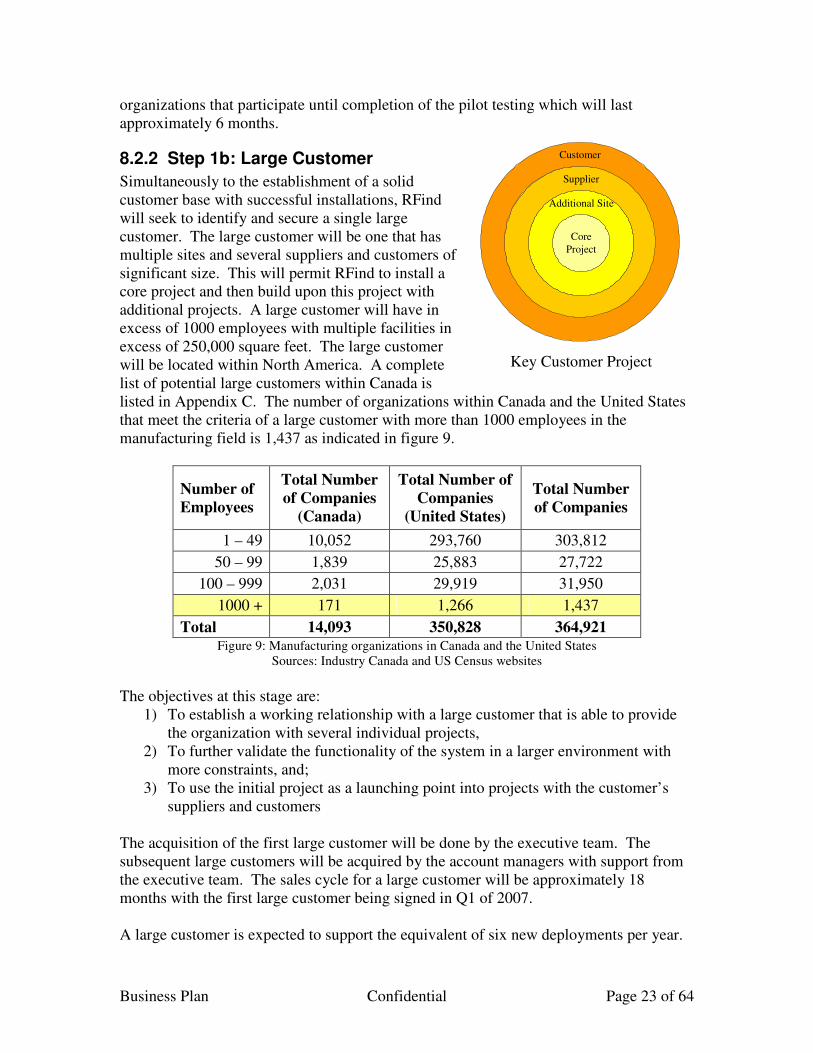
8.2.2 Step 1b: Large Customer
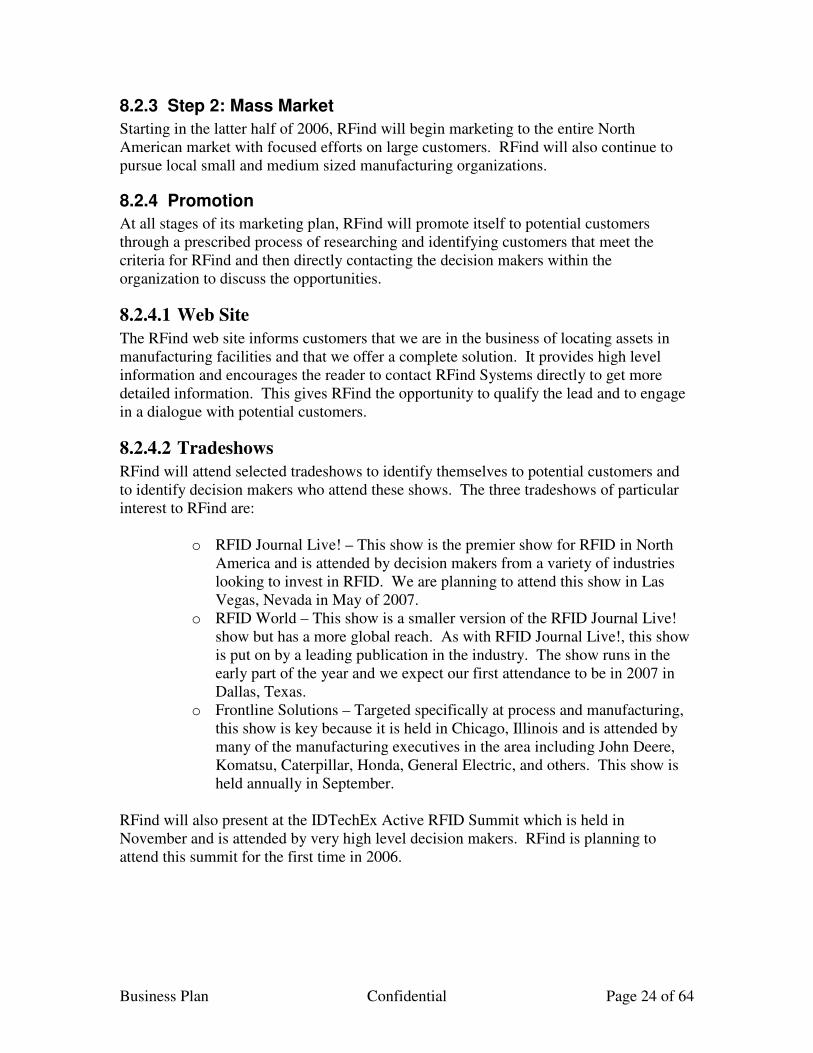
Simultaneously to the establishment of a solid customer base with successful installations, RFind will seek to identify and secure a single large customer. The large customer will be one that has multiple sites and several suppliers and customers of significant size. This will permit RFind to install a core project and then build upon this project with additional projects. A large customer will have in excess of 1000 employees with multiple facilities in excess of 250,000 square feet. The large customer will be located within North America. A complete list of potential large customers within Canada is listed in Appendix C. The number of organizations within Canada and the United States that meet the criteria of a large customer with more than 1000 employees in the manufacturing field is 1,437 as indicated in figure 9.
Number of Employees
Total Number of Companies
(Canada)
Total Number of Companies
(United States)
Total Number of Companies
1 – 49 10,052 293,760 303,812
50 – 99 1,839 25,883 27,722
100 – 999 2,031 29,919 31,950
1000 + 171 1,266 1,437
Total 14,093 350,828 364,921 Figure 9: Manufacturing organizations in Canada and the United States
Sources: Industry Canada and US Census websites The objectives at this stage are:
1) To establish a working relationship with a large customer that is able to provide the organization with several individual projects,
2) To further validate the functionality of the system in a larger environment with more constraints, and;
3) To use the initial project as a launching point into projects with the customer’s suppliers and customers
The acquisition of the first large customer will be done by the executive team. The subsequent large customers will be acquired by the account managers with support from the executive team. The sales cycle for a large customer will be approximately 18 months with the first large customer being signed in Q1 of 2007. A large customer is expected to support the equivalent of six new deployments per year.
Core
Project
Additional Site
Supplier
Customer
Key Customer Project
Business Plan Confidential Page 24 of 64
8.2.3 Step 2: Mass Market
Starting in the latter half of 2006, RFind will begin marketing to the entire North American market with focused efforts on large customers. RFind will also continue to pursue local small and medium sized manufacturing organizations.
8.2.4 Promotion
At all stages of its marketing plan, RFind will promote itself to potential customers through a prescribed process of researching and identifying customers that meet the criteria for RFind and then directly contacting the decision makers within the organization to discuss the opportunities.
8.2.4.1 Web Site
The RFind web site informs customers that we are in the business of locating assets in manufacturing facilities and that we offer a complete solution. It provides high level information and encourages the reader to contact RFind Systems directly to get more detailed information. This gives RFind the opportunity to qualify the lead and to engage in a dialogue with potential customers.
8.2.4.2 Tradeshows
RFind will attend selected tradeshows to identify themselves to potential customers and to identify decision makers who attend these shows. The three tradeshows of particular interest to RFind are:
o RFID Journal Live! – This show is the premier show for RFID in North America and is attended by decision makers from a variety of industries looking to invest in RFID. We are planning to attend this show in Las Vegas, Nevada in May of 2007.
o RFID World – This show is a smaller version of the RFID Journal Live! show but has a more global reach. As with RFID Journal Live!, this show is put on by a leading publication in the industry. The show runs in the early part of the year and we expect our first attendance to be in 2007 in Dallas, Texas.
o Frontline Solutions – Targeted specifically at process and manufacturing, this show is key because it is held in Chicago, Illinois and is attended by many of the manufacturing executives in the area including John Deere, Komatsu, Caterpillar, Honda, General Electric, and others. This show is held annually in September.
RFind will also present at the IDTechEx Active RFID Summit which is held in November and is attended by very high level decision makers. RFind is planning to attend this summit for the first time in 2006.

Business Plan Confidential Page 25 of 64
8.2.4.3 Marketing Budget
The marketing budget, not taking into account labor, will vary from year to year as indicated below:
Category 2006 2007 2008 2009 2010
Advertising & Web site $ 6,000 $199,500 $ 567,000 $1,134,000 1,932,000$
Mktg Reports & Lists $ - $ 36,000 $ 36,000 $ 36,000 36,000$
Tradeshows $10,375 $ 90,075 $ 90,075 $ 90,075 90,075$
Travel $71,250 $328,640 $ 474,240 $ 698,880 $1,015,040
Total $87,625 $654,215 $1,167,315 $1,958,955 $3,073,115 Figure 10: Annual marketing budget for the years 2006 – 2010
8.3 Sales and Distribution
8.3.1 Sales Strategy
RFind will make use of two mechanisms for selling its solution: 1) Direct sales, and; 2) Third parties.
8.3.1.1 Direct Sales
Direct sales of RFind's solution will be performed by account managers who work for RFind. These account managers will be regionally placed around North America. The first two account managers will be strategically located in the United States in:
1) The mid-west, and; 2) The east coast.
After 6 months of employment, each account manager will be expected to secure minimum commitments for $1 million in sales or $20,000 in monthly licensing fees per year. These commitments will come initially from small to medium sized organizations with shorter sales cycles of 6 – 12 months. Commitments from larger organizations are expected after 12 – 18 months. Each account manager will be provided with a budget to cover their phone, web use, and travel costs equating to $3,000 per month. To support these sales, there will be a sales engineer who is assigned to support 4 account managers. These sales engineers will be available for technical discussions with potential customers and assisting with preparing and reviewing proposals.
8.3.1.2 Third Party Sales
RFind will develop strategic partnerships with organizations that have an established presence in the manufacturing and warehousing industries. Establishing and maintaining relationships with these strategic partners will be responsibility of the executive management.

Business Plan Confidential Page 26 of 64
Strategic partners are provided with training on RFind’s products and the applications where the products are best suited. RFind will assign a single project engineer to work with strategic partners and support their sales efforts. In cases where third parties are integrating RFind products into their existing product offerings, RFind will provide a single resource to that effort throughout its duration. When a third party makes a sale, they are responsible for the installation, configuration, and ongoing support of the site. RFind will work with the third party on the first few implementations to ensure the quality of the work and will periodically check on installations to ensure the quality is maintained. The first strategic partner, Nevalon Technologies, was secured in November of 2005.
8.3.1.2.1 Nevalon Technologies
Nevalon Technologies, LLC was established in October 2000 and is a privately held business and IT consulting firm headquartered in Raleigh, NC with clients and staff around the country. The management and staff consist of seasoned technology and business development professionals experienced in the design, delivery, management, and selling of software application solutions specific to industrial manufacturing. Throughout the past five years, Nevalon has developed several applications that make use of various active RFID products in rugged and industrial environments and has had success with these applications and the customers who continue to use these products. The customer base for Nevalon is focused on industrial manufacturing in the mid-west and east coasts of the United States and includes:
• Caterpillar,
• Phillips,
• RJ Reynolds Tobacco Company,
• Prelub (RPM Industries), and;
• Michelin.
9 Implementation Schedule
9.1 Sales and Marketing
The pilot site for the product testing was signed up in December 2005. It is Canadian Commercial Vehicles in Kelowna, British Columbia. The organization is the primary supplier of sleeper cabs to Western Trucks out of Portland, Oregon. It is also a subsidiary organization of a much larger organization with ownership in several manufacturing organizations across North America. RFind has identified the potential customers in Western Canada that will be approached in the early stage sales efforts. These are manufacturing organizations with facilities supporting 100 – 1000 employees in British Columbia. The top 50 prospects will be contacted directly by our representatives throughout February and March. By April 1,
Business Plan Confidential Page 27 of 64
2006, the goal for sales and marketing, is to secure our first two customer projects. These projects will be ready for installation on June 1, 2006.
9.2 Risks and Assumptions
As with any software development, there is always a concern that the work will take longer than anticipated. To mitigate, RFind has organized the development such that the core functionality is completed early in the process and that the final components to be developed are of low priority and would not prohibit the delivery of the product to customers. In the sales and marketing, the challenge is to ensure that the selection criteria for the top 50 target organizations is properly defined and validated. It will be up to the sales personnel to aggressively pursue the first few customers locally and then to turn their attention to larger customers. Some assumptions that have been made in the sales forecasting are:
1) A small to medium sized organization (facility sizes of 100 – 200K square feet) will have a 6 – 12 month sales cycle and will yield a project of $75 - $150 K sale or a $5,000 - $10,000 per month license with $50 - $75K in sales.
2) A large sized organization (facility sizes of 150K+ square feet) will have a 12 – 18 month sales cycle with an expectation of multiple projects in the $150 - $250K range.
10 The Business
10.1 Incubator
“A Business Incubator is a facility designed to assist businesses to become established and profitable during their start up phase. They do this by providing:
• shared premises
• business advice
• business services
• networking
• mentoring The incubation period for an individual business is normally one to three years. US statistics show that Business Incubators increase the success rate of start-ups from 20% to 87%.” – New Zealand Trade & Enterprise Web Site (http://www.nzte.govt.nz/section/11735.aspx)
10.1.1 Okanagan Valley Research and Innovation Centre (ORIC)
In September of 2005, RFind accepted an offer from ORIC to be an incubator company within their organization. Our head offices are now co-located with ORIC at Canada’s National Research Council’s Dominion Radio Astrophysical Observatory (DRAO) in White Lake, BC. ORIC is focused on the development of wireless technology and is able
Business Plan Confidential Page 28 of 64
to provide RFind with access to all the resources and equipment at DRAO in addition to ongoing mentorship and support with technical expertise, business experience, resources, funding assistance, intellectual property, and market research. The mandate of ORIC is to provide a centre for independent research and innovation within the National Research Council’s Dominion Radio Astrophysical Observatory that can be used as a conduit for technology transfer from the work produced at DRAO to the high-technology industry within Western Canada. This mandate is accomplished through several means including the incubation of organizations that can make use of this technology during early stages and develop products for market.
11 The People The management, staff, and extended partners of RFind Systems are a team of dedicated individuals with solid experience and knowledge in RFID and manufacturing. Each of these individuals has been carefully selected because of their unique ability to contribute to the success of RFind Systems.
11.1 Management
The executive management of RFind consists of two individuals, Sharon Barnes and Marty Brooks, who have proven track records working with RFID implementations in manufacturing environments over the past 5 years. Ms. Barnes and Mr. Brooks have both worked as embedded team members on high level 6 Sigma teams within Caterpillar and have gained the respect of decision makers at the highest levels within this organization. In May of 2004, both Ms. Barnes and Mr. Brooks were personally recognized by Caterpillar and received awards for Process & Technology Leadership for their part on a significant RFID 6 Sigma project within their engine center in Mossville, Illinois. In 2004, Caterpillar developed an internal RFID governance board that is tasked with determining the implementation plans for RFID within the entire organization. Ms. Barnes has been invited on several occasions to participate in meetings of this governance board and continues to be in regular contact with members of this board. In addition to Caterpillar, Ms. Barnes and Mr. Brooks have worked on RFID installations as the project manager and lead engineer for more than 50 organizations and governments around the world. The vast majorities of these projects were in the manufacturing industry and have exposed Ms. Barnes and Mr. Brooks to all aspects of manufacturing and the challenges faced by leading organizations. Ms. Barnes and Mr. Brooks have worked with many lean manufacturing processes and have experience with just in time manufacturing and customized, one-off assembly processes. As part of their role in these projects, Ms. Barnes and Mr. Brooks have worked with many RFID and governance committees that are actively working to define how RFID will be implemented across their manufacturing facilities. Ms. Barnes and Mr. Brooks maintain contact with several individuals within these organizations and will be working with these groups in defining the future product enhancements that RFind will bring to market. Complete resumes for Ms. Barnes and Mr. Brooks are enclosed in appendix G.
Business Plan Confidential Page 29 of 64
11.1.1 Chief Executive Officer - Sharon Barnes
A leader in the RFID field, Ms. Barnes offers a global perspective through her 5 years of work with industry leaders General Electric, Caterpillar, Federal Express, and Volkswagen. Based on her expertise in complex, multi-stakeholder project management, Ms. Barnes brings a patient and logical approach to innovation. Ms. Barnes has 15 years of demonstrated keen attention to business fundamentals. As part of her work in RFID, Ms. Barnes has developed several designs for implementing RFID and has managed the development of numerous software applications and interfaces for RFID. She has worked on several key algorithms that have been used in the RFID industry and has a patent for her work on a design that permits an RFID system to determine the closest item to a fixed point within the system. Prior to entering the RFID industry, Ms. Barnes owned and operated a consulting firm out of Vancouver, British Columbia and acted as Vice President of Development for a small start-up software company delivering commercial software to the custom home building industry across North America. The focus of Ms. Barnes’ work at her consulting firm was in the design and development of new communication mechanisms for emerging technologies. Combined, Ms. Barnes brings with her:
- 17 years of experience in management (11 in executive positions), - 15 years of experience in system architecture, - 13 years of experience in communications design, and; - 5 years of experience in active RFID in industrial manufacturing.
Ms. Barnes holds a technology diploma from the British Columbia Institute of Technology coupled with an advanced diploma in business management and has recently completed her Masters of Business Administration. She is also a member of the British Columbia chapter of the Project Management Institute.
11.1.2 Vice President of Technology – Marty Brooks
Mr. Brooks has spent the past five years as the lead engineer on more than 20 active RFID projects for several top organizations including: Bridgestone/Firestone, Thomas Built Busses, United Parcel Service, General Electric, and Caterpillar. He has also worked as the lead systems engineer for several active RFID initiatives within the public sector for the United States Department of Defense, the Canadian government, the Singapore army, the Jordanian government and the Columbian government. In addition, through the successful certification of numerous RFID devices over the past 5 years, he has gained in-depth knowledge of the regulatory issues surrounding approval and operation of RFID devices around the world. Prior to entering the RFID industry, Mr. Brooks was the project engineer on a $30 million project tasked with delivering communication assemblies to the Canadian military. For his part of this project, Mr. Brooks oversaw design, manufacturing,
Business Plan Confidential Page 30 of 64
installation and testing of the products. He was also the point of contact for the management of several dozen sub-contractors and vendors on this project. His work on this project was credited with cost savings of over $500,000. Mr. Brooks earned his Bachelor of Science degree in electrical engineering from the University of Calgary. He is a professional engineer registered with the Association of Professional Engineers and Geoscientists of British Columbia.
11.2 Staffing
In selecting a staff for RFind, the primary concern was to ensure that the highest caliber of individuals was selected. RFind has, as part of its staff compliment two key individuals in the areas of sales and software development. Additionally, RFind has identified and approved several hardware and software development consultants who are available on short notice to work on the product development.
11.2.1 Director of Sales – Portia Dove
Ms. Dove comes to RFind with a vast amount of experience within the sales field. Most recently, Ms. Dove was an instrumental member of the Okanagan Science and Technology Council (OSTEC) staff and was responsible for ensuring the growth and sustainability of the membership within this group. Her contributions to this position have provided OSTEC with a strong membership that has expanded beyond the levels that were set out as expectations by the board of directors. Ms. Dove has worked within in the high technology sector for several years and has proven success within this area. As part of her contribution to RFind, Ms. Dove will be bringing over 20 years of experience in sales in various fields including advanced manufacturing industries, aerospace, and the information technology sectors. In addition to the above, Ms. Dove is actively involved in working with others to increase knowledge through teaching within the Bachelor of Technology and Management course at the British Columbia Institute of Technology.
11.2.2 Software Development – John Fitzpatrick
A key role within RFind Systems is that of the software development. This role requires an individual with strong skills who will be able to take a lead role in the definition of the system architecture and manage the development of the software that will support this architecture. Mr. Fitzpatrick brings to RFind Systems very strong skills in the area of software development that are coupled with equally strong discipline. He is able to manage the transition of the software from product requirements, through the design, and into coding in a methodical and well thought out manner. Mr. Fitzpatrick has also had experience working to develop locating algorithms for active RFID in industrial manufacturing and is able to provide reflection from that experience that is innovative and new.

Business Plan Confidential Page 31 of 64
In his role with RFind Systems, Mr. Fitzpatrick will be responsible for the overall design and management of the software development. He will be working closely with RFind’s partner, Nevalon Technologies, to ensure that the result is of the highest quality.
11.3 Board of Advisors
RFind has assembled a board of advisors consisting of seasoned professionals who are able to provide support to the executive team.
11.3.1 Alan Foster
Alan Foster is an experience executive from the active RFID industry. In his most recent position as the President of eXI Wireless in Richmond, British Columbia, he developed the organization over a 5 year period into an organization with $9 million in revenue and facilitated its sale in July of 2005 for $16 million. eXI Wireless specializes in the development of active RFID solutions for tracking infants and elderly patients in hospitals and long term facilities. Prior to his work at eXI Wireless, Mr. Foster had proven himself in several high technology organizations as an experienced international business developer who consistently expanded the annual revenue of organizations. In his role as an advisor to RFind Systems, he is providing guidance in structuring the organization and the business development to capitalize on the success models he has developed.
11.3.2 David Mayes
David Mayes has most recently operated his own successful private limited company, Global Internet Group, LLC, a California international business development firm, for firms in the information technology market. Mr. Mayes recent clients include New Zealand Trade & Enterprise and the Korean IT Promotional Agency (KIPA), for whom he provided management consultancy to small startup companies. In these roles, Mr. Mayes was directly involved in a variety of major sales agreements, company partnerships, public and private investments and acquisitions. Mr. Mayes’ experience with founding and operating his own companies began early in his career, with 01 Computers Group (UK) Limited, which he founded in London with a British business partner, Kenneth Blackman, a senior colleague from Intel Corporation. 01 Computers secured equity funding from Equity Capital for Industry, and also financial backing from Barclays Bank Ltd. 01 Computers operated with 20 employees, and grew annual sales to approximately £8 Million, providing products and services to small businesses, as well as securing longer term sales agreements with the British Broadcasting Corporation, Imperial Chemical Corporation, and British Telecom. Mr. Mayes began his career at Intel Corporation, spending nearly ten years in senior marketing positions in the U.S., Pacific Rim, and Western Europe. After leaving Intel to form 01 Computers in the United Kingdom, Mr. Mayes later returned to Canada, and held a senior executive position with Mobile Data International, a publicly traded Canadian company. When MDI was acquired, Mr. Mayes returned to California and held senior positions with Silicon Graphics and Sun Microsystems. Having “hands on” roles in business since the mid-1970’s, Mr. Mayes has extensive experience in corporate

Business Plan Confidential Page 32 of 64
general management, finance, marketing and sales. Mr. Mayes’ has most recently established himself in the Okanagan business and investment community via involvement with OSTEC and the Okanagan Angels. He also brings a strong network of relationships with the broader investment community, which provides him with valuable insight into successful business management opportunities and strategies. Mr. Mayes holds a B.A. from San Jose State University, with graduate study at Oxford University and the University of Wales.
11.3.3 Peter Haubrich
The managing executive director of ORIC, Peter Haubrich, is considered to be one of the foremost authorities in wireless communications. He has work in research and development and product development in the area of communications for over 25 years. Of these, 10 were spent working specifically in wireless communications as a top level manager for SONY in Europe. As the Director of Technology Management for SONY, Mr. Haubrich was involved in standardization efforts and was responsible for defining the direction of R&D projects and working with business units in determining strategic product development paths for the future. Mr. Haubrich currently serves as a founding member of the Investment Review Committee of a private equity fund: Okanagan Innovation Fund and as an elected member of the board of directors of the Okanagan Science and Technology Council and also of the Okanagan Partnership.
11.4 Legal and Accounting
RFind has enlisted the support of two experienced professionals to fill the roles for legal and accounting. Our legal support is coming from: Todd Kerr Kerr, Redekop, Leinburd, and Boswell #410 – 1333 West Broadway Vancouver, British Columbia V6H 4C1 Our Chief Financial Officer is: Paul Maarschalk Meyers Norris Penny 600 – 1628 Dickson Avenue Kelowna, British Columbia V1Y 9X1
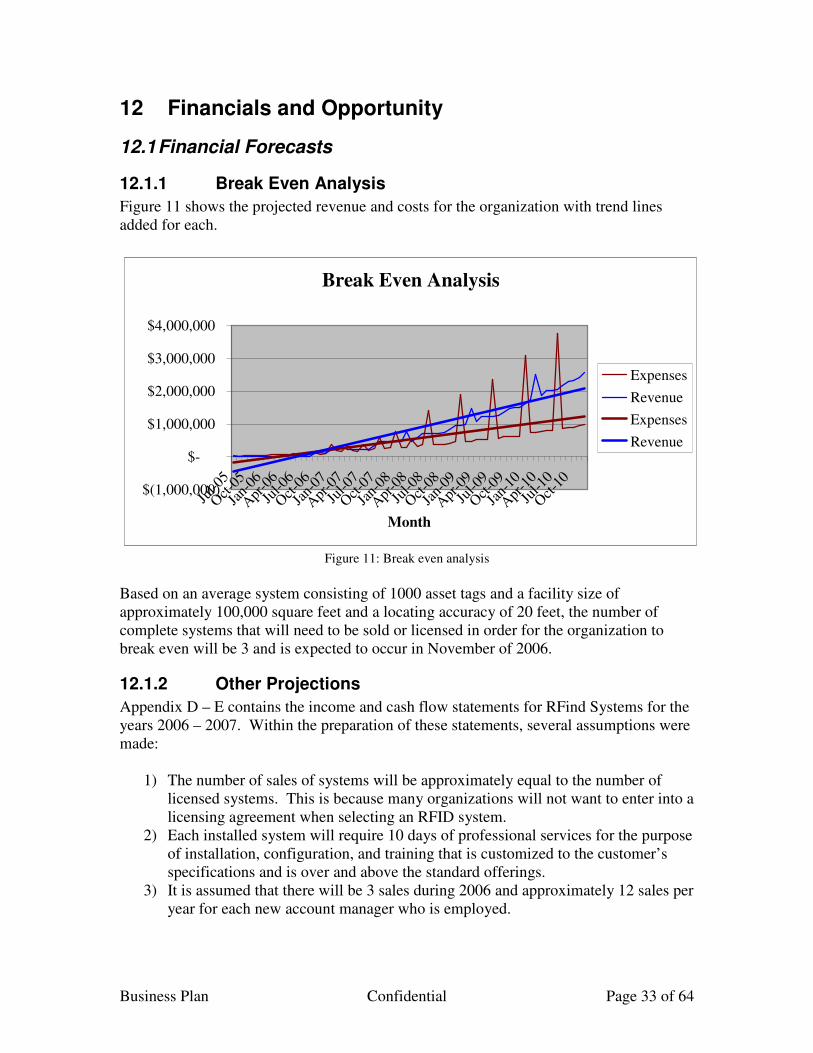
Business Plan Confidential Page 33 of 64
12 Financials and Opportunity
12.1 Financial Forecasts
12.1.1 Break Even Analysis
Figure 11 shows the projected revenue and costs for the organization with trend lines added for each.
Break Even Analysis
$(1,000,000)
$-
$1,000,000
$2,000,000
$3,000,000
$4,000,000
Jul-0
5
Oct
-05
Jan-
06
Apr
-06
Jul-0
6
Oct
-06
Jan-
07
Apr
-07
Jul-0
7
Oct
-07
Jan-
08
Apr
-08
Jul-0
8
Oct
-08
Jan-
09
Apr
-09
Jul-0
9
Oct
-09
Jan-
10
Apr
-10
Jul-1
0
Oct
-10
Month
Expenses
Revenue
Expenses
Revenue
Figure 11: Break even analysis
Based on an average system consisting of 1000 asset tags and a facility size of approximately 100,000 square feet and a locating accuracy of 20 feet, the number of complete systems that will need to be sold or licensed in order for the organization to break even will be 3 and is expected to occur in November of 2006.
12.1.2 Other Projections
Appendix D – E contains the income and cash flow statements for RFind Systems for the years 2006 – 2007. Within the preparation of these statements, several assumptions were made:
1) The number of sales of systems will be approximately equal to the number of licensed systems. This is because many organizations will not want to enter into a licensing agreement when selecting an RFID system.
2) Each installed system will require 10 days of professional services for the purpose of installation, configuration, and training that is customized to the customer’s specifications and is over and above the standard offerings.
3) It is assumed that there will be 3 sales during 2006 and approximately 12 sales per year for each new account manager who is employed.

Business Plan Confidential Page 34 of 64
Figure 12 shows the projected revenue, profit, and EBITDA for the years 2006 – 2010.
Revenue, Profit, EBITDA Projections for 2006 - 2010
-5,000
0
5,000
10,000
15,000
20,000
25,000
30,000
Year
($0
00
's)
Gross Revenues 0 319 3,540 7,881 14,830 24,899
Gross Profit 0 214 2,254 5,108 9,734 16,517
EBITDA -194 -514 -186 1,171 3,579 7,188
2005 2006 2007 2008 2009 2010
Figure 12: Revenue, Profit, EBITDA Projections for the years 2006 – 2010
The complete projected financial statements for the years 2006 – 2010 are provided in appendix F of this document.
12.2 Valuation
RFind Systems valuation is based on several elements:
1) The revenue and sale price of several RFID organization in the past 2 years, 2) The anticipated sales revenue from product sales over the next 4 years, and; 3) The desired annual return on investment expected by investors.
Several acquisitions of RFID organizations have occurred in the last two years:
Date Company Sold To Purchase Price ($USD)
Estimated Annual Sales ($USD)
September 2004
Matrics, Inc Symbol Technologies, Inc.
$230 million $10 million
December 2004
TransCore Holdings, Inc
Roper Industries, Inc
$596 million $338 million
February 2005
Inovonics Wireless Corporation
Roper Industries, Inc
$45 million $30 million
April 2005
eXI Wireless Inc
VeriChip Corporation
$16 million $9 million
Figure 13: Private sales of RFID organizations for the period from September 2004 to June 2005

Business Plan Confidential Page 35 of 64
Based on these sales, it is reasonable to expect that an established RFID organization would be sold for 1.5 times the annual revenue at minimum. Investors entering the organization at this stage are participating in a high risk opportunity and expect to receive 100% return per year on their investment with an opportunity to exit the investment in 3 – 5 years. Using the projected revenues and calculating back to the present value for the next four years, it is reasonable to value RFind Systems at $2 million. The calculations are shown in figure 14.
YearProjected
Revenue
Future Value
(1.5x Revenue)
Present
Value
2007 $ 3,540,258 $ 5,310,388 $ 2,655,194
2008 $ 7,880,544 $ 11,820,817 $ 2,955,204
2009 $14,829,729 $ 22,244,594 $ 2,780,574
2010 $24,899,486 $ 37,349,229 $ 2,334,327 Figure 14: Present value calculations for RFind Systems, Inc.
The calculation used in determining the present value is: PV = FV / (1+i)n Where: PV = Present value FV = Future value i = Investors expected annual return n = Number of years from current date
12.3 Investment Opportunity
At this time, RFind is nearing completion of its first stage of development. This stage was funded through founder investments and friends and family investments. At the conclusion of this stage, the organization will have completed the hardware prototyping and will have the software design complete and into development. The number of outstanding shares at this time is 600,000 with Marty Brooks and Sharon Barnes holding a total of 550,000 of these.

Business Plan Confidential Page 36 of 64
RFind Systems is seeking equity financing from outside investors in two stages:
Financing Stage
Funding Sought
Ownership Anticipated Use
Milestones
Initial $ - 40% Research and development
- Completion of hardware prototypes - Completion of software design - Initial development of software design - Securing patent protection
Round 1 $500,000 25%
Research and development Marketing
- Completion of development - Completion of pilot testing - Certification of hardware - Completion of production readiness - Implementation of marketing plan - Securing of first three customers
Round 2 $1,500,000 35% Sales and marketing
- Full market penetration
Figure 15: Financing rounds sought for RFind Systems
12.4 Round 1
The first round of outside financing is needed to complete the development of RFind’s system, to fully test the system, to ready the system for full scale production and to implement the marketing plan and secure our first three customers. For this round, RFind is seeking a total of $500,000 from outside investors in exchange for a 38% present day ownership in the organization. After dilution in round 2, the ownership will be 25%. These funds will be put into use starting in March of 2006 and will be used through December of 2006.
12.5 Round 2 – Marketing and Operations
The second round of financing will be used to fund the marketing efforts and operations of the organization for the period from January 2007 through December 2008. By the end of 2008, RFind will have reached a point whereby it is able to support itself.
12.6 Intellectual Property
The products being produced by RFind will be protected through patent applications for the overall system and some of the individual components. RFind is applying for the first set of provisional patents on its intellectual property in March of 2006. This will provide
Business Plan Confidential Page 37 of 64
protection for the new RFID architecture, the locating algorithm, and the anti-collision algorithms used in RFind’s system.
12.7 Positioning for Sale
We believe that this opportunity is a viable one and that the possibility of a private sale of the business in 5 years time is justified by recent activities that have taken place. In a market where there are a limited number of RFID manufacturers, three private sales have taken place in the past year that are of significance. Figure 7 outlines the details of these sales.

Business Plan Confidential Page 38 of 64
13 Appendix A: Business Case Studies
13.1 Business Case #1 – Finished Goods Locating
Business Overview Type of Business: An engine manufacturing facility Primary Business: Manufacturing of sub-assemblies for construction equipment Primary Market: Construction Operating Hours: 24 / 7 Facility Size: 500,000 s.f. in the main facility and 300,000 s.f. in each of 2 additional on-site storage facilities Description The facility has several production lines which combined, manufacture 500 engines per day. At multiple stages of production, the engine is tested to ensure functionality prior to major assembly procedures. If engines fail test, they are removed from the assembly line to undergo repair. Engines that complete assembly with no test failures are removed from the line and affixed to a transport skid for staging and subsequent shipping to the end user. When engines are taken off the line, they are placed around the facility wherever free space can be found. The Problem Where are the engines? Engines are often built with custom features and for just in time delivery. If an engine is not delivered on time, the manufacturer can face penalties of $5000 per day. Finished engines cost between $25,000 and $50,000 each. If an engine cannot be located and shipped, then an expedited build is initiated to avoid the late delivery penalties. RFind Systems’ Solution The solution for this project would consist of a system that has 5000 asset tags. The infrastructure will consist of 110 squares covering 10,000 sf each. The cost of implementing the RFind System in this organization will be:
RFind System
Asset Tags $207,750
Purchased Infrastructure $473,880
This will provide the organization with a completely integrated system that will allow the organization to answer immediately the question, “Where are the engines?”

Business Plan Confidential Page 39 of 64
Cost Comparison to Competitors
RFind
Systems (License)
RFind Systems (Purchase)
Identec Solutions
RF Code Savi WhereNet
Asset Tags $ 207,750 $ 207,750 $ 280,000 $ 100,000 $ 225,000 $ 625,000
Infrastructure $ 17,551 $ 473,880 $1,026,667 $1,870,000 $1,925,000 $ 660,000
Support $ - $ 47,388 $ 102,667 $ 187,000 $ 192,500 $ 66,000
Year 1 $ 418,363 $ 729,018 $1,409,333 $2,157,000 $2,342,500 $1,351,000
Year 3 $ 839,590 $ 823,794 $1,614,667 $2,531,000 $2,727,500 $1,483,000
Year 5 $ 1,260,817 $ 918,570 $1,820,000 $2,905,000 $3,112,500 $1,615,000
The above chart shows the comparative costs between the four leading competitors to RFind and RFind. Of the above systems, only the systems provided by RFind, Savi, and WhereNet would qualify as complete at this point. The IDENTEC SOLUTIONS and the RF Code systems would require additional work to be done to integrate them into the customer’s environment. Return on Investment (ROI) Justification The ROI for this value is easily achieved on a monthly basis. With the system use being charged on a monthly basis, customers will realize immediate savings in month one, not year one. The following table outlines areas of cost savings:
Monthly Savings
Description High Low
Elimination of two positions for the purpose of locating assets
13,000 6,000
1% to 5% reduction in overbuilds2 3,750,000 750,000
Reduction of late delivery charges for missed orders
20,000 0
Increased customer loyalty leading to increased orders
25,000 0
Elimination of excess material storage resulting from reduced production
50,000 0
Totals 3,858,000 756,000
2 The cost savings noted in this case study are based on a factory having to run additional shifts throughout the month to make up for lost production time. Value is based on the cost of wages, equipment usage, and overhead for the additional shift in a large factory.

Business Plan Confidential Page 40 of 64
13.2 Business Case #2 – Locating Stamping Dies Within a Manufacturing Facility
Business Overview Type of Business: A metal fabricating operation Primary Business: Stamping components out of sheet metal Primary Market: Automotive Operating Hours: 24 / 7 Facility Size: 150,000 s.f. in main facility and 20,000 s.f. in each of 5 off-site storage facilities Description The operation has 10 presses that stamp out components for parts on automobiles such as doors, quarter panels, fenders, and bumpers. These components are then loaded into special containers designed specifically for that part and shipped to the customer. Once emptied, the container is returned to the facility for reuse. An average production full run will take approximately 3 ½ hours with another 30 minutes required to change out a set of dies. As runs are completed on the machines, the current dies must be removed and the new dies put into place. The old dies are then moved into storage wherever space is available. In some cases the die sets are separated and dispersed across several storage locations. A set of dies can be composed of 2 or 4 pieces. The number of die sets that the facility must accommodate is 500 (total of 1500 individual pieces) active sets that are being run regularly and up to 2000 that are for retired vehicles with runs only rarely being done. Exceptional circumstances are constantly causing the runs to be rescheduled at the last minute. The causes of these exceptional circumstances range from a breakdown on a particular press to a damaged die piece requiring a run to be aborted to emergency orders from customers. Occasionally, orders will not be for full runs and so partial runs will need to be done. As the business grows, more storage capacity is built up internally but also in off-site warehouses located around the area (within 50 mile radius). The Problem Where are the pieces that make up the die set? Ensuring that the next die set is complete and is delivered to the press on time for a die change is critical to ensuring that the presses are not idle. Idle time will cost the company $200 – 1000 per minute in revenue depending on the particular press. RFind Systems’ Solution The solution for this project would consist of a system that has 3,500 asset tags. The infrastructure will consist of 25 squares covering 10,000 sf each.
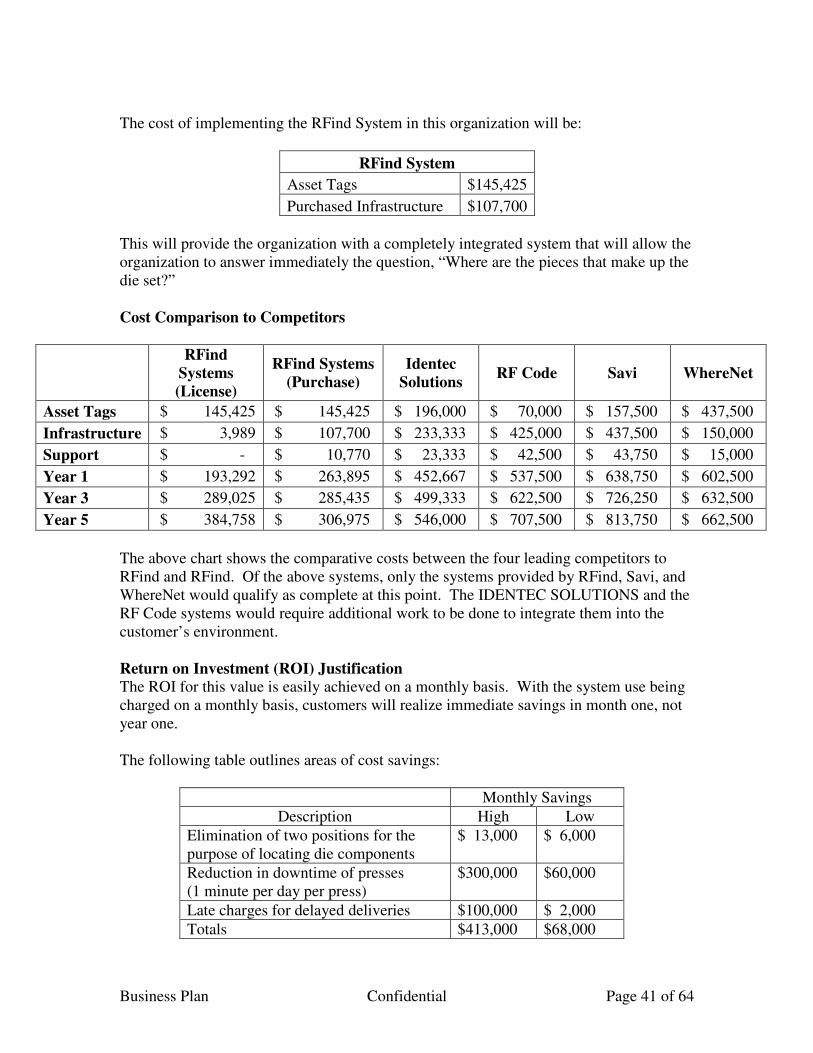
Business Plan Confidential Page 41 of 64
The cost of implementing the RFind System in this organization will be:
RFind System
Asset Tags $145,425
Purchased Infrastructure $107,700
This will provide the organization with a completely integrated system that will allow the organization to answer immediately the question, “Where are the pieces that make up the die set?” Cost Comparison to Competitors
RFind
Systems (License)
RFind Systems (Purchase)
Identec Solutions
RF Code Savi WhereNet
Asset Tags $ 145,425 $ 145,425 $ 196,000 $ 70,000 $ 157,500 $ 437,500
Infrastructure $ 3,989 $ 107,700 $ 233,333 $ 425,000 $ 437,500 $ 150,000
Support $ - $ 10,770 $ 23,333 $ 42,500 $ 43,750 $ 15,000
Year 1 $ 193,292 $ 263,895 $ 452,667 $ 537,500 $ 638,750 $ 602,500
Year 3 $ 289,025 $ 285,435 $ 499,333 $ 622,500 $ 726,250 $ 632,500
Year 5 $ 384,758 $ 306,975 $ 546,000 $ 707,500 $ 813,750 $ 662,500
The above chart shows the comparative costs between the four leading competitors to RFind and RFind. Of the above systems, only the systems provided by RFind, Savi, and WhereNet would qualify as complete at this point. The IDENTEC SOLUTIONS and the RF Code systems would require additional work to be done to integrate them into the customer’s environment. Return on Investment (ROI) Justification The ROI for this value is easily achieved on a monthly basis. With the system use being charged on a monthly basis, customers will realize immediate savings in month one, not year one. The following table outlines areas of cost savings:
Monthly Savings
Description High Low
Elimination of two positions for the purpose of locating die components
$ 13,000 $ 6,000
Reduction in downtime of presses (1 minute per day per press)
$300,000 $60,000
Late charges for delayed deliveries $100,000 $ 2,000
Totals $413,000 $68,000
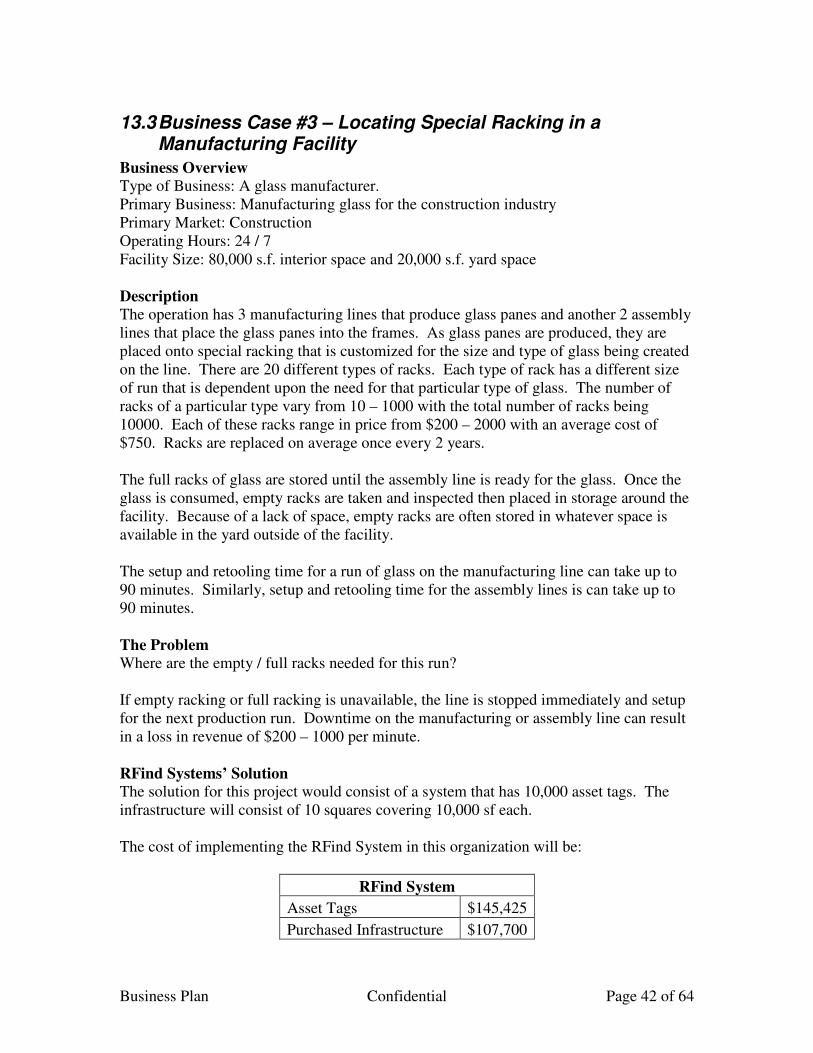
Business Plan Confidential Page 42 of 64
13.3 Business Case #3 – Locating Special Racking in a Manufacturing Facility
Business Overview Type of Business: A glass manufacturer. Primary Business: Manufacturing glass for the construction industry Primary Market: Construction Operating Hours: 24 / 7 Facility Size: 80,000 s.f. interior space and 20,000 s.f. yard space Description The operation has 3 manufacturing lines that produce glass panes and another 2 assembly lines that place the glass panes into the frames. As glass panes are produced, they are placed onto special racking that is customized for the size and type of glass being created on the line. There are 20 different types of racks. Each type of rack has a different size of run that is dependent upon the need for that particular type of glass. The number of racks of a particular type vary from 10 – 1000 with the total number of racks being 10000. Each of these racks range in price from $200 – 2000 with an average cost of $750. Racks are replaced on average once every 2 years. The full racks of glass are stored until the assembly line is ready for the glass. Once the glass is consumed, empty racks are taken and inspected then placed in storage around the facility. Because of a lack of space, empty racks are often stored in whatever space is available in the yard outside of the facility. The setup and retooling time for a run of glass on the manufacturing line can take up to 90 minutes. Similarly, setup and retooling time for the assembly lines is can take up to 90 minutes. The Problem Where are the empty / full racks needed for this run? If empty racking or full racking is unavailable, the line is stopped immediately and setup for the next production run. Downtime on the manufacturing or assembly line can result in a loss in revenue of $200 – 1000 per minute. RFind Systems’ Solution The solution for this project would consist of a system that has 10,000 asset tags. The infrastructure will consist of 10 squares covering 10,000 sf each. The cost of implementing the RFind System in this organization will be:
RFind System
Asset Tags $145,425
Purchased Infrastructure $107,700

Business Plan Confidential Page 43 of 64
This will provide the organization with a completely integrated system that will allow the organization to immediately answer the question, “Where are my glass racks?” Cost Comparison to Competitors
RFind
Systems (License)
RFind Systems (Purchase)
Identec Solutions
RF Code Savi WhereNet
Asset Tags $ 415,500 $ 415,500 $ 560,000 $ 200,000 $ 450,000 $1,250,000
Infrastructure $ 1,596 $ 43,080 $ 93,333 $ 170,000 $ 175,000 $ 60,000
Support $ - $ 4,308 $ 9,333 $ 17,000 $ 17,500 $ 6,000
Year 1 $ 434,647 $ 462,888 $ 662,667 $ 387,000 $ 642,500 $1,316,000
Year 3 $ 472,940 $ 471,504 $ 681,333 $ 421,000 $ 677,500 $1,328,000
Year 5 $ 511,233 $ 480,120 $ 700,000 $ 455,000 $ 712,500 $1,340,000
The above chart shows the comparative costs between the four leading competitors to RFind and RFind. Of the above systems, only the systems provided by RFind, Savi, and WhereNet would qualify as complete at this point. The IDENTEC SOLUTIONS and the RF Code systems would require additional work to be done to integrate them into the customer’s environment. Return on Investment (ROI) Justification The ROI for this value is easily achieved on a monthly basis. With the system use being charged on a monthly basis, customers will realize immediate savings in month one, not year one. The following table outlines areas of cost savings:
Monthly Savings
Description High Low
Elimination of two positions for the purpose of locating racks
$ 13,000 $ 6,000
Reduction in additional setup and retooling (1 times per line per month)
$250,000 $ 50,000
Overstocking of racks (20%) $100,000 $ 50,000
Totals $363,000 $106,000
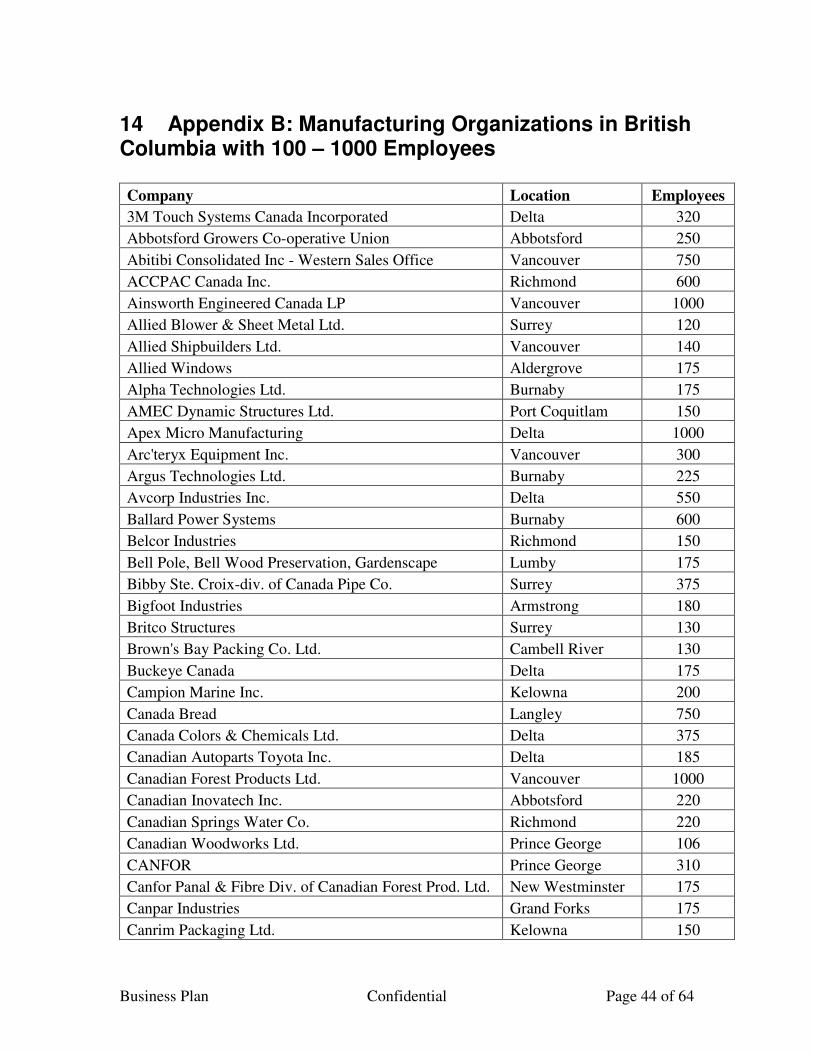
Business Plan Confidential Page 44 of 64
14 Appendix B: Manufacturing Organizations in British Columbia with 100 – 1000 Employees
Company Location Employees
3M Touch Systems Canada Incorporated Delta 320
Abbotsford Growers Co-operative Union Abbotsford 250
Abitibi Consolidated Inc - Western Sales Office Vancouver 750
ACCPAC Canada Inc. Richmond 600
Ainsworth Engineered Canada LP Vancouver 1000
Allied Blower & Sheet Metal Ltd. Surrey 120
Allied Shipbuilders Ltd. Vancouver 140
Allied Windows Aldergrove 175
Alpha Technologies Ltd. Burnaby 175
AMEC Dynamic Structures Ltd. Port Coquitlam 150
Apex Micro Manufacturing Delta 1000
Arc'teryx Equipment Inc. Vancouver 300
Argus Technologies Ltd. Burnaby 225
Avcorp Industries Inc. Delta 550
Ballard Power Systems Burnaby 600
Belcor Industries Richmond 150
Bell Pole, Bell Wood Preservation, Gardenscape Lumby 175
Bibby Ste. Croix-div. of Canada Pipe Co. Surrey 375
Bigfoot Industries Armstrong 180
Britco Structures Surrey 130
Brown's Bay Packing Co. Ltd. Cambell River 130
Buckeye Canada Delta 175
Campion Marine Inc. Kelowna 200
Canada Bread Langley 750
Canada Colors & Chemicals Ltd. Delta 375
Canadian Autoparts Toyota Inc. Delta 185
Canadian Forest Products Ltd. Vancouver 1000
Canadian Inovatech Inc. Abbotsford 220
Canadian Springs Water Co. Richmond 220
Canadian Woodworks Ltd. Prince George 106
CANFOR Prince George 310
Canfor Panal & Fibre Div. of Canadian Forest Prod. Ltd. New Westminster 175
Canpar Industries Grand Forks 175
Canrim Packaging Ltd. Kelowna 150
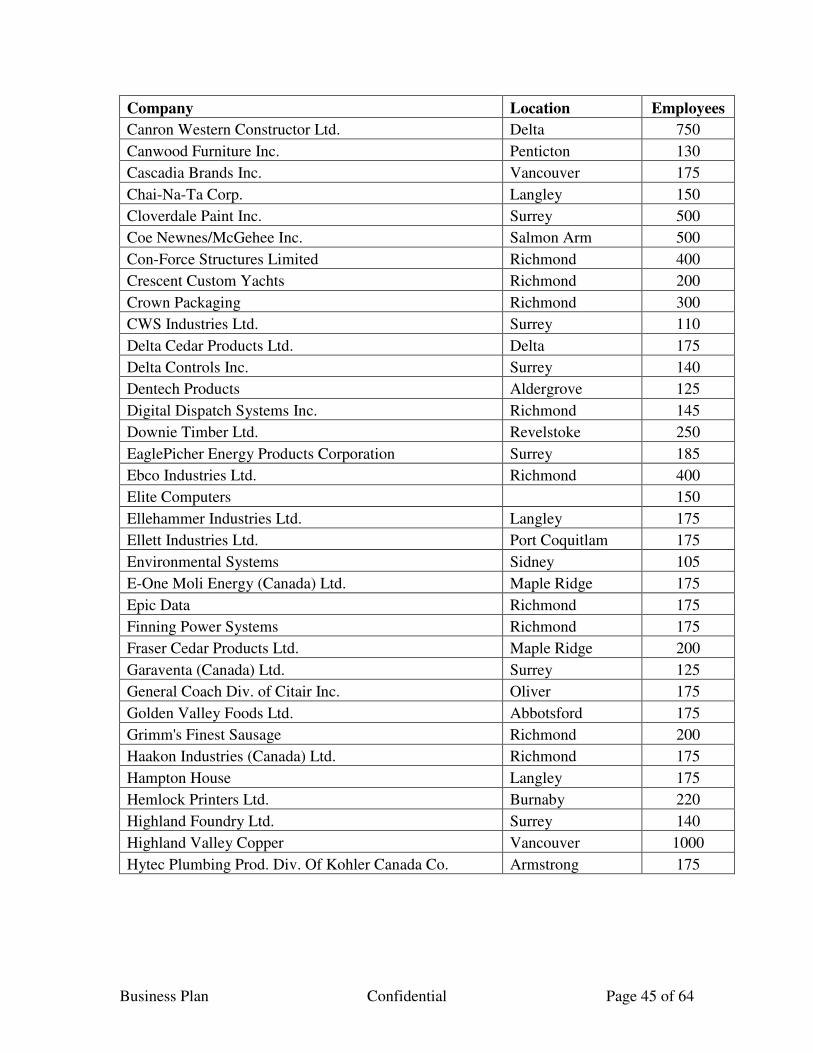
Business Plan Confidential Page 45 of 64
Company Location Employees
Canron Western Constructor Ltd. Delta 750
Canwood Furniture Inc. Penticton 130
Cascadia Brands Inc. Vancouver 175
Chai-Na-Ta Corp. Langley 150
Cloverdale Paint Inc. Surrey 500
Coe Newnes/McGehee Inc. Salmon Arm 500
Con-Force Structures Limited Richmond 400
Crescent Custom Yachts Richmond 200
Crown Packaging Richmond 300
CWS Industries Ltd. Surrey 110
Delta Cedar Products Ltd. Delta 175
Delta Controls Inc. Surrey 140
Dentech Products Aldergrove 125
Digital Dispatch Systems Inc. Richmond 145
Downie Timber Ltd. Revelstoke 250
EaglePicher Energy Products Corporation Surrey 185
Ebco Industries Ltd. Richmond 400
Elite Computers 150
Ellehammer Industries Ltd. Langley 175
Ellett Industries Ltd. Port Coquitlam 175
Environmental Systems Sidney 105
E-One Moli Energy (Canada) Ltd. Maple Ridge 175
Epic Data Richmond 175
Finning Power Systems Richmond 175
Fraser Cedar Products Ltd. Maple Ridge 200
Garaventa (Canada) Ltd. Surrey 125
General Coach Div. of Citair Inc. Oliver 175
Golden Valley Foods Ltd. Abbotsford 175
Grimm's Finest Sausage Richmond 200
Haakon Industries (Canada) Ltd. Richmond 175
Hampton House Langley 175
Hemlock Printers Ltd. Burnaby 220
Highland Foundry Ltd. Surrey 140
Highland Valley Copper Vancouver 1000
Hytec Plumbing Prod. Div. Of Kohler Canada Co. Armstrong 175
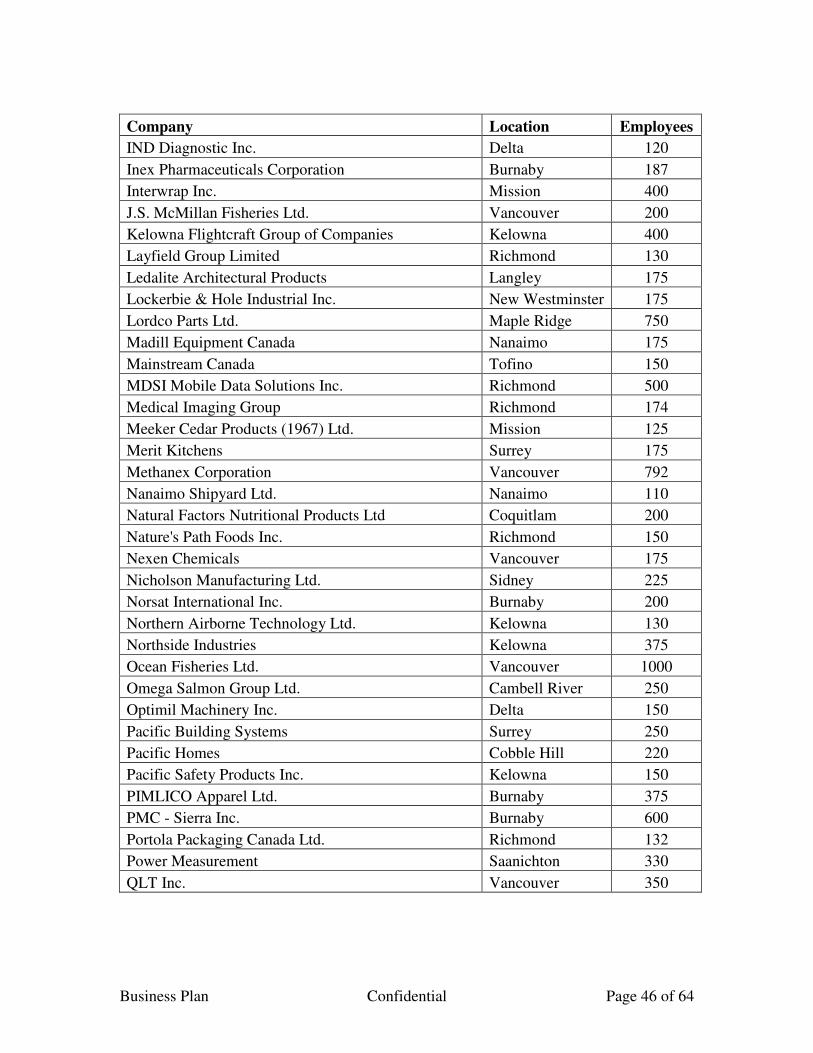
Business Plan Confidential Page 46 of 64
Company Location Employees
IND Diagnostic Inc. Delta 120
Inex Pharmaceuticals Corporation Burnaby 187
Interwrap Inc. Mission 400
J.S. McMillan Fisheries Ltd. Vancouver 200
Kelowna Flightcraft Group of Companies Kelowna 400
Layfield Group Limited Richmond 130
Ledalite Architectural Products Langley 175
Lockerbie & Hole Industrial Inc. New Westminster 175
Lordco Parts Ltd. Maple Ridge 750
Madill Equipment Canada Nanaimo 175
Mainstream Canada Tofino 150
MDSI Mobile Data Solutions Inc. Richmond 500
Medical Imaging Group Richmond 174
Meeker Cedar Products (1967) Ltd. Mission 125
Merit Kitchens Surrey 175
Methanex Corporation Vancouver 792
Nanaimo Shipyard Ltd. Nanaimo 110
Natural Factors Nutritional Products Ltd Coquitlam 200
Nature's Path Foods Inc. Richmond 150
Nexen Chemicals Vancouver 175
Nicholson Manufacturing Ltd. Sidney 225
Norsat International Inc. Burnaby 200
Northern Airborne Technology Ltd. Kelowna 130
Northside Industries Kelowna 375
Ocean Fisheries Ltd. Vancouver 1000
Omega Salmon Group Ltd. Cambell River 250
Optimil Machinery Inc. Delta 150
Pacific Building Systems Surrey 250
Pacific Homes Cobble Hill 220
Pacific Safety Products Inc. Kelowna 150
PIMLICO Apparel Ltd. Burnaby 375
PMC - Sierra Inc. Burnaby 600
Portola Packaging Canada Ltd. Richmond 132
Power Measurement Saanichton 330
QLT Inc. Vancouver 350

Business Plan Confidential Page 47 of 64
Company Location Employees
Quebecor World Vancouver Vancouver 170
Quinsam Coal Corporation Vancouver 225
Raute Wood Ltd. New Westminster 200
RC Purdy Chocolates Ltd. Vancouver 250
Rogers Sugar Ltd. Vancouver 329
Schaeffers Specialized Lubricants 450
Shane Manufacturing Richmond 375
SRI Homes Inc. Kelowna 750
StorkCraft Baby Richmond 120
Street Sport Manufacturing Ltd. Vancouver 175
Stylus Made To Order Sofas Burnaby 165
Sun-Rype Products Ltd. Kelowna 375
Superior Poultry Processors Ltd. Coquitlam 225
Teck Cominco Limited Vancouver 584
Teleflex Canada Inc. Richmond 322
Thiessen Equipment Ltd. Langley 200
Thomson Technology Langley 152
Timberwest Forest Limited Vancouver 1000
Titan Steel & Wire Co. Ltd. Surrey 200
Tolko Industries Vancouver 375
Tolko Industries Ltd. Heffley Creek Div. Kamloops 175
Uneeda Wood Products Chilliwack 150
VAE Nortrak Ltd. Richmond 150
Vancouver Shipyards Co. Ltd. Vancouver 375
VCom Inc. Victoria 220
VSM MedTech Ltd. Coquitlam 157
Wainbee Limited Richmond 175
Weldwood of Canada Limited Vancouver 1000
West Bay Sonship Yachts Ltd. Delta 430
West Coast Apparel Inc. Vancouver 500
West Coast Engineering Group Ltd. Delta 200
Western Concord Manufacturing Delta 175
Western Pulp Limited Vancouver 750
Western Sleep Products Ltd. Burnaby 125
Westkey Graphic Communications Inc. Burnaby 150
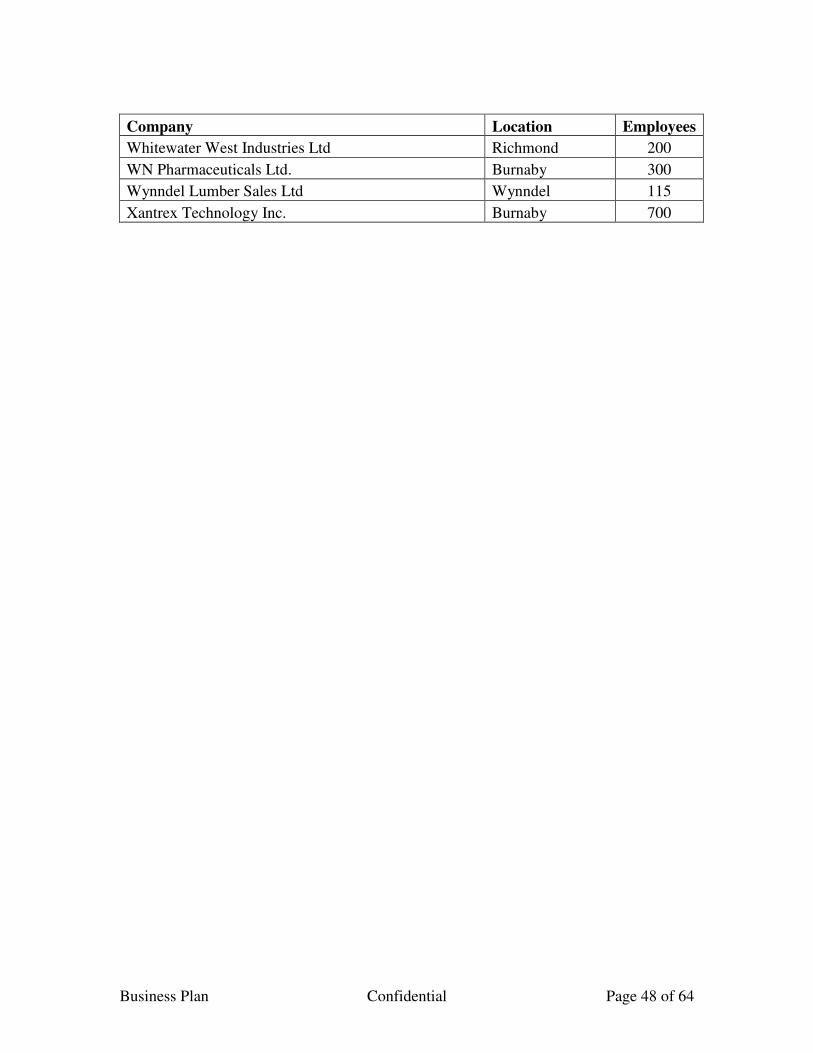
Business Plan Confidential Page 48 of 64
Company Location Employees
Whitewater West Industries Ltd Richmond 200
WN Pharmaceuticals Ltd. Burnaby 300
Wynndel Lumber Sales Ltd Wynndel 115
Xantrex Technology Inc. Burnaby 700
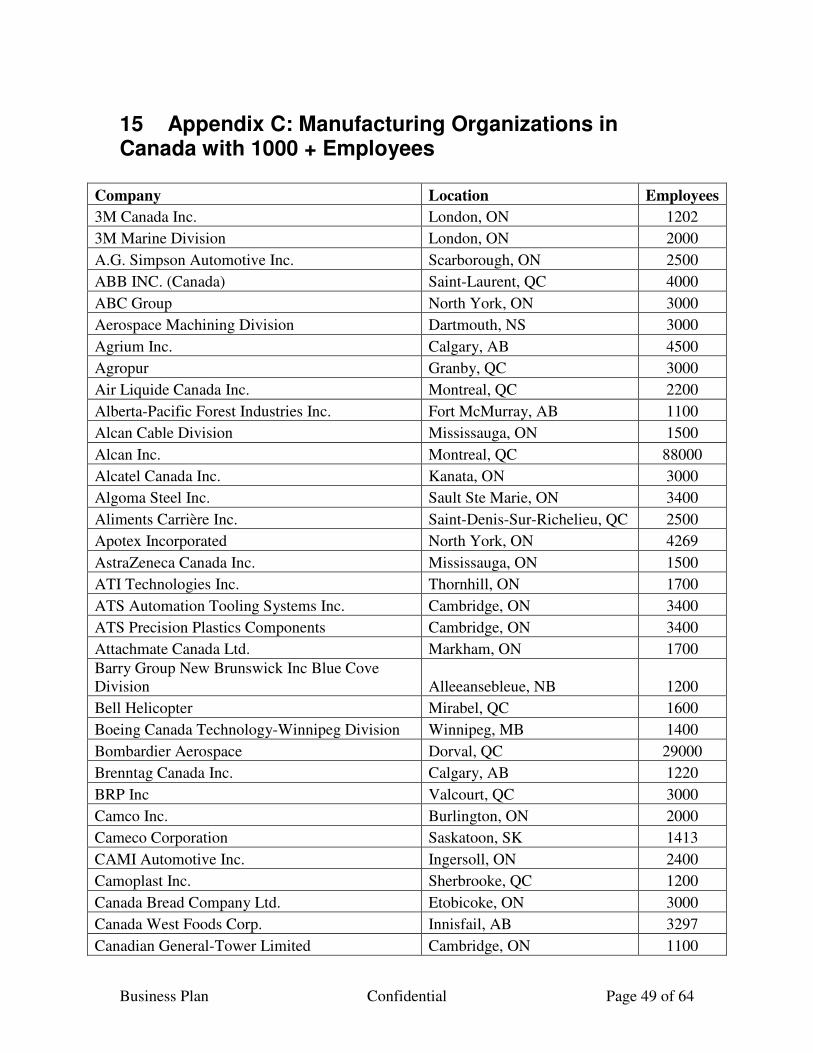
Business Plan Confidential Page 49 of 64
15 Appendix C: Manufacturing Organizations in Canada with 1000 + Employees
Company Location Employees
3M Canada Inc. London, ON 1202
3M Marine Division London, ON 2000
A.G. Simpson Automotive Inc. Scarborough, ON 2500
ABB INC. (Canada) Saint-Laurent, QC 4000
ABC Group North York, ON 3000
Aerospace Machining Division Dartmouth, NS 3000
Agrium Inc. Calgary, AB 4500
Agropur Granby, QC 3000
Air Liquide Canada Inc. Montreal, QC 2200
Alberta-Pacific Forest Industries Inc. Fort McMurray, AB 1100
Alcan Cable Division Mississauga, ON 1500
Alcan Inc. Montreal, QC 88000
Alcatel Canada Inc. Kanata, ON 3000
Algoma Steel Inc. Sault Ste Marie, ON 3400
Aliments Carrière Inc. Saint-Denis-Sur-Richelieu, QC 2500
Apotex Incorporated North York, ON 4269
AstraZeneca Canada Inc. Mississauga, ON 1500
ATI Technologies Inc. Thornhill, ON 1700
ATS Automation Tooling Systems Inc. Cambridge, ON 3400
ATS Precision Plastics Components Cambridge, ON 3400
Attachmate Canada Ltd. Markham, ON 1700
Barry Group New Brunswick Inc Blue Cove Division Alleeansebleue, NB 1200
Bell Helicopter Mirabel, QC 1600
Boeing Canada Technology-Winnipeg Division Winnipeg, MB 1400
Bombardier Aerospace Dorval, QC 29000
Brenntag Canada Inc. Calgary, AB 1220
BRP Inc Valcourt, QC 3000
Camco Inc. Burlington, ON 2000
Cameco Corporation Saskatoon, SK 1413
CAMI Automotive Inc. Ingersoll, ON 2400
Camoplast Inc. Sherbrooke, QC 1200
Canada Bread Company Ltd. Etobicoke, ON 3000
Canada West Foods Corp. Innisfail, AB 3297
Canadian General-Tower Limited Cambridge, ON 1100

Business Plan Confidential Page 50 of 64
Company Location Employees
CANAM Group Boucherville, QC 4996
Cargill Foods High River, AB 1900
Cargill Limited Winnipeg, MB 4000
Celestica North York, ON 30000
Cimco Refrigeration Toronto, ON 4000
Clearwater Bedford, NS 2500
CMC Electronics Kanata, ON 1300
CNH Global Saskatoon, SK 1700
Cognos Incorporated Ottawa, ON 1900
Collins & Aikman Canada Inc. Farnham, QC 1247
Commonwealth Plywood Co. Ltd. Sainte-Therese, QC 2000
Connors Bros. Limited Saint John, NB 1800
Cott Corporation Toronto, ON 2780
Crestbrook Forest Industries Ltd. Cranbrook, BC 1100
Daimler-Chrysler Canada Inc Windsor, ON 17000
De Havilland Inc. North York, ON 2388
Digital Equipment Of Canada Ltd. Kanata, ON 3000
Disque Americ Inc. Drummondville, QC 1100
Dofasco Inc. Hamilton, ON 7000
Dorel Industries Inc. Westmount, QC 3300
DuPont Canada Inc. Mississauga, ON 3400
Emerson Electric Canada Limited Markham, ON 2000
Encana Corporation Calgary, AB 3650
Enerflex Systems Ltd. Calgary, AB 2200
EXFO Vanier, BC 1200
Feedco North America Corp Mississauga, ON 8976
Ford Motor Company Of Canada, Ltd. St. Thomas, ON 2700
GE Canada Mississauga, ON 300000
General Dynamics Canada Nepean, ON 1200
General Dynamics Canada Ltd. Calgary, AB 1500
General Motors of Canada Limited Oshawa, ON 25000
General Motors of Canada Limited Diesel Division London, ON 2500
Global Technology Centre Strathroy, ON 1260
GNB Industrial Power - A Division of Exide Technologies Mississauga, ON 36000
Goulds Pumps Canada Inc Cambridge, ON 4500

Business Plan Confidential Page 51 of 64
Company Location Employees
Harris Canada Inc. Dollard-Desormeaux, QC 10000
Haworth Calgary, AB 1700
HEROUX DEVTEK INC. Longueil, QC 1200
Hershey Canada Inc. Mississauga, ON 1200
Hewitt Equipement Limitée Point-Claire, QC 1500
Hewlett-Packard(Canada) Ltd. Panacom Div Waterloo, ON 100000
Hobart Food Equipment Group Canada North York, ON 2000
Honeywell Mississauga, ON 5500
Honeywell Airframe Systems Mississauga, ON 1100
Husky Injection Molding Systems Ltd. Bolton, ON 2800
I.M.P. Group Limited Aerospace Division Halifax, NS 1300
ICI PAINTS Concord, ON 1500
IMP Group International Inc. Halifax, NS 2750
INCO Limited (INCO Tech Div) Toronto, ON 5798
Intercon Security Limited North York, ON 1300
International Forest Products Limited Vancouver, BC 2650
Intertape Polymer Group Inc. Saint-Laurent, QC 1500
Intier Automotive Inc. Newmarket, ON 22500
IPSCO Inc. Regina, SK 1800
Kitchen Craft of Canada Winnipeg, MB 2250
Kruger Inc. Montreal, QC 10500
Lafarge Canada Inc. Montreal, QC 8025
Lakeside Packers div of Lakeside Feeders Brooks, AB 2500
Lilydale Corporation Inc. Edmonton, AB 2800
Linamar Corporation Guelph, ON 3500
Loewen Steinbach, MB 1450
Luscar Ltd. Edmonton, AB 1600
Magellan Aerospace Corporation Mississauga, ON 3000
Manac Inc. Saint-Georges, QC 1200
Maple Lodge Farms Ltd. Brampton, ON 1800
McCain Foods (Canada) Florenceville, NB 4100
Mentor Graphics (Canada) Ltd. Ottawa, ON 2100
Michelin North America (Canada) Inc. New Glasgow, NS 1400
Michelin North America (Canada) Inc. Waterville, NS 1100
Michelin North America (Canada) Inc. Bridgewater, NS 1100

Business Plan Confidential Page 52 of 64
Company Location Employees
Mitchell's Gourmet Foods Inc. Saskatoon, SK 1400
Mitel Networks Kanata, ON 6000
Mittal Canada Inc. Contrecoeur, QC 2000
Motor Coach Industries Limited Winnipeg, MB 2000
National Steel Car Ltd. Hamilton, ON 2500
New Flyer Industries Canada ULC Winnipeg, MB 1800
Nexans Canada Inc. Markham, ON 2000
Noranda Inc. Toronto, ON 17000
NOVA Chemicals Corporation Calgary, AB 4200
Olymel Societe en Commandite Saint-Jean-Sur-Richelieu, QC 8500
ORION Bus Industries, a DaimlerChrysler Company Mississauga, ON 1400
Palliser Furniture Ltd. Winnipeg, MB 5000
Petro-Canada Chemicals Inc. Point-Aux-Trembles, QC 5000
Pfizer Canada Inc. Kirkland, QC 2000
Placer Dome Inc. Vancouver, BC 8379
PolyOne Inc Salaberr-Y-De-Valleyfield, QC 2400
Potash Corporation of Saskatchewan Inc. Saskatoon, SK 5199
Pratt & Whitney Canada Corporation Longueil, QC 9000
Premier Tech Ltd Riviere-Du-Loup, QC 1650
Procter & Gamble Inc. North York, ON 2900
PTI International Inc. 1400
QIT-Fer et Titane Inc. Soreltracy, QC 1740
Québec Cartier Mining Company Montreal, QC 1800
Québécor World Montréal inc. Montreal, QC 6500
Relizon Canada Inc. Gloucester, ON 1050
Relizon Canada Inc. Boucherville, QC 1050
Research In Motion Limited Waterloo, ON 4000
Riverside Forest Products Ltd. Kelowna, BC 2500
Rolls-Royce Canada Limited Lachine, QC 1500
Royal Group Technologies Limited Woodbridge, ON 9400
SaarGummi Québec Inc. Magog, QC 1480
Saputo Burnaby, BC 3000
Schneider Canada East York, ON 1400
Schneider Foods Inc. Kitchener, ON 5400
ShawCor Ltd. Etobicoke, ON 2500

Business Plan Confidential Page 53 of 64
Company Location Employees
Shur-Gain St. Marys, ON 12000
Siemens Canada Limited Dorval, QC 5000
Siemens VDO Automotive Inc. Chatham, ON 1900
Silicon Graphics Inc. Mississauga, ON 7500
Sklar-Peppler Furniture Corp Whitby, ON 1600
Smurfit-MBI Mississauga, ON 2000
SNC TEC Legardeur, QC 1400
Spectra Premium Industries Inc. Boucherville, QC 1500
St. Joseph Printing Ltd. Concord, ON 1200
Stackpole Limited Oakville, ON 1250
Stadacona Inc Quebec, QC 1050
Stelco Inc Hamilton, ON 9999
Sterling Truck Divsion of Freightliner Ltd. St. Thomas, ON 1050
Suncor Energy Inc. Calgary, AB 3000
Synopsys Nepean, ON 4400
Teknion Corporation North York, ON 3700
The Global Group North York, ON 4500
Thomas & Betts Ltd. Saint-Jean-Sur-Richelieu, QC 2000
Tolko Industries Ltd. Vernon, BC 2200
TrentonWorks Ltd. Trenton, NS 1200
Tyco Flow Control Calgary, AB 267000
UPM Kymmene Miramichi Miramichi, NB 1625
Valiant Machine & Tool Inc. Windsor, ON 1400
Vêtements Peerless Inc. Montreal, QC 2050
Viasystems Pointe-Claire, QC 1600
Vicwest Income Fund, a Div. of Vicwest Operations Limited Partnership Oakville, ON 1900
Vignette Corporation North York, ON 1200
WaterGroup Regina, SK 1030
Waterville TG Inc. Waterville, QC 1400
Wescast Industries Inc. Brantford, ON 2100
Wyeth Canada Thornhill, ON 1500
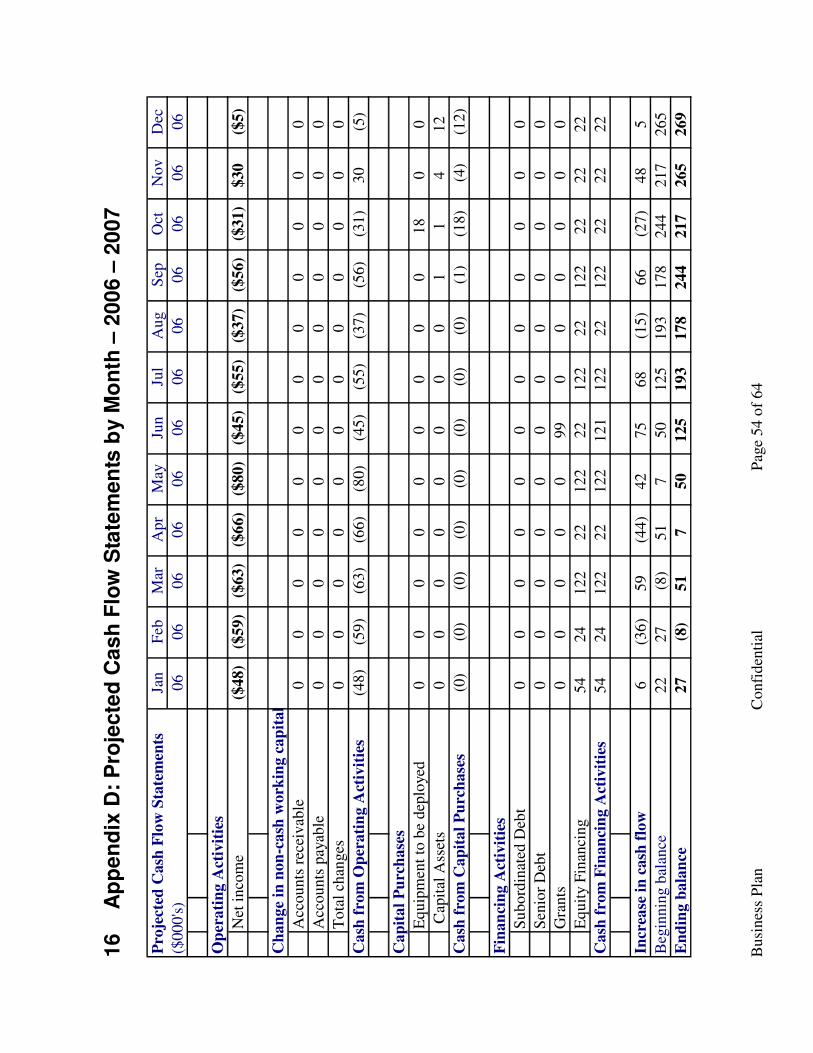
Busi
nes
s P
lan
Confi
den
tial
Pag
e 54 o
f 64
16
Ap
pe
nd
ix D
: P
roje
cte
d C
as
h F
low
Sta
tem
en
ts b
y M
on
th –
200
6 –
2007
Jan
Feb
Mar
Apr
May
Jun
Jul
Aug
Sep
Oct
Nov
Dec
06
06
06
06
06
06
06
06
06
06
06
06
($
48)
($5
9)
($63)
($6
6)
($80)
($45)
($55)
($37)
($56)
($31)
$30
($5)
00
00
00
00
00
00
00
00
00
00
00
00
00
00
00
00
00
00
(48)
(59
)(6
3)
(66)
(80)
(45)
(55)
(37)
(56)
(31)
30
(5)
00
00
00
00
018
00
00
00
00
00
11
412
(0)
(0)
(0)
(0)
(0)
(0)
(0)
(0)
(1)
(18)
(4)
(12)
00
00
00
00
00
00
00
00
00
00
00
00
00
00
099
00
00
00
54
24
122
22
122
22
122
22
122
22
22
22
54
24
122
22
122
121
122
22
122
22
22
22
6(3
6)
59
(44)
42
75
68
(15)
66
(27)
48
5
22
27
(8)
51
750
125
193
178
244
217
265
27
(8)
51
750
125
193
178
244
217
265
269
Gra
nts
Eq
uit
y F
inan
cing
Cash
fro
m F
inan
cin
g A
ctiv
itie
s
Incr
ease
in
cash
flo
w
Ch
an
ge
in n
on
-cash
work
ing c
ap
ital
Acc
ounts
rec
eivab
le
Acc
ounts
pay
able
To
tal
chan
ges
Cash
fro
m O
per
ati
ng A
ctiv
itie
s
Cap
ita
l P
urc
hase
s
Eq
uip
men
t to
be
dep
loye
d
Cap
ital
Ass
ets
Net
inco
me
Pro
ject
ed C
ash
Flo
w S
tate
men
ts
($000's
)
Cash
fro
m C
ap
ital
Pu
rch
ase
s
Fin
an
cin
g A
ctiv
itie
s
Su
bord
inat
ed D
ebt
Sen
ior
Deb
t
Beg
inn
ing b
alan
ce
En
din
g b
ala
nce
Op
era
tin
g A
ctiv
itie
s
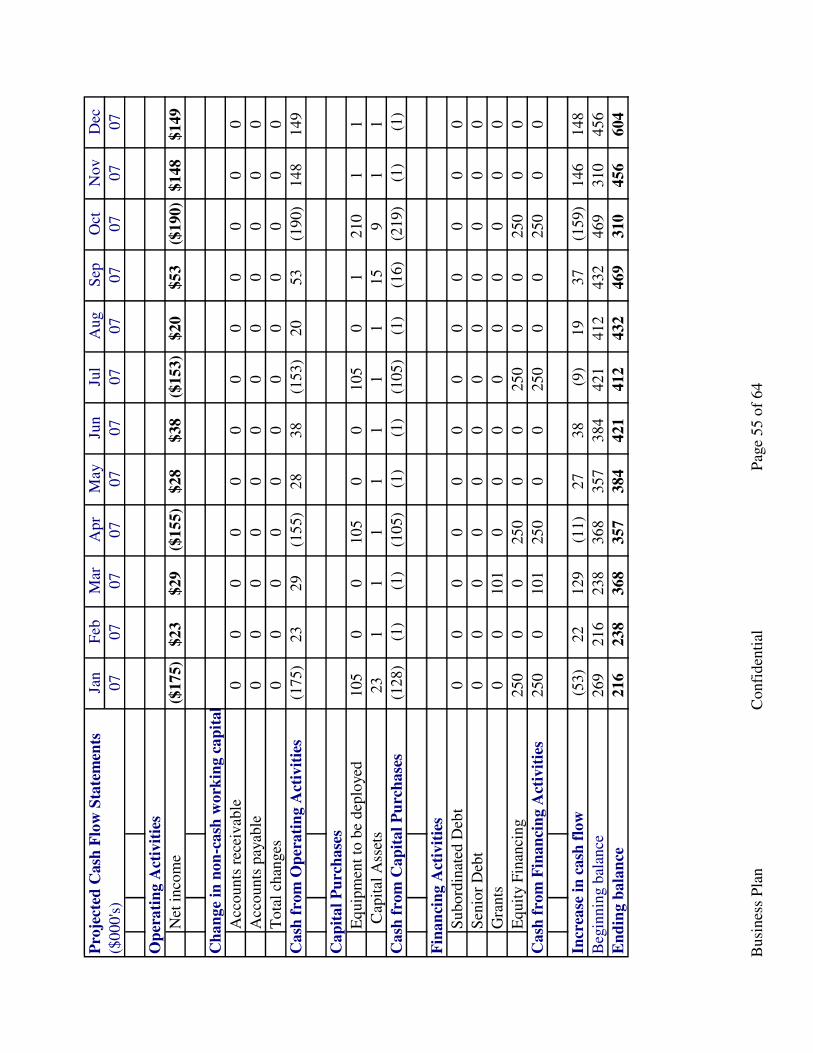
Busi
nes
s P
lan
Confi
den
tial
Pag
e 55 o
f 64
Jan
Feb
Mar
Apr
May
Jun
Jul
Aug
Sep
Oct
Nov
Dec
07
07
07
07
07
07
07
07
07
07
07
07
($
175)
$2
3$29
($1
55)
$28
$38
($153)
$20
$53
($190)
$148
$149
00
00
00
00
00
00
00
00
00
00
00
00
00
00
00
00
00
00
(175)
23
29
(15
5)
28
38
(153)
20
53
(190)
148
149
105
00
10
50
0105
01
210
11
23
11
11
11
115
91
1
(128)
(1)
(1)
(10
5)
(1)
(1)
(105)
(1)
(16)
(219)
(1)
(1)
00
00
00
00
00
00
00
00
00
00
00
00
00
101
00
00
00
00
0
250
00
25
00
0250
00
250
00
250
0101
25
00
0250
00
250
00
(53)
22
129
(11)
27
38
(9)
19
37
(159)
146
148
269
21
6238
36
8357
384
421
412
432
469
310
456
216
23
8368
35
7384
421
412
432
469
310
456
604
Pro
ject
ed C
ash
Flo
w S
tate
men
ts
($000's
)
Op
era
tin
g A
ctiv
itie
s
Net
inco
me
Ch
an
ge
in n
on
-cash
work
ing c
ap
ital
Acc
ounts
rec
eivab
le
Acc
ounts
pay
able
To
tal
chan
ges
Cash
fro
m O
per
ati
ng A
ctiv
itie
s
Cap
ita
l P
urc
hase
s
Eq
uip
men
t to
be
dep
loye
d
Cap
ital
Ass
ets
Cash
fro
m C
ap
ital
Pu
rch
ase
s
Fin
an
cin
g A
ctiv
itie
s
Su
bord
inat
ed D
ebt
Sen
ior
Deb
t
Gra
nts
Eq
uit
y F
inan
cing
Cash
fro
m F
inan
cin
g A
ctiv
itie
s
Incr
ease
in
cash
flo
w
Beg
inn
ing b
alan
ce
En
din
g b
ala
nce

Busi
nes
s P
lan
Confi
den
tial
Pag
e 56 o
f 64
17
Ap
pe
nd
ix E
: P
roje
cte
d In
co
me S
tate
men
ts b
y M
on
th –
20
06 –
2007
Jan
Feb
Mar
Apr
May
Jun
Jul
Aug
Sep
Oct
Nov
Dec
06
06
06
06
06
06
06
06
06
06
06
06
00
00
00
00
01
11
00
00
00
00
01
23
00
00
00
00
015
15
15
00
00
00
00
00
22
00
00
00
00
083
104
83
00
00
00
00
098
121
100
00
00
00
00
010
12
10
00
00
00
00
557
55
00
00
00
00
567
17
15
00
00
00
00
-531
104
84
17
21
16
16
16
16
16
16
20
17
24
40
26
34
42
45
49
24
34
14
14
14
14
14
44
44
14
55
717
31
36
35
48
59
63
66
80
45
55
37
51
62
74
90
-48
-59
-63
-66
-80
-45
-55
-37
-56
-31
30
-5
Sel
ling, m
arket
ing a
nd p
artn
ersh
ips
Tota
l
EB
ITD
A
Gro
ss P
rofi
t
Sel
lin
g, G
ener
al
an
d A
dm
inis
trati
ve
Gen
eral
& a
dm
inis
trat
ion
Res
earc
h &
dev
elopm
ent
Dir
ect
Op
erati
ng E
xp
ense
s
Sal
es C
om
mis
sio
ns
Inst
alla
tion C
ost
s
Tota
l
Gro
ss R
even
ues
Ser
vic
es
Lic
ense
Fee
s
Sal
es
Pro
ject
ed I
nco
me
Sta
tem
ents
($000's
)
New
Syst
ems
Cu
mu
lati
ve
Sale
s
Rev
enu
es

Busi
nes
s P
lan
Confi
den
tial
Pag
e 57 o
f 64
Jan
Feb
Mar
Apr
May
Jun
Jul
Aug
Sep
Oct
Nov
Dec
07
07
07
07
07
07
07
07
07
07
07
07
22
22
22
22
34
44
57
91
113
15
17
19
22
26
30
34
30
30
30
30
30
30
30
30
45
60
60
60
46
81
012
14
16
18
20
24
28
32
187
18
7187
18
7187
187
187
187
270
374
374
374
221
22
3225
22
7229
231
233
235
335
457
461
465
22
22
22
23
23
23
23
23
33
46
46
47
169
55
16
95
5189
10
11
339
11
11
192
28
28
19
228
28
213
34
44
385
57
57
29
19
5197
35
200
202
20
201
290
73
404
408
55
33
33
33
33
33
33
33
56
50
42
42
55
50
50
60
50
50
55
50
62
71
71
71
94
90
85
97
90
81
86
98
120
141
144
147
205
17
2168
19
0173
164
173
181
237
263
257
259
-175
23
29
-155
28
38
-153
20
53
-190
148
149
Cu
mu
lati
ve
Sale
s
Rev
enu
es
Pro
ject
ed I
nco
me
Sta
tem
ents
($000's
)
New
Syst
ems
Ser
vic
es
Lic
ense
Fee
s
Sal
es
Gro
ss R
even
ues
Dir
ect
Op
erati
ng E
xp
ense
s
Sal
es C
om
mis
sio
ns
Inst
alla
tion C
ost
s
Tota
l
Gro
ss P
rofi
t
Sel
lin
g, G
ener
al
an
d A
dm
inis
trati
ve
Gen
eral
& a
dm
inis
trat
ion
Res
earc
h &
dev
elopm
ent
Sel
ling, m
arket
ing a
nd p
artn
ersh
ips
Tota
l
EB
ITD
A
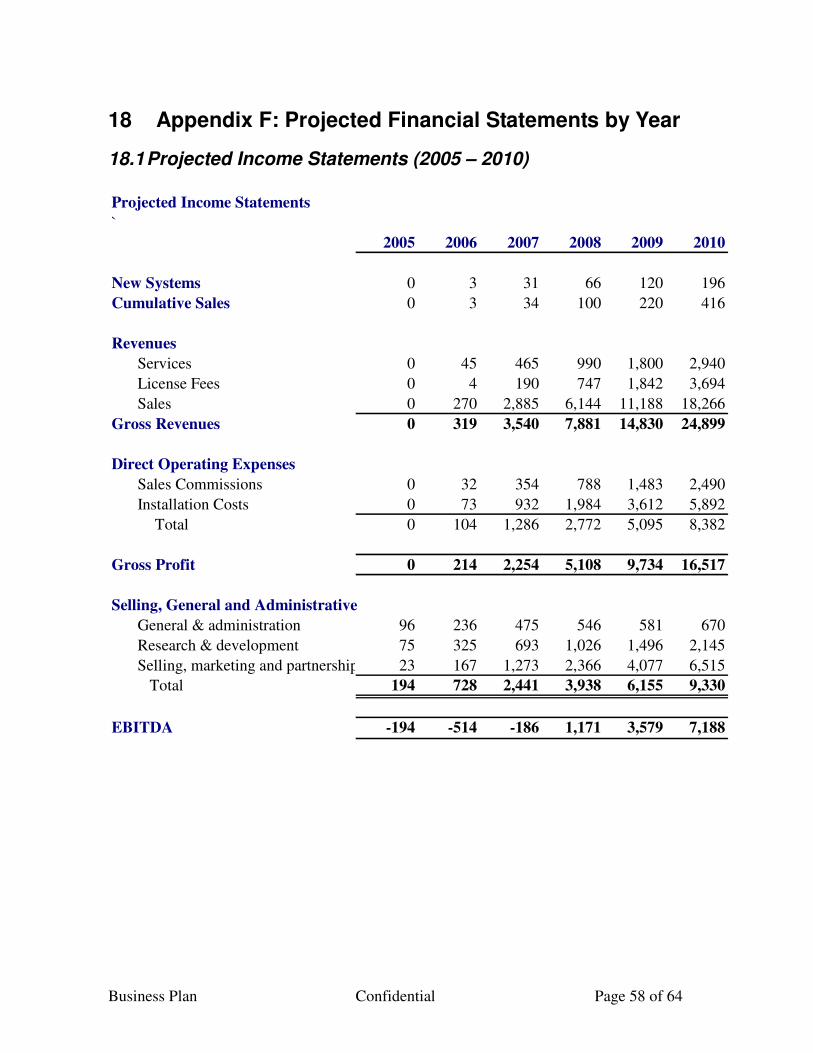
Business Plan Confidential Page 58 of 64
18 Appendix F: Projected Financial Statements by Year
18.1 Projected Income Statements (2005 – 2010)
2005 2006 2007 2008 2009 2010
New Systems 0 3 31 66 120 196
Cumulative Sales 0 3 34 100 220 416
Revenues
Services 0 45 465 990 1,800 2,940
License Fees 0 4 190 747 1,842 3,694
Sales 0 270 2,885 6,144 11,188 18,266
Gross Revenues 0 319 3,540 7,881 14,830 24,899
Direct Operating Expenses
Sales Commissions 0 32 354 788 1,483 2,490
Installation Costs 0 73 932 1,984 3,612 5,892
Total 0 104 1,286 2,772 5,095 8,382
Gross Profit 0 214 2,254 5,108 9,734 16,517
Selling, General and Administrative
General & administration 96 236 475 546 581 670
Research & development 75 325 693 1,026 1,496 2,145
Selling, marketing and partnerships 23 167 1,273 2,366 4,077 6,515
Total 194 728 2,441 3,938 6,155 9,330
EBITDA -194 -514 -186 1,171 3,579 7,188
Projected Income Statements
`
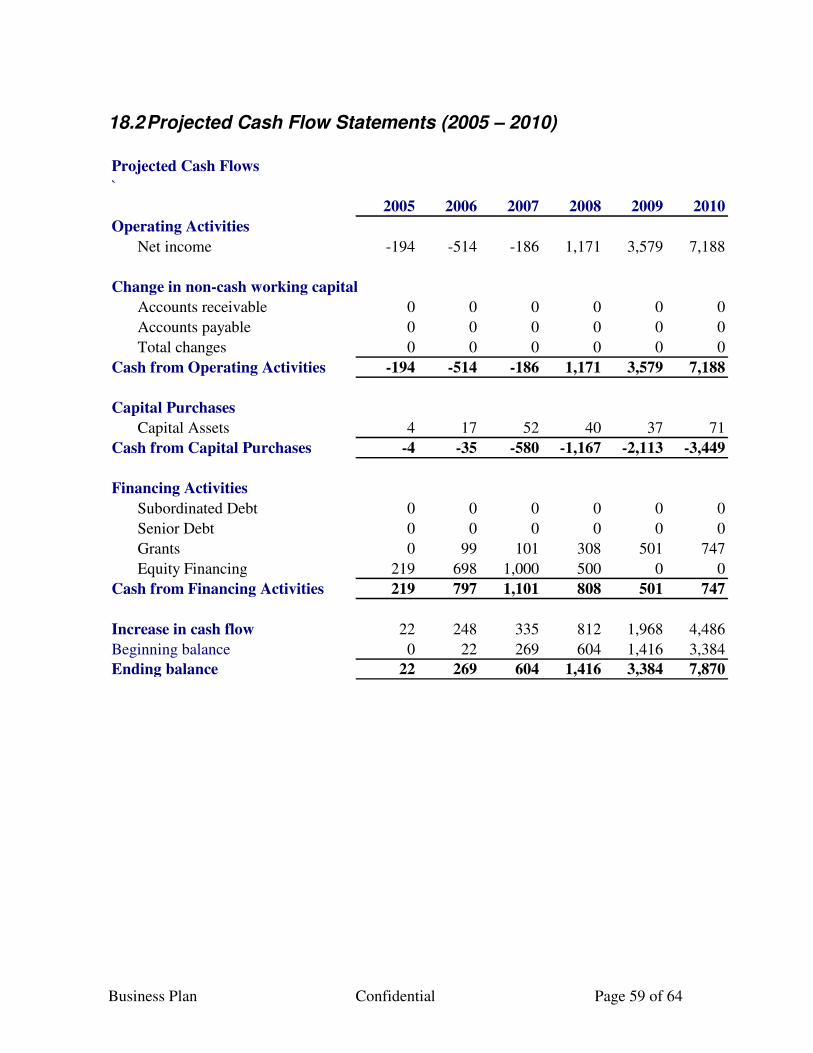
Business Plan Confidential Page 59 of 64
18.2 Projected Cash Flow Statements (2005 – 2010)
Projected Cash Flows
`
2005 2006 2007 2008 2009 2010
Operating Activities
Net income -194 -514 -186 1,171 3,579 7,188
Change in non-cash working capital
Accounts receivable 0 0 0 0 0 0
Accounts payable 0 0 0 0 0 0
Total changes 0 0 0 0 0 0
Cash from Operating Activities -194 -514 -186 1,171 3,579 7,188
Capital Purchases
Capital Assets 4 17 52 40 37 71
Cash from Capital Purchases -4 -35 -580 -1,167 -2,113 -3,449
Financing Activities
Subordinated Debt 0 0 0 0 0 0
Senior Debt 0 0 0 0 0 0
Grants 0 99 101 308 501 747
Equity Financing 219 698 1,000 500 0 0
Cash from Financing Activities 219 797 1,101 808 501 747
Increase in cash flow 22 248 335 812 1,968 4,486
Beginning balance 0 22 269 604 1,416 3,384
Ending balance 22 269 604 1,416 3,384 7,870
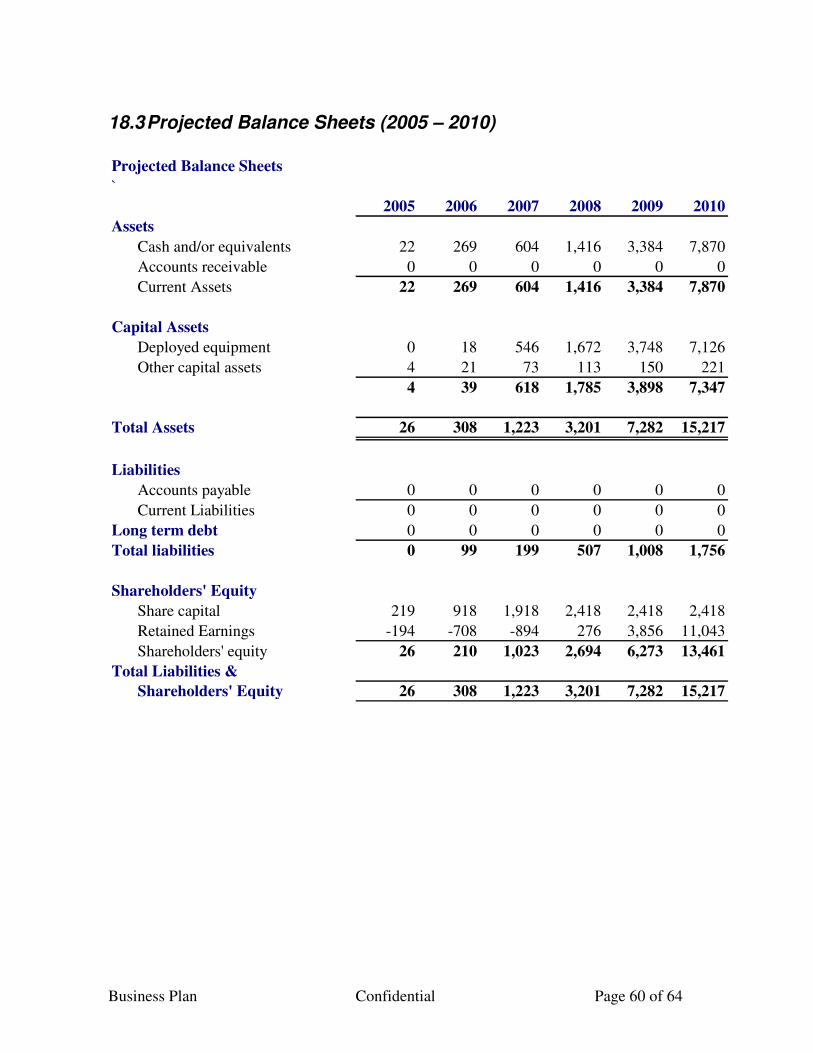
Business Plan Confidential Page 60 of 64
18.3 Projected Balance Sheets (2005 – 2010)
Projected Balance Sheets
`
2005 2006 2007 2008 2009 2010
Assets
Cash and/or equivalents 22 269 604 1,416 3,384 7,870
Accounts receivable 0 0 0 0 0 0
Current Assets 22 269 604 1,416 3,384 7,870
Capital Assets
Deployed equipment 0 18 546 1,672 3,748 7,126
Other capital assets 4 21 73 113 150 221
4 39 618 1,785 3,898 7,347
Total Assets 26 308 1,223 3,201 7,282 15,217
Liabilities
Accounts payable 0 0 0 0 0 0
Current Liabilities 0 0 0 0 0 0
Long term debt 0 0 0 0 0 0
Total liabilities 0 99 199 507 1,008 1,756
Shareholders' Equity
Share capital 219 918 1,918 2,418 2,418 2,418
Retained Earnings -194 -708 -894 276 3,856 11,043
Shareholders' equity 26 210 1,023 2,694 6,273 13,461
Total Liabilities &
Shareholders' Equity 26 308 1,223 3,201 7,282 15,217

Business Plan Confidential Page 61 of 64
19 Appendix G: Resumes for Sharon Barnes and Marty Brooks
19.1 Resume for Sharon Barnes
PROFILE
Seasoned technology leader with expertise in enterprise IT management, 6 Sigma quality improvement processes, high performance workplace development, and start up companies. EMPLOYMENT HISTORY
Chief Executive Officer RFind Systems, Inc Start up active RFID organization July 2005 - present Project Manager Identec Solutions Clients include Caterpillar, General Electric, Volkswagen, and UPS. July 2000-June 2005 President and Owner SB Operations, Built, managed and sold 2 retail operations. 1997-2000. Vice President of Technology Third Millennium Software Start up software development company delivering solutions to the custom home building industry. 1996-1997. President Tiger Claw Communications Managed technology start-up. 1991-1994. EDUCATION MBA (2005) Athabasca University AGDM (2004) Advanced Graduate Diploma In Management Athabasca University Arts (2004) Okanagan University College
Business Plan Confidential Page 62 of 64
Philosophy and Political Science Advanced Computer Systems (1995) British Columbia Institute of Technology Courses: Data Communications Computer Systems Technology Diploma (1991) British Columbia Institute of Technology Focus: Data Communications MEMBERSHIPS PMI, West Coast, BC Chapter Project Management Institute

Business Plan Confidential Page 63 of 64
19.2 Resume for Marty Brooks
PROFILE
Results oriented technology leader with expertise in hardware manufacturing, systems and process engineering, and 6 Sigma processes EMPLOYMENT HISTORY
Vice President of Technology RFind Systems, Inc Start up active RFID organization July 2005 - present Director of Operations Identec Solutions Active RFID manufacturer June 2000-July 2005 Project Lead ATCO Frontec Corporation Lead engineer on project to provide communications equipment to the Canadian Department of Defense. 1998-2000 EDUCATION
Bachelor of Science in Electrical Engineering (1998) University of Calgary MEMBERSHIPS
Registered Professional Engineer Association of Professional Engineers and Geoscientists of British Columbia