business in africa research series development of the ... · • in section 3, this paper proceeds...
TRANSCRIPT

Business in Africa Research Series
Development of the Textile Industry in
Kenya and Its Impact on the Balance of
Trade
July 2019
www.istanbulafrica.com

I
II
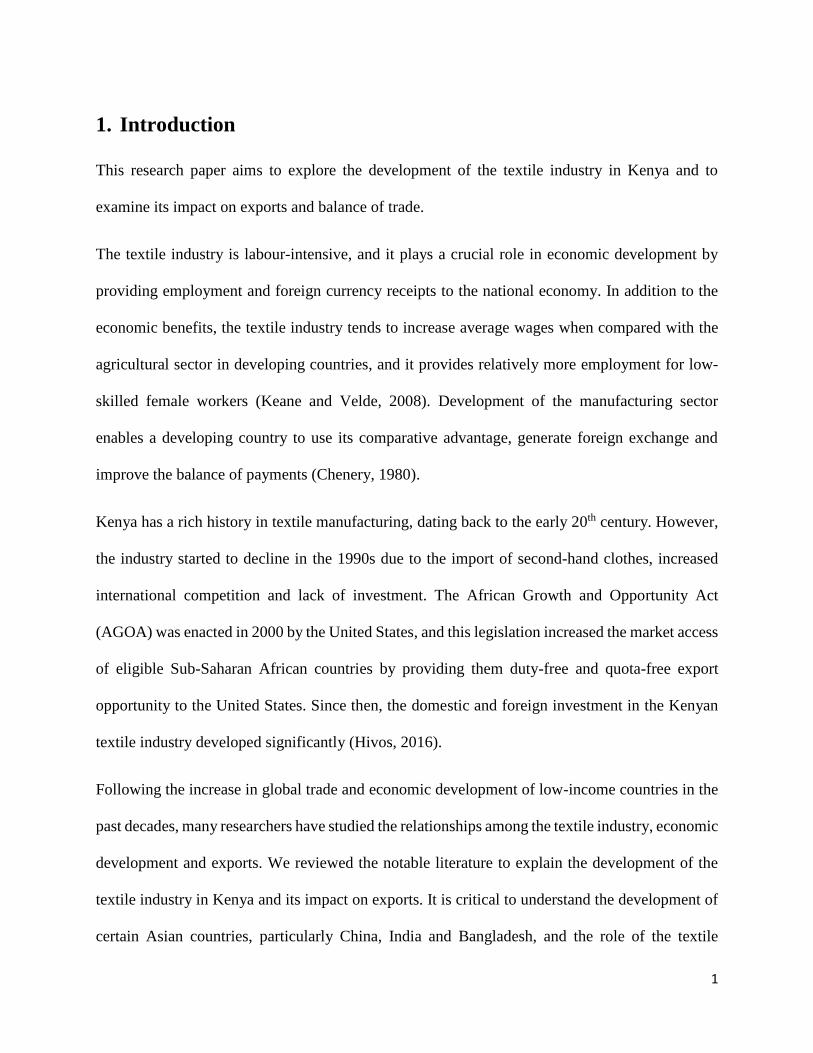
Executive Summary
The objective of this research paper is to investigate the relationship between the development of
the textile industry in Kenya and its impact on the balance of trade. The literature review suggests
that the textile industry has been a critical step in the industrialization of low-income countries.
The transformation from primary products to manufactured products leads to export diversification
and export growth, hence improves the balance of trade. The empirical analysis supports the
inferences of the literature review. Results of the data analysis demonstrate a strong relationship
between domestic textile manufacturing outputs and exports of processed textile products in
Kenya.
.
III
Contents
1. Introduction ............................................................................................................................. 1
2. Literature Review .................................................................................................................... 3
2.1. The Role of the Textile Industry in Economic Development .......................................... 3
2.2. The Relationship between Industrialization and Exports ................................................. 5
2.3. Development of the Textile Industry in Kenya and International Trends........................ 7
3. Data Analysis and Findings ................................................................................................... 14
3.1. Data Description ............................................................................................................. 14
3.2. Methodology .................................................................................................................. 19
3.3. Regression Results ......................................................................................................... 20
4. Conclusion ............................................................................................................................. 23
5. References ............................................................................................................................. 26
1
1. Introduction
This research paper aims to explore the development of the textile industry in Kenya and to
examine its impact on exports and balance of trade.
The textile industry is labour-intensive, and it plays a crucial role in economic development by
providing employment and foreign currency receipts to the national economy. In addition to the
economic benefits, the textile industry tends to increase average wages when compared with the
agricultural sector in developing countries, and it provides relatively more employment for low-
skilled female workers (Keane and Velde, 2008). Development of the manufacturing sector
enables a developing country to use its comparative advantage, generate foreign exchange and
improve the balance of payments (Chenery, 1980).
Kenya has a rich history in textile manufacturing, dating back to the early 20th century. However,
the industry started to decline in the 1990s due to the import of second-hand clothes, increased
international competition and lack of investment. The African Growth and Opportunity Act
(AGOA) was enacted in 2000 by the United States, and this legislation increased the market access
of eligible Sub-Saharan African countries by providing them duty-free and quota-free export
opportunity to the United States. Since then, the domestic and foreign investment in the Kenyan
textile industry developed significantly (Hivos, 2016).
Following the increase in global trade and economic development of low-income countries in the
past decades, many researchers have studied the relationships among the textile industry, economic
development and exports. We reviewed the notable literature to explain the development of the
textile industry in Kenya and its impact on exports. It is critical to understand the development of
certain Asian countries, particularly China, India and Bangladesh, and the role of the textile
2
manufacturing in their industrialization efforts. Finally, we elaborated the global trends that have
been shaping the industry. We discussed the consequences of the Multi-Fibre Agreement (MFA)
and the African Growth and Opportunity Act (AGOA) on Kenya and global markets.
We support the findings of the literature review with data analysis. In order to present the
relationship between the development of the textile industry and textile exports, we analyzed two
datasets. The first dataset is the total value-added of the textiles and clothing industry in Kenya,
sourced from the World Bank. The second dataset is the apparel (knitted or crocheted textile
products) exports of Kenya, sourced from the United Nations Comtrade. We aim to analyze the
correlation between domestic textile production and exports with a linear regression analysis.
The structure of this paper is as follows:
• Section 2 provides a review of academic literature. The literature review focuses on three
main topics. Firstly, we examine the role of the textile industry in economic development.
Secondly, we review the relationship between industrialization and exports. Finally, we
review the research paper focusing on the development of the textile industry in Kenya.
• In section 3, this paper proceeds to an empirical analysis of the Kenyan domestic textile
industry and clothing product exports. We conduct a linear regression between the value
added in the textiles industry and exports of knitted or crocheted textile products. The data
description and the main findings of the regression analysis are presented at the end of this
section.
• Section 4 summarizes our findings in light of past literature and empirical analysis. Finally,
we present recommendations on possible policy changes, limitations of this paper and areas
for further research.

3
2. Literature Review
This paper reviews prominent studies on
1. the role of the textile industry in economic development
2. the relationship between industrialization and exports
3. development of the textile industry in Kenya
2.1. The Role of the Textile Industry in Economic Development
Many researchers studied the role of the textile industry in economic development. In our literature
review, we focus on two influential papers: Brenton and Hoppe (2007) and Keane and Velde
(2008).
Brenton and Hoppe highlight the role of the textile industry in export diversification and economic
development (2007). The textile industry is considered as the first step in industrialization due to
its labour intensity, straightforward technology and small start-up costs. The characteristics of the
textile industry enable low-income countries to attract investment and to take the first steps in
industrialization. Furthermore, the textile industry has been the critical sector in export
diversification efforts in many countries which have reached the middle-income level, such as
Hong Kong, Singapore, Taiwan, South Korea, Indonesia, Sri Lanka and Vietnam. According to
Brenton and Hoppe, the textile industry unlocks the economic development by employing a large
number of unskilled workers from rural areas, providing a base for more technological activities
in other sectors and generating foreign exchange to import more advanced technologies (2007).
Brenton and Hoppe highlight the critical challenges in attracting textile industry investments for
low-income countries (2007). Notably, infrastructural and political issues might prevent
developing countries from exporting their products and might cause them to face higher trade-
4
related costs. Strategic trade policies, efficient institutions, reliable infrastructure and presence of
internationally integrated finance system are the necessary conditions for attracting textile
investments to low-income countries. In the case of Kenya, the labour costs are almost two-thirds
of China and are on par with India. However, the cost advantage of Kenya is undermined by
infrastructural and political barriers. According to the World Bank’s Investment Climate
Assessment, the leading investment barriers for Kenya are the high rate of corruption and poor
infrastructure. These barriers require investors to incur higher non-core business related costs and
diminish the competitiveness of Kenya. (Keane and Velde, 2008)
The paper of Keane and Velde focuses on the economic and social impacts of the textile industry
(2008). They highlight the short-run impacts of the textile industry, such as providing employment
and generating foreign currency receipts. The textile industry is considered as the first step in the
development ladder due to its labour-intensive and low initial investment characteristics. The
textile industry requires unskilled workforce, and the primary determinant of the costs is the
average wage level. According to the trade data, the low and middle-income countries are
accounted for half of the global textile exports. Usually, these developing countries are net-
exporters of textiles, and countries such as Vietnam and Mauritius reached the middle-income
status thanks to the industrialization in the textile industry.
In terms of social aspects, Keane and Velde argue that the textile industry increases the average
wages when compared with the agriculture sector (2008). Especially, unskilled women can earn
more in the textiles industry compared to the positions in other sectors. The relationship between
the education enrolment data and the total share of textile exports in the total manufacturing
exports suggests that the countries with higher average education level have less percentage share
5
of textiles in total manufacturing exports (except Madagascar). It can be concluded that the
emergence of the textile industry can increase the employment of unskilled workers.
In addition to the job creation for unskilled workers, the textile industry favours the women
workforce compared to other manufacturing areas (Keane and Velde, 2008). The share of female
workers is higher in textile exporting Asian countries, reaching up to 90% in Bangladesh and
Cambodia.
2.2. The Relationship between Industrialization and Exports
The unidirectional and bidirectional causalities between industrialization and export expansion
have been studied in several papers. Certain studies which examined the interactions between the
development of the manufacturing industry and exports are reviewed in this section.
Hollis B. Chenery discussed the importance of export-led strategies in economic development
(1980). The empirical analysis of newly industrialized countries in the 1970s highlights the effect
of trade strategy on industrialization. He concludes that import substitution is vital in the early
steps of industrialization. However, with the implementation of export-led trade policies,
developing countries can leverage their comparative advantage and accelerate their
industrialization pace. The transformation from the exports of primary products to manufactured
products is an essential source of foreign exchange and improves the balance of payment (Chenery,
1980).
One of the prominent papers in export-led economic growth was written by Bela Balassa, a
consultant at the World Bank (1977). He studied the causal relationship between economic growth
and exports. He analyzed the economic growth rate of developing countries with regards to their
trade policy strategies. The exports and economic activities of countries with export-oriented
6
policies outperformed the countries with inward-oriented (import substitution) countries. The
results of the paper provide evidence to the advantage of export-oriented trade policies in economic
growth. The expansion of exports improves the balance-of-payments and thus increases country
attractiveness (Balassa, 1977).
The causality between exports and industrialization was further reviewed by Peter C.Y. Chow
(1986). In this paper, Sims’ causality test was used to predict the impact of industrial development
on export growth in selected newly industrializing countries (NICs). Regression analysis
determined the causal relationship between exports of manufactured products and the growth of
domestic manufacturing outputs. According to the Sims bivariate model, the bidirectionality of the
causal relationship is measured by looking at the coefficients of the future value of exports (Sims,
1972). Chow analyzed the trade and manufacturing output data of eight newly industrializing
countries: Singapore, Korea, Taiwan, Brazil, Hong Kong, Argentina, Israel and Mexico (1986).
The results of the paper exhibit a bidirectional relationship between the growth of exports and the
development of manufacturing industries in the six out of eight selected countries. The paper
concludes that the export-led trade strategies and industrial development reinforce each other,
especially in the small economies such as Korea, Hong Kong, Taiwan, Singapore and Israel. This
finding is consistent with the a priori assumption of the limited domestic demand of these countries
and lack of the economies of scale without international markets. In conclusion, the countries with
the small domestic market can use export-led trade strategies to leverage their competitive
advantage and reinforce their industrial development (Chow, 1986).
Chia Yee Ee writes the final paper that we review, and it highlights the evidence of export-led
growth strategies in selected Sub-Saharan African countries (2015). In this paper, the validity of
the above export-led growth hypothesis was tested throughout 1985 and 2014 in Botswana,
7
Equatorial Guinea and Mauritius. The empirical results show that there is a high statistical
significance between export-led trade strategies and economic growth. Additionally, it was
concluded that the degree of export diversification and economic development of a country are
positively correlated. Finally, the paper suggests recommendations for policymakers to maintain
sustainable economic growth. The suggested recommendations are keeping up the macroeconomic
environment reliable and improving the infrastructure (Ee, 2015).
2.3. Development of the Textile Industry in Kenya and International Trends
We divided the literature review on the development of the textile industry in Kenya and
international trends in the industry into three subsections:
1. History of the Kenyan Textile Industry and its Current Snapshot
2. International Trends in the Textile Industry
3. Competitiveness of the Textile Industry in Kenya
2.3.1. History of the Kenyan Textile Industry and its Current Snapshot
Kenya has a long history of textile production. In the mid-1950s, more than 70 enterprises were
active in the textile industry, employing almost 2,500 workers (Ngulu, 2010). Following the
independence in 1963, trade policies favouring the import substitution were implemented, and
100% duty tariffs were imposed on imported products. In this era, the local producers enjoyed an
advantage against the global competition in the domestic market and the textile industry grew
rapidly. With the presence of African cultural trends, local clothes (Kitenge) were highly
demanded (Mangieri, 2006).
In the 1980s, the textile industry in Kenya reached its peak production and employment level. The
industry used to be the source of income for 200,000 households and accounted for 30% of the

8
total manufacturing workforce (Mangieri, 2006). In 1984, the government initiated a policy
reform and substituted the import substation trade policies with export-led growth policies. As a
result of the policy, Export Processing Zones (EPS) were constructed and export promotion
schemes were implemented (Ngulu, 2010).
In the 1990s, textile production failed dramatically due to liberalization efforts. The import of
second-hand clothes, increased international competition, lack of machinery investment and rising
production costs made domestic production uncompetitive (Mangieri, 2006).
In 2000, the introduction of the Africa Growth and Opportunity Act (AGOA) by the United States
helped the textile industry in Kenya to grow again. AGOA offered crucial advantages for Sub-
Saharan Africa countries in accessing the United States markets by abolishing import duties and
quotas. The exports increased significantly until 2005 and new jobs were created. In 2014, more
than $380M of textile products were exported to the United States, accounting for 95% of total
textile exports (Hivos, 2016). AGOA is still in effect, and it offers advantageous market access to
more than 40 Sub-Saharan African countries. The scope of the agreement includes the following
items: textile products, specific motor vehicle components, agricultural products, certain
chemicals, steel and other selected products (Ngulu,2010). During this period, major Asian
investors from China and India invested in Kenyan textile industry in order to reach the US market.
The foreign direct investment was supported by government efforts, such as creating new Export
Processing Zones (Hivos, 2016).
The member countries of the General Agreement on Tariffs and Trade (GATT) signed the
Agreement on Textiles and Clothing (ATC) in 1994, which terminated the Multi-Fibre Agreement
(MFA) in 1995. With the implementation of ATC from 1995 to 2005, the use of textile quotas was
gradually discontinued. The end of the MFA quota system negatively affected the textile industry
9
for Sub-Saharan African countries, including Kenya. The Asian countries enjoyed quota-free
access to main textile importing countries, and Kenya lost one of its trade advantages against them.
Decreased investment from Asian countries to Kenya and increased textile imports from Asian
countries caused the Kenyan textile industry to suffer significantly. China increased its total market
share in Kenya, from 10% to 33.5% in 2008 (Ngulu, 2010).
The current snapshot of the textile industry in Kenya is promising. According to the research of
Hivos, there are 22 large foreign direct investments in the EPZs, 170 medium and large companies,
more than 75,000 SMEs and several companies in the verticals of the clothing industry, such as
weaving, spinning and knitting companies (2016). As of 2018, the manufacturing sector constitutes
more than 20% of the GDP and employs more than 300,000 workers in the formal sector and
around 4 million workers in the informal sector (Kimemia, 2018). The textile industry also
supports the development of related industries such as chemicals, agriculture and other
manufacturing industries.
The establishment of the Cotton Development Authority in 2006 by the Kenyan government has
been reinforcing the coordination efforts within the industry. The government has been evaluating
the key pillars intending to create more employment opportunities and increase the value added in
the textile sector. The cotton growers are subsidized in the form of seed provision and advisory
services (Chemengich, 2013).
The domestic survey that was conducted on the Hivos paper highlights the snapshot of the textile
manufacturers in Kenya as of 2016 (Hivos, 2016). The survey results suggest that the vertical
processes of production in the textile industry are fragmented and the contribution of the textile
industry to the GDP is far lower than its full potential.
10
The Kenya Vision 2030, the long-term development blueprint of the country, aims to transform
Kenya into a middle-income country by creating competitive markets. There are essential
transformation projects which will affect textile industry positively, such as improving logistics
infrastructure and creation of new Special Economic Zones.
2.3.2. International Trends in the Textile Industry
The trends in the textile production changed dramatically following the phase-out of the Multi-
Fibre Agreement (MFA) in 1994 and the expiration of the Agreement on Textiles and Clothing in
2005. China, India and Bangladesh began to increase their significance in the global textile
industry, as a result of the termination of quotas on textile products.
The MFA was signed in 1974 and provided the developed countries with the right to impose quotas
on textile imports. The MFA was frequently renewed until 1994, although it was initially
implemented as a short-term measure. In 1994, ATC replaced the MFA and gradually terminated
the quotas on textile imports. With the MFA, developed countries enjoyed the protection of their
textile industry before opening to the developing countries. Due to the high labour-intensity of the
textile industry and lower wages in the developing countries, the developed countries are
disadvantaged against developing countries. (Morris and Barnes, 2008)
When the MFA was in effect, the textile production was distributed to countries where quotas were
under-utilized. The countries which exhausted their quotas, especially China, India and Indonesia,
invested in countries with little textile production to use their quotas. For example, Hong Kong
clothing businesses invested in factories in Mauritius, and Korean and Taiwanese businesses
invested in the Caribbean and Sub-Saharan Africa (Morris and Barnes, 2008). Consequently, the
developing countries with very little textile industry found the opportunity to increase their
11
manufacturing exports. However, these investments in Sub-Saharan African countries focused on
the assembly type of textile production and failed to create impactful industrialization (Traub-
Merz and Jauch, 2006).
Four decades of textile imports protection period ended after the expiration of MFA and ATC.
Currently, the textile trade became a part of the World Trade organization system, governed by
general rules. The abolition of quotas paved the way of the domination of China, India and
Bangladesh in the world textile exports. The rise of Asian countries was at the expense of other
middle-income countries, such as South Africa and Turkey, which faced significant drops in textile
exports. The Sub-Saharan African countries were also negatively affected, but not as much as
middle-income textile exporting countries (Morris and Barnes, 2008).
The strategy to build the Export Processing Zones (EPZs) was adopted in the 1990s by several
countries, including Mauritius, Mexico, China and the Philippines. The governments provide EPZs
with incentives to attract foreign investments. These incentives usually cover tax holidays, duty-
free importation, lower cost of infrastructural costs, etc. The EPZ framework was adopted by
several African countries, including Kenya, Zimbabwe, Swaziland, Zambia and Zimbabwe
(Traub-Merz and Jauch, 2006).
Today, the African countries have a competitive advantage in the textile industry thanks to low
wage levels and abundance of low-skilled workers. The increase in the production costs in Asian
countries offers important opportunities for Sub-Saharan African countries to leverage their cost
advantage and develop their clothing industry.
12
2.3.3. Competitiveness of the Textile Industry in Kenya
Recent research papers on the competitiveness of Kenyan textile industry highlight similar
advantages and challenges. The main advantages of Kenya are lower wage level, a pool of
unskilled young workers, quota-free and duty-free export opportunity to the United States and
potential to expand on more value-added operations (Hivos, 2016).
However, there are still many challenges which prevent Kenya from reaching its full potential.
Some of these challenges are the high cost of production, raw material shortage, obsolete
technology, high taxation and lack of government policies.
The high cost of production arises from several reasons. Firstly, the electricity cost in Kenya is
much higher than its competitors. According to the paper by Kimemia, the electricity cost accounts
for around 35% of the total cost of fabric production in Kenya (2018). The cost of electricity in
Kenya is 18-20 USD cents per kWh. The electricity cost in regional competitors is 5 cents for
Ethiopia and 14 cents for Uganda. Electricity cost per kWh in Asian countries are 8 cents for
China, 12 cents for India and 7 cents for Bangladesh (Chemengich, 2013). Hence, the electricity
cost is approximately twice as expensive as the average cost of its competitors. Secondly, credit
interests from the financial institutions are significantly high in Kenya, with interest rates ranging
from 15% to 21%. Moreover, loan maturities are shorter in Kenya, usually shorter than seven years
(Konishi et al., 2015). Thirdly, the distance of Kenya from the main import markets and the high
logistics fares negatively affect the textile companies. A shipping container from Kenya to the
United States costs over $2,000, and the shipping time is more than the same container from China,
South Africa or India (Konishi et al., 2015).
13
Kenya imports the necessary raw materials, specifically cotton, from Sudan, Egypt, Uganda and
Tanzania. Since the raw material constitutes one-third of the total cost, the dependence on imported
goods and price fluctuation impose extra costs on textile manufacturing companies (Kimemia,
2018). Furthermore, the old machinery at the factories decreases efficiency and increases the
overall costs. According to Kimemia, 60% of spindling machines in Kenya is older than 25 years
(2018).
In her paper, Kimemia proposes five main recommendations to overcome the above challenges
(2018):
• Provision of training to potential textile workers, with joint efforts from the public and
private sector.
• Support for SMEs in the textile industry and opening their path to exports.
• Creation of regional networks among Sub-Saharan African countries to share experience.
• Identification of potential value added in the textile value chain.
• Coordination among the stakeholders in the textile industry, including cotton farmers, raw
material processors and apparel manufacturers.
14
3. Data Analysis and Findings
3.1. Data Description
Two datasets from two different data sources were used to conduct regression analysis between
the contribution of the textile industry in the GDP and exports of processed textile products.
Firstly, the data of value added in the textiles and clothing industry were used as a measure of the
development of the textile industry in Kenya. We downloaded the data from the World Bank Group
online data center (https://data.worldbank.org). We accessed the Textiles and Clothing (% of value
added in manufacturing) and Manufacturing, value added (current US$) datasets. The combination
of these two datasets provided us with the total value added in the textiles and clothing industry in
Kenya. The data period is from 1964 to 2016, with annual entries.
The Development Data Group of the World Bank is responsible for statistical and data reporting.
They publish several macroeconomic and sectoral databases. To keep the data relevant and
reliable, they are regularly compiled correctly under certain standards and guidelines.
Secondly, we used the United Nations Comtrade Database to access the detailed trade data of
Kenya (https://comtrade.un.org). We exported the trade data according to the HS92 classification
of the Harmonized Commodity Description and Coding Systems (HS) with annual frequency. To
measure the impact of the domestic textiles industry on exports, we only included the knitted or
crocheted textile products (products with HS92 code between 6100 and 6199). The data present
the annual exports of knitted or crocheted textile products in Kenya between 1994 and 2017.
The United Nations Comtrade is the shorter name of United Nations International Trade Statistics
Database. Reporter countries provide the Statistics Division of the United Nations with their yearly
15
foreign trade statistics data. The data include commodities/service categories and partner countries.
All commodity values are converted to the United States Dollar using the local exchange rate.
The Harmonized Commodity Description and Coding System is internationally accepted to
classify traded goods. In the HS system, the goods are classified by six-digit codes. The level of
detail decreases as the digit of the codes decrease. For example, the HS code of Knit Active Wear
products is 6112, and a more detailed product within this category is Knit Track Suits of Synthetic
Fibres with the HS code 611212. We used four-digit codes in order to filter the processed textile
products in our analysis.
The sources of both datasets are reliable, and we used the available data as of May 2019. To be
consistent, the nominal US$ is used in both datasets. Finally, the data to be analyzed covers the
period from 1994 to 2016.
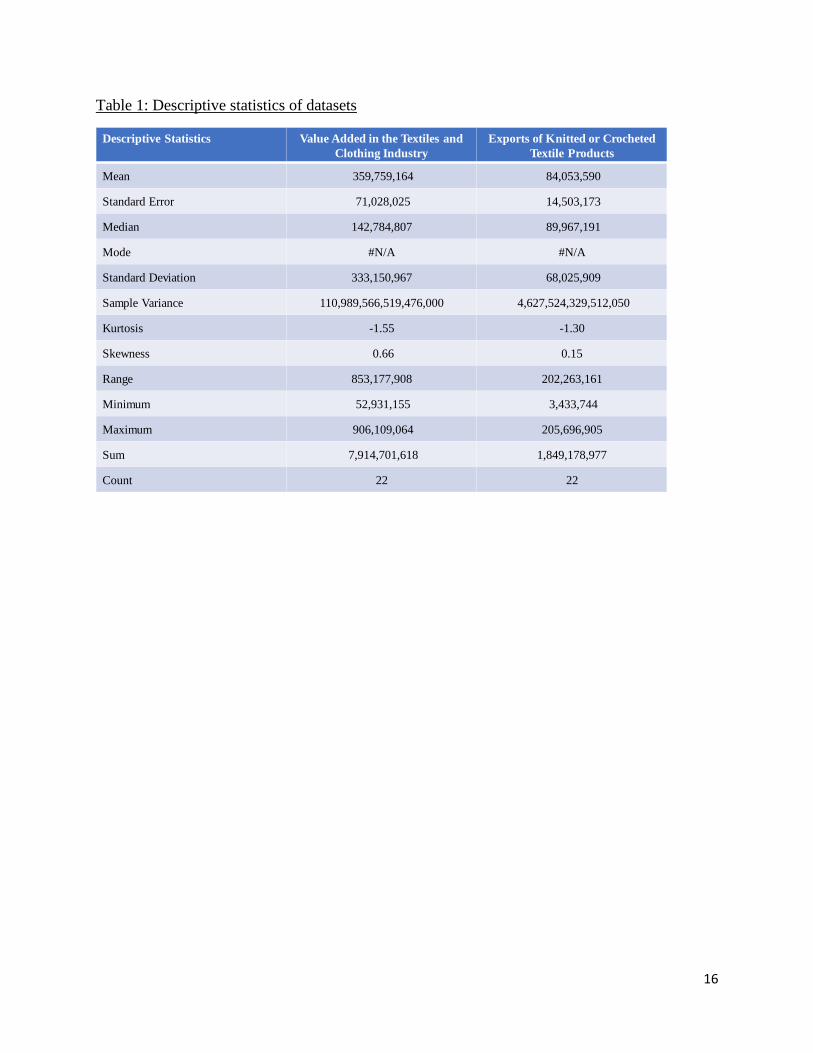
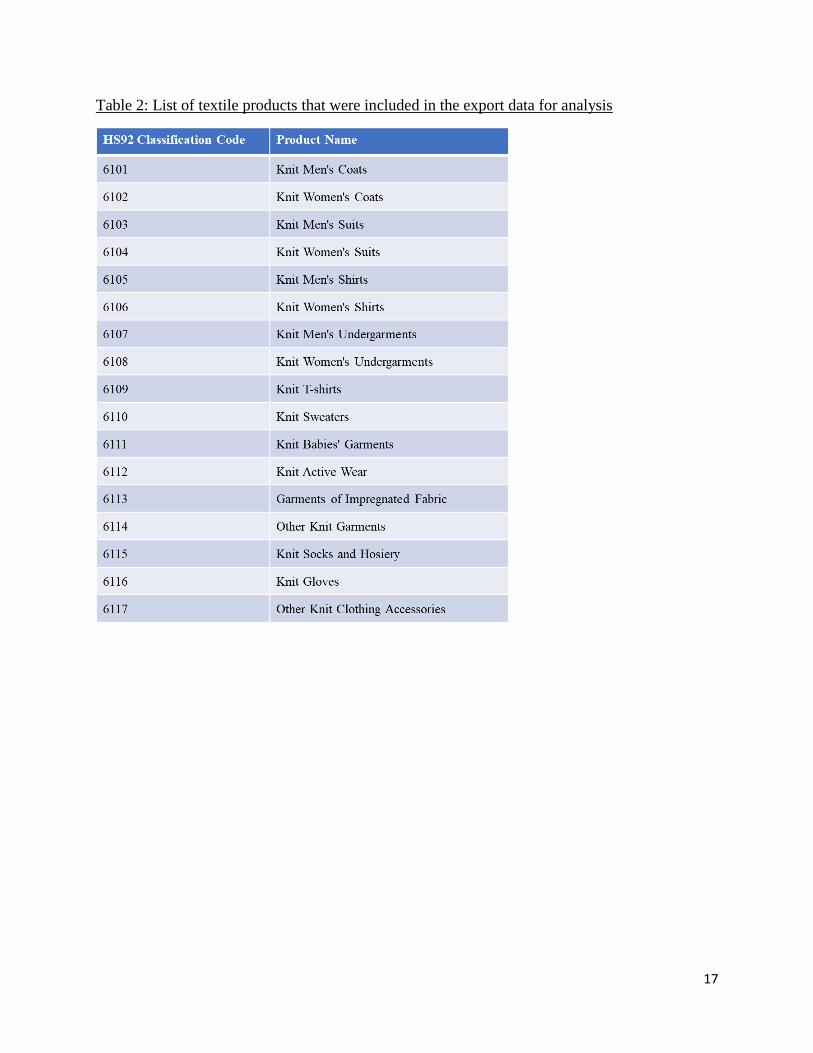
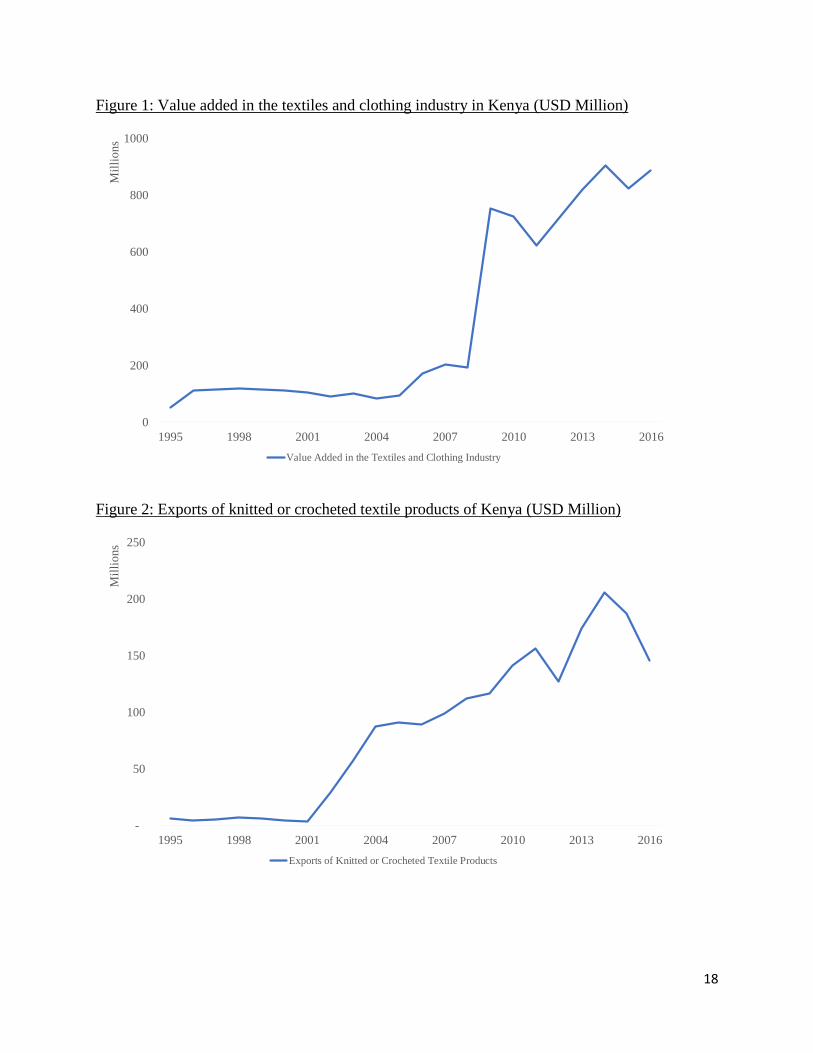
The descriptive statistics of the two datasets are presented in Table 1. Table 2 displays the complete
list of textile products that were included in the export dataset. Figure 1 presents the evolution of
the value added in the textiles and clothing industry in Kenya. Figure 2 illustrates the annual
exports of knitted or crocheted textile products of Kenya.
16
Table 1: Descriptive statistics of datasets
Descriptive Statistics Value Added in the Textiles and
Clothing Industry
Exports of Knitted or Crocheted
Textile Products
Mean 359,759,164 84,053,590
Standard Error 71,028,025 14,503,173
Median 142,784,807 89,967,191
Mode #N/A #N/A
Standard Deviation 333,150,967 68,025,909
Sample Variance 110,989,566,519,476,000 4,627,524,329,512,050
Kurtosis -1.55 -1.30
Skewness 0.66 0.15
Range 853,177,908 202,263,161
Minimum 52,931,155 3,433,744
Maximum 906,109,064 205,696,905
Sum 7,914,701,618 1,849,178,977
Count 22 22
17
Table 2: List of textile products that were included in the export data for analysis
18
Figure 1: Value added in the textiles and clothing industry in Kenya (USD Million)
Figure 2: Exports of knitted or crocheted textile products of Kenya (USD Million)
0
200
400
600
800
1000
1995 1998 2001 2004 2007 2010 2013 2016
Mil
lions
Value Added in the Textiles and Clothing Industry
-
50
100
150
200
250
1995 1998 2001 2004 2007 2010 2013 2016
Mil
lions
Exports of Knitted or Crocheted Textile Products
19
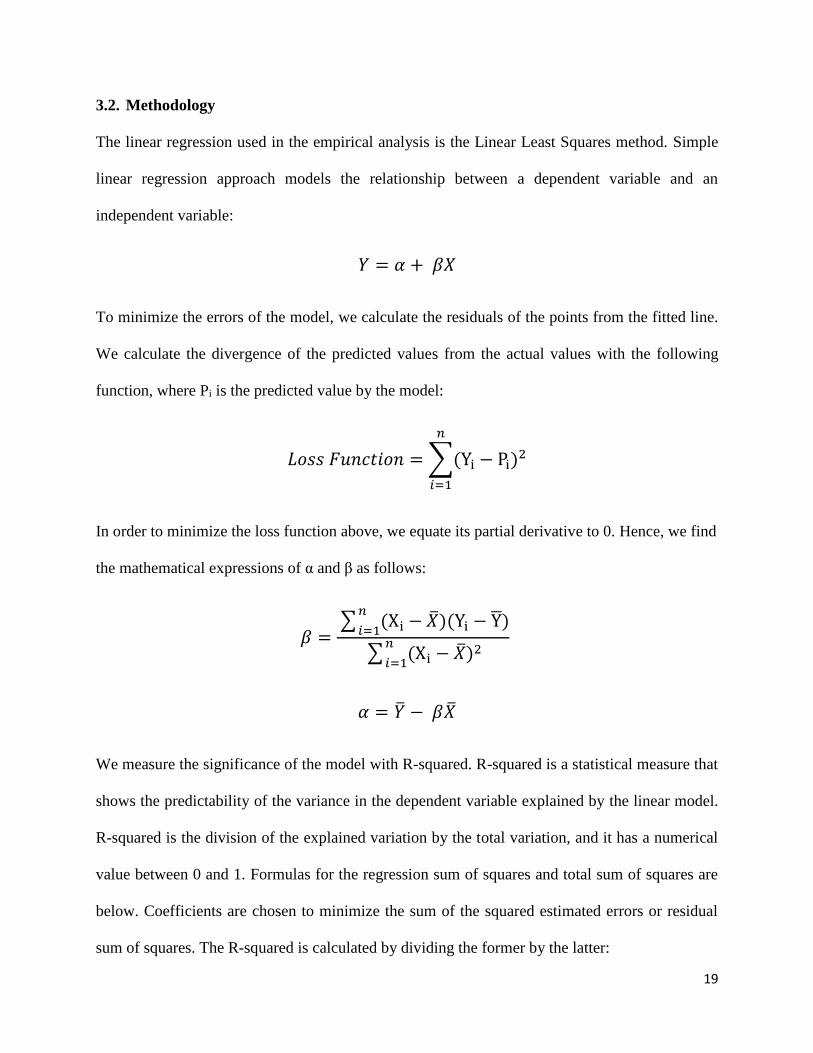
3.2. Methodology
The linear regression used in the empirical analysis is the Linear Least Squares method. Simple
linear regression approach models the relationship between a dependent variable and an
independent variable:
𝑌 = 𝛼 + 𝛽𝑋
To minimize the errors of the model, we calculate the residuals of the points from the fitted line.
We calculate the divergence of the predicted values from the actual values with the following
function, where Pi is the predicted value by the model:
𝐿𝑜𝑠𝑠 𝐹𝑢𝑛𝑐𝑡𝑖𝑜𝑛 = ∑(Yi − Pi)2
𝑛
𝑖=1
In order to minimize the loss function above, we equate its partial derivative to 0. Hence, we find
the mathematical expressions of α and β as follows:
𝛽 =∑ (Xi − �̅�)(Yi − Y̅
𝑛
𝑖=1)
∑ (Xi − �̅�)2𝑛
𝑖=1
𝛼 = �̅� − 𝛽�̅�
We measure the significance of the model with R-squared. R-squared is a statistical measure that
shows the predictability of the variance in the dependent variable explained by the linear model.
R-squared is the division of the explained variation by the total variation, and it has a numerical
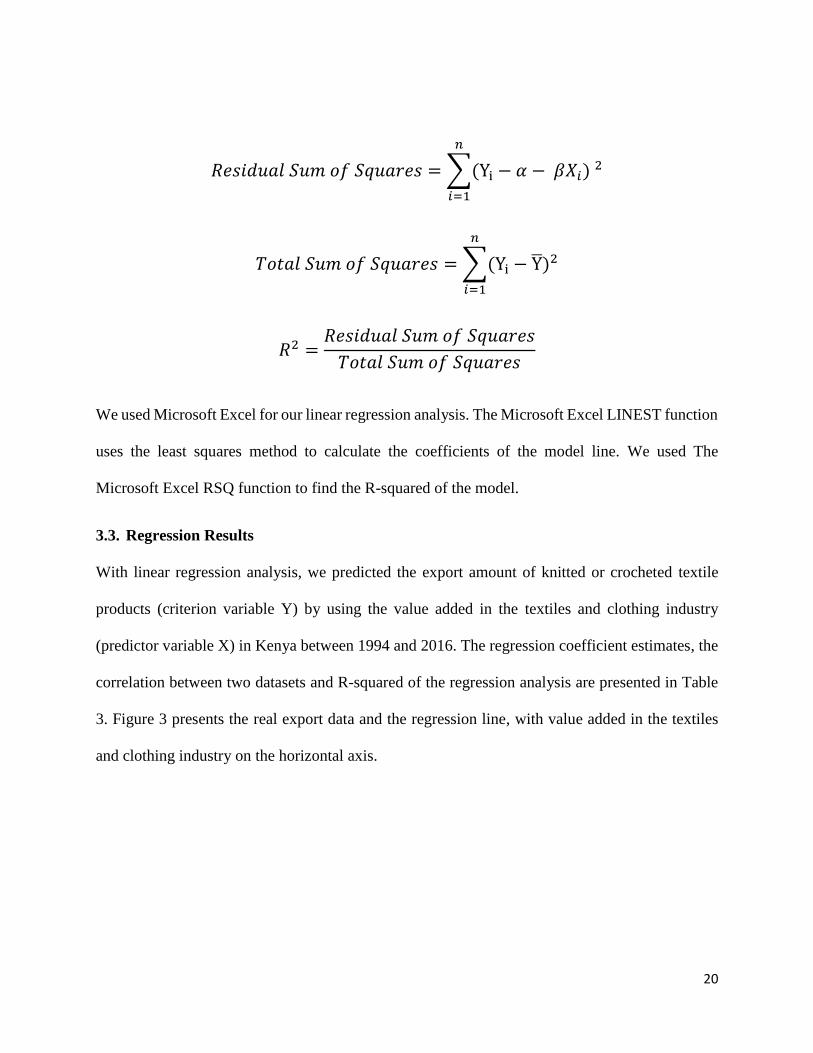
value between 0 and 1. Formulas for the regression sum of squares and total sum of squares are
below. Coefficients are chosen to minimize the sum of the squared estimated errors or residual
sum of squares. The R-squared is calculated by dividing the former by the latter:
20
𝑅𝑒𝑠𝑖𝑑𝑢𝑎𝑙 𝑆𝑢𝑚 𝑜𝑓 𝑆𝑞𝑢𝑎𝑟𝑒𝑠 = ∑(Yi − 𝛼 − 𝛽𝑋𝑖) 2𝑛
𝑖=1
𝑇𝑜𝑡𝑎𝑙 𝑆𝑢𝑚 𝑜𝑓 𝑆𝑞𝑢𝑎𝑟𝑒𝑠 = ∑(Yi − Y̅
𝑛
𝑖=1
)2
𝑅2 =𝑅𝑒𝑠𝑖𝑑𝑢𝑎𝑙 𝑆𝑢𝑚 𝑜𝑓 𝑆𝑞𝑢𝑎𝑟𝑒𝑠
𝑇𝑜𝑡𝑎𝑙 𝑆𝑢𝑚 𝑜𝑓 𝑆𝑞𝑢𝑎𝑟𝑒𝑠
We used Microsoft Excel for our linear regression analysis. The Microsoft Excel LINEST function
uses the least squares method to calculate the coefficients of the model line. We used The
Microsoft Excel RSQ function to find the R-squared of the model.
3.3. Regression Results
With linear regression analysis, we predicted the export amount of knitted or crocheted textile
products (criterion variable Y) by using the value added in the textiles and clothing industry
(predictor variable X) in Kenya between 1994 and 2016. The regression coefficient estimates, the
correlation between two datasets and R-squared of the regression analysis are presented in Table
3. Figure 3 presents the real export data and the regression line, with value added in the textiles
and clothing industry on the horizontal axis.
21
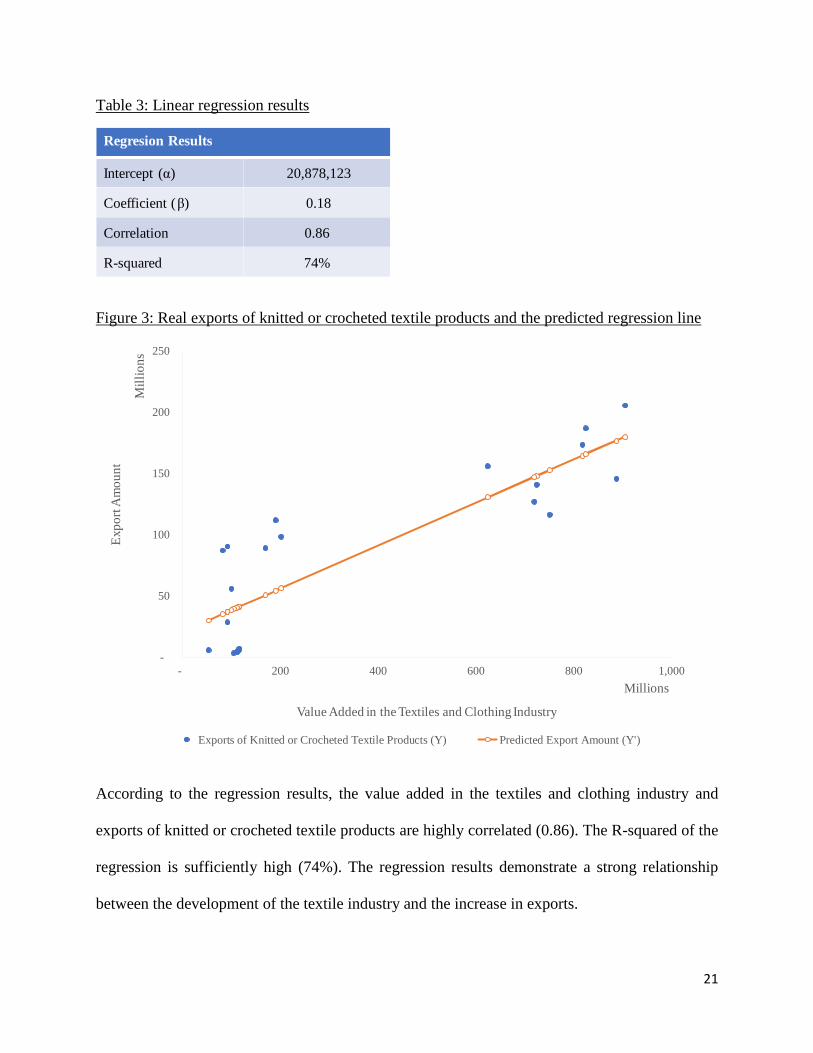
Table 3: Linear regression results
Figure 3: Real exports of knitted or crocheted textile products and the predicted regression line
According to the regression results, the value added in the textiles and clothing industry and
exports of knitted or crocheted textile products are highly correlated (0.86). The R-squared of the
regression is sufficiently high (74%). The regression results demonstrate a strong relationship
between the development of the textile industry and the increase in exports.
Regresion Results
Intercept (α) 20,878,123
Coefficient (β) 0.18
Correlation 0.86
R-squared 74%
-
50
100
150
200
250
- 200 400 600 800 1,000
Exp
ort
Am
ou
nt
Mil
lio
ns
Value Added in the Textiles and Clothing Industry
Millions
Exports of Knitted or Crocheted Textile Products (Y) Predicted Export Amount (Y')
22
The model predicts the exports better when the value added in the textile industry is more than
$600M after 2009. The residuals are smaller compared to the higher divergence between the
predicted line and the actual values before 2009. One of the possible explanations of this pattern
can be the faster adaptation of the textile exports to the implementation of the AGOA in 2000. The
textile exports increased significantly two years after the AGOA. However, the value added in the
domestic production did not change significantly until 2009.
According to the model coefficient, $1B of increase in the domestic textile outputs translates into
a $180M growth in processed textile exports.

23
4. Conclusion
Development of the textile industry in Kenya improved the balance of trade by increasing textile
exports. Moreover, the global textile industry exhibits quick and significant reactions to the
changes in the competitive advantages of countries. The increased competitive advantage of Kenya
following the enaction of the African Growth and Opportunity Act in 2000 had a significant impact
on the textile exports.
This paper combined the review of past studies on three interconnected topics: the role of the
textile industry in economic development, the causal relationship between industrialization and
development of the textile industry in Kenya and the rest of the world. The literature review
suggests that the textile industry has been an early step in industrialization and export
diversification. Moreover, the export diversification and expansion in manufactured products have
a positive impact on increasing exports. The past studies on the development of the textile industry
in Kenya and major Asian countries support the above inferences.
Secondly, our empirical analysis reinforces the conclusions of the paper. The exports of knitted or
crocheted textile products jumped from $4M in 2000 to $28.6M in 2002. The rate of exports
growth was maintained at $90.6M in 2005 and $140.9 in 2010. Regression analysis between the
value added in the textile industry and exports of knitted or crocheted textile products support the
inferences from the literature review regarding industrialization and exports. The growth of the
value added in the textile industry coincides with the increase in exports, and they are highly
correlated.
Finally, our data analysis exhibits that the textile exports reacted more rapidly to the enaction of
AGOA than the value added in the textile industry. One possible explanation of this pattern can be
24
the investment by foreign companies on assembly type of production. The assembly type of
production might have a lagged impact on the value added in the industry.
Considering the discussions in the past studies and conclusions of our paper, we offer the
following recommendations for sustainable growth of the textile industry in Kenya:
• Implementation of export-led trade policies with clear objectives and incentives.
• Further negotiations for Free Trade Agreements with textile-importing countries to attract
foreign investments and boost exports.
• Development of all processes of the textile value chain with better coordination among
key stakeholders, such as cotton farmers, raw material processors, cloth manufacturers,
designers and the government.
• Infrastructure investments to lower the costs and increase reliability.
• Provision of training programmes to increase labour productivity.
The empirical analysis in this paper has potential limitations. Although we found a high R-squared
in the regression analysis, the sample size is small, and we only analyzed one country. Hence, the
analytical results of the sample data might not be representative of a wider population. Secondly,
we decided to include only knitted or crocheted textile products as a measure of textile exports
processed by the domestic industry. This approach might be incomplete or inadequate in
measuring the real output and exports of the domestic textile industry. Finally, the development
experience of Asian countries through export-led textile industrialization might not hold for Kenya
and other Sub-Saharan African countries due to the changing global trends, dynamic business
environment and unique characteristics of countries. Notably, inadequate infrastructure and
25
macroeconomic instability in the Sub-Saharan African countries can hinder the development of
the textile industry.
We identified two areas for further research. Firstly, the development of the industry across the
value chain is needed to be analyzed with sector-specific data. Kenya National Bureau of Statistics,
regional development agencies and industry associations might have detailed data showing the
value added at each step of the textile manufacturing industry. Hence, the development of the
industry and spillover effects can be identified more precisely, and the results might be more
insightful. Secondly, this study can be applied to other Sub-Saharan African countries to check the
validity of our conclusions. The focused countries should be evaluated with their unique
characteristics, such as development level of infrastructure, political stability and human
development level. Further research in these fields might complement our study with more
insightful sector-specific results and increased validity of our conclusions across several countries.
26
5. References
• Balassa, B. (1978). Exports and Economic Growth: Further Evidence. Journal of Development
Economics, 5, pp.181-189.
• Brenton, P. and Hoppe, M. (2007). Clothing and Export Diversification: Still a Route to Growth
for Low-Income Countries?. 10.1596/1813-9450-4343.
• Chemengich, M. (2013). Policy Research on The Kenyan Textile Industry. African Cotton and
Textile Industries Federation.
• Chenery, H. (1980). Interactions between Industrialization and Exports. American Economic
Review, vol. 70, pp.281-287.
• Chow, P. (1987). Causality between export growth and industrial development: Empirical
evidence from the NICs. Journal of Development Economics, 26(1), pp.55-63.
• Ee, C. (2016). Export-led Growth Hypothesis: Empirical Evidence from Selected Sub-saharan
African Countries. Procedia Economics and Finance, 35, pp.232-240.
• Humanistisch Instituut voor Ontwikkelingssamenwerking (Hivos) (2016). The Kenyan Textile
and Fashion Industry: The role of fashion designers and small tailors in the fiber to fashion
value chain. Kenya: Hivos.
• Keane, J. and Velde, D. (2008). The role of textile and clothing industries in growth and
development strategies. Overseas Development Institute.
• Kimemia, M. (2018). Hindrances to the growth of apparel industry in Kenya: A review.
International Journal of Advanced Science and Research, 3(4), pp.12-18.
• Konishi, Y., Mogollon, M., Rasagam, G., Adamali, A. and Ramakrishnan, K. (2015). Kenya
Apparel and Textile Industry : Diagnosis, Strategy and Action Plan. The World Bank.
• Mangieri, T. (2006). African Cloth, Export Production, and Secondhand Clothing in Kenya.
27
• Morris, M. (2008). Globalization, the Changed Global Dynamics of the Clothing and Textile
Value Chains and the Impact on Sub-Saharan Africa. Vienna: United Nations Industrial
Development Organization.
• Ngulu, G. (2010). Competitiveness Of Kenyan Textile Industry At The International Markets
Under The Africa Growth And Opportunity ACT (AGOA). Degree of Masters of Arts.
University of Nairobi.
• Sims, C. (1972). Money, Income, and Causality. The American Economic Review, vol. 62, no.
4, 1972, pp. 540–552.
• Traub-Merz, R. and Jauch, H. (2006). The African Textile and Clothing Industry: From Import
Substitution to Export Orientation. Bonn: Friedrich-Ebert-Stiftung.
28