bus & rail statistics
TRANSCRIPT

Bulletin Topics:• Total PSO Passenger Journeys• PSO Passenger Journeys by Region • Total Operated Vehicle-Kilometres And
Vehicle Seat-Kilometres• Passenger Revenues• Passenger Revenues by Region• Free Travel Scheme Revenue• Public Service Obligation (PSO) Subsidy• Operator Fleets• Age of Buses• Rail Network Changes• Wheelchair Accessible Fleet
Statistical Bulletin: 02/2020September 2021
Bus & Rail Statisticsfor Ireland - State Funded Services


Bus and Rail Statistics for Ireland | 1
This statistical bulletin is a publication of the National Transport Authority of Ireland (“the Authority”). It focuses on Public Service Obligation (PSO) bus services provided on behalf of the Authority by Dublin Bus, Bus Éireann, the Local Link rural transport programme, as well as other PSO bus routes operated by private operators who have been successful in Authority tender competitions, including services in the Dublin city and commuter region and Waterford city. It also covers heavy rail services provided by Iarnród Éireann (Irish Rail) and Luas light rail services provided by Transdev Dublin Light Rail Limited.
On 1st December 2009 the Dublin Transport Authority Act 2008 and the Public Transport Regulation Act 2009 came into effect. Under these Acts the Authority signed directly awarded contracts with Dublin Bus, Bus Éireann and Iarnród Éireann for the provision of bus and rail services, and assigned the management of the provision of Luas services to the Railway Procurement Agency (now Transport Infrastructure Ireland). Subsequent five-year direct award contracts were signed with Dublin Bus and Bus Éireann in December 2014 and again in December 2019. The contract with Iarnród Éireann was a 10 year contract, which was renewed for a further 10 year period in December 2019. A share of the bus services formerly part of the Dublin Bus and Bus Éireann contracts were competitively tendered and contracts awarded to Go-Ahead Ireland and Bus Éireann in 2018 and 2019.
The data presented in this bulletin for 2020 reflects the severe travel restrictions imposed by the Irish government from March 2020 onwards, resulting from the COVID-19 pandemic.
Bus ServicesContracts with bus operators are subsidised because the operators are required to deliver what are called Public Service Obligation (PSO) services. PSO services are socially necessary transport services which may not be commercially viable and as such they usually require a state subsidy to operate.
On the 1st December 2019, the Authority entered into new direct award contracts with Dublin Bus and Bus Éireann. The new direct award contracts provided for the transition from net cost contracts to gross cost contracts in 2021. This brought these direct award contracts into line with the Authority’s competitively tendered contracts. The new contracts include additional measures to encourage improvements to operational performance at an individual route level.
Dublin Bus and Bus Éireann currently provide the majority of PSO bus services under contract to the Authority. In April 2018, the Authority also entered into a contract with Go Ahead Ireland for the operation of a number of local and orbital bus routes in Dublin. A phased implementation of these services commenced in September 2018, with a full transfer being completed by March 2019.
The Authority continued with its commitment of both developing new and enhancing existing public transport services in 2019, and introduced a number of new or improved bus services following competitive tender competitions.
Go Ahead Ireland successfully tendered for the operation of Dublin Commuter routes along the Kildare corridor (formerly operated by Bus Éireann under direct award). Bus Éireann also successfully tendered for the continued operation of city services in Waterford. Each competitively tendered contract incorporated improved standards for punctuality, reliability and customer experience.
Go Ahead Ireland was awarded a contract for a new service (Route 197) between Swords and Ashbourne, and City Direct was awarded a contract for the operation of two new urban bus routes in Kilkenny City (Routes KK1 and KK2), with services commencing operation in November and December 2019 respectively.
Four other public service contracts were in place with the Authority in 2020, with M&A Coaches Ltd., Andrew Wharton Coach Hire, Bernard Kavanagh and Sons Ltd and J.J. Kavanagh & Sons.
Local Link provides PSO bus services in many areas of rural Ireland with passenger journeys tending to be local in nature but with connections to more regional and intercity services. It also provides a number of services delivering passengers door-to-door. Management of this programme was transferred to the Authority in April 2012. A set of Local Link offices were established by the Authority to administer the provision of Local Link services planned and funded by the Authority.
Introduction

2 | Bus and Rail Statistics for Ireland
Rail ServicesOn the 1st December 2019, the Authority entered into a further 10-year direct award PSO contract with Iarnród Éireann. As with the directly awarded Dublin Bus and Bus Éireann contracts, this contract includes additional measures to encourage improvements to operational performance at an individual route level.
Light Rail Services The Authority has a statutory obligation to secure the provision of light railway passenger services in the Greater Dublin Area (GDA). In September 2014 the Authority, with the Railway Procurement Agency (RPA), now Transport Infrastructure Ireland (TII) jointly entered into a five year contract with Transdev Dublin Light Rail Limited to operate Luas light rail services. In June 2019 the Authority and TII, following a competitive tender process, awarded the Luas Operations and Maintenance (O&M) contract to Transdev Dublin Light Rail Limited.
Statistical Qualifications The Authority came into effect on 1 December 2009 and hence the annual statistics in this bulletin begin in 2010 and cover the period 2010 to 2020 inclusive. Some data from prior to 2010 is referenced such as passenger journeys in order to give a historical perspective to data in recent years.
The data provided in this bulletin is based on the public transport operator’s periodic and annual returns. The figures used are intended to illustrate broad trends and are not meant to be read as exact calculations. There can also be approximations for a number of reasons. Reporting periods could differ slightly due to calculation methods and this would limit the precise accuracy. Other factors could affect figures e.g. severe weather conditions, amendments to routes, et cetera. Rounding has also been used and this could affect overall percentages. It should also be noted that some prior year comparative amounts have been reclassified on a basis consistent with the current year.
Individual routes and services may also change over time, which can impact on passenger and revenue reporting. For example a small number of Bus Éireann services which previously were included in their stage carriage services a few years ago are now more appropriately included in one of their city services, and likewise Dublin Commuter has now been split with some services categorised as Stage Carriage “East”.
Where reference is made to Dublin Commuter bus services, these comprise of services operated by both Bus Éireann and Go Ahead Ireland. Dublin Bus have also adjusted their services over the years with the approval of the Authority with more cross city and orbital services now. As such, passengers may be able to complete their journey by taking one trip where previously it may have required two trips. As with commuter bus services, where Dublin city bus services are mentioned, these incorporate services operated by both Dublin Bus and Go Ahead Ireland.

Bus and Rail Statistics for Ireland | 3
Total PSO Passenger Journeys
In 2007, passengers travelling by public transport were at a peak, based on passenger journeys in the annual reports of the transport operators. As the first sign of economic decline was evident in 2008, passenger journeys on public transport began to decline, with 2009 seeing reductions in patronage in excess of 10% across all modes of public transport. Total passenger journeys on public transport continued to decline, but at a slower rate, over the next three years up to 2012 although some services such as Luas did see some growth as new Luas lines were opened1.
By 2013, the decline in total public transport passenger journeys had halted as the economy began to stabilise. In the six years since 2013 growth in total passenger journeys was strong across all modes of PSO funded public transport, growing in excess of 40% to 2019.
1 Bus Éireann passenger numbers pre 2009 may include a small portion of commercial Expressway services.
The onset of the COVID-19 global pandemic in March 2020 had a significant impact on the use of public transport across all modes in Ireland. Passenger numbers on PSO services initially fell to between 10%-20% of pre COVID levels experienced in the previous year, as reduced timetables were introduced and capacity restrictions imposed across the public transport network. Public health restrictions including social distancing, the mandatory use of face masks on public transport and restrictions on the movement of people within counties and between counties were all introduced at various stages during 2020, with passengers being advised to only travel if their journey was essential and to consider cycling or walking were feasible.
1
Public Transport Usage & Economic Performance (Base Year 2006)
2006 2007 2008 2009 2010 2011 2021 2013 2014 2015 2016 2017 2018 2019 2020
%
GDP
Economic OutlookDemand for public transport services is strongly related to economic activity. Economic growth increases employment, disposable income, and consumer spend, all of which lead to more travel. Economic decline produces the opposite effect. This was clearly demonstrated over the past decade.
0
20
40
60
80
100
120
140
160
180
200
PSO PT GNP Employment GDA Employment Nationally

4 | Bus and Rail Statistics for Ireland
The data in Table 1A shows the number of passenger journeys carried across each of the main modes of public transport over the period 2010 to 2020. In general the numbers reflect trends in the economy with a fall in passenger journey numbers in 2011. Following a period of stabilisation across all modes, overall passenger journeys began to increase year on year with growth of between 8 and 10 million between 2014 and 2016. These increases were largely driven by significant gains in patronage on rail and light rail services. Growth across all modes further increased between 2017 and 2019 with a record increase of 25.6 million in 2019 resulting in 294.6 million passenger journeys across the State. As alluded to above, the global pandemic and associated public health related restrictions has had a dramatic negative impact on public transport in 2020, with patronage across all modes falling by 53.3% from the previous year.
The Authority has, however, in partnership with bus operators continued to improve the transport network to ensure that a better service can be provided to the travelling public, to meet evolving patterns of travel demand. This included the introduction of 24 hour services in Dublin, official launch of new urban routes in Kilkenny city and the arrival of double deck hybrid buses for use in Dublin and Galway. Service improvements were also made on the Luas light rail network with the introduction of extended 55 metre trams on the Green Line to improve capacity for passengers. Construction also commenced in 2020 of the new commuter rail station at Pelletstown in west Dublin, to improve connectivity.
Details of changes to these networks are included at Chapter 10 of this bulletin.
Year / Operator PSO Bus Services PSO Rail Services Light Rail Services
Total PSO Services
Change in passenger
journey numbers
2010 147.6 38.2 27.5 213.4
2011 145.3 37.4 29.1 211.8 -1.6
2012 143.6 36.7 29.3 209.7 -2.1
2013 142.9 36.7 30.5 210.1 0.4
2014 147.7 37.8 32.6 218.1 8.0
2015 151.8 39.7 34.6 226.1 8.0
2016 159.3 42.8 34.0 236.1 10.1
2017 169.3 45.5 37.6 252.5 16.4
2018 179.2 48.0 41.8 269.0 16.5
2019 196.2 50.1 48.3 294.6 25.6
2020 100.6 17.9 19.2 137.7 -156.9
Table 1A: Annual passenger journeys (millions)
Table 1B: Annual passenger journeys (% Change)
Year / Operator PSO Bus Services PSO Rail Services Light Rail Services Total
2011 -1.6% -2.2% 5.7% -0.8%
2012 -1.1% -1.7% 0.8% -1.0%
2013 -0.5% 0.0% 4.1% 0.2%
2014 3.4% 2.9% 6.9% 3.8%
2015 2.8% 4.9% 6.1% 3.6%
2016 4.9% 7.9% -1.6% 4.4%
2017 6.3% 6.3% 10.6% 6.9%
2018 5.8% 5.4% 11.1% 6.5%
2019 9.5% 4.4% 15.6% 9.5%
2020 -48.7% -64.3% -60.3% -53.3%
Tables 1A and 1B along with Figure 1.1 illustrate the changes in passenger journeys on exchequer funded public transport services across the State between 2010 and 2020.

Bus and Rail Statistics for Ireland | 5
Figure 1.1 shows all PSO passenger journeys combined from 2010 to 2020. This shows that passenger journey numbers declined marginally from 2010 to 2012 as the economy faltered, before stabilising in 2013. There was then a period of consistent growth between 2014 and 2016, averaging 4% annually. 2017 to 2019 seen
increasingly greater levels of growth in patronage of between 6.7% and 9.5%, with record passenger numbers in 2019 of just over 294 million. Due to the impact of COVID-19, 2020 has seen the largest decreases to date, with overall patronage falling by over half when compared to the previous year, to 137.7 million.
Figure 1.1: Total PSO Passenger Journeys 2010 - 2020 (millions)
0
50
100
150
200
250
300
350
2010 2011 2012 2013 2014 2015 2016 2017 2018 2019 2020
Figure 1.2: PSO Public Transport Passenger Journeys by Mode, 2010 - 2020 (millions)
0
50
100
150
200
250
2010 2011 2012 2013 2014 2015 2016 2017 2018 2019 2020
Figure 1.2 shows the total passenger journeys by mode from 2010 to 2020. It is clear from the chart that bus services carry many more passengers nationally than all of the other modes. Bus services have traditionally accounted for almost 70% of public transport journeys in the period up to 2014, before contracting slightly to approximately 66% between 2015 and 2019, while in 2020 this mode represented 73% of all public transport journeys. Rail and light rail services have fluctuated in recent years with rail journeys accounting for 13% in 2020 and light rail accounting for 14% of all public transport journeys.
Bus ServicesOverall patronage on PSO bus services experienced steady growth between 2013 and 2019 for a variety of reasons including improved economic conditions, enhanced services in both recently tendered contracts and in existing direct award contracts, and new bus routes in tendered PSO bus contracts.
Dublin city bus services carry more than half of the total passenger journeys in Ireland (51.9% in 2019 and 56.4% in 2020). Following a number of years of decreases between 2010 and 2013 as a result of the economic downturn, passenger journeys on Dublin city bus services increased by an average of 4.5% each year to 2019, reaching a peak of 152.7 million. In recent years this has been the result of additional services and passenger growth associated with the transfer of services to Go Ahead Ireland, along with the provision of additional services by Dublin Bus. Patronage on Dublin city bus services fell by 49.2% in 2020 during the COVID-19 pandemic.
PSO bus passenger numbers outside Dublin, predominantly operated by Bus Éireann, saw a significant upturn in 2018 (+13.4%), after numbers in 2017 were impacted by 21 days of industrial action during which no Bus Éireann services operated. Patronage in 2019 continued to grow in excess of 13% from the previous year, yielding a total of 39.9 million passenger journeys following investment by the Authority in additional services and greater frequency on some services. Similar to all other PSO services, patronage fell by almost half to 20.0 million in 2020.
Total PSO Bus Services Total PSO Rail Services Total Light Rail Services

6 | Bus and Rail Statistics for Ireland
Rural bus services provided and managed by Local Link have seen annual passenger journeys rise gradually over the years, albeit on a much smaller scale to that of the larger operators. Increases before 2018 were partially due to new reporting methods that saw the inclusion of passengers on additional contracted services being included. In 2018, Local Link saw strong growth of 19.6% in passenger journeys, their best year since 2011. This was mainly as a result of the introduction of over 50 new services since 2016. 2019 saw further improvement, with services contributing a further 2.5 million passenger journeys, before experiencing a decline in patronage of 45.1% in 2020.
Rail ServicesRail services operated by Iarnród Éireann had an average growth in patronage of 5.3% between 2014 and 2019, reaching 50.1 million passenger journeys in 2019, which represented a new record level. This was supported by the introduction of a 10-minute Dart service in the latter part of 2018 as well as service enhancements on Intercity and commuter services to and from Dublin and Galway, which provided additional capacity. Rail services, particularly Dublin Commuter and Dart services, suffered the most significant downturn in 2020 of all modes, with a 64% decrease in patronage as a result of the pandemic.
Light Rail ServicesPassenger journeys on Luas services operated by Transdev Dublin Light Rail Limited have largely followed the pattern of other operators with growth each year up to 2019, with the exception of 2016. Increased patronage on this mode was aided by the opening of extensions to both the Green Line and the Red Line between December 2009 and July 2011. The falloff in passenger numbers in 2016 can be attributed to two events, namely a partial closure of the Red line for 6 weeks to allow for Luas CrossCity works and 12 days of industrial action. The upward trend in patronage was to continue until 2019, where a 15.6% increase seen 48.3 million passenger journeys. The opening of Luas CrossCity on 9th December 2017 undoubtedly influenced the growth of passenger journeys seen in recent years, combined with the introduction of new extended trams on the Green Line in 2019, providing extra passenger capacity. Like other operators, however, the pandemic in 2020 has resulted in a steep decline in passenger numbers of 60.3% in 2020, as passengers were advised to avoid public transport unless for essential purposes.
Factors Influencing Passenger JourneysFrom time to time Public transport operators, with the agreement of the Authority review their reporting methodologies to provide more accurate data on their services. When this occurs the operator usually restates the data for the previous year so as it can be compared with the current year and future years. Bus Éireann restated their 2013 passenger journeys while Iarnród Éireann restated their 2012 passenger journeys. While restatements result in a slight adjustment to the comparison between one year and the next, they do not affect the overall trend in passenger journey growth over a number of years.
In any year, particular events may affect passenger numbers on one or more operators. One such event is industrial action. Bus Éireann service did not operate for two days in May in 2013 and in 2015. In 2017 Bus Éireann services did not operate for 21 days in March and April. Iarnród Éireann had two days of industrial action in August 2014 and a three hour stoppage during the morning peak in October 2015. Iarnród Éireann had two days of industrial action in November 2017 along with a number of stoppages associated with the Bus Éireann dispute. Dublin Bus had no PSO bus services for three days in August 2013 and two days in May 2015. In 2016 Luas lost 12 days due to industrial action and Dublin Bus lost six days.
Weather events can also affect passenger numbers. 2017 saw the arrival of ex-hurricane Ophelia which disrupted most public transport services for at least one day with Luas not operating for a second day due to damage caused by the largest storm to hit Ireland in almost 50 years. Extreme weather events also impacted on 2018 figures, with the onset of Storm Emma in March, resulting in heavy snow and the cancellation of services over a number of days.
March 2020 saw the onset of the COVID-19 global pandemic, which has had a dramatic negative impact on the uptake of public transport. Patronage shrank by as much as 80%-90% in the early stages of the pandemic, with government imposed travel restrictions, reduced timetables and capacity restrictions imposed, and with health guidance requiring adequate social distancing and mandatory use of face masks. The significant decreases in the use of public transport resulted in substantial revenue losses for transport operators, which was absorbed by additional funding from Government to ensure services continued to operate in line with public health restrictions.

Bus and Rail Statistics for Ireland | 7
PSO PassengerJourneys by Region
2
Dublin city bus services are operated by Dublin Bus and Go Ahead Ireland. While they mainly operate within Dublin city & county some services also operate in North Kildare and North Wicklow. In addition to city bus services, commuter bus services operate into Dublin from surrounding counties. These services are operated by Bus Éireann and Go Ahead Ireland. Light rail (Luas) services in Dublin are operated by Transdev Dublin Light Rail Limited and DART and commuter rail services are operated by Iarnród Éireann.
Bus services operated by Bus Éireann provide services to all 26 counties, and similar to that of Iarnród Éireann, offer services to Northern Ireland. Rural bus services operated under the Local Link programme operate in all 26 counties with a small number of services extending into Northern Ireland. Rail services operated by Iarnród Éireann provide services to 23 of 26 counties and services to Northern Ireland.
The tables below present passenger journeys in the Dublin region, the Greater Cork City region, Galway, Limerick and Waterford cities, and the rest of the country, including stage carriage bus services (serving areas outside larger towns and cities) operated by Bus Éireann and Intercity rail services operated by Iarnród Éireann.
Dublin Region
Year/ Operator Dublin city Bus Services
Dublin Commuter Bus Services
Dublin Commuter & Dart Rail Services
Light Rail (Luas) Services
Total Passenger Journeys
2013 112.5 4.9 25.9 30.5 173.8
2014 116.3 5.0 26.5 32.6 180.4
2015 119.8 5.1 28.1 34.6 187.6
2016 125.4 5.5 30.9 34.0 195.8
2017 136.3 5.1 32.8 37.6 211.7
2018 141.5 5.9 34.2 41.8 223.4
2019 152.7 6.6 35.6 48.3 243.2
2020 77.6 3.4 12.8 19.2 113.0
Table 2A: Dublin Region Annual Passenger Journeys (millions)
Table 2A shows trends in passenger journeys for the Dublin region. In the period between 2013 and 2019 total passenger journeys in the region grew by just under 40% to a total of 243.2 million, before the onset of the pandemic 2020, resulting in a decline of 130.2 million.
There were also other exceptions to the continuous growth seen up to 2019, namely Luas in 2016 where passenger numbers declined due to a six week closure of a city centre section of the Red Line to facilitate Luas
CrossCity construction and due to 12 days of industrial action. Dublin Commuter bus passenger numbers also declined in 2017, as Bus Éireann operated no services for 21 days due to industrial action.

8 | Bus and Rail Statistics for Ireland
Year/ Operator Dublin city Bus Services
Dublin Commuter Bus Services
Dublin Commuter & Dart Rail Services
Light Rail (Luas) Services
Total Passenger Journeys
2013 to 2020 -31.0% -31.2% -50.6% -37.1% -35.0%
2019 to 2020 -49.2% -48.8% -64.0% -60.3% -53.5%
Table 2B: Dublin Region Annual Passenger Journeys (% Change)
Table 2B shows the change in passenger demand per mode between 2013 and 2019 when patronage on public transport reached all-time highs. It also shows the change between 2013 and 2020 when public transport was significantly impacted by the COVID-19 pandemic. In overall terms, the pandemic has resulted in demand for public transport shrinking by just over a third compared to levels seen following the economic crisis in 2013, with patronage across all modes in Dublin falling by more than half between 2019 and 2020. Commuter rail and
Dart services have shown the greatest decline of over 60% in the Dublin area, reflective of the fact that large numbers of the working population were asked to work from home in 2020.
Figure 2.1 highlights the very high modal share for bus services in the Dublin region from 2013 to 2020. Despite the downturn experienced in the last year, demand for bus services continued to be significantly greater than that of other modes.
Figure 2.1: Dublin Region Annual PSO Passenger Journeys (millions)
0
20
40
60
80
100
120
140
160
180
2013 2014 2015 2016 2017 2018 2019 2020
Dublin City Bus Services Dublin Commuter Bus Services
Dublin Commuter & Dart Rail Services Light Rail Services

Bus and Rail Statistics for Ireland | 9
Cork City Commuter Area
Table 2C: Cork Commuter Annual Passenger Journeys (millions)
Year/ Operator Bus Services Rail Services Total Passenger Journeys
2013 10.5 0.9 11.5
2014 11.0 1.1 12.1
2015 11.7 1.1 12.9
2016 12.6 1.2 13.8
2017 12.1 1.3 13.4
2018 13.9 1.3 15.3
2019 15.9 1.5 17.3
2020 7.9 0.6 8.5
Table 2C and Figure 2.2 show the passenger journeys using PSO subsidised public transport in Cork city commuter area. Both Bus Éireann and Iarnród Éireann provide services in the Cork commuter area. The difference in passenger journeys in Cork commuter area compared to the Dublin region has traditionally been significant. The Dublin region typically has approximately
14 passenger journeys on public transport for every one passenger journey in Cork. This has remained the case in 2020 where there were 8.5 million passenger journeys in the Cork commuter area, compared to 113.0 million in the Dublin region. Bus users accounted for 91.6% of public transport journeys in Cork in 2019 and 92.9% in 2020.
Figure 2.2: Cork Commuter annual PSO passenger journeys (millions)
0
2
4
6
8
10
12
14
16
18
2013 2014 2015 2016 2017 2018 2019 2020
Bus Services Rail Services
Table 2D: Cork City Area Annual Passenger Journeys (% Change)
Year/ Operator Bus Services Rail Services Total Passenger Journeys
2013 to 2020 -24.9% -35.5% -25.8%
2019 to 2020 -50.2% -58.5% -50.9%
Table 2D shows the change in passenger journeys between 2013 and 2019 and also 2019 to 2020. Similar to the Dublin region, 2020 figures are a direct result of the impact of the COVID-19 pandemic, which has seen demand for public transport in the Cork region fall by 50.9% of the 2019 figure, which also represents a decline
of 25.8% compared to 2013. Patronage up to 2019 had been increasing steadily, helped by the reconfiguration of the city network in recent years. The greatest percentage decline seen in 2020 was on rail services, largely caused by regular commuters being asked to work from home.

10 | Bus and Rail Statistics for Ireland
Other Cities and Rural Services
Table 2E: Annual Passenger Journeys outside Dublin and Cork regions (millions)
Year/ Operator
Bus Services Galway city
Bus Services Limerick city
Bus Services Waterford
city
National Bus Services
Intercity Rail Services
Rural Bus Services
(Local Link)Total
2013 3.8 2.8 0.8 4.2 9.9 1.7 23.3
2014 4.1 2.8 0.8 4.1 10.2 1.8 23.9
2015 4.0 2.8 0.8 4.1 10.4 1.8 23.9
2016 4.2 2.9 0.8 4.2 10.7 1.8 24.7
2017 4.2 3.2 0.8 4.2 11.4 1.9 25.6
2018 4.7 3.5 0.8 5.2 12.4 2.0 28.6
2019 5.7 3.9 1.2 5.8 13.1 2.5 32.3
2020 3.0 2.3 0.7 2.8 4.4 1.4 14.7
Table 2E and Figure 2.3 show trends in passenger numbers on services outside the Dublin and Cork commuter regions.
Table 2F: Annual Passenger Journeys Outside Dublin and Cork regions (% Change)
Total passenger journeys on these services increased year on year from 2013 and reached 32.3 million in 2019, before 2020 seen a decline of over 50% to 14.7 million. Bus services within the other regional cities accounted for 41.2% of travel outside of Dublin and Cork, while
Intercity rail services carried approximately 30% of these passengers. National stage carriage bus services and rural bus services operated under the Local Link brand carried the balance of passenger journeys.
Year/ Operator
Bus Services Galway city
Bus Services Limerick city
Bus Services Waterford
city
National Bus Services
Intercity Rail Services
Rural Bus Services
(Local Link)Total
2013 to 2020 -20.4% -16.9% -13.0% -34.4% -55.0% -19.8% -36.9%
2019 to 2020 -46.3% -41.8% -41.7% -52.3% -65.9% -45.1% -54.5%
As with the Dublin and Cork city areas, a significant decline in the use of public transport in 2020 has seen passenger demand fall dramatically across the other regional cities and elsewhere nationally, with a decline of a similar magnitude in the year to 2020 (-54.5%). This represents a fall in passenger demand of 36.9% when compared to 2013.
Intercity rail passenger journeys grew steadily between 2013 and 2019 (32.1%) before seeing a dramatic decrease in 2020, with passenger demand 55.0% less than that seen seven years previous. This decline in national stage carriage bus passenger journeys (down 34.4% compared
to 2013) is also very large. It is clear that reductions in leisure, social and student associated with government imposed travel restrictions from March 2020 impacted on intercity travel in particular.
Bus services in the other regional cities had experienced strong growth in the period to 2019 (46.7% on average), largely helped by the introduction of enhanced timetables in Galway and Limerick, competitive tendering of services in Waterford and the promotion of Leap. These services have experienced decreases to a lesser extent of 16.8% on average in the period to 2020.

Bus and Rail Statistics for Ireland | 11
Figure 2.3: Annual PSO Passenger Journeys outside Dublin and Cork regions (millions)
0
2
4
6
8
10
12
14
2013 2014 2015 2016 2017 2018 2019 2020
Bus Services Galway
Rural Bus ServicesIntercity Rail Services
Bus Services Limerick Bus Services Waterford
National Bus Services
When looking at the change in passenger journeys between 2013 and 2020 the following observations can be made:
• Growth between 2013 and 2019 was strong across all market segments, with an average increase of 38.6%. This has been followed by a decline of 36.9% in 2020.
• Intercity rail services carry the largest share of patronage outside of the Dublin and Cork areas, with 13.1 million passenger journeys in 2019, falling to 4.4 in 2020.
• Bus services in Galway account for the next highest
passenger demand outside Dublin and Cork, which peaked in 2019 at 5.7 million passenger journeys before receding to 3.0 million in 2020.
• National bus services (stage carriage) experienced strong growth up to 2019, accounting for 5.8 million passenger journeys in 2019, falling to 2.8 million in 2020.
Figure 2.4 illustrates the change in passenger demand across all sectors between 2019 and 2020 with the impact of the COVID-19 pandemic having a significantly detrimental effect across public transport services. As alluded to above, this has been most evident on national Intercity and Dublin Commuter and Dart services, which have declined by in excess of 50% from 2019 levels due to a large cohort of passengers being asked to work from home for large parts of 2020.
Bus services in the regional cities and rural services have seen the lowest drop in passenger demand, however it is worth noting that these services have significantly lower patronage levels in real terms.
Figure 2.4: PSO Passenger Journey by Sector 2019 to 2020 (% Change)
-70%
-60%
-50%
-40%
-30%
-20%
-10%
0%
-65.9% -64.0% -60.3% -58.5% -52.3% -50.2% -49.2% -48.8% -46.3% -45.1% -41.8% -41.7%
National Rail Services
National Bus Services
Bus Services Galway
Dublin Commuter & Dart Rail Services
Dublin City Bus Commuter Services
Rural Bus Services
Light Rail Services
Dublin City Bus Services
Bus Services Limerick
Cork Commuter Rail Services
Bus Services Cork
Bus Services Waterford

12 | Bus and Rail Statistics for Ireland
Figure 2.5: PSO Passenger Journeys by Region 2019
Figure 2.5 shows all passenger journeys in 2020 broken down into three regions: the Dublin region, the Cork region and the rest of Ireland. The trend in 2020 remained similar to previous years with the Dublin region accounting for 83% of all PSO public transport journeys. The Cork region accounts for 6% of all passenger journeys while the rest of Ireland accounts for 11% of all passenger journeys.
Dublin Region,83%
Cork Region,6%
Other,11%

Bus and Rail Statistics for Ireland | 13
Total Operated Vehicle-Kilometres and Vehicle Seat-Kilometres
3
The changes in both operated vehicle-kilometres and vehicle seat-kilometres operated across the three main public transport modes in the State are shown in Tables 3A to 3D along with Figure 3.1.
‘Operated vehicle-kilometres’ refers to the actual amount of vehicle kilometres that a bus or rail operator has operated in a given period, as opposed to ‘scheduled vehicle kilometres’ which indicates the number of vehicle kilometres planned to operate according to operator timetables.
‘Vehicle seat-kilometres’ is a unit of passenger transport capacity measuring the average number of seats available on each vehicle multiplied by the total kilometres travelled by all vehicles operating PSO services.
Given that transport operators operate a variety of vehicles with differing numbers of seats, vehicle seat-kilometres can be instructive in illustrating transport capacity. However on city or commuter services, passengers can stand for a short journey and that will increase the capacity available over the seated capacity. Commuter and Dart rail services in particular offer significant standing capacity on their vehicles and this standing capacity is not included in the vehicle seat kilometres outlined here. Light rail trams have an average of 70 seats per tram with total capacity including standing of 310. As most light rail passengers travel relatively short journeys many of them are required to stand for their journey. Therefore for light rail services the vehicle seat-kilometres includes both seating and standing capacity on their trams.
Factors Affecting Operated Vehicle and Seat KilometresIn 2017 both vehicle kilometres and seat kilometres on rail services decreased by 5.7% and 4.0% respectively as a result of industrial action by Iarnród Éireann staff, as well as train cancellations due to knock on effects of Bus Éireann industrial action. Services were also impacted due to ex- hurricane Ophelia.
Bus Éireann changed their method used to calculate kilometres operated in 2013 and 2014 and these figures have been restated. As a result, 2013 and 2014 vehicle kilometres operated are not directly comparable with
previous years. Seat kilometres operated have also been restated from 2010 to 2019 to reflect average seat numbers on PSO services. Operated vehicle kilometres provided by Dublin Bus have also been restated from 2010 to 2019 to reflect revenue generating PSO kilometres as opposed to company operated kilometres, with figures between 2010 and 2013 being approximations based on average seat numbers using the revised methodology.
Bus ServicesIn general terms, both vehicle-kilometres and vehicle seat-kilometres trended downwards between 2010 and 2014 as passenger journeys fell following economic decline, before stablishing thereafter. The two main bus operators have operated increased vehicle kilometres in recent years, as demand for services has increased and additional services are provided by the Authority.
In 2018, Dublin Bus figures receded somewhat owing to a small portion of services being transferred to Go Ahead Ireland, and also extreme weather events earlier in the year. The tendering of bus services in conjunction with the introduction of other new services nationally led to sustained growth in overall vehicle kilometres operated and seat kilometres in both 2018 and in 2019. This trend continued on Dublin city bus services in 2020, with increases seen across both metrics, as service improvements and the introduction of a number of 24-hour services in late 2019 mitigating the impact of the COVID-19 pandemic.
Bus Éireann also experienced gains in both metrics between 2015 and 2019 owing to enhanced service delivery by the Authority outside the Dublin region, with supporting marketing campaigns towards the use of leap. Vehicle seat kilometres increased steadily over the years as a result of bus capacities increasing, allowing them to carry more passengers with the same number of services operated. Both operated kilometres and seat kilometres declined marginally in 2020 as services restrictions were introduced nationally.

14 | Bus and Rail Statistics for Ireland
Light Rail ServicesVehicle-kilometres operated on light rail services increased significantly in 2011 following the opening of Luas extensions in late 2010. In 2013 the vehicle kilometres reduced as the interval between some services was extended but this was reversed partially the following year. The reduction in vehicle kilometres in 2016 was due to a combination of closing the red Luas line between Jervis and the Point for six weeks to allow for Luas CrossCity works and 12 days of industrial action when no services were operated.
In the years from 2017 to 2019 Luas benefitted from strong growth in passenger journeys. A key contributory factor to the increases in both kilometres operated and seat-kilometres was the opening of the Luas Cross City extension on the Green line in December 2017 and the introduction of extended trams, also on the Green line, further bolstering capacity. Luas services saw the lowest drop off in term of kilometres operated and seat kilometres across the modes in 2020.
Rail ServicesOperated vehicle kilometres on rail services have remained relatively constant over the years between 2010 and 2016 but the operated seat kilometres dropped each year between 2011 and 2014. This is because Iarnród Éireann implemented a fleet strategy which allowed them to maintain the number of services provided but reduce costs by matching more closely the number of carriages required to the number of passengers travelling. In 2015 and 2016 in line with passenger journey numbers growing they adjusted upwards the number of carriages used on various services thereby increasing the number of vehicle seat kilometres. The introduction of a 10 minute Dart service in late 2018 and enhancements on Intercity and Commuter services to and from Dublin and Galway in 2019 resulted in operated kilometre increases of 9.2% and 6.6% in seat kilometres in 2019. Perhaps not surprisingly, the pandemic in 2020 impacted the provision of rail services most significantly of all the modes, as restrictions on the use of public transport altered the travel patterns of regular commuters dramatically.
Table 3A: Annual operated vehicle kilometres (millions)
Year / Operator Total PSO Bus Services
Total PSO Rail Services
Total Light Rail Services Total Total Change
2010 87.0 15.950 2.9 105.8
2011 84.2 15.960 3.7 103.8 -2.0
2012 82.4 15.960 3.8 102.2 -1.6
2013 76.8 15.967 3.5 96.3 -5.9
2014 80.3 15.965 3.7 100.0 3.7
2015 81.2 15.965 3.7 100.8 0.9
2016 82.9 16.0 3.5 102.3 1.5
2017 84.2 15.0 3.7 102.9 0.5
2018 91.0 16.2 4.1 111.3 8.4
2019 98.7 17.7 4.4 120.8 9.5
2020 102.6 14.7 4.3 121.7 0.9

Bus and Rail Statistics for Ireland | 15
Table 3B: Annual operated vehicle kilometres (% Change)
Year/Operator Total PSO Bus Services
Total PSO Rail Services
Total Light Rail Services Total Change
2011 -3.2% 0.1% 27.3% -1.9%
2012 -2.1% 0.0% 4.0% -1.6%
2013 -6.8% 0.0% -7.6% -5.8%
2014 4.6% 0.0% 3.5% 3.8%
2015 1.1% 0.0% -0.1% 0.9%
2016 2.1% -0.1% -4.7% 1.5%
2017 1.5% -5.7% 4.9% 0.5%
2018 8.1% 7.7% 11.0% 8.2%
2019 8.5% 9.2% 8.0% 8.6%
2020 3.9% -16.7% -1.5% 0.7%
2010 to 2020 17.9% -7.6% 49.2% 14.9%
Table 3C: Annual operated vehicle seat kilometres (millions)
Year / Operator Total PSO Bus Services
Total PSO Rail Services
Total Light Rail Services Total Total Change
2010 5,633.8 7,063.1 898.4 13,595.3
2011 5,450.7 6,677.6 1,143.1 13,271.3 -323.9
2012 5,349.9 6,623.0 1,188.9 13,161.9 -109.5
2013 5,021.5 6,398.0 1,098.8 12,518.3 -643.6
2014 5,294.0 5,707.0 1,137.0 12,138.0 -380.3
2015 5,410.5 6,123.2 1,135.8 12,669.5 531.5
2016 5,499.7 6,208.3 1,081.9 12,789.9 120.4
2017 5,709.7 5,961.4 1,134.9 12,806.0 16.1
2018 5,944.2 5,986.6 1,260.3 13,191.1 385.1
2019 6,322.3 6,379.1 1,363.4 14,064.8 873.6
2020 6,457.4 5,448.7 1,339.9 13,246.0 -818.8

16 | Bus and Rail Statistics for Ireland
Table 3D: Annual operated vehicle seat kilometres (% Change)
Year/Operator Total PSO Bus Services
Total PSO Rail Services
Total Light Rail Services Total Change
2011 -3.3% -5.5% 27.2% -2.4%
2012 -1.8% -0.8% 4.0% -0.8%
2013 -6.1% 3.7% -7.6% -4.9%
2014 -2.8% -10.8% 3.5% -3.0%
2015 2.2% 7.3% -0.1% 4.4%
2016 1.6% 1.4% -4.7% 0.9%
2017 3.8% -4.0% 4.9% 0.1%
2018 4.1% 0.4% 11.0% 3.0%
2019 6.4% 6.6% 8.2% 6.6%
2020 2.1% -14.6% -1.7% -5.8%
2010 to 2020 14.6% -22.9% 49.1% -2.6%
Figure 3.1: Annual Vehicle Seat Kilometres Operated 2010 - 2020
Year/Operator
0
1000
2000
3000
4000
5000
6000
7000
8000
2010 2011 2012 2013 2014 2015 2016 2017 2018 2019 2020
Dublin Bus Bus Éireann DAC Iarnród Éireann Luas

Bus and Rail Statistics for Ireland | 17
Passenger Revenues
4
Passenger revenues across each of the modes of public transport are shown in Table 4A. Passenger revenues for bus, rail and light rail services are made up of cash fare revenue, Leap revenue, and prepaid ticket sales (including Taxsaver tickets), as well as the free travel grant from the Department of Employment Affairs and Social Protection (DEASP). Revenues for rural bus services operated by Local Link also includes revenue which is paid to Local Link from agencies such as the Health Service Executive (HSE) or from community groups for the provision of specific bus services.
Passenger revenues reported in this chapter do not include the annual Public Service Obligation subsidy, which is outlined in Chapter 7. Passenger revenue only relates to contracted PSO services and does not include commercial sources (e.g. Bus Éireann Expressway services).
Changes in passenger revenues is as a result of associated rises or falls in passenger journeys or average fares, or both. As the use of Leap e-purse grows across the modes it has the effect of moderating passenger revenue growth due to the significant fare discount available. The Free Travel Grant from DEASP has increased very little since 2010 despite significant increases in free travel passengers, which also has a moderating effect on the growth in passenger revenues.
Significant fares increases were approved by the Authority for 2012 and 2013 to compensate for loss in PSO subsidy and these fare increases enabled the growth in passenger revenues despite passenger journeys falling slightly during this period. Between 2014 and 2019 average fare increases were moderate and it was growth in passenger journeys which was the main contributor to passenger revenue growth.
While record passenger journeys have resulted in revenues across all modes increase by 6.8% in 2019, the onset of the COVID-19 global pandemic in March 2020 brought about the single most detrimental impact on fare revenues to date, with a year on year decline of -51.2%, from €660.3 million to €322.5 million.
Bus ServicesPassenger revenues on bus services nationally have consistently risen by an average of 5.7% in the years from 2012 through to 2019. This was primarily driven by significant increases in passenger journeys, to a peak in 2019 where of a total passenger revenue of €660 million, bus services contributed over €345 million (52.3%). Bus revenues fell by 45.8% in 2020, however maintained their share of overall PSO passenger revenue.
Typically, just over two thirds of total bus passenger revenues are generated by bus services in Dublin city, peaking at €247million in 2019. Significant revenue growth occurred in 2018 and 2019 associated with the tendering of bus services and the transfer of a portion of services to Go Ahead and the introduction of enhanced timetables on many routes. Passenger revenues for bus services outside Dublin peaked in 2019, resulting in a revenue total of €65.7 million for the year. This was despite the full roll out of Leap-enabled machines across the network providing lower leap fares and reflected strong passenger growth, particularly in the regional cities and on national stage carriage services. In line with other services, bus revenues outside of Dublin declined by 40.1% in 2020 to €39.4 million as a result of the impact of the pandemic.
Figures for rural bus services operated and managed by Local Link include contracted revenue which has resulted in increased passenger revenues each year between 2011 and 2019. Contracted revenue is revenue paid to Local Link from agencies such as the HSE or from community groups for the provision of specific bus services. It is this contracted revenue which supported the growth in Local Link passenger revenue from 2012 to 2019. The introduction of a number of high frequency services across the Local Link network from 2017 resulted in a significant upturn in passenger revenues, increasing from €0.4m in 2017 to €1.8m in 2019, as demand for these services grew, before receding to €1.5 million in 2020.
18 | Bus and Rail Statistics for Ireland
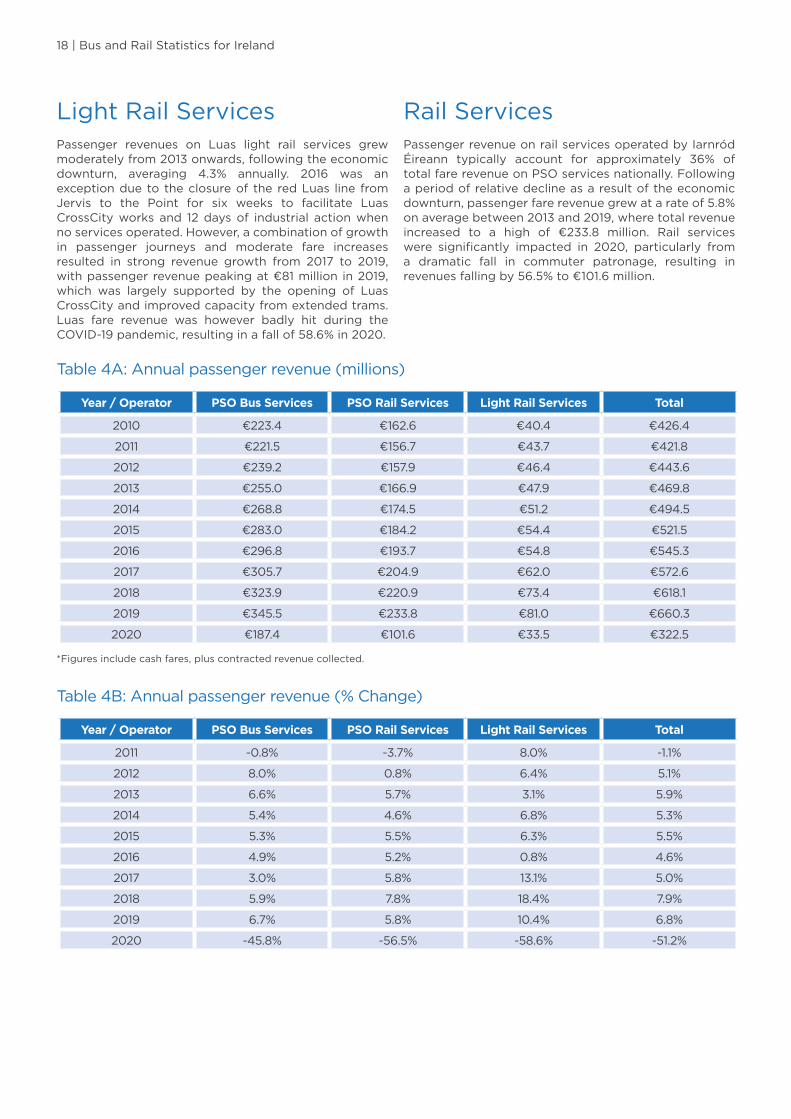
Light Rail ServicesPassenger revenues on Luas light rail services grew moderately from 2013 onwards, following the economic downturn, averaging 4.3% annually. 2016 was an exception due to the closure of the red Luas line from Jervis to the Point for six weeks to facilitate Luas CrossCity works and 12 days of industrial action when no services operated. However, a combination of growth in passenger journeys and moderate fare increases resulted in strong revenue growth from 2017 to 2019, with passenger revenue peaking at €81 million in 2019, which was largely supported by the opening of Luas CrossCity and improved capacity from extended trams. Luas fare revenue was however badly hit during the COVID-19 pandemic, resulting in a fall of 58.6% in 2020.
Rail ServicesPassenger revenue on rail services operated by Iarnród Éireann typically account for approximately 36% of total fare revenue on PSO services nationally. Following a period of relative decline as a result of the economic downturn, passenger fare revenue grew at a rate of 5.8% on average between 2013 and 2019, where total revenue increased to a high of €233.8 million. Rail services were significantly impacted in 2020, particularly from a dramatic fall in commuter patronage, resulting in revenues falling by 56.5% to €101.6 million.
Table 4A: Annual passenger revenue (millions)
Year / Operator PSO Bus Services PSO Rail Services Light Rail Services Total
2010 €223.4 €162.6 €40.4 €426.4
2011 €221.5 €156.7 €43.7 €421.8
2012 €239.2 €157.9 €46.4 €443.6
2013 €255.0 €166.9 €47.9 €469.8
2014 €268.8 €174.5 €51.2 €494.5
2015 €283.0 €184.2 €54.4 €521.5
2016 €296.8 €193.7 €54.8 €545.3
2017 €305.7 €204.9 €62.0 €572.6
2018 €323.9 €220.9 €73.4 €618.1
2019 €345.5 €233.8 €81.0 €660.3
2020 €187.4 €101.6 €33.5 €322.5
Table 4B: Annual passenger revenue (% Change)
Year / Operator PSO Bus Services PSO Rail Services Light Rail Services Total
2011 -0.8% -3.7% 8.0% -1.1%
2012 8.0% 0.8% 6.4% 5.1%
2013 6.6% 5.7% 3.1% 5.9%
2014 5.4% 4.6% 6.8% 5.3%
2015 5.3% 5.5% 6.3% 5.5%
2016 4.9% 5.2% 0.8% 4.6%
2017 3.0% 5.8% 13.1% 5.0%
2018 5.9% 7.8% 18.4% 7.9%
2019 6.7% 5.8% 10.4% 6.8%
2020 -45.8% -56.5% -58.6% -51.2%
*Figures include cash fares, plus contracted revenue collected.

Bus and Rail Statistics for Ireland | 19
Figure 4.1: Annual Passenger Revenues 2010 - 2020 (millions)
€0
€50
€100
€150
€200
€250
€300
€350
€400
2010 2011 2012 2013 2014 2015 2016 2017 2018 2019 2020
Total PSO Bus Services Total PSO Rail Services Total Light Rail Services
Figure 4.1 shows the annual passenger revenues for each of the public transport modes between 2010 and 2020. In overall terms, in the period up to 2016 PSO passenger revenues grew by an average of 4.2% each year across all modes. In the three years to 2019, however, this accelerated to 6.6%, coinciding with record growth in patronage. If this chart is compared with Figure 1.1 which showed passenger journeys by mode, it can be noted that while bus services nationally carry almost three times the number of passenger journeys compared to rail services, their passenger revenues are more closely
aligned. This is because passenger journeys on rail are often over longer distances and the fare charged is greater than the fare charged on bus where in general terms, passengers are carried a much shorter distance. Similarly with light rail services, while Luas typically carries similar levels of passengers to that of heavy rail services, their revenues are comparatively lower than the other modes as journeys are a lot shorter and therefore have lower fares. As previously discussed, the pandemic in 2020 resulted in significant revenue decline across all modes, with an average reduction of 51.2% nationally.

20 | Bus and Rail Statistics for Ireland
Passenger Revenues by Region
5
Table 5A, 5B and Figure 5.1 shows the passenger revenue from 2013 to 2020 for the Dublin region and change experienced over the past eight years. Dublin city bus services (incorporating services operated by Dublin Bus and Go Ahead Ireland) operate within Dublin City & County, while Dublin Commuter bus services (operated by Bus Éireann and Go Ahead Ireland) also serving Dublin, are included. Also included are rail services operated on Dublin Commuter routes, Dart services, as well as light rail services operated within Dublin City only. Passenger revenues on rail services are not broken down by Iarnród Éireann for the Dublin region and therefore the figures used in tables 5A and 5B are estimates only.
Total passenger revenues in this region have grown steadily between 2013 and 2019 by an average of 5.7% annually across all modes, to a peak in excess of €451.7
million in 2019. This was on the back of record growth in patronage prior to 2020 when overall revenues receded to €219.8 million. Dublin city bus services typically represent approximately 55% of revenue, which increased to 59% in 2020.
Light rail services grew substantially up to 2019, where revenue on Luas services represented the highest revenue growth in the Dublin region at 10.4%. This was followed by Dublin Commuter bus services at 7.9%, supported by service enhancements and tendered services. 2020 saw a decline of 51.3% across the modes, representing a fall of over €230 million from the previous year.
Table 5A: Dublin Region Annual Passenger Revenues (millions)
Year Dublin City Bus Services
Dublin Commuter Bus Services
Dublin Commuter & Dart Rail Services*
Light Rail(Luas) Services
Total Passenger Revenue
2013 €184.9 €26.9 €64.2 €47.9 €323.8
2014 €194.4 €28.1 €68.8 €51.2 €342.5
2015 €204.4 €29.6 €73.6 €54.4 €362.0
2016 €211.7 €31.5 €80.9 €54.8 €379.0
2017 €224.7 €29.2 €85.2 €62.0 €401.1
2018 €234.5 €27.6 €90.7 €73.4 €426.2
2019 €247.5 €29.8 €93.3 €81.0 €451.7
2020 €130.1 €18.1 €38.1 €33.5 €219.8
*Estimated
Table 5B: Dublin Region Annual Passenger 2013 to 2020 (% Change)
Year/ Operator Dublin City Bus Services
Dublin Commuter Bus Services
Dublin Commuter & Dart Rail Services*
Light Rail(Luas) Services
Total Revenue Change
2013 to 2020 -29.6% -32.8% -40.6% -30.0% -32.1%
2019 to 2020 -47.4% -39.4% -59.1% -58.6% -51.3%
*Estimated
Table 5b shows the total change in passenger revenues in the Dublin region between 2013 and 2020 as well as from 2019 to 2020. To put the impact of the COVID-19 global pandemic into context, in the period between
2013 and 2019 there had been an increase of 39.5%, meaning that passenger revenue in 2020 has fallen to in excess of €100 less than that seen eight years previous.

Bus and Rail Statistics for Ireland | 21
Figure 5.1 shows the revenue trends per mode in the Dublin region and in particular the extent of the decline experienced in 2020. The dominance of bus services in the Dublin region remains consistent with previous years, with revenues greater than the other modes combined.
Figure 5.1 Dublin Region Annual Passenger Revenues (millions)
€0
€50
€100
€150
€200
€250
€300
2013 2014 2015 2016 2017 2018 2019 2020
Dublin City Bus Services Dublin Commuter Bus Services
Dublin Commuter & Dart Rail Services Light Rail Services
Tables 5C and 5D show the breakdown of passenger revenues for areas outside the Dublin region. The majority of bus services are operated by Bus Éireann. All rural bus services operated and managed by Local Link are included here even though a small number of their services operate in the Dublin region. Intercity rail services operated by Iarnród Éireann are also included. Passenger revenues from outside the Dublin region in 2020 totalled €101.0 million, representing a fall of just over €100 million compared to 2019. Similar to previous years, passenger revenues outside of the Dublin area equate to approximately 46% to that of Dublin city. The largest contributor to overall passenger revenue continues to be Intercity rail, with 61% of revenue outside of Dublin (€61.6m) arising from this sector.
The impact of the COID-19 pandemic was almost equally as significant to public transport services nationally as it was within the Dublin region, with passenger revenues falling by 49.9% from 2019 levels, down from €201.8 million to €101.0 million.
Bus services in the regional cities experienced strong growth in 2019, with average increases of 16%. This was largely due to the introduction of enhanced timetables by the Authority, combined with increasingly strong passenger journey growth throughout the network. 2020 has, however, seen annual losses averaging 40.1% across regional city services as public health capacity restrictions were imposed nationally.
Table 5C: Annual Passenger Revenues Outside Dublin region (millions)
Year/ Operator
Bus Services Cork city
Bus Services
Galway city
Bus Services Limerick
city
Bus Services
Waterford city*
National Bus
Services
Intercity Rail
Services
Rural Bus Services(Local Link)
Total
2013 €16.1 €5.1 €3.6 €1.0 €16.9 €100.6 €0.7 €143.8
2014 €18.2 €5.8 €3.9 €1.0 €16.9 €103.2 €0.5 €149.5
2015 €20.4 €5.9 €4.0 €1.0 €16.8 €107.8 €0.8 €156.8
2016 €22.7 €6.6 €4.3 €1.0 €18.0 €109.7 €0.9 €163.3
2017 €21.7 €6.7 €4.8 €1.0 €17.0 €116.4 €0.4 €168.0
2018 €22.6 €7.5 €5.4 €1.1 €21.2 €126.7 €1.9 €186.4
2019 €25.6 €8.5 €5.7 €1.4 €22.6 €136.1 €1.8 €201.8
2020 €14.6 €5.1 €3.9 €0.8 €13.4 €61.6 €1.5 €101.0

22 | Bus and Rail Statistics for Ireland
Table 5D: Annual Passenger Revenues Outside Dublin region (% Change)
Year/ Operator
Bus Services Cork city
Bus Services
Galway city
Bus Services Limerick
city
Bus Services
Waterford city*
National Bus
Services
Intercity Rail
Services
Rural Bus Services(Local Link)
Total
2013 to 2020 -8.9% 0.9% 9.0% -19.6% -20.8% -38.7% 131.7% -29.8%
2019 to 2020 -42.9% -40.0% -31.5% -46.1% -40.6% -57.4% -14.6% -49.9%
Passenger revenue growth outside Dublin rose by just over 40% between 2013 and 2019, which is on a par with that seen in Dublin itself, before receding by almost 50% in the year to 2020 due to the impact of the pandemic. Revenue outturns across all market segments up to 2019 was reflective of a number of interventions by the Authority in recent years namely; moderate or minimal fare increases for example on Intercity rail, improved
service provision through reconfiguration of bus services e.g. city networks, the introduction of greater numbers of contracted services on the rural bus network, and the positive impact of the tendering of services to support passenger growth. It is hoped that these improvements will expedite a return to pre pandemic use of public transport in the near future.
Figure 5.2: Annual Passenger Revenues outside Dublin Region (millions)
€0
€20
€40
€60
€80
€100
€120
€140
€160
2013 2014 2015 2016 2017 2018 2019 2020
Bus Services Cork
Rural Bus ServicesIntercity Rail Services
Bus Services Galway Bus Services Limerick
National Bus Services
Bus Services Waterford City
Figures 5.1 and 5.2 show that despite the declines seen in 2020, Dublin city bus services account for the largest portion of passenger revenues in the Dublin region, while revenues on Intercity rail services account for the highest revenues outside the Dublin region (approximately 55% of Dublin city bus revenue). However, Dublin city bus services typically carry approximately 12 times more
passenger journeys than that of Intercity rail. This is reflective of passengers on bus services in Dublin city taking short journeys and paying a relatively small fare, while passengers on Intercity rail services are taking much longer journeys on average and therefore paying a much higher fare.

Bus and Rail Statistics for Ireland | 23
Figure 5.3 Passenger Revenue Change by Market Segment 2019 to 2020
-70%
-60%
-50%
-40%
-30%
-20%
-10%
0%
-59.1% -58.6% -54.7% -47.4% -46.1% -42.9% -40.6% -40.0% -39.4% -31.5%
National Bus Services Bus Services Galway
Dublin Commuter & Dart Rail Services
Dublin Commuter Bus Services
Light Rail Services Dublin City Bus Services
Bus Services Limerick
Bus Services CorkBus Services Waterford City
Iarnród Éireann Intercity
Figure 5.3 shows the passenger revenue change by market segment between 2019 and 2020. To put this chart into context in light of the impact of the COVID-19 pandemic on public transport services, the same comparisons when made between 2013 and 2019 show passenger revenues having increased by 49.3%. As a direct result of passenger numbers decreasing significantly in 2020, the revenue outturn when compared to 2013 now shows an average decline of 21.1% across all market segments nationally.
The percentage decline in passenger revenue is slightly greater than that of passenger journeys (shown in Figure 2.4), which is related to a similarly dramatic decline in the take up of Taxsaver and other period products in 2020, which previously would have supported operator revenues.
Similar to that of passenger journeys, services which ordinarily would either see high levels of commuters have seen the most dramatic decline in passenger revenues, due to the impact of the pandemic in 2020. The regional cities experienced lesser reductions in revenue by comparison, with outturns in Limerick and Galway reflective of comparatively stronger revenue positions in 2013.

24 | Bus and Rail Statistics for Ireland
Free Travel Scheme Revenue
6
The Department of Employment Affairs and Social Protection (DEASP) Free Travel Scheme is available to all persons aged 66 and over living permanently in the State. Some people under 66 may also qualify such as carers in receipt of a Carer’s Allowance, certain other persons in receipt of a Disability Allowance or Invalidity Pension, and spouses/partners of those 66 and over.
Free travel under the Free Travel Scheme is available on most public transport services including PSO bus, rail and light rail services and some ferry services. It is also available on a large number of licensed public bus services operated on a commercial basis. The DEASP spends in the region of €76m on the scheme each year. Funding for the scheme for PSO operators has remained relatively stable since 2010 and has not responded to the significant increase in passenger journeys undertaken by Free Travel Scheme passengers and the significant growth in the population of those over 66 years of age. The Free Travel Scheme funding for PSO operators has
increased by marginally by €5.9m or by 11.7% since 2010, with €56.6 million awarded to PSO operators in 2020.
Table 6A shows annual DEASP payments for the Free Travel Scheme. The CIÉ group, which includes Dublin Bus, Bus Éireann and Iarnród Éireann, receives a block grant each year and divides the grant among the operating companies under an agreed methodology. The differences in revenue in Table 6A from 2010 to 2018 largely reflects timing differences, although in some cases deductions have been made from the payments when services did not operate due to industrial action. Payments to the scheme in 2019 and 2020 include that paid for operators of competitively tendered services, with the final calculation methodology yet to be confirmed with DEASP.
The funding shown in table 6A is included in the passenger revenues in Chapter 4 and 5.
Table 6A: Annual DSP Free Travel Scheme Funding
Year / Operator Total PSO Bus Services
Total PSO Rail Services
Total Light Rail Services Total PSO Services
2010 €33.1 €14.6 €3.0 €50.6
2011 €32.9 €14.6 €4.1 €51.6
2012 €34.2 €14.6 €3.8 €52.6
2013 €34.0 €14.6 €3.4 €52.0
2014 €34.1 €14.5 €3.9 €52.5
2015 €34.1 €14.6 €3.9 €52.7
2016 €34.9 €14.6 €3.9 €53.4
2017 €34.7 €14.6 €3.9 €53.2
2018 €34.7 €14.6 €3.9 €53.2
2019 €38.7 €14.4 €3.9 €57.0
2020 €38.3 €14.4 €3.9 €56.6
Bus and Rail Statistics for Ireland | 25
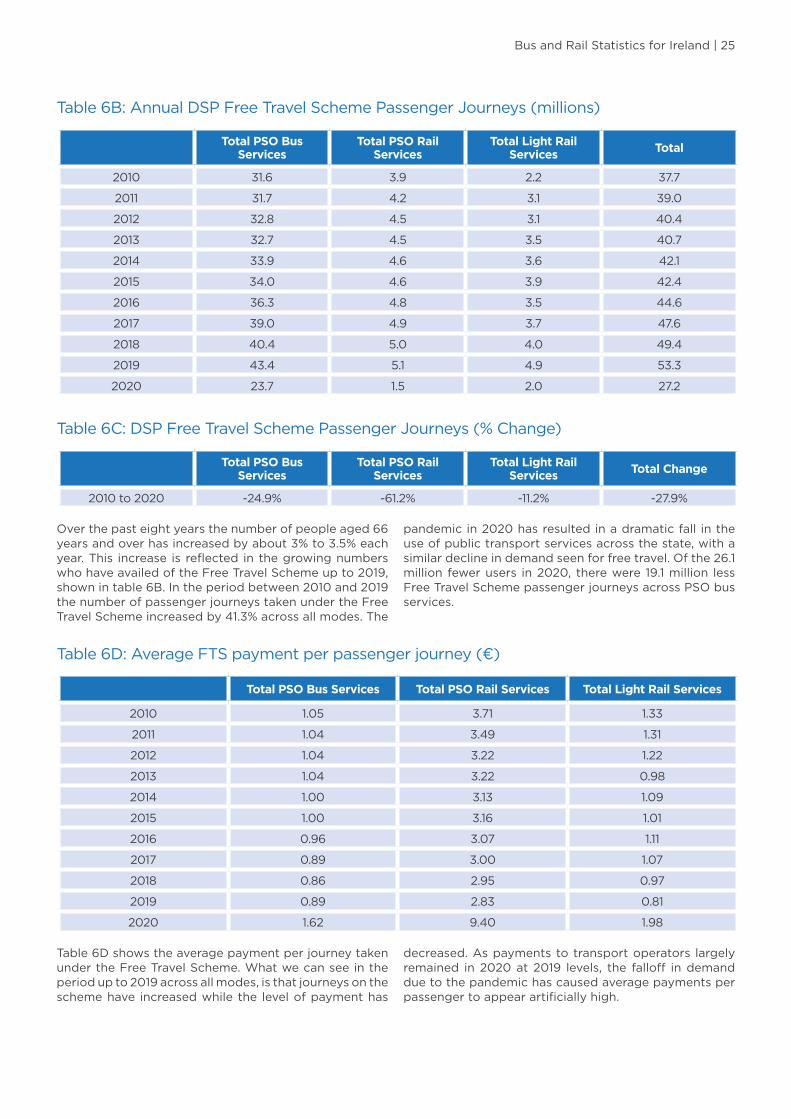
Table 6B: Annual DSP Free Travel Scheme Passenger Journeys (millions)
Total PSO Bus Services
Total PSO Rail Services
Total Light Rail Services Total
2010 31.6 3.9 2.2 37.7
2011 31.7 4.2 3.1 39.0
2012 32.8 4.5 3.1 40.4
2013 32.7 4.5 3.5 40.7
2014 33.9 4.6 3.6 42.1
2015 34.0 4.6 3.9 42.4
2016 36.3 4.8 3.5 44.6
2017 39.0 4.9 3.7 47.6
2018 40.4 5.0 4.0 49.4
2019 43.4 5.1 4.9 53.3
2020 23.7 1.5 2.0 27.2
Table 6C: DSP Free Travel Scheme Passenger Journeys (% Change)
Total PSO Bus Services
Total PSO Rail Services
Total Light Rail Services Total Change
2010 to 2020 -24.9% -61.2% -11.2% -27.9%
Over the past eight years the number of people aged 66 years and over has increased by about 3% to 3.5% each year. This increase is reflected in the growing numbers who have availed of the Free Travel Scheme up to 2019, shown in table 6B. In the period between 2010 and 2019 the number of passenger journeys taken under the Free Travel Scheme increased by 41.3% across all modes. The
pandemic in 2020 has resulted in a dramatic fall in the use of public transport services across the state, with a similar decline in demand seen for free travel. Of the 26.1 million fewer users in 2020, there were 19.1 million less Free Travel Scheme passenger journeys across PSO bus services.
Table 6D: Average FTS payment per passenger journey (€)
Total PSO Bus Services Total PSO Rail Services Total Light Rail Services
2010 1.05 3.71 1.33
2011 1.04 3.49 1.31
2012 1.04 3.22 1.22
2013 1.04 3.22 0.98
2014 1.00 3.13 1.09
2015 1.00 3.16 1.01
2016 0.96 3.07 1.11
2017 0.89 3.00 1.07
2018 0.86 2.95 0.97
2019 0.89 2.83 0.81
2020 1.62 9.40 1.98
Table 6D shows the average payment per journey taken under the Free Travel Scheme. What we can see in the period up to 2019 across all modes, is that journeys on the scheme have increased while the level of payment has
decreased. As payments to transport operators largely remained in 2020 at 2019 levels, the falloff in demand due to the pandemic has caused average payments per passenger to appear artificially high.

26 | Bus and Rail Statistics for Ireland
Public Service Obligation (PSO) Subsidy
7
Public Service Obligation (PSO) funding is provided for socially necessary but commercially unviable bus and rail services. Payments in respect of bus and rail transport contracts since 2010 are set out in Table 7B. Payment for PSO services is governed by public service contracts between the Authority and the relevant operator. The requirements for entering into contracts for provision of PSO services is set out in both EU and Irish legislation. Regulation EC 1370/2007 is the EU wide legal framework governing the regulation of public bus and rail passenger services including the approach for awarding contracts for service delivery and providing PSO compensation for the provision of such services.
The majority of PSO funding goes to Dublin Bus, Bus Éireann and Iarnród Éireann. Contracts with the two bus companies were renewed in December 2014 and again in December 2019 for a further 5 years. The Authority has also entered into another 10 year direct award contract with Iarnród Éireann in 2019, as it is statutorily required to do. These new direct award contracts provided for the transition from net cost contracts to gross cost contracts in 2021. This brought these contracts into line
with the Authority’s competitively tendered contracts. The cost of providing these services are fixed and all fare revenue is transferred to the Authority. PSO payments are then made to the operators to cover the full cost of the operation of the service. Under EU regulation 1370/2007 operators directly awarded public transport contracts are allowed to earn reasonable profit but any higher level of profit is deducted from their annual subsidy payments.
The large public service contracts provide for deductions in payments to operators associated with poor performance across a number of quality metrics as well as incentive payments if performance is higher than the required standard.
A number of additional public transport services, which also receive PSO funding, are provided by other operators procured following public tender competitions. These contracts also operate under a gross cost contract model. Details of these services are outlined in the table below.
Table 7A: Other tendered PSO bus services
Operator Routes operated
Andrew Wharton Coach Hire Route 975 between Cavan and Longford
Bernard Kavanagh & Sons Limited Route 817 between Kilkenny and Dublin
Bus Éireann Routes W1, W2, W3, W4 & W5 in Waterford City
City Direct Routes KK1 / KK2 in Kilkenny City
Go Ahead Ireland 24 urban in Dublin
Go Ahead Ireland 3 regional routes in Kildare
Go Ahead Ireland Route 197 between Swords and Ashbourne
JJ Kavanagh & Sons Route 139 between Naas and Blanchardstown
M&A Coaches Limited Route 828 between Portlaoise and Cashel
Rural transport services provided by operators under the Local Link brand are also funded by the Authority. Significant change in the delivery structure for these services took place in recent years, and additional
funding has been provided for new or improved rural transport services. There are now 15 Local Link offices with the role of managing the programme at local level.

Bus and Rail Statistics for Ireland | 27
Table 7B: PSO Subsidy Payments (millions)
Year / Operator
Dublin Bus PSO
Bus Éireann PSO Iarnród Éireann
Rural Bus (Local Link)
Services
Other Operators Total
2010 €75.8 €45.2 €155.1 €11.0 €0.0 €287.2
2011 €73.0 €43.4 €148.7 €10.6 €0.0 €275.8
2012 €74.8 €36.9 €166.4 €9.8 €0.0 €287.8
2013 €64.5 €34.4 €127.0 €9.6 €0.0 €235.6
2014 €60.0 €34.4 €117.4 €10.1 €0.4 €222.3
2015 €57.7 €33.7 €98.1* €10.7 €1.0 €201.2
2016 €59.6 €40.8 €133.1 €11.9 €0.4 €245.7
2017 €54.0 €52.2 €147.0 €13.7 €7.0** €273.9
2018 €47.5 €54.3 €141.3 €18.6 €6.9*** €268.5***
2019 €53.5 €66.4 €128.4 €22.0 €37.6*** €307.9***
2020 €133.4 €101.1 €239.3 €24.6 €99.1** €597.5
* Iarnród Éireann received additional exchequer funds for their Infrastructure Management business which partly compensated them for a reduction in PSO subsidy payments to their Railway Undertaking business which receives the PSO subsidy payments.
** The payment in 2017 includes a once off payment €6.68m to TII for Luas CrossCity mobilisation costs. There was a further payment of €30.2 million to TII in 2020 to support the operation of Luas services during the COVID-19 pandemic.
*** Payments shown above for “Other operators” are for tendered services, including those operated by Go Ahead Ireland. They are gross payments and do not take into account fare revenue retained by the Authority. The net cost to the Authority of PSO subsidy payments made from 2018-2020 was therefore lower than the payments shown. Also included in 2020 is a payment to TII to support the operation of Luas light rail services during the Covid-19 global pandemic.
Table 7C: PSO Subsidy Payments (% Change)
Year Dublin Bus PSO
Bus Éireann PSO Iarnród Éireann
Rural Bus (Local Link)
Services
Other Operators* Total
2011 -3.6% -4.0% -4.2% -3.5% -4.0%
2012 2.4% -15.1% 11.9% -8.0% 4.4%
2013 -13.7% -6.8% -23.7% -1.4% -18.1%
2014 -7.0% 0.1% -7.6% 4.9% -5.6%
2015 -3.9% -2.0% -16.4% 5.9% 139.8% -9.5%
2016 3.2% 21.1% 35.6% 10.8% -65.1% 22.1%
2017 -9.4% 27.8% 10.5% 15.9% 1867.1% 11.5%
2018 -12.0% 4.0% -3.9% 35.3% -1.6% -2.0%
2019 12.8% 22.3% -9.1% 18.5% 443.7% 14.7%
2020 149.2% 52.2% 86.4% 11.6% 163.8% 94.0%
* See Table 7A: Other tendered PSO Bus services for details

28 | Bus and Rail Statistics for Ireland
Total PSO funding reached a high in 2019, supporting record growth in public transport patronage in the same year (shown in table 7C). Payments to bus operators providing services under gross cost contracts formed the most noteworthy increase in 2019 (€37.6m in total), reflecting the significant investment in enhanced service provision undertaken by the Authority, through the introduction of new services as well as tendering of existing services.
The scale of the impact of the COVID-19 global pandemic on the use of public transport in 2020 was substantial. The vast decline in passenger journeys across the State resulted in considerable fare revenue losses for the Authority, which was absorbed through additional Government funded subvention to ensure services continued to operate in line with public health restrictions. The funding requirement for subsidised
public transport services almost doubled in 2020 from the previous year, with Dublin Bus seeing the most significant increase from €53.5 million in 2019 to €133.4 million in 2020 (149.2%).
In 2019, for the second successive year, the PSO payment to Iarnród Éireann fell slightly to €128.4 million. This was partly a result of continued growth in passenger journeys and associated growth in passenger revenues reducing the level of their PSO subsidy. As previously alluded to, the pandemic in impacted the provision of rail services most significantly, as restrictions on the use of public transport dramatically altered the travel patterns of regular commuters. Resulting fare revenue losses were seismic, with the necessary subvention to maintain services rising by 86.4% to an unprecedented €239.3 million in 2020.
Figure 7.1 PSO Payments 2010 to 2020 (millions)
Other Operators
€0
€50
€100
€150
€200
€250
€300
2010 2011 2012 2013 2014 2015 2016 2017 2018 2019 2020
Dublin Bus Bus Éireann PSO Iarnród Éireann Rural Bus Services
Light rail (Luas) services operated by Transdev Dublin Light Rail Limited experienced deficits between revenue and operating costs between 2011 and 2013. In 2014 Luas operations returned a surplus of €1.94 million, which increased annually to €15.31 million in 2019 as shown in Table 7D and Figure 7.2. Luas did not receive PSO funding from the Authority in 2019, with the Authority agreeing to the balancing of any shortfalls from accumulated cash reserves (which were used to fund the maintenance of
the Luas network along with the Authority’s capital grant funds.) In 2017 TII received a once-off PSO grant of €6.68m towards Luas CrossCity mobilisation costs. The pandemic in 2020 saw a dramatic decline in passenger journeys and fare revenue. After the absorption of existing cash reserves, a subvention payment of €30.2 million was made to TII to maintain services in line with public health restrictions.

Bus and Rail Statistics for Ireland | 29
Table 7D: Surplus/Deficit on Luas Infrastructure activities before interest, tax and depreciation
Year € million
2010 €1.13
2011 -€3.30
2012 -€3.44
2013 -€2.21
2014 €1.94
2015 €4.28
2016 €5.40
2017 €9.15
2018 €10.60
2019 €15.31
2020 -€0.65
Figure 7.2 Surplus/Deficit on Luas Service Operations, 2010 -2020 (millions)
€-5
€0
€5
€10
€15
€20
2010 2011 2012 2013 2014 2015 2016 2017 2018 2019 2020

30 | Bus and Rail Statistics for Ireland
Operator Fleets8
The Luas light rail fleet, shown below in Table 8B, consists of three types of Light Rail vehicle (LRV); those which are 40 metres in length (Citadis 401), those which have been extended to 55 metres (Citadis 402) as part of the Green Line capacity enhancement programme in 2020 and new 55 metre trams which were purchased as part of the same capital expenditure programme for the Greater Dublin area (Citadis 502).
Table 8B: Total tram fleet - 2020
LRV Type Number of LRVs in Fleet
Citadis 401 40
Citadis 402 26
Citadis 502 15
Total 81
The national rail fleet is shown below in Table 8C. Individual train types are generally specific to a particular service, such as Intercity (Intercity Railcar or ICR), Commuter (Diesel Multiple Unit or DMU) etc., however variations of sets may be used on multiple leg journeys throughout a typical day. ICR’s and DMU’s are stated according to the total number of individual sets comprising one train service, so for example, 3 ICR represents a three set ICR service. Also shown are those sets which are exclusive to a service type, namely Cork Commuter (MKIV), Dublin to Belfast Enterprise (DD) and Dart services (EMU).
Table 8C: Total rail fleet - 2020
Train Type Total Fleet
3 ICR (Intercity Railcar) 84
4 ICR (Intercity Railcar) 100
5 ICR (Intercity Railcar) 50
29000 DMU (Diesel Multiple Unit) 116
2800 DMU (Diesel Multiple Unit) 20
2600 DMU (Diesel Multiple Unit) 16
MKIV (Mark 4 Cork Line Trains) 67
DD (De Dietrich Belfast Enterprise Train) 32
EMU (DART Electrical Multiple Unit) 144
Total 629
The total fleet that are owned and/or maintained by operators of all PSO services are outlined in Tables 8A, 8B and 8C. Bus numbers shown are for Quarter 4 of the respective years. Bus numbers required by Dublin Bus and Bus Éireann have increased in recent years as passenger journey numbers have recovered and as a result of the establishment of steady state funding of replacement buses in the fleet. Both the Dublin Bus and Bus Éireann fleets have reduced marginally as a result of buses being allocated to some services which have recently transferred to Go Ahead Ireland as a result of the tendering of services. Bus Éireann hire in additional buses to complement services on some routes but those buses are not included in the table. Also included are all buses owned or maintained in the operation of all other competitively tendered contracted bus services, as outlined at the beginning of this bulletin.
Table 8A: Total Number of Buses
Year Dublin Bus PSO
Bus Éireann
PSO
Other tendered
PSO Services
Quarter 4 2010 1023 400 0
Quarter 4 2011 940 460 0
Quarter 4 2012 914 443 0
Quarter 4 2013 907 453 2
Quarter 4 2014 919 453 3
Quarter 4 2015 943 475 4
Quarter 4 2016 967 517 5
Quarter 4 2017 993 542 5
Quarter 4 2018 987 588 128
Quarter 4 2019 985 574 211
Quarter 4 2020 998 587 211
Bus and Rail Statistics for Ireland | 31
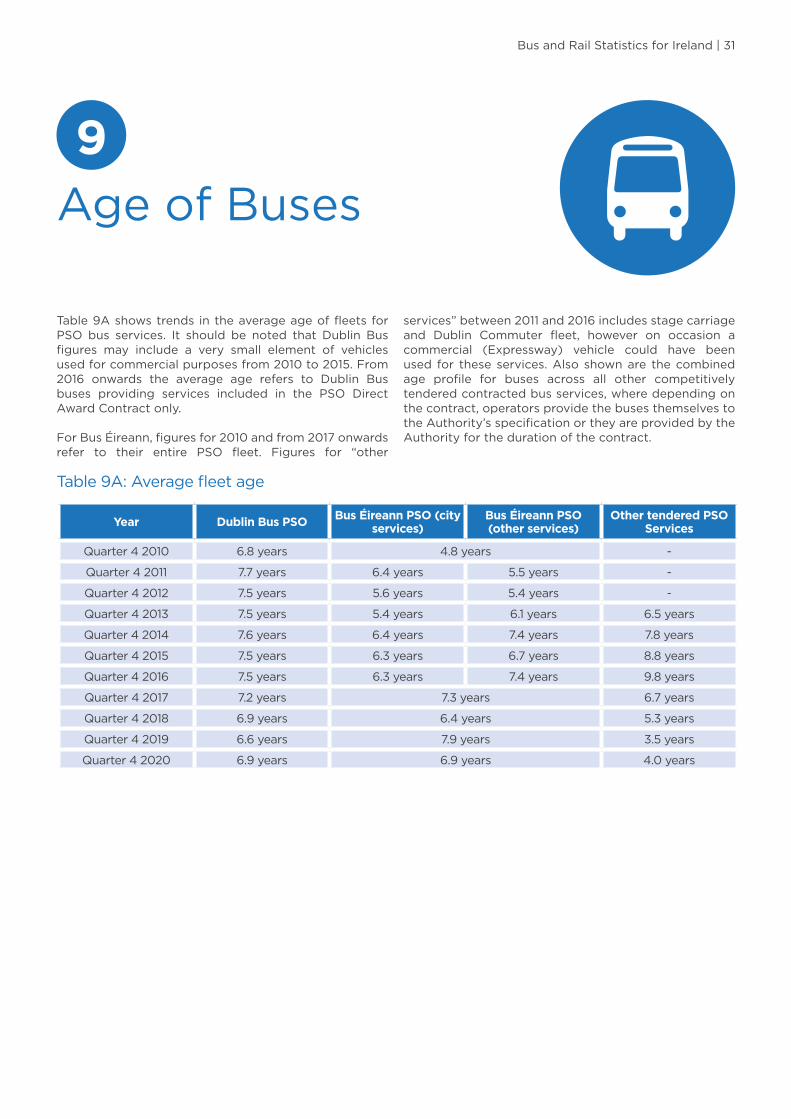
Age of Buses9
Table 9A shows trends in the average age of fleets for PSO bus services. It should be noted that Dublin Bus figures may include a very small element of vehicles used for commercial purposes from 2010 to 2015. From 2016 onwards the average age refers to Dublin Bus buses providing services included in the PSO Direct Award Contract only.
For Bus Éireann, figures for 2010 and from 2017 onwards refer to their entire PSO fleet. Figures for “other
services” between 2011 and 2016 includes stage carriage and Dublin Commuter fleet, however on occasion a commercial (Expressway) vehicle could have been used for these services. Also shown are the combined age profile for buses across all other competitively tendered contracted bus services, where depending on the contract, operators provide the buses themselves to the Authority’s specification or they are provided by the Authority for the duration of the contract.
Table 9A: Average fleet age
Year Dublin Bus PSO Bus Éireann PSO (city services)
Bus Éireann PSO (other services)
Other tendered PSO Services
Quarter 4 2010 6.8 years 4.8 years -
Quarter 4 2011 7.7 years 6.4 years 5.5 years -
Quarter 4 2012 7.5 years 5.6 years 5.4 years -
Quarter 4 2013 7.5 years 5.4 years 6.1 years 6.5 years
Quarter 4 2014 7.6 years 6.4 years 7.4 years 7.8 years
Quarter 4 2015 7.5 years 6.3 years 6.7 years 8.8 years
Quarter 4 2016 7.5 years 6.3 years 7.4 years 9.8 years
Quarter 4 2017 7.2 years 7.3 years 6.7 years
Quarter 4 2018 6.9 years 6.4 years 5.3 years
Quarter 4 2019 6.6 years 7.9 years 3.5 years
Quarter 4 2020 6.9 years 6.9 years 4.0 years

32 | Bus and Rail Statistics for Ireland
Rail Network Changes
10
The major changes to both the Iarnród Éireann and Luas network over the last number of years are outlined in Tables 10A and 10B.
Table 10A: Iarnród Éireann Network Changes
Line extensions / re-openings/suspensions Date
Cork Suburban Rail: Cork to Midleton – Opened Jul-09
Western Railway Corridor: Ennis to Athenry – Re-opened Mar-10
Rosslare to Waterford - Passenger Services Suspended Sep-10
Dublin Suburban Rail (Western Commuter): Clonsilla to M3 Parkway - Opened Sep-10
Kildare line services commence using the Phoenix Park Tunnel (peak only, Mon – Fri) Nov-16
Introduction of the new 10-minute DART timetable Sep-18
Start of construction of new commuter rail station at Pelletstown in west Dublin Jan-20
Table 10B: Luas Network Changes
Line extensions Date
Red Line: Connolly to Docklands – Opened Dec-09
Green Line: Sandyford to Brides Glen - Opened Oct-10
Red Line: Belgard to Saggart - Opened Jul-11
Green Line: St Stephen’s Green to Broombridge - Opened Dec-17

Bus and Rail Statistics for Ireland | 33
Wheelchair Accessible Fleet
11
With low-floor wheelchair accessible buses, access to part or all of the passenger area is direct from the bus stop apron. This enables easier access for wheelchair users and those with limited mobility. Accessing low floor buses also requires that appropriate bus stop infrastructure, for instance kerbs of a specific height, are in place.
Urban bus fleets operated by Dublin Bus, Bus Éireann, Go-Ahead and other operators are fully wheelchair accessible, as can be seen in Table 11A. These fleets comprise single and double decker low floor buses appropriate for short commuter journeys and are fitted with ramps to facilitate wheelchair users.
The rural, regional and commuter bus services operated by Bus Éireann, Go-Ahead and other operators primarily use coaches because those services involve much longer journeys for customers. As coaches are designed to have storage facilities close to ground level with seating above that, the only way of facilitating wheelchair users is by the use of a lift. The wheelchair lifts, which raise the passenger above the steps and into the coach corridor area, are not as readily suitable for wheelchair access as low-floor buses, but they still contribute towards the
overall accessibility of the fleet. All new replacement buses purchased are accessible, although in a small number of cases, a non-accessible bus may be cascaded from their commercial fleet. It is planned that over the next number of years all Bus Éireann buses which are not accessible will be removed from the fleet.
Double-deck coach fleet provided to Bus Éireann and Go Ahead Ireland for commuter services have a low-floor ramp access to the wheelchair space. The Authority has also procured a number of specially designed single deck buses to operate on commuter services that are low-floor and ramp access and these will be provided over the next few years as funding is available to replace the high-floor coach fleet.
While the Iarnród Éireann fleet of trains are fully wheelchair accessible internally, they require a ramp to enable access between the train and the platform. A portable ramp is used for this purpose and these are currently available at staffed stations and on board some trains or by calling Iarnród Éireann in advance of travel. Trams used on Luas light rail services are all wheelchair accessible from the platform.
Table 11A: PSO Operating Fleet that are Wheelchair Accessible
Year Urban bus services* Non-urban bus services* Rail Services Light Rail Services
2013 100% 53% 100% 100%
2014 100% 72% 100% 100%
2015 100% 83% 100% 100%
2016 100% 83% 100% 100%
2017 100% 78% 100% 100%
2018 100% 82% 100% 100%
2019 100% 86% 100% 100%
2020 100% 88% 100% 100%
* Urban bus services include those PSO services operating in Dublin (e.g. Dublin Bus and Go Ahead, including the 197) and the regional cities (e.g. Bus Éireann and City Direct in Kilkenny). Non-urban bus services have been categorised as all other PSO services operating outside of major urban centres (e.g. national stage carriage and commuter).

For Further Information:
Media enquiries:Dermot O’GaraT: +353 (0)1 8798346National Transport AuthorityDún ScéineIveagh CourtHarcourt LaneDublin 2D02 WT20