burns bog ecosystem review · pdf filethe burns bog ecosystem review synthesis report was...
TRANSCRIPT

Burns Bog Ecosystem Review
Synthesis Report
for
Burns Bog, Fraser River Delta, South-western British Columbia,
Canada
March 2000

Canadian Cataloguing in Publication Data Main entry under title: Burns Bog ecosystem review Includes bibliographical references: p. ISBN 0-7726-4191-9 1. Bog ecology - British Columbia - Delta. I. Hebda, Richard Joseph, 1950- . II. British Columbia. Environmental Assessment Office. QH541.5.B63B87 2000 577.68'7'0971133 C00-960112-0 Suggested Reference Hebda, R.J., K. Gustavson, K. Golinski and A.M. Calder, 2000. Burns Bog Ecosystem Review Synthesis Report for Burns Bog, Fraser River Delta, South-western British Columbia, Canada. Environmental Assessment Office, Victoria, BC.

i
Burns Bog Ecosystem Review Synthesis Report
March 2000
Prepared by:
Environmental Assessment Office Province of British Columbia
Written by:
Richard J. Hebda Kent Gustavson Karen Golinski Alan M. Calder
Document Credits The Burns Bog Ecosystem Review Synthesis Report was written by a team of scientists under the direction of the British Columbia Environmental Assessment Office. Dr. Richard J. Hebda led the Review and oversaw the writing of the complete document. Dr. Kent Gustavson (Gustavson Ecological Resource Consulting), Karen Golinski and Alan M. Calder provided major contributions to the Report and reviewed the document in its entirety. Lisa Tallon was responsible for coordinating the compilation of the document. Simon Norris and Susan Westmacott assembled and constructed the maps. Shari Steinbach provided review and administrative support. Principle authorship of individual sections is as follows: 1.0 Introduction............................................................................................ Gustavson, Calder 2.0 Raised Bog Development and Hydrology ............................................................. Golinski 3.0 Study Area and Regional Context ..........................................................Hebda, Gustavson 4.0 Biophysical Characteristics of Burns Bog ..............................................Hebda, Gustavson 5.0 Results of Integration Studies .................................................Hebda, Gustavson, Golinski 6.0 Analysis and Synthesis ..............................................................................................Hebda 7.0 Key Findings and Conclusions ..................................................................................Hebda

ii
Acknowledgements The Environmental Assessment Office (EAO) gratefully acknowledges the generous and dedicated support and advice of the agencies, organizations and individuals that supported and contributed to the Burns Bog Ecosystem Review. We wish to thank, Delta Fraser Properties Partnership (DFPP) and their consultants, particularly Jeff Herold and Glenn Stewart, for their ongoing participation in support of the review process. The kind support and co-operation of the Corporation of Delta, especially Verne Kucy and Rob Rithaler, is greatly appreciated. In addition, we thank Gregory McDade, Q.C., Advisor to the Minister of Environment, Lands and Parks, for his thoughtful advice and for facilitating the Burns Bog Ecosystem Review public involvement process. The co-operation and assistance of the Corporation of Delta, the City of Vancouver, the Greater Vancouver Regional District, the Fraser River Estuary Management Program, the Fraser River Port Authority, Environment Canada, the Canadian Wildlife Service, the Department of Fisheries and Oceans, the BC Ministries of Environment, Lands and Parks (MELP), Agriculture and Food, Transportation and Highways, and Small Business, Tourism and Culture, and the Royal British Columbia Museum were critical to the review and completion of the technical studies. The committed efforts of the various consultant teams who contributed to the supporting studies are also appreciated. We also thank the many scientists and experts who contributed considerable time, effort, and expertise in participating in a series of the Technical Review Meetings. Thank you for your participation, your instructive contributions during the sessions, and your willingness to provide further counsel. Thank you also for your thoughtful answers to questions from members of the public. In addition, the EAO wishes to thank the members of the public and organizations who made submissions and participated in the workshops and meetings for their efforts in the public interest. In particular we thank the Burns Bog Conservation Society for their support and participation in the review process. Finally, the EAO wishes to thank all those involved in the preparation and review of the Synthesis
Report. In particular, we thank the Land Use Coordination Office for their analytical and mapping support, as well as those who kindly agreed to review key sections of the document. Burns Bog Ecosystem Review Team (EAO)
Richard Hebda, Alan Calder, Lisa Tallon, Shari Steinbach, Daphne Stancil and Susan Ellis. Synthesis Report Peer Review Team
Dr. Joe Antos (University of Victoria), Dr. Antoni Damman (Kansas State University), Dr. Paul Glaser (University of Minnesota), Dr. John Jeglum (Swedish University of Agricultural Sciences), Dave Nagorsen (Royal British Columbia Museum), Dr. Geoff Scudder (University of British Columbia). Dr Eric Taylor (Atmospheric Environment Service), Dr. Pat Monahan (Monahan Petroleum Consulting), Dr. Sergei Yazvenko (LGL Limited).
iii
MELP Lower Mainland Regional Office staff
Tony Barnard, Brian Clark, Dave Dunbar, Jack Evans, Liz Freyman, Duane Jesson, Rob Knight, Tom Plath, Marvin Rosenau, Mel Turner and Marc Zubel. Technical Review Meeting Participants
Allan Banner (BC Ministry of Forests), Ken Brock (Canadian Wildlife Service), John Christy (Oregon Heritage Program/The Nature Conservancy), Brian Clark (MELP), Allan Dakin (Piteau Associates Engineering Ltd.), Dr. Antoni Damman (Kansas State University), Klaus Dierssen (University of Kiel, Germany), Dave Dunbar (MELP), Don Eastman (University of Victoria), Paul Glaser (University of Minnesota), John Jeglum (Swedish University of Agricultural Sciences), Charlotte MacAlister (University of Newcastle), Colin Levings (Fisheries and Oceans Canada), Ian McTaggart-Cowan, Dave Nagorsen (Royal BC Museum), Hans Roemer (MELP), Richard Rothwell (University of Alberta), Geoff Scudder (University of British Columbia), Jamie Smith (University of British Columbia), Scott Smith (Agriculture and Agri-Food Canada), Glenn Stewart (ENKON Environmental Limited), Charles Tarnocai (Agriculture and Agri-Food Canada), Eric Taylor (Environment Canada), Terry Taylor, Dale Vitt (University of Alberta), Doyle Wells (Natural Resources Canada) and Marc Zubel (MELP). Environmental Assessment Office
Sheila Wynn, Patty Shelton, Paul Finkel, Joanne McGachie, Martyn Glassman, Lynn Ostle, Janet Rogers, Margaret Achadinha, Crista Osman, Tawnya Ritco, Cheryl Weiss, Diana Elliott, Tamara Armstrong, Sharon Lacoste, Yassamin Abhar, Donna Santori and the EAO Registry staff. Consultants to the EAO
Don DeMill, ENKON Information Systems, Karen Golinski and Nick Page, Kent Gustavson (Gustavson Ecological Resource Consulting), Patricia Howie and Erika Britney (Praxis Pacific), Richard Sims and Jeff Mattheson (EBA Engineering Consultants Ltd.) and Sergei Yazvenko (LGL Limited). Land Use Coordination Office
David Johns, Don Howes, Simon Norris, Susan Westmacott, Linda Hartley, Janet McIntosh and Judy Nicholson. Consultants supporting the Burns Bog Ecosystem Review
John Lambert, Ryanne Metcalf, Larry Turchenek, Prashant Kumar and John Wiens (AGRA Earth and Environmental); Dennis Knopp and L. Larkin (BC's Wild Heritage Consultants); Oluna and Adolf Ceska; Richard Collier; Sheldon Helbert and John Balfour (EBA Engineering Consultants); Niko Zorkin and Michael McClorg (ENKON Information Systems); Martin Gebauer and Ken Summers (Enviro-Pacific Consulting), Ze'ev Gedalof (Flat Earth Neogeographics); R.G. Humphries and T. Oke (Levelton Engineering Ltd.); Jan Teversham, Ksenia Barton and Bryan Tasaka (Madrone Consultants Ltd.); McElhanney Consulting Services Ltd.; Mark Fraker, Claudio Bianchini, K. Anré McIntosh, Ian Robertson (Robertson Environmental Services); Rex Kenner and Karen Needham (Spencer Entomological Museum, UBC); Dale Vitt, Linda Halsey and Jennifer Doubt (University of Alberta); Mike Whelen (M.A. Whelen and Associates Ltd.).

iv
Executive Summary Burns Bog is a raised bog ecosystem covering approximately 3,000 ha of the Fraser River delta between the south arm of the Fraser River and Boundary Bay. On June 1, 1999, the Government of British Columbia and Delta Fraser Properties Partnership – the owners of 2,200 ha of land within the Bog - agreed to undertake an ecosystem review to gain a full understanding of what is needed to preserve the ecological integrity of Burns Bog. The purpose of the Burns Bog Ecosystem Review (the Review) was to determine the factors crucial to preserving Burns Bog as a viable ecosystem, such as the hydrology, geology, flora and fauna. The BC Environmental Assessment Office (EAO) was charged with managing the review process. The public and stakeholders contributed to developing the nature and scope of the studies undertaken. Gregory McDade, Q.C., Advisor to the Minister of Environment, Lands and Parks, facilitated public involvement throughout the review process. The public participated in reviewing study progress, and in Technical Review Meetings involving local, regional and international scientific experts. All project materials were accessible through the EAO Project Registry, at local information outlets, and over the Internet. The key Review findings and conclusions were developed from the results of technical studies, written submissions, Technical Review Meetings, and additional information and models developed by the EAO. The data and models available were generally adequate to lead to conclusions concerning the requirements for the ecological viability of Burns Bog. However, the data and analyses used in the Review were limited by the short duration of the study, a lack of previous investigations, and limited comparative data and examples. Burns Bog is globally unique on the basis of its chemistry, form, flora and large size. The Bog exhibits the typical characteristics of a raised bog ecosystem, including a peat mound above the regional water table, an internal water mound, acidic nutrient-poor water derived directly from precipitation, a two-layered peat deposit, and widespread peatland communities dominated by Sphagnum and members of the Heather family. Today, the Bog is largely isolated from other natural areas by agricultural, residential and industrial development. Forty percent of the original bog area has been alienated by development. Many activities, especially peat mining, have disturbed the hydrology and ecosystems of more than half of the remaining bog area and these disturbances continue to affect the Bog today. Despite these disturbances, Burns Bog retains important ecological processes and continues to support distinct biotic communities. The destruction of vegetation and the upper porous acrotelm layer, combined with the alteration of the hydrological and soil regimes, have impeded the peat-formation process. The Bog's hydrology is shaped by the water mound, fluctuating water levels in the acrotelm zone (top 50 cm), and an extensive system of ditches. The Bog’s ecological viability is directly dependent on the extent and integrity of the water mound and the peat that encloses it. The upper porous acrotelm layer is vital to the persistence of the water mound and peat-forming communities dominated by Sphagnum mosses. Only 29% of the Bog’s original acrotelm and its

v
dynamic water storage zone remain intact. Water from the east side of Highway 91 may play an important role in sustaining shallow pools that support the main water mound. The acrotelm plays a vital role in regulating and storing water. As a result of increased rapid discharge through ditches, the average position of the water table in the acrotelm is about 25 cm lower than it was in the 1930s. Many ditches reach to the centre of the water mound from all directions and threaten the future of the Bog. None of the natural drainage channels and little of the essential lagg zone at the margins remain in the Bog. Further disruption of the water mound poses high risk to the viability of Burns Bog. The existing area of acrotelm must be maintained and a fully functional acrotelm must re-develop over the area of the water mound. A fully functioning lagg is required at the margins of the water mound. The lagg receives normal discharge from the bog and buffers bog water from adjacent mineral water. The overall loss of water storage and associated decline in the water table in the past few decades have contributed to the advance of forested vegetation adjacent to the lagg zone. The Bog’s water balance suggests a surplus of about 200 mm of precipitation over evapotranspiration for an average year. Monthly water balance analysis for an average year shows that there is a moisture deficit from April to September. The relatively low late summer water table, in the range of 27-39 cm below the surface, may explain why Burns Bog is located near the climatic limits for raised bogs on the west coast of North America. Typical bog water occurs in much of the main part of the Bog. It has low pH and relatively low calcium concentrations. A relatively narrow zone of transitional water, confined to the peat mass, separates bog water from surrounding mineral-rich waters. Non-bog water with moderate pH and relatively high mineral concentrations occurs outside the zone of transitional water and appears to be constrained outside the peat mass. Typical bog ecosystems are associated primarily with true bog water, and associated, in part, with transitional water. Originally, the Bog was covered in open heath and Sphagnum vegetation with scattered scrub pines. Today seven forest, nine shrubby and herbaceous, and six sparsely vegetated ecosystems occur. The unforested phases of the Lodgepole pine–Sphagnum ecosystem are likely responsible for most of the peat formation. Herbaceous ecosystems occur widely on abandoned peat workings and in some natural areas. Lodgepole pine and birch forests encircle the peat-forming central zone. Other forests, mostly dominated by western redcedar, occur mainly east of Highway 91. These forests include scattered old-growth trees and are considered to be regionally rare. Hardhack communities occur in the lagg zone at the Bog margins under influence of mineral-rich groundwater. The undisturbed peat-forming plant communities of the southern third and the north-west sector of the Bog are vital to its survival. Various plant species, including cloudberry, bog-rosemary, crowberry and velvet-leaf blueberry, occur at the limits of their geographic range and are recognized as genetically and ecologically important. The Bog also supports at least 12 species of Sphagnum, which constitutes 86% of the regional Sphagnum flora.

vi
The Burns Bog area includes several nationally and provincially listed animals in both the core central area and at the periphery. The Bog harbours the only known population of the red-listed Southern Red-backed Vole in the province, as well as the red-listed Pacific Water Shrew. It provides critical habitat for the regional Greater Sandhill Crane population. Rare dragonflies and water boatmen occur in the distinct wet habitats of the Bog. Areas at the Bog's periphery are especially important to rare species and wildlife diversity. The Bog plays an important regional role in ecological and wildlife diversity by providing habitat for Fraser River estuary waterfowl, and maintaining the largest extent of bog ecosystems in the Fraser Lowland. The Bog area is highly sensitive to fire because only about 540 ha of fully functional peat-forming vegetation may survive the next 100 years under the current fire regime. The Bog is also at risk to a series of drought years that could markedly lower the position of the late summer water table and threaten typical bog communities. The Bog area must remain large to withstand these disturbances. Connectivity is limited, but is required to maintain wildlife corridors and the long-term viability of the Bog. The conditions for recovery of Burns Bog ecosystems are favourable because there are many patches of bog vegetation in the disturbed area and a large natural zone surrounding the disturbed core. Widespread Sphagnum regeneration is occurring in the abandoned peat workings of the central bog. To ensure the Bog’s ecological integrity and viability, the entire extant water mound and most of the lagg zone are required. This requirement includes all of the west and central portions of the Bog. The area east of Highway 91 and north of 72nd Avenue is required to support high biodiversity attributes, to provide water to the main part of the Bog west of Highway 91, and to connect the Bog to upland habitats. The main water mound zone needs to be connected to the area east of Highway 91 via a broad zone of Sphagnum regeneration and typical bog water. Water in the shallow ponds within this zone supports the water mound. To sustain the water mound and peat-forming vegetation, ditches that drain the core of the Bog must be blocked as soon as possible or the Bog will not survive. In summary, the area required to preserve Burns Bog as a viable ecosystem includes about 2,450 ha of the remaining bog. Approximately 360 ha, mostly in the south-east and north-east portions of the study area, have significant values that support the Bog, but that are not required to ensure ecological viability. Only 14 ha are of low or no value to ecological integrity. Further studies of hydrology and wildlife are required to define the ecological configuration of specific sites at the margins of the area required for viability. A program of ongoing monitoring of key indicators of ecological integrity should be established to ensure the viability of this globally unique ecosystem.


vii
Table of Contents Document Credits ............................................................................................................................ i Acknowledgements......................................................................................................................... ii Executive Summary ....................................................................................................................... iv List of Tables ................................................................................................................................. xi List of Figures ............................................................................................................................... xii 1.0 Introduction............................................................................................................................1
1.1 The Issue ..............................................................................................................................1 1.2 Review Approach.................................................................................................................1 1.3 Ecosystem Sustainability .....................................................................................................4
1.3.1 Concepts of Ecosystem Sustainability ............................................................................5 1.3.2 Ecosystem Sustainability and the Burns Bog Ecosystem Review..................................8
1.4 Report Organization...........................................................................................................12 2.0 Raised Bog Development and Hydrology ..........................................................................13
2.1 Peat Accumulation and Raised Bog Formation .................................................................13 2.1.1 Functional Layers in Raised Bogs ................................................................................14 2.1.2 Bog Shape .....................................................................................................................16
2.2 The Water Balance.............................................................................................................16 2.3 Models of Raised Bog Hydrology .....................................................................................18
2.3.1 Capillary Model ............................................................................................................18 2.3.2 Groundwater Mound Model..........................................................................................18 2.3.3 Methane Bubble Hypothesis .........................................................................................19 2.3.4 Groundwater Flow Reversal Hypothesis ......................................................................19
2.4 Bog Chemistry ...................................................................................................................19 2.5 Effects of Drainage ............................................................................................................20
3.0 Study Area and Regional Context ......................................................................................22 3.1 Physiography and Geology................................................................................................22 3.2 Climate...............................................................................................................................23 3.3 Regional Vegetation ..........................................................................................................25 3.4 Wildlife ..............................................................................................................................25 3.5 Historic Vegetation ............................................................................................................27 3.6 Origin and Development of Burns Bog .............................................................................29 3.7 Land Use ............................................................................................................................30
3.7.1 Recent Land Use ...........................................................................................................30 3.7.2 Land Use and Extent of the Bog ...................................................................................31
3.8 First Nations Use/Interests.................................................................................................31 4.0 Biophysical Characteristics of Burns Bog .........................................................................34
4.1 Introduction........................................................................................................................34 4.2 Physical Setting..................................................................................................................34
4.2.1 Geology .........................................................................................................................34 4.2.2 Bog Profiles...................................................................................................................38

viii
4.2.3 Native Soils ...................................................................................................................42 4.2.3.1 Soils and Disturbance ........................................................................................ 44
4.2.4 Contaminated Soils, Surface Water and Groundwater .................................................47 4.2.5 Hydrology .....................................................................................................................50
4.2.5.1 Climate............................................................................................................... 50 4.2.5.2 Historical Hydrologic Configuration and Drainage Patterns............................. 51 4.2.5.3 Modern Surface Hydrologic Patterns ................................................................ 57
Drainage Zones .............................................................................................................. 60 Ponds.............................................................................................................................. 66 Ditches ........................................................................................................................... 67 Comparison of 1999 to 1930 internal drainage ............................................................. 67
4.2.5.4 Hydrogeology and Groundwater ....................................................................... 70 Bog Water Table............................................................................................................ 70
4.2.5.5 Water Storage..................................................................................................... 75 4.2.5.6 Water Balance.................................................................................................... 81
4.2.6 Water Chemistry ...........................................................................................................91 4.2.6.1 Raised Bog Water Chemistry............................................................................. 91 4.2.6.2 Regional Water Types........................................................................................ 92 4.2.6.3 Burns Bog Water Types..................................................................................... 93 4.2.6.4 Water Chemistry and Vegetation Type.............................................................. 94
4.3 Biological Setting ..............................................................................................................96 4.3.1 Plant Communities, Plants and Fungi ...........................................................................96
4.3.1.1 Plant Communities............................................................................................. 97 4.3.1.2 Plant, Lichen and Fungal Species .................................................................... 107 4.3.1.3 Rare Ecosystems and Species .......................................................................... 108
4.3.2 Wildlife and Fisheries .................................................................................................109 4.3.2.1 Birds................................................................................................................. 109
Greater Sandhill Crane ................................................................................................ 110 Waterbirds.................................................................................................................... 114 Raptors ......................................................................................................................... 116 Rare and Endangered Bird Species.............................................................................. 120
4.3.2.2 Mammals.......................................................................................................... 123 Small Mammals ........................................................................................................... 123 Black Bears and Black-tailed Deer.............................................................................. 127 Rare and Endangered Mammal Species ...................................................................... 128
4.3.2.3 Invertebrates..................................................................................................... 132 4.3.2.4 Amphibians and Reptiles ................................................................................. 134 4.3.2.5 Fisheries ........................................................................................................... 138
Water Quality and the Potential to Support Fish ......................................................... 138 Potential Fish Habitat .................................................................................................. 139 Fish Occurrence ........................................................................................................... 139 Connections to Fish-bearing Waters............................................................................ 140

ix
5.0 Results of Integration Studies ...........................................................................................143 5.1 Introduction......................................................................................................................143 5.2 Ecosystem Processes........................................................................................................143
5.2.1 Disturbance .................................................................................................................143 5.2.1.1 Peat Harvesting and Ditches ............................................................................ 145 5.2.1.2 Fire ................................................................................................................... 148 5.2.1.3 Landfill............................................................................................................. 148 5.2.1.4 Clearing............................................................................................................ 149 5.2.1.5 Cultivation ....................................................................................................... 150 5.2.1.6 Other Disturbances .......................................................................................... 153
5.2.2 Exotic Species .............................................................................................................153 5.2.3 Dynamics of Indicator Species....................................................................................154
5.2.3.1 Sphagnum Regeneration .................................................................................. 155 5.2.3.2 Other Indicators of Ecosystem Change ........................................................... 160
5.2.4 Tree Ring Studies........................................................................................................164 5.3 Restoration Techniques....................................................................................................167 5.4 Ecosystem Integrity .........................................................................................................171 5.5 Global and Regional Significance ...................................................................................176
5.5.1 Global and Regional Comparisons of Biological Diversity........................................176 5.5.2 Bogs of the Fraser Lowland ........................................................................................177
5.5.2.1 Vascular Plants ................................................................................................ 183 5.5.2.2 Sphagnum ........................................................................................................ 184 5.5.2.3 Effects of Disturbance on Bog Vegetation ...................................................... 185
5.5.3 Policy and Legislative Obligations for the Conservation of Burns Bog.....................186 5.5.4 Atmospheric Processes................................................................................................187
5.5.4.1 Methane and Carbon Dioxide .......................................................................... 187 5.5.4.2 Thermal Impact of Burns Bog ......................................................................... 189
6.0 Analysis and Synthesis.......................................................................................................191 6.1 Approach to Integration and Synthesis............................................................................191 6.2 Spatial Extent ...................................................................................................................191 6.3 Hydrology ........................................................................................................................191 6.4 Biodiversity......................................................................................................................201
6.4.1 Preserving the Bog Community ..................................................................................201 6.4.2 Wildlife .......................................................................................................................202
6.4.2.1 Greater Sandhill Crane..................................................................................... 202 6.4.2.2 Southern Red-backed Vole .............................................................................. 203 6.4.2.3 Red- and Blue-Listed Species.......................................................................... 204
6.4.3 Conservation Biology Analysis ..................................................................................204 6.4.3.1 Size and Biodiversity ....................................................................................... 205 6.4.3.2 Shape and Biodiversity .................................................................................... 206
6.4.4 Connectivity ................................................................................................................207
x
6.5 Disturbance ......................................................................................................................208 6.5.1 Fire Modelling.............................................................................................................209 6.5.2 Drought Modelling......................................................................................................213
6.6 Gaps and Limitations .......................................................................................................218 6.6.1 Data Limitations..........................................................................................................218 6.6.2 Lack of Comparative Data ..........................................................................................221 6.6.3 Concepts and Models ..................................................................................................221 6.6.4 Lack of Examples........................................................................................................222
6.7 Summary Analysis ...........................................................................................................222 7.0 Key Findings and Conclusions..........................................................................................233
7.1 Physical Characteristics ...................................................................................................233 7.2 Biological Characteristics ................................................................................................235 7.3 Disturbance ......................................................................................................................236 7.4 Ecosystem Dynamics .......................................................................................................237 7.5 Global and Regional Significance ...................................................................................238 7.6 Ecological Viability .........................................................................................................239 7.7 Conclusions......................................................................................................................241
General......................................................................................................................... 241 Hydrology .................................................................................................................... 241 Biota............................................................................................................................. 241 Processes...................................................................................................................... 242 Viable Area .................................................................................................................. 242
8.0 References Cited.................................................................................................................243 9.0 Appendices..........................................................................................................................271
Appendix A Burns Bog Ecosystem Review Process Appendix B Public Involvement in the Burns Bog Ecosystem Review Appendix C Outline of Technical Review Meetings Appendix D Technical Reports and Working Documents Prepared in Support of the
Burns Bog Ecosystem Review Appendix E Botanical Names and Authorities Appendix F Common and Botanical Plant and Lichen Names Appendix G Ecosystem Classification and Mapping: Explanation of Coding in Table 4.11 Appendix H Peat Harvesting Methods Appendix I Burns Bog Ecosystem Review Spatial Summary Analysis as it Pertains to
Municipally Owned Lands Adjacent to Burns Bog.

xi
List of Tables Table 1.1 Essential ecosystem characteristics. ............................................................................... 9 Table 4.1 Soil series and variants of the Burns Bog area. ............................................................ 43 Table 4.2 Discharge structures controlling flow to and from the Fraser River. ........................... 59 Table 4.3 Discharge structures controlling flow into Boundary Bay. .......................................... 60 Table 4.4 Comparison of contemporary runoff fluxes from drainage zones. ............................... 61 Table 4.5 Water flow observations in Burns Bog, February 8, 2000. .......................................... 64 Table 4.6 Lengths, areas and relative coverage of ditches and estimated drainage areas in Burns
Bog. ....................................................................................................................................... 69 Table 4.7 Types of water storage, their characteristics and comparison of pre-disturbance to
modern condition................................................................................................................... 76 Table 4.8 Area enclosed by 0.5 m contours in Burns Bog. .......................................................... 78 Table 4.9a Summary of south-north cross-sectional profile changes. .......................................... 79 Table 4.9b Summary of west–east cross-sectional profile changes.............................................. 79 Table 4.10 Summary of water chemistry characteristics of Burns Bog water types .................... 93 Table 4.11 Ecosystem categories and their characteristics in Burns Bog. ................................... 98 Table 4.12 Lodgepole Pine–Sphagnum ecosystems. .................................................................. 104 Table 4.13 Past and present plant and macrofungus species inventories. .................................. 107 Table 4.14 Provincially red-listed (endangered or threatened) and blue-listed (vulnerable) bird
species confirmed for Burns Bog.. ...................................................................................... 121 Table 4.15 Small mammals (insectivore, small rodent, lagomorph and mustelid species)
confirmed for Burns Bog..................................................................................................... 126 Table 4.16 Confirmed and potential rare and endangered species of invertebrates in Burns Bog.
............................................................................................................................................. 133 Table 5.1 Disturbance types in Burns Bog ................................................................................. 144 Table 5.2 Invasive and potentially invasive plant species of Burns Bog. .................................. 151 Table 5.3 Sphagnum biomass and accumulation rates. .............................................................. 156 Table 5.4 Plants that indicate potential problems with respect to revegetation by bog species . 161 Table 5.5 Tree-ring-width statistics for site 99-BBS east of Highway 91.................................. 167 Table 5.6 Disturbance types in Burns Bog, relevant restoration literature and topics covered.. 170 Table 5.7 Essential ecosystem characteristics, associated attributes and indicators for assessing
the integrity of the Burns Bog ecosystem complex............................................................. 174 Table 5.8 Status of remaining bogs in the Fraser Lowland. ....................................................... 178 Table 5.9 Bogs eliminated by urban development and agriculture in the Fraser Lowland. ....... 182 Table 6.1 Successional stages of modern vegetation cover used to model the impact of fire.... 209


xii
List of Figures Figure 1.1 Western portion of the Lower Mainland of British Columbia, showing the location of
Burns Bog................................................................................................................................ 3 Figure 2.1 Functional layers and seasonal variation in the water table of undisturbed raised bogs
............................................................................................................................................... 14 Figure 2.2 Properties of acrotelm and catotelm of peat bogs. ...................................................... 15 Figure 2.3 Raised bog in cross-section (a) and plan view (b) showing water inputs and outputs as
labelled arrows. ..................................................................................................................... 17 Figure 2.4 Effect of drainage ditch on water-table position. ........................................................ 20 Figure 3.2 Mean monthly temperatures and precipitation for the Burns Bog study area............. 23 Figure 3.1 Burns Bog study area showing 5 m interval elevation contours. ................................ 24 Figure 3.3 Original vegetation cover of the southern Fraser River delta, south-western British
Columbia, based on land survey notes 1873-74.................................................................... 28 Figure 3.4 Regional land use. ....................................................................................................... 33 Figure 4.1 East-west geologic cross-section through Burns Bog ................................................. 36 Figure 4.2 Surficial geology of the Burns Bog area ..................................................................... 37 Figure 4.3 Current elevations within Burns Bog at 0.5 m intervals. ............................................ 40 Figure 4.4 Historic and current surface elevation profiles throughout Burns Bog....................... 41 Figure 4.5 Native soils of the Burns Bog area. ............................................................................. 46 Figure 4.6 Contaminated soil sites of the Burns Bog area............................................................ 49 Figure 4.7 Isohyets of annual precipitation. ................................................................................. 51 Figure 4.9 1898 chart of the Fraser River delta showing Burns Bog area (horizontal lines) and
drainage (arrow) to the south................................................................................................. 53 Figure 4.8 Historical drainage patterns of Burns Bog superimposed on 1930 aerial photograph.54 Figure 4.10a Modern effect of drainage ditches. .......................................................................... 55 Figure 4.10b Historic effect of drainage ditches........................................................................... 56 Figure 4.11 Modern hydrology of the Burns Bog area................................................................. 63 Figure 4.12 Water table variation and precipitation, June 1998 to April 1999, in south-east Burns
Bog ........................................................................................................................................ 71 Figure 4.13a Comparison of the extent of area with water-table position above 70 cm. ............. 73 Figure 4.13b Comparison of the extent of area with water-table position above 50 cm. ............. 74 Figure 4.14 Method of calculating volume change. ..................................................................... 78 Figure 4.15 Monthly water balance for a Triggs soil in the western portion of Burns Bog......... 83 Figure 4.16 Monthly summary of water balance for Burns Bog, interception included. ............. 90 Figure 4.17 Distribution of water types of Burns Bog based on water chemistry........................ 95 Figure 4.18 Distribution of simplified vegetation types in Burns Bog....................................... 102 Figure 4.19 Relatively undisturbed plant communities of the Burns Bog area. ......................... 105 Figure 4.20 Greater Sandhill Crane occurrence in spring and fall of 1999 in the Burns Bog study
area. ..................................................................................................................................... 112 Figure 4.21 Terrestrial Ecosystem Mapping of habitat suitability for the Greater Sandhill Crane
in the Burns Bog study area. ............................................................................................... 113 Figure 4.22 Terrestrial Ecosystem Mapping of habitat suitability for raptors in the Burns Bog
study area............................................................................................................................. 119

xiii
Figure 4.23 Terrestrial Ecosystem Mapping of habitat suitability for four rare and endangered bird species (American Bittern, Barn Owl, Hutton’s Vireo, Greater Sandhill Crane) in the Burns Bog study area. ......................................................................................................... 122
Figure 4.24 Terrestrial Ecosystem Mapping of habitat suitability for small mammal diversity in the Burns Bog study area..................................................................................................... 125
Figure 4.25 Terrestrial Ecosystem Mapping of habitat suitability for the Southern Red-backed Vole in the Burns Bog study area........................................................................................ 130
Figure 4.26 Terrestrial Ecosystem Mapping of habitat suitability for three rare and endangered mammal species (Pacific Water Shrew, Southern Red-backed Vole, Trowbridge’s Shrew) in the Burns Bog study area..................................................................................................... 131
Figure 4.27 Location of sightings of native amphibian species and reptiles in the Burns Bog study area during the late summer and early fall of 1999. .................................................. 136
Figure 4.28 Terrestrial Ecosystem Mapping of habitat suitability for amphibian diversity in the Burns Bog study area. ......................................................................................................... 137
Figure 4.29 Connectivity of sloughs and ditches associated with Burns Bog drainage to major fish producing water bodies. ............................................................................................... 142
Figure 5.1 Distribution of disturbance types in Burns Bog. ....................................................... 147 Figure 5.2 Sphagnum cover in Burns Bog. ................................................................................. 158 Figure 5.3 Sphagnum biomass accumulation in relation to time since peat harvesting. ............ 159 Figure 5.4 Cover of indicator species along a 250 m transect from the edge of Burns Bog inward.
............................................................................................................................................. 161 Figure 5.5 The dynamic status of ecosystems in Burns Bog. ..................................................... 163 Figure 5.6 Filtered ring-width series for Transects A, B, and C in Burns Bog. ......................... 165 Figure 5.7 Locations of peatlands in the Fraser Lowland........................................................... 181 Figure 6.1 Changes in badly-damaged peat remnants subject to natural processes of peat
decomposition...................................................................................................................... 195 Figure 6.2 The role of ditches in Burns Bog and its affect on average water-table positions over
the year. ............................................................................................................................... 199 Figure 6.3 Fire disturbance model results showing area of climax peat-forming habitat remaining
after four different fire scenarios......................................................................................... 212 Figure 6.4 Monthly summary of water balance, for a period of one dry year. ........................... 216 Figure 6.5 Monthly summary of water balance, for a period of three dry years. ....................... 217 Figure 6.6 Water mound and water chemistry attributes of Burns Bog. .................................... 226 Figure 6.7 Undisturbed vegetation and Sphagnum cover in Burns Bog..................................... 227 Figure 6.8 Habitat suitability for rare small mammals and birds in Burns Bog. ........................ 228 Figure 6.9 Habitat suitability for wildlife diversity in Burns Bog.............................................. 229 Figure 6.10 Summary map of ecological viabilty of Burns Bog. ............................................... 232

1
1.0 Introduction
1.1 The Issue
Burns Bog (the Bog), occupying approximately 3,000 ha, is located within the Lower Mainland of British Columbia on the Fraser River delta between the south arm of the Fraser River and Boundary Bay (Figure 1.1). During the past century, human activities have substantially altered the Bog (Hebda and Biggs 1981; Burns 1997). Members of the public and non-government organizations have expressed a strong interest in the existing and future uses. Further commercial development or industrial uses of the land may be expected, considering the existing ownership and zoning. Current zoning allows the owners of a large part of the Bog to carry out agricultural activities – including cranberry farming – as well as sand, gravel and peat extraction and other limited industrial uses (Corporation of Delta Zoning Bylaw No. 2750, 1977 as amended). Members of the public and non-government organizations have expressed concerns that future development or land uses will profoundly threaten the Burns Bog ecosystem. On June 1 1999, Delta Fraser Properties Partnership, the owners of 2,200 ha of land zoned for industrial and agricultural purposes in Burns Bog, and the Government of British Columbia agreed to conduct an ecosystem review of the Bog to gain a full understanding of what is needed
to preserve its ecological integrity1. As agreed to by the Province of British Columbia and Delta
Fraser Properties Partnership, the review was to determine the factors crucial to preserving
Burns Bog as a viable ecosystem, such as the hydrology, geology, flora and fauna of the Bog. The British Columbia Environmental Assessment Office (EAO) was charged with managing the Burns Bog Ecosystem Review (the Review). In addition, the Minister of Environment, Lands and Parks appointed a special advisor (the Advisor) to give the Minster direction on the Review and to ensure that the views of non-governmental organizations are integrated into the Review. The roles of the parties involved and the process of the Burns Bog Ecosystem Review are described in Appendix A. This document serves as the Final Report of the Burns Bog Ecosystem Review, submitted by the EAO in response to the request of the Minister of Environment, Lands and Parks of the Province of British Columbia.
1.2 Review Approach
Early in the Review, it became clear that there was a lack of understanding and absence of information about the current ecological state and functioning of the Bog. Some information exists, yet it is mostly of a general nature or widely scattered in the literature and among various government agencies, non-government organizations, academic institutions, members of the public, and First Nations. Consequently, there was an obvious need to collect and compile existing information, as well as to undertake scientific studies that address critical topics. The
1 Burns Bog Ecosystem Review documents and information is available online at http://www.eao.gov.bc.ca/special/burnsbog.htm.

2
information could then be integrated and evaluated to provide the necessary knowledge for a clearer understanding of the Bog. The adopted objective of the Burns Bog Ecosystem Review was to determine the elements and
processes essential to maintain the ecological integrity of the Bog and preserve it as a viable
ecosystem complex. Land-use decisions must be guided by knowledge of the structure and function of Burns Bog ecosystems and adjacent ecosystems. The Review’s task was to explore and explain the biological and physical components of the Bog, the functioning of the Bog and related ecosystems, the key factors shaping ecosystem structure and function, and the requirements for viability. In this report, Burns Bog is considered to be a complex of distinct, but related ecosystems. The term “ecosystem” is reserved for the constituent ecosystems as generally applied by Terrestrial Ecosystem Mapping (Resources Inventory Committee 1998a). When referring to the broad area of investigated by the Review, this report uses the terms “study area”, “ecosystem complex” or “the Bog”. The concept of viability in this report is interpreted on a time scale spanning several centuries. The peat-forming associations, internal structure and hydrology of raised bogs require centuries, even millennia, to develop (Moore and Bellamy 1974; Hebda 1977). To help identify the essential elements and processes, the Review undertook a consultation process to receive suggestions regarding the technical studies required and the terms of reference for those studies. A wide range of issues and potential topics were developed from public working sessions and submissions (EAO 1999). In keeping with the desire to obtain the required information in a timely manner, it was not practical or necessary for the Burns Bog Ecosystem Review to undertake all of the suggested studies. A focused research strategy was adopted to provide the necessary information to support future decisions regarding the management of Burns Bog. The adopted strategy was to:
1. Provide a characterization of the Bog and bog-related communities and habitats through baseline mapping and technical studies. Geology, native soils, contamination of soils and water, hydrology, water chemistry, plants and plant communities, wildlife and fisheries were selected as topics.
2. Integrate the results of the separate technical studies through the use of a Geographic
Information System (GIS) and focus on the needs of unique and key species and critical processes associated with the bog ecosystem complex. By focusing on these species and processes, an effective means of understanding the factors necessary for maintaining the integrity of the Bog would be provided. The analysis aimed to identify the locations and extent of areas required to sustain the Bog. Drawing from the technical studies, the overall global and regional context of the bog ecosystem complex, and the history of the Bog and patterns of change, also became evident topics for study.

3
Figure 1.1 Western portion of the Lower Mainland of British Columbia, showing the location of Burns Bog.

4
4
In choosing the specific technical studies to be undertaken, it was desirable to select those most practical and meaningful. The following selection criteria were applied to the broad list of issues and potential study topics identified through the public working sessions (Appendix B) and submissions to the EAO. It was determined that each selected study should:
x Provide information necessary for developing a characterization of the Bog (relates to understanding the structure and key components of the ecosystem complex, the ecosystem processes, and the ecological connections);
x Contribute to providing insight into historic changes in ecosystem structure and function over time;
x Integrate readily with the results of other studies to provide insight into the biological and physical components that are required to maintain the viability of the Bog (as indicated through the requirements of unique and key species and processes);
x Be capable of being completed within the Review’s schedule; x Be cost-effective (i.e., providing a substantial amount of information to the Review
relative to the cost of the study); x Have access to expert consulting scientists; and x Have broad support as determined through public working sessions and comments
received during the development of the framework for the Review. The information provided by the Review will inform future decisions on land uses. It is not within the scope of the Review to consider development proposals. The Review will not offer recommendations regarding the degree to which any remaining natural resource capacity can be exploited. In short, the results of the Burns Bog Ecosystem Review, as reported here, are intended to facilitate subsequent discussions of land-use scenarios and management options, and allow for decisions to be made based on the best available ecological information.
1.3 Ecosystem Sustainability
As mentioned previously, the objective of the Burns Bog Ecosystem Review is to determine the elements and processes essential to maintain the ecological integrity of the Bog and preserve it as a viable ecosystem complex. Thus, of direct concern to the Review is the question of ecological sustainability. The Review is confronted with exploring and explaining the biological and physical components of the Bog, the functioning of the Bog and related ecosystems, and the factors shaping ecosystem structure and function as they relate to a sustainable existence. Before defining an approach to ecosystem sustainability specifically as it applies to the Burns Bog Ecosystem Review, it is useful to review the concept of sustainability. General management and policy direction is provided by previous British Columbia government initiatives and approaches developed in the scientific literature.

5
1.3.1 Concepts of Ecosystem Sustainability
Ecosystem sustainability is linked to sustainable development. Sustainable development is defined in reference to particular environmental, economic and social characteristics or functions (in practice, usually defined as a set representing a combination of these) in the context of desired characteristics and roles of the institutional regimes that determine policy and governance. Practical considerations have included the specification of goals, objectives, and strategic policy directions, as well as the development of indicators to measure progress towards sustainability (e.g., British Columbia Round Table on the Environment and the Economy 1992; CORE 1994a, 1994b, 1994c; Hodge and Prescott-Allen 1997; Gustavson et al. 1999). The Burns Bog Ecosystem Review does not consider the broader issue of sustainable development. It is directly concerned only with ecosystem sustainability, not the related social, economic and institutional components. Ecosystem sustainability is equated with ecological viability in the long term. It depends on the maintenance of ecological integrity. In British Columbia, CORE (1994c) identified the need to preserve and enhance critical ecosystems and biodiversity, to restore damaged and depleted resources, and to fully account for the social and environmental costs of maintaining the integrity of the natural environment (including biological diversity; quality of soil, water and air; and special natural features). More specifically, the Provincial Land Use Charter (CORE 1994c) provides the following direction for achieving a sustainable environment:
x Maintain and enhance the life-supporting capacity of air, water, land and ecosystems (including a respect for the integrity of natural systems and the restoration of previously degraded environments);
x Conserve biological diversity; x Anticipate and prevent adverse environmental impacts; x Ensure that environmental and social costs are taken into account in land and resource
use decisions; x Recognize global responsibilities, including environmental protection; and x Protect the environment for human use and enjoyment, while respecting the intrinsic
value of nature. In developing a vision for sustainable forest practices, the Scientific Panel for Sustainable Forest Practices in Clayoquot Sound (1995: vii and 27) noted that the key to sustainability “…lies in maintaining functioning ecosystems” with the adoption of management standards that are “…based on the capabilities, limitations, and sensitivities of ecosystems”, that “recognize cumulative effects and response thresholds within ecosystems”, and that “…sustain well-distributed populations of native species.” The Panel further noted that “planning must focus on those ecosystem elements and processes to be retained…” Such planning is to include the restoration of landscapes and habitats degraded by human activities and the prevention of future degradation.

6
Conservation biology concerns itself with the persistence of populations for the maintenance of species (e.g., Lande 1988; Pimm and Gilpin 1989; Hanski and Gilpin 1991; Caughley 1994; Doak and Mills 1994; Harrison 1994; Meffe and Carroll 1997). It uses models, for the most part, that focus on single species and on select factors that are believed to determine persistence of the population in question (e.g., genetic variation; demographic stochasticity; environmental stochasticity; the “Allee effect”; the “edge effect”). Many models are available to assist in targeted conservation efforts, but the detailed species-specific and study-site specific data and assumptions required to construct conservation biology models tend to limit their application. Moreover, as the research focus is largely on populations of single species, it is difficult to apply the theoretical lessons to whole ecosystems. Hence, the extent to which any specific conservation biology model can be successfully applied to the case of Burns Bog is limited. Collectively, though, the conservation biology approach offers theory that applies to the Burns Bog Ecosystem Review. For example, the destruction and fragmentation of habitats may compromise the persistence of species through habitat reduction and isolation (e.g., Meffe and Carroll 1997). In essence, a population must maintain sufficient numbers or densities to ensure long-term viability. Migrations and interactions with other populations may be important for the survival of certain species (as part of a “metapopulation”). Island biogeography theory describes the decline in the number of species with a corresponding reduction in the available habitat area (see Rosenzweig 1995). The general models are, however, unable to predict which species are most likely to become locally extinct. The specific nature of the relationship between habitats and the species they support varies in a manner which theory can not explain systematically. There is danger in focusing exclusively on the preservation of particular species or on a particular community composition because there is no guarantee that the persistence of these elements will ensure that the ecosystem itself will persist. Alternatively, one could identify general attributes that characterize the functioning of ecosystems. Ecosystem function addresses the relationships between living entities and ecological processes involving materials, energy and information exchange (gene flows and communication) (e.g., Noss 1990; Lawton and Brown 1993; Martinez 1996). Holling et al. (1995) notes that “...syntheses have become possible that suggest that the diversity and complexity of ecological systems can be traced to a small set of biotic and abiotic, or physical processes, each operating over different [space and time] scale ranges.” The resilience2 of an ecosystem, a property important for maintaining the ecosystem elements, may be traceable to this critical set of processes. The challenge, then, is to identify this set of biotic and abiotic processes for the ecosystem in question. Indeed, it may be argued that it is the ability of the ecosystem to maintain the key processes themselves which is important, the particular species involved being of less consequence (Holling 1992). From this perspective, biogeochemical cycling and trophic interactions within the food web are more important than maintaining a selected species. The ecosystem function approach has led to efforts to define and measure resilience in ecosystems and its relationship to disturbance (e.g., DeAngelis 1980; Ives 1995; Ludwig et al. 2 Holling (1973) defined resilience as a system property that allows for an ecosystem to maintain elements as an identifiable entity or suite of relationships in the face of disturbance. There are various meanings and definitions of resilience employed throughout the ecological literature. Grimm and Wissel (1997) provide a useful review the various uses of ecological stability concepts.

7
1997; Neubert and Caswell 1997). Disturbance can be seen as a natural process that is inherently part of viability, as in the example of fire in forested ecosystems (Parminter 1998). But disturbance can work against conservation efforts. The effects of disturbance depend on the scale of the disturbance in relation to the scales of ecosystem or landscape processes and whether the disturbance is a typical attribute. Appropriate disturbance can serve to promote the building of resilience in a system. Healthy “creative destruction” may be key to the integrity of the system in question (Holling et al. 1995). The question of the sustainability of Burns Bog requires facing the difficulties of trying to manage a highly complex ecological system. Systems theory provides some guidance through what is known as an ecosystem approach to environmental management (e.g., Kay and Schneider 1994; Kay et al. 1999). An ecosystem approach embraces the notion of complexity by recognizing that ecological systems are self-organizing and hierarchical, involve numerous interactions or connections between components, are inherently unpredictable and may behave in a discontinuous and non-deterministic manner (Kay and Schneider 1994; Kay et al. 1999). There is always an element of uncertainty about the behaviour of ecological systems (Kay et al. 1999). It is not always possible to predict with a high degree of certainty how ecosystems will change, no matter how complete the scientific information. Despite this property of unpredictability, there are some strategies that can be employed. According to systems theory, the maintenance of biodiversity preserves the biological information necessary for ecological organization within an uncertain environment and, usually, determines which development pathway an ecosystem follows (Kay and Schneider 1994; Kay et
al. 1999). Efforts to maintain ecosystem integrity, then, should include strategies to maintain biodiversity and, in particular, maintain species key to the development of the desired ecosystem. Systems theory also highlights that ecosystem management cannot be approached with the goal of maintaining a particular ecological end state because ecosystems themselves are dynamic (Kay and Schneider 1994; Hebda and Whitlock 1997). The organization of an ecosystem is best viewed as one of being attracted to a particular “domain of state space”, and may involve relatively sudden reconfigurations from one “state space” to another (i.e., shifting to another “attractor”) (Kay et al. 1999). In other words, one can expect an ecosystem to exhibit a range of different conditions. Changes in the ecosystem elements and processes beyond specific limits would mark its reconfiguration into a different type of ecosystem. Change is inherently a part of ecosystem organization and re-organization (e.g., Hebda and Whitlock 1997; Hebda 1999); thus, any definition of long-term viability must consider change. This is particularly important to the Burns Bog Ecosystem Review because raised bogs, such as Burns Bog, result from long-term biophysical processes. Accepting change as part of the concept of ecosystem sustainability means that a static sustainable condition cannot be defined. Thus, a sustainable ecosystem does not consist of a fixed set of species and distribution of habitats. Rather, a more useful approach is one of ensuring circumstances that allow the elements and processes of an ecosystem complex to persist or change, as may be their tendency, without exposing the ecosystem to factors that would result in its reorganization. This approach results in ecological conditions that maintain critical ecosystem functions and constituents, and these perpetuate themselves over the long term. Fundamentally, the “sustainable or viable

8
condition” is a dynamic one. The changes, however, do not lead to irreversible degradation or conversion of the ecosystem to a very different state. The potential for restoration is recognized as a third important element of sustainability (CORE 1994a; Scientific Panel for Sustainable Forest Practices in Clayoquot Sound 1995), largely because most ecosystems near human settlements have been affected to some degree by human activity. In addition to establishing the elements and ecological functions required for a viable or sustainable ecosystem, it is necessary to assess their condition. If the population of a species or the operation of a process is not sufficient to meet the goal of a viable ecosystem, the degree to which the population or ecological function can be restored, so that the needs of the ecosystem are met, must be assessed. Explicit in restoration, and implicit in achieving long-term viability, is the need to monitor the condition of the ecosystem. Monitoring must be carried out in any case to ensure that the ecosystem continues to maintain the identified critical attributes. Changes in a direction inconsistent with viability can then be remedied by changes in management strategies.
1.3.2 Ecosystem Sustainability and the Burns Bog Ecosystem Review
The approach to ecosystem sustainability adopted for the Burns Bog Ecosystem Review consists of identifying what is required to maintain important elements (i.e., populations of key or unique species, suites of species or communities) and maintain critical processes (i.e., hydrology, peat accumulation, trophic interactions) while accommodating change (i.e., promote system resilience, allow for succession). In order to specifically identify and describe the requirements for sustainability, four strategies were utilized by the Review (see Appendix A):
1. Public consultation to define the terms of reference for the required technical studies (Appendix B);
2. Identification and description of the biophysical attributes and their relationships by
undertaking technical studies and through consideration of the information brought forward during the working sessions and in written submissions.
3. Technical Review Meetings to receive further expert advice and comment regarding
essential ecosystem attributes (i.e., elements and processes) and to define their current and desired condition (Appendix C); and
4. Further evaluation of the information and review of the scientific literature by the EAO
and the development and testing of models applied specifically to the Bog to further define what is required to ensure its long-term viability.

9
Providing a characterization of the Burns Bog ecosystem complex was an essential initial step before modelling could be applied to further define the requirements for viability. Public working sessions and consultation with experts assisted the EAO in defining the terms of reference and provided the focal point for the preparation of the technical documents. The ecosystem attributes chosen for study were similar to those typically adopted for ecosystem risk assessment and management. For example, Harwell et al. (1999) identifies a generic set of “essential ecosystem characteristics” that can be applied to any ecological system (Table 1.1).
Table 1.1 Essential ecosystem characteristics (Harwell et al. 1999).
ecosystem characteristic description
Habitat Quality x landscape and community diversity; connectivity and fragmentation; habitat structural diversity
Integrity of the Biotic Community x biodiversity; trophic structures; key or critical species
Ecological Processes x production and decomposition; biogeochemical cycling; succession; dispersal and migration
Water Quality x biological, chemical and physical characteristics
Hydrological System x water flows, storage and supply; structural characteristics
Disturbance Regime x fires; floods; storms; drought; disease or pest outbreaks; anthropogenic influences
Sediment/Soil Quality x biological, chemical and physical characteristics; erosion and accumulation
10
The identification of essential ecosystem characteristics allows one to “…capture relevant scientific information into a limited number of discrete, but not necessarily independent, characteristics that describe the major ecological features in any type of ecosystem” (Harwell et
al. 1999). From the identified essential ecosystem characteristics, Harwell et al. (1999) recommend the selection of a set of “ecosystem endpoints” and corresponding measures. Ecosystem endpoints are specific ecological attributes deemed of particular importance for maintaining ecosystem integrity, and the selected measures are the practical means to characterize the state of those endpoints. The ecosystem studies and tasks chosen for the Burns Bog Ecosystem Review reflect a list of essential ecosystem characteristics as identified at the onset of the Review (see Appendix B):
x Geology. The geological framework establishes the template for peat formation and strongly influences hydrology and plant communities. It may be particularly important in understanding water balance. Mapping the extent of geological features that contribute to bog hydrology helps define the extent of the area that contributes to sustaining the Bog.
x Soils. Soils are critical to the distribution of plant communities and to hydrology. Peat formation affects the hydrological regime and the distribution and character of plant communities. Information concerning soil chemistry may help define the extent of the bog ecosystem complex.
x Contamination of soils and water. The presence of contaminants in the soils and waters of the Bog may threaten the health of certain biota and alter important ecosystem processes. Information concerning the location of contaminated sites and the nature of the existing contaminants may prove important to considering the future viability of the Bog.
x Hydrology. The hydrological regime is the primary factor controlling bog development and sustaining raised bog ecosystems (Section 2.0). Altering the hydrological regime will profoundly influence bog communities. The long-term survival of the Bog depends on understanding and maintaining an appropriate hydrological regime.
x Water chemistry. The character of bog communities depends strongly on water chemistry. Properties of the water, in turn, reflect the source and movement of the water and the biological processes that influence it.
x Plants and plant communities. Plant communities are the living framework of the Bog and provide important ecological functions. Specific plant species not only constitute a major part of the Bog’s biological diversity, but also drive major bog processes such as peat formation. Sphagnum mosses are particularly important in the regulation of bog hydrology and the accumulation of peat. The Bog may contain several key plant species at the geographic limits of their range and, thus, may be of particular conservation concern. Also, the abundance of exotic species is increasing in the Bog and may alter bog communities.

11
x Wildlife. It is important to consider the role of wildlife as an element of the bog ecosystem complex. Through its movements, dispersal and migrations, wildlife provides direct connections to adjacent ecosystems. The Bog may sustain rare and endangered species and may be important both regionally and globally in terms of the habitat it provides. Because of the unique environment, the Bog provides and the special adaptations that may be required for the species that live there, certain bog wildlife species may be of particular concern.
x Fisheries. As part of the Fraser River delta complex, Burns Bog aquatic ecosystems may play an important role in fish production. There are questions about water quality in the Bog and the potential to support fish, the availability of fish habitat, fish occurrence, and connections to fish-bearing waters.
x Ecological processes and dynamics. Long-term sustainability of bog ecosystems depends on the persistence of critical ecological processes. These processes maintain conditions for typical bog species. Ecological processes also connect the Bog to adjacent ecosystems and landscapes. Questions concerning ecosystem dynamics become important in ascertaining directions of change in the Bog and the factors that determine that change. Understanding the nature of bog-related ecosystem processes, and where they operate, helps to contribute to informed decisions about the locations and extent of areas required to sustain the Bog.
x Disturbance, regeneration and restoration. It is important to understand the patterns and role of disturbance in Burns Bog and their relationships to ecosystem processes and dynamics in order to help determine what is required to sustain the Bog. It is similarly important to understand the processes of regeneration. In certain sites, ecosystem processes may need to be restored for the Bog to survive.
The study of geology, soils, contamination of soils and water, hydrology, water chemistry, plants and plant communities, wildlife and fisheries provides a characterization of the essential elements of Burns Bog. The integration of the information leads to the development of an understanding of ecosystem processes and dynamics, and the patterns and role of disturbance. The question of viability is ultimately addressed through the identification of what is required to maintain essential elements and processes of the bog ecosystem. Having identified the essential elements and processes, it was necessary for the Burns Bog Ecosystem Review to explicitly consider uncertainty and extreme events in defining what is required to maintain a sustainable condition. For the Bog to be viable in the long term, the size and future management of the ecologically sustainable area must allow for unforeseen disturbances or variations in the biophysical conditions. Bogs are particularly sensitive to changes in essential ecosystem characteristics, such as the hydrology, which can lead to the irreversible degradation or undesirable alteration of the ecosystem (e.g., Ratcliff 1977; Ingram 1992). In the context of deficiencies in the knowledge base, the Review assumes that perturbations to the ecosystem are likely to occur. Thus, the definition of the sustainable condition must accommodate such perturbations to ensure a relatively low risk of collapse. This assumption is explicit in the approach to addressing the long-term viability of Burns Bog. It also has ramifications for the required restoration of degraded ecosystems.

12
In addition to developing an understanding of the essential elements and processes, the framework for the Review (EAO 1999) emphasized the importance of understanding the regional and global significance of Burns Bog. Burns Bog plays a regional ecological role and contributes to provincial, national and global biological diversity. Existing biological diversity legislation, policies and agreements influence the management of rare and endangered species. The Bog is also subject to regional biological and physical processes, such as those in the atmosphere. The broader context provided by the study of these topics assisted in developing a clearer understanding of the future of Burns Bog as a sustained ecosystem complex.
1.4 Report Organization
Section 2.0 of the report provides an overview of the hydrology typical of raised bog systems such as Burns Bog. Much of the description and analysis that follows requires an understanding of hydrology. Section 3.0 establishes a regional context for the study area – regional physiography and geology, climate, vegetation, and wildlife are briefly reviewed. The origin and development of Burns Bog, and land use, are also outlined. The Bog’s biophysical characteristics are described in Section 4.0. These descriptions are derived from field studies (Appendix D), reviews of scientific literature and historical information. Further information was obtained at the Technical Review Meetings (Appendix C), from comments received on the technical reports, public submissions to the EAO, and analyses carried out by the EAO. Section 5.0 reports the results of integrative studies that relate the physical and biological elements of Burns Bog to understand ecosystem processes and dynamics (Appendix D). These studies include identification and mapping of selected indicator plant and animal species, tree-ring analysis, the documentation of disturbance patterns, Sphagnum regeneration, a review of peatland restoration techniques, and an evaluation of the regional and global significance of the Bog. Ecosystem integrity and ecosystem dynamics are discussed as they apply to the question of viability. The requirements for the long-term viability of Burns Bog are analyzed and presented in Section 6.0. Section 7.0 summarises the key findings and reports the conclusions of the Burns Bog Ecosystem Review.

13
2.0 Raised Bog Development and Hydrology
Burns Bog is a raised bog that is located near the southern limit of bog development on the west coast of North America (Vitt et al. 1999). Raised bogs are restricted to humid, temperate climates where annual precipitation exceeds water losses to surface evaporation and plant transpiration (together termed evapotranspiration) by approximately 100-150 mm (Damman 1977; Proctor 1995). Farther south, raised bogs cannot form because the dry season moisture deficit is too great, even though annual moisture surplus may exceed 500 mm (Damman 1979a). A general overview of the factors that influence the development of Canadian peatlands is given in Vitt (1994). Raised bogs are characterized by Sphagnum species (peat mosses) and other plants adapted to continuously wet, nutrient-poor and acidic substrates (Moore and Bellamy 1974). The water table in undisturbed bogs remains at or near the surface throughout the year. Even in summer, the water table seldom drops more than 30-40 cm below the bog surface (Romanov 1968; Ivanov 1981; Ingram 1982; Schouwenaars and Vink 1992). Sphagnum is not simply adapted to wet, nutrient-poor and acidic conditions, but rather is an “ecosystem engineer” that generates conditions unfavourable for other plants to gain a competitive advantage (van Breeman 1995).
2.1 Peat Accumulation and Raised Bog Formation
Peat commonly consists of partly decomposed Sphagnum or sedge remains, and may include dead leaves, twigs, roots and other plant debris. Peat accumulates when plants produce more biomass than can be decomposed under continuously wet, anoxic conditions (Clymo 1992). Standing water, at or near the ground surface throughout the year, is a prerequisite for peat accumulation and raised bog development (Clymo 1992). Cajander (1913) recognized three pathways of peat formation:
1. “Terrestrialization” or the in-filling of shallow lakes; 2. “Paludification” or the swamping of poorly drained forest soils that occurs when “hard
pan” layers develop; and 3. The swamping of floodplains of rivers when water is “ponded-back” due to high river
water levels (Giller and Wheeler 1986). Bog development in each of these situations proceeds along different pathways, but the results are similar.
Terrestrialization occurs when plants at the margins of small lakes grow or fall into the lake and form a mat upon which other vegetation can become established. Consistently moist conditions are maintained as the mat rises and falls in response to changes in the lake level (Green and Pearson 1968). As peat accumulates, the surface of the mat grows upward and the supply of mineral-rich lake water decreases relative to the amount of water supplied by precipitation. Because the concentration of inorganic minerals and nutrients in precipitation is low, few plant species can thrive. Sphagnum, however, has special adaptations to low concentrations of mineral nutrients (Clymo 1992; van Breeman 1995). Pioneer species of Sphagnum invade and acidify the surrounding environment through cation exchange (Clymo 1963, 1984; Gorham et al. 1987).
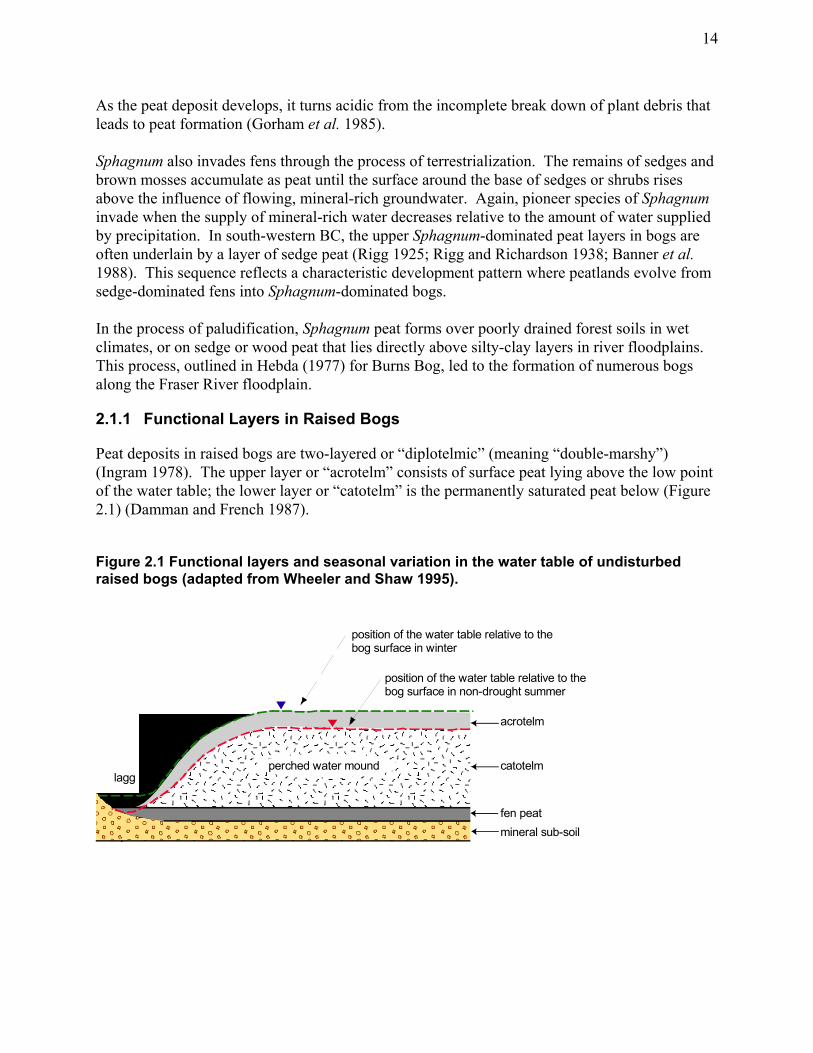
14
As the peat deposit develops, it turns acidic from the incomplete break down of plant debris that leads to peat formation (Gorham et al. 1985). Sphagnum also invades fens through the process of terrestrialization. The remains of sedges and brown mosses accumulate as peat until the surface around the base of sedges or shrubs rises above the influence of flowing, mineral-rich groundwater. Again, pioneer species of Sphagnum invade when the supply of mineral-rich water decreases relative to the amount of water supplied by precipitation. In south-western BC, the upper Sphagnum-dominated peat layers in bogs are often underlain by a layer of sedge peat (Rigg 1925; Rigg and Richardson 1938; Banner et al.
1988). This sequence reflects a characteristic development pattern where peatlands evolve from sedge-dominated fens into Sphagnum-dominated bogs. In the process of paludification, Sphagnum peat forms over poorly drained forest soils in wet climates, or on sedge or wood peat that lies directly above silty-clay layers in river floodplains. This process, outlined in Hebda (1977) for Burns Bog, led to the formation of numerous bogs along the Fraser River floodplain.
2.1.1 Functional Layers in Raised Bogs
Peat deposits in raised bogs are two-layered or “diplotelmic” (meaning “double-marshy”) (Ingram 1978). The upper layer or “acrotelm” consists of surface peat lying above the low point of the water table; the lower layer or “catotelm” is the permanently saturated peat below (Figure 2.1) (Damman and French 1987).
Figure 2.1 Functional layers and seasonal variation in the water table of undisturbed raised bogs (adapted from Wheeler and Shaw 1995).
lagg
acrotelm
catotelm
fen peatmineral sub-soil
position of the water table relative to the bog surface in winter
position of the water table relative to the bog surface in non-drought summer
perched water mound
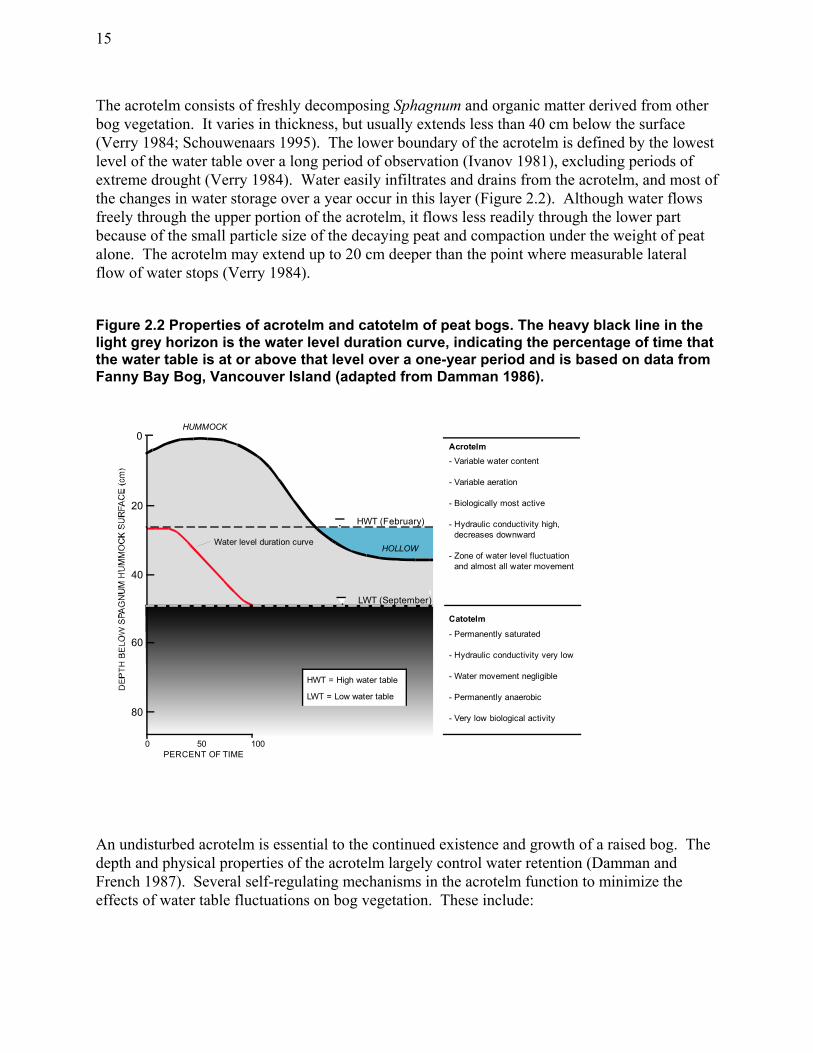
15
The acrotelm consists of freshly decomposing Sphagnum and organic matter derived from other bog vegetation. It varies in thickness, but usually extends less than 40 cm below the surface (Verry 1984; Schouwenaars 1995). The lower boundary of the acrotelm is defined by the lowest level of the water table over a long period of observation (Ivanov 1981), excluding periods of extreme drought (Verry 1984). Water easily infiltrates and drains from the acrotelm, and most of the changes in water storage over a year occur in this layer (Figure 2.2). Although water flows freely through the upper portion of the acrotelm, it flows less readily through the lower part because of the small particle size of the decaying peat and compaction under the weight of peat alone. The acrotelm may extend up to 20 cm deeper than the point where measurable lateral flow of water stops (Verry 1984).
Figure 2.2 Properties of acrotelm and catotelm of peat bogs. The heavy black line in the light grey horizon is the water level duration curve, indicating the percentage of time that the water table is at or above that level over a one-year period and is based on data from Fanny Bay Bog, Vancouver Island (adapted from Damman 1986).
0 50 100 PERCENT OF TIME
Acrotelm
- Variable water content
- Variable aeration
- Biologically most active
- Hydraulic conductivity high, decreases downward
- Zone of water level fluctuation and almost all water movement
Catotelm
- Permanently saturated
- Hydraulic conductivity very low - Water movement negligible
- Permanently anaerobic
- Very low biological activity
HOLLOW
HUMMOCK 0
20
40
60
80
HWT (February)
LWT (September)
Water level duration curve
HWT = High water table
LWT = Low water table
An undisturbed acrotelm is essential to the continued existence and growth of a raised bog. The depth and physical properties of the acrotelm largely control water retention (Damman and French 1987). Several self-regulating mechanisms in the acrotelm function to minimize the effects of water table fluctuations on bog vegetation. These include:

16
x Expansion and contraction of the peat in response to changes in water storage caused by varying inputs from precipitation (mooratmung –“mire breathing” in German);
x Reduced losses to evapotranspiration as water contained within the small spaces between overlapping branch leaves in Sphagnum mosses is lost in response to falling water tables; and
x “Bleaching” of Sphagnum under severe drought conditions (causing increased light reflection, decreased photosynthesis and respiration).
Disturbance of the acrotelm disrupts these mechanisms and leads to a lower water table and, therefore, a loss of stored water. As a result, bog plant community composition changes in response to the new hydrological equilibrium and the process of peat formation ceases. Peat-forming aerobic bacteria and other micro-organisms occupy the acrotelm. As plant material decomposes at the base of the acrotelm, it is gradually incorporated into the top of the catotelm. When this happens, the average level of the water table rises and the bog grows upwards (Wheeler and Shaw 1995). The catotelm forms the thickest layer of peat in raised bogs, and it is devoid of peat-forming aerobic bacteria (Verry 1984). Biological decomposition by anaerobic microbes continues in the catotelm, but at a slow pace. Water moves through it slowly because the pore spaces between the well-decomposed particles of peat are very small and the peat is highly compacted (Clymo 1992). In undisturbed bogs, the catotelm remains permanently saturated (Clymo 1992), except during extreme drought (Verry 1984).
2.1.2 Bog Shape
Undisturbed, well-developed raised bogs are typically domed or plateau shaped in cross-sectional profile (Moore and Bellamy 1974). The bog surface, especially in the raised centre, remains wet throughout the year, despite being higher in elevation than the adjacent land. The sloping marginal parts of the bog are better drained. Unlike other terrestrial ecosystems, the elevated zone is wetter than the lower areas. Water accumulates in low-lying areas between the bog margin and adjacent uplands in a zone known as the “lagg”. The lagg normally supports fen and swamp vegetation such as sedges and shrubs. It contributes to the hydrologic isolation of a bog by intercepting and collecting mineral-rich runoff from adjacent areas. The lagg may be relatively narrow and deep water in winter, or it may be wide and shallow, depending on whether the adjacent non-bog surface is flat or sloping. Water accumulates and flows in the lagg during winter, but during summer, the water table falls when there is little rain. The lagg may become stagnant and dry out during this time.
2.2 The Water Balance
The water balance or water budget is an equation that describes the balance between water gains (inputs) and losses (outputs), and the resulting changes in the volume of water stored in a bog (Figure 2.3). The greatest water input to a raised bog is precipitation. Water is lost primarily through evapotranspiration, a process strongly influenced by the type of vegetation cover (Ingram 1983; Verry 1997). Most of the water remaining, after losses to evapotranspiration,

17
drains away by lateral seepage through the upper peat layers. Vertical water losses (drainage) through the almost impermeable lower peat layers are low (Schouten et al. 1992). Water flows in open channels on the surface only during heavy rains (Verry and Boelter 1978), and sheet flow rarely occurs in undisturbed bogs (for further details see Ingram 1983). The water not discharged or lost from a bog is accounted for in the water balance by a change in overall water storage.
Figure 2.3 Raised bog in cross-section (a) and plan view (b) showing water inputs and outputs as labelled arrows (adapted from Ingram 1992).
evapotranspiration
precipitation
leakage through the base of the bogsurface flow in the lagg
runoff from surroundinguplands
(a)
(b) runoff from surroundinguplands
bog expanse
bog margin/ lagg
surface flow in the lagg
outlet stream
The water balance for disturbed bogs, especially those damaged by peat harvesting and drainage, must account for increased losses of water through the base of the peat deposit. This occurs when the remnant basal peat layers are reduced to the extent that they cannot restrict water flowing up from, or out to the mineral soils below. Drainage ditches usually carry water away from a bog and directly increase water losses to runoff (see Section 2.5). These losses are in excess of normal discharge through lateral flow.

18
2.3 Models of Raised Bog Hydrology
Raised bogs remain saturated up to several metres above the surrounding land. A number of explanations for this condition have been proposed, including the “capillary model” (Moore and Bellamy 1974), the “groundwater mound model” (Ingram 1982), the “methane bubble hypothesis” (Brown et al. 1989; Brown and Overend 1993; Brown 1998) and the “groundwater flow reversal” hypothesis (Glaser et al. 1997). Each model is briefly described in the following sections.
2.3.1 Capillary Model
The capillary model is based on the high water-holding capacity of Sphagnum, in which water is stored within “hyaline” cells3 and between tightly overlapping branch leaves (Clymo and Hayward 1982). Sphagnum can hold up to 20 times its dry weight of water (Moore 1997). Elaborating on earlier ideas, Moore and Bellamy (1974) suggested that high water tables in raised bogs result from the “wicking” properties of capillary forces. According to this hypothesis, Sphagnum acts like a sponge, drawing the water table up to the bog surface. Criticized as a “notional model” that failed to account for high water tables in physical terms, it was challenged by Ingram (1982, 1983) on two key points:
1. It misinterprets the nature of saturation in peat deposits; and 2. It fails to suggest a mechanism that accounts for the typical topographic profile of raised
bogs. Furthermore, saturation maintained by capillarity cannot draw the water table more than 30-50 cm above base level (Granlund 1932; Romanov 1968). Also, the capillary model of soil structure suggests the need for a mean pore size of approximately 30 Pm for the process to work. For it to work in a bog exceeding 5 m in height, the pore size would have to be much less than 30 Pm. For this to be the case, peat would have to be well-decayed right up to the bog surface, which it is not. The living and decomposing Sphagnum in the upper peat layers (acrotelm) have large pore spaces (Ingram 1982).
2.3.2 Groundwater Mound Model
The groundwater mound model proposed by Ingram (1982) builds on the earlier work of Ivanov (1981) and others. According to this model, the shape and size of a raised bog is controlled by soil physics and hydrology. Climate ultimately determines its maximum height (Ingram 1982). The hypothesis is based on the concept of the two-layered structure in peat deposits. Although the water table lowers quickly through the acrotelm following a rain event, because hydrological conductivity is high, it declines much more slowly in the catotelm because of low hydraulic conductivity.
3 Hyaline cells consist of a large volume of space surrounded by cell walls, and opening through a pore.

19
Ingram (1982) demonstrated both theoretically and experimentally that the shape and size of raised bogs is controlled by the water balance and, in particular, the driest period through which a bog normally survives. Until the climatically-determined maximum height of a bog is reached, the bog will continue to grow upward as decaying plant material at the base of the acrotelm is incorporated into the catotelm.
2.3.3 Methane Bubble Hypothesis
More recently, Brown et al. (1989) proposed that the raised water table in bogs occurs because a layer of gaseous methane bubbles blocks the pore spaces in the peat of the upper catotelm. With the pore spaces blocked by bubbles, water from above cannot infiltrate. It was demonstrated under laboratory conditions that water flow through columns filled with microbially active peat was significantly slower than water flow through a column containing sterilized peat (and therefore no methane-producing bacteria). Brown et al. (1989) further suggested that disturbance (e.g., peat mining) causes entrapped methane to be released into the atmosphere, leading to lower water tables and a substantial change in bog ecology (Brown and Overend 1993). Brown (1998) suggests that even if bogs are re-wetted through flooding, the layer of methane gas bubbles will not re-form and degradation of the peat deposit will be enhanced. Although this hypothesis appears to be well-founded, it has not received much attention in the literature on bog hydrology. Hopefully it will be critically examined in future scientific investigations.
2.3.4 Groundwater Flow Reversal Hypothesis
Recent evidence presented by Glaser et al. (1997) suggests that bogs in continental areas with low mean annual precipitation are sustained by groundwater recharge. Surveys of hydraulic head gradients and pore water chemistry during wet and dry years demonstrated that bogs in Minnesota, located in a zone of regional groundwater discharge, experience groundwater up-welling during dry periods. During wet periods, excess precipitation drains through the base of the peat deposit. These short-term flow reversals apparently have little influence on the composition of bog vegetation (Glaser et al. 1997). This model does not suggest that the groundwater mound or methane bubble models are invalid. Rather, it suggests that a peat mound and water mound can form as the result of water up-welling from below. The groundwater mound model has not been tested in British Columbia.
2.4 Bog Chemistry
Atmospheric precipitation (e.g., rain, snow, and fog) is the main source of water and mineral nutrients to raised bogs (Moore and Bellamy 1974). Mineral-rich water from surrounding uplands does not flow into the centre of a raised bog because the peat mass is higher in elevation than the immediately adjacent land, and because the upward and lateral flow of subsurface water is impeded by the well-decomposed and compacted peat mass.

20
During bog development, the peat mass becomes increasingly isolated from the regional groundwater table (Hebda 1977). Major changes in surface water chemistry occur, including a decline in calcium and bicarbonate ion concentrations, and a corresponding increase in hydrogen ions (Gorham et al. 1985). With time, the proportion of the total water supply influenced by substrates declines. Sphagnum acidifies a site both by cation exchange and because it yields highly acidic substances as it decomposes (Gorham et al. 1985; van Breeman 1995). Acidification occurs rapidly once calcium and bicarbonate ion concentrations are lowered below a threshold level (Gorham et al. 1985; Gorham and Janssens 1992).
2.5 Effects of Drainage
Ditches are used to lower the water table in bogs and create the drier conditions required for peat harvesting, forestry, and agricultural or recreational use of the surrounding land. Drainage is the greatest threat to the “ecohydrology” of bogs (Egglesmann et al. 1993). Drainage lowers the water table, accelerates the rate of decomposition of the peat, and results in irreversible changes in bog hydrology, ecology, and form (Egglesmann et al. 1993). Although some authors (e.g., Boelter 1972; Bradof 1992; Prévost et al. 1997) suggest that the effects of drainage are confined to a within a few metres of either side of a ditch, their observations may apply to circumstances where a functioning acrotelm is no longer present. When a bog with a well-developed Sphagnum-dominated acrotelm is drained, the hydrological and ecological impacts are great and may extend up to 150 m beyond a newly excavated drainage ditch (Figure 2.4) (Hobbs 1986; Gedalof 1999).
Figure 2.4 Effect of drainage ditch on water-table position.
drainage ditch
depression of water table
100 m +
zone of hydrologic effect

21
More specifically, drainage affects bog hydrology in the following ways:
x Lateral drainage in the acrotelm increases as water is drawn toward ditches or peat excavations;
x The average depth of the late summer/ early fall water table decreases, causing the thickness of the acrotelm to increase;
x The upper layers of the catotelm are subject to drainage in late summer/early fall and the prolonged aeration causes aerobic decomposition;
x Decomposition increases the bulk density of the peat and the space occupied by large pores decreases (Verry and Boelter 1978) - this leads to increased losses to surface runoff and reduced storage capacity;
x As peat shrinks and cracks (Ingram 1992), the structural support of the peat mass is damaged, especially around drainage ditches and peat excavations where the hydraulic gradient is steepest (Bradof 1992); and
x Decomposition ultimately causes the peat deposit to subside, thus lowering the surface elevation of the bog relative to its surroundings.
Continued existence and growth of peat-forming bog vegetation requires large volumes of water maintained as storage. As water losses to evapotranspiration often greatly exceed inputs from precipitation during the growing season, plants must draw on water stored in the upper peat layers, resulting in a lower water table during late summer and early fall (Damman and French 1987). The primary effect of drainage is to reduce water storage capacity. Reduced storage affects both vegetation composition and structure, and it interrupts the process of peat accumulation by reducing the average summer water-table position well below the bog surface (Verry 1997). This alters the competitive balance among plant species and communities. The drier conditions cause increased growth of trees such as pine and shrubs, and lead to the loss of Sphagnum and most herbaceous plant species. As woody vegetation increases, “biological drainage” (the ability of maturing trees to keep the water table depressed during the growing season) (Heikurainen and Päivänen 1970) increases because woody plants draw water from deep beneath the surface and use it in transpiration. As tree and shrub canopies increase, Sphagnum is shaded out, and the process of peat formation and accumulation ceases.

22
3.0 Study Area and Regional Context
3.1 Physiography and Geology
Burns Bog occupies approximately 3,000 ha of the flat lowlands of the southern Fraser River delta (Figure 1.1). The delta lies within the Fraser Lowland subdivision of the Georgia Depression of the Coastal Trough Physiographic Region of British Columbia (Holland 1976). The Fraser Lowland is bounded by the Fiord Ranges (southern) of the Coast Mountains (Pacific Ranges) to the north and the Cascade Mountains to the east (Mathews 1986). The regional geology consists of uplifted mountain masses to the north and east enclosing a subsiding sedimentary basin, which originated in the Late Cretaceous Period (100-65 million years ago) (Clague et al. 1998). The Coast Mountains to the north consist largely of granitic rocks formed about 100 million years ago (Armstrong et al. 1990). The Cascade Mountains to the east of the study area consist of folded and deformed sedimentary and volcanic rocks of Paleozoic and Mesozoic age. Quaternary volcanic peaks, such as Mt. Baker, have continued to add to the mountain mass into the last 10,000 years (the Holocene Epoch) (Armstrong et al. 1990; Clague et al. 1998). Within the portion of the basin that holds the Fraser River delta, more than 4,000 m of sedimentary deposits, in some cases intruded by volcanic rocks, have accumulated since the Late Cretaceous (Clague et al. 1998). Old sedimentary rocks are deeply buried in the vicinity of Burns Bog, but younger Pleistocene and Holocene deposits are exposed nearby (Armstrong and Hicock 1980; Clague et al. 1998). Sedimentary bedrock under Burns Bog is as deep as 700-800 m, though it rises to within 300-400 m of the surface in places. The nearest outcrop is of Tertiary age and occurs 8 km to the north of the Bog along the Brunnette River and nearby in Burnaby Mountain (Armstrong and Hicock 1980). Late Quaternary deposits form uplands in the vicinity of the Bog. Notable are the Quadra Sand and Vashon Till units in the Newton (Surrey) Upland immediately east of the study site (Armstrong and Hicock 1980). On Panorama Ridge, part of the Newton Upland, the Late Quaternary surface rises relatively steeply to 85 m high and extends from the Fraser River southward to a point roughly even with the southern margin of the Bog (Figure 3.1). At this point, the Pleistocene exposure turn south-eastward. A similar but much smaller upland forms Point Roberts to the west. Fifteen thousand years ago, the Fraser Lowland was covered by up to 1,500 m of ice of the Vashon advance of the Fraser Glaciation (Mathews et al. 1970). The ice began to retreat about 13,000 years ago, though the retreat was irregular and re-advances occurred (Clague et al. 1998). After about 10,000 years ago, the Fraser River began depositing sediments in the vicinity of what is now the Bog, though the delta surface of that time was built to a lower sea level (Clague et al. 1998). As sea level rose in the early Holocene, the current delta form began to develop. Delta-top beds accumulated and peaty deposits formed (Williams and Hebda 1991; Monahan 1999). By the middle of the Holocene, the inland portion of the delta surface became relatively stable, in equilibrium with stationary sea levels (Clague et al. 1998), and the stage was set for the development of Burns Bog.

23
3.2 Climate
The regional climate is classified as a Modified Maritime type of the Csb Koeppen Mediterranean type (Hoos and Packman 1974) or near Mediterranean type (Hare and Thomas 1979). The mild winters are rainy with December typically being the month of peak precipitation (Oke and Hay 1998). Summers are usually warm and dry, with July being the driest month (Figure 3.2) (Oke and Hay 1998; Helbert and Balfour 2000). Three climate stations nearest to the Bog record an average annual precipitation of 1,110 mm (derived from Helbert and Balfour 2000), almost all of which falls as rain. The average annual temperature is 9.6ºC. The July and August mean monthly temperatures are both about 16.8ºC, whereas in January, the mean monthly temperature is only 2.5ºC. The average number of frost free days for nearby Ladner is 183 and the Surrey Newton climatic station, immediately to the east of the Bog, experiences about 3,000 degree days above 18ºC and 2,000 degree days above 5ºC (Atmospheric Environment Service 1993). Prevailing winds at Vancouver International Airport blow from the east at an average velocity of 10-13 km/hr (Oke and Hay 1998). Strong winds are not common and are usually associated with the passage of active weather disturbances that blow from the south-east or north-west. Relative humidity remains mostly above 60% throughout the year, often reaching 80-90% especially in the winter (Oke and Hay 1998). Vancouver International Airport, 15 km to the north-west, records an average of 1,900 hours of bright sun per year (Oke and Hay 1998) of which 300 hours on average occur in July (Hare and Thomas 1979). Though the winter months are very wet, the Bog experiences a six-month moisture deficit extending from the beginning of April to late September or early October (Figure 3.2). At its most intense in July, the moisture deficit is 80-90 mm - that is, the ground surface can lose 80-90 mm more water to evaporation and transpiration than reaches the ground in the same month (Oke and Hay 1998; Helbert and Balfour 2000).
Figure 3.2 Mean monthly temperatures and precipitation for the Burns Bog study area (Helbert and Balfour 2000).
0
2
4
6
8
1 0
1 2
1 4
1 6
1 8
Janu
ary
Mar
ch
May
July
Sep
tem
ber
Nov
embe
r
M o n th s
02 04 06 08 01 0 01 2 01 4 01 6 01 8 02 0 0
T e m p e ra tu re (ºC )P re c ip ita tio n (m m )

24
Figure 3.1 Burns Bog study area showing 5 m interval elevation contours.

25

25
3.3 Regional Vegetation
The southern part of the Fraser River delta, where Burns Bog is located, lies within the Coastal Douglas-fir (CDF) Biogeoclimatic zone (Nuszdorfer and Boeltger 1994). In mesic (moderately drained) upland sites, such as Panorama Ridge, Douglas-fir (Pseudotsuga menziesii)4 is the dominant tree species, whereas in moister settings, western hemlock (Tsuga heterophylla) predominates (Meidinger and Pojar 1991). Grand fir (Abies grandis) prefers moist sites too. On the wetter sites of the delta, western redcedar (Thuja plicata) and, to a lesser extent, Sitka spruce (Picea sitchensis) are favoured conifers. Other trees commonly found in the zone and present in the Burns Bog vicinity include bitter cherry (Prunus emarginata), black cottonwood (Populus
balsamifera ssp. trichocarpa), big-leaf maple (Acer macrophyllum) and vine maple (Acer
circinatum). Red alder ( Alnus rubra ) grows widely in disturbed sites, particularly in the vicinity of Burns Bog. Lodgepole pine (Pinus contorta)5 is now well established on peaty soils in this part of the CDF zone. The Fraser River delta supports many wetland plant communities associated with the varied chemistry and flooding regimes. In Boundary Bay, saltmarsh vegetation dominated by American glasswort (Salicornia virginica), sea plantain (Plantago maritima ssp. juncoides), and grasses occupies the upper part of tidal flats (Hebda 1977). Coastal meadows of grasses and representatives of the Aster Family (Asteraceae) occur at the tidal limit. Marsh vegetation, dominated by different species, occurs at the mouth of the Fraser River (Hebda 1977). Bulrush (Scirpus) communities form the first zone on the emergent delta surface, inshore of which occurs a sedge- (Carex lyngbyei) dominated marsh. A common cattail (Typha latifolia) marsh grows near the mouths of the river’s distributary channels. Freshwater marshes line the shores of river channels. These consist of emergent aquatic plants such as buckbean (Menyanthes trifoliata), skunk cabbage (Lysichiton americanus), sedges and grasses, among others. River swamps support stands of red alder, black cottonwood, Sitka spruce with a shrubby understory of willows, salmonberry (Rubus spectabilis), and red-osier dogwood (Cornus stolonifera) above a mixture of herbaceous species (Hebda 1977).
3.4 Wildlife
The relatively natural study area is set within largely agricultural and urban surroundings. Furthermore, it occurs adjacent to the major estuary of the Fraser River and the large marine embayment of Boundary Bay. As a consequence of this habitat diversity, the south-western portion of the Fraser Lowland supports a diverse fauna. Boundary Bay and the Fraser River estuary constitute a migration staging area for a million waterbirds on the Pacific Flyway (Province of British Columbia 1993). They provide important wintering areas for waterfowl, shorebirds, gulls and hawks (Butler and Campbell 1987).
4 See Appendix E for botanical names and authorities used and Appendix F for common and botanical plant and lichen names. 5 Shore pine is the common name for the coastal subspecies of Pinus contorta. The more general common name for the lodgepole pine species is used in this report for consistency with Review reports (Madrone Consultants Ltd. 1999, 2000) and previous descriptions (Hebda and Biggs 1981).
26
Twenty- two species of raptorial birds occur in the Boundary Bay area, including a large winter population of eagles. There are two important heronries nearby (Province of British Columbia 1993). Songbirds occur widely, being especially associated with saltmarsh and meadow habitats and hedgerows. Kistritz et al. (1992) reported that nearly 200 birds species may occur in North Delta. Birds feed widely in agricultural fields, then retreat to less exposed sites such as Burns Bog to rest (Biggs 1976). Kistritz et al. (1992) suggest that ten amphibian and six reptile species may occur in North Delta, and Rithaler (2000) confirms the occurrence of ten amphibian species in Delta. The confirmed amphibians include four frogs and five salamanders, as well as the Western Toad (Bufo boreas). Two frogs are native species, and the two others are the alien Green Frog (Rana clamitans) and the American Bullfrog (Rana catesbeiana). Three species of garter snake occur. The Pacific Rubber Boa (Charina bottae) may occur. The Painted Turtle (Chrysemys picta) potentially inhabits South Delta (Rithaler 2000). A variety of small and large mammals occur in the south-western Lower Mainland near Burns Bog. For example, Kistritz et al. (1992) enumerated 48 potential species for North Delta and Barnard (1988) noted 24 species in the Burns Bog area. Most numerous are shrews, mice and voles which inhabit a wide range of habitats (Zuleta and Galindo-Leal 1994). Provincial red- and blue-listed species are among the small mammal fauna (Kistritz et al. 1992; Cannings et al. 1999). Rats, jumping mice, chipmunks, and native and introduced squirrels have been observed. Despite the occurrence of high quality habitat and the possibility of detecting rare species, the bat fauna has not been inventoried (Kistritz et al. 1992). Larger mammals occur widely in the area (Biggs 1976; Kistritz et al. 1992). Opossums and racoons range widely in many habitats. Beavers and muskrats use aquatic habitats (Kistritz et al. 1992). Otters and mink inhabit the Fraser River and its riparian zone, and other members of the Weasel family, including Spotted Skunks (Spilogale putorius), occur now or have been observed in the past. Eastern Cottontails (Sylvilagus floridanus) abound throughout the region. Snowshoe Hare (Lepus americanus), which once occurred, appear no longer to be present (Beak Consultants Limited 1982; Kistritz et al. 1992). Other larger mammals, which have been observed in the past and may now no longer occur, include the Red Fox (Vulpes vulpes) and the Porcupine (Erethizon dorsatum). On the other hand, Black-tailed Deer and Coyote persist in large numbers (Kistritz et al. 1992). The largest mammal of all in the region, the Black Bear (Ursus americanus), persists in small numbers (Kistritz et al. 1992). Biggs (1976) noted that the large mammals are largely isolated from adjacent populations.

27
3.5 Historic Vegetation
The vegetation of Burns Bog has changed markedly since the late 1800s and even since the 1920s (Osvald 1933; Hebda and Biggs 1981; North and Teversham 1984). The major difference was the limited occurrence of forest stands in the Bog area before the 1940s. Surveyors' notes indicate that in the late 1800s pine forests and birch stands were absent (Figure 3.3). The areas they now occupy supported heath and wet open bog communities (Hebda and Biggs 1981). On the north and west margins, shrubby vegetation, largely dominated by hardhack (Spiraea douglasii) or mixed shrub and grass communities, occurred. Spruce forest occupied the area adjacent to Crescent Slough and conifer forest grew along the eastern margin. South of the Bog, wet prairie-like communities of grasses, rushes, reeds, and sedges extended to Boundary Bay. Osvald (1933) visited Burns Bog (called at that time the “Great Delta Bog”) in 1927. He remarked that significant portions of the “shallow margins have been reclaimed and other parts…burned” (Osvald 1933, p.21). He noted many of today’s wet habitat bog species such as bog laurel (Kalmia microphylla ssp. occidentalis), bog blueberry (Vaccinium uliginosum), and cotton-grass (Eriophorum chamissonis) in an undisturbed area. Notable also was the occurrence of salal (Gaultheria shallon). White beak-rush (Rhynchospora alba) was restricted to small depressions. Many kinds of Labrador tea (Ledum groenlandicum) “societies” also occurred on unburned areas. These ranged from those that were “bare” (presumably without an understory), and others with lichens, leaf mosses and Sphagnum. Three Sphagnum species were noted. He also recognized a bog blueberry community poor in species. Curiously, he concluded that depressions or hollows were “completely absent” in contrast to Lulu Island Bog. This suggests that he did not visit the middle of the Bog where aerial photographs from 1930 show hundreds of small pools. Osvald’s (1933, p.22) last sentence suggests that lodgepole pine was already invading the Bog where he visited (the south margin), otherwise “the whole bog would quickly develop into pine forest, if the trees were not killed off by fire”.

28
Figure 3.3 Original vegetation cover of the southern Fraser River delta, south-western British Columbia, based on land survey notes 1873-74 (Hebda and Biggs 1981).
Bog: small pines, cranberry, tea, moss Salt marsh
Wet grass prairie: grasses, rushes, reeds, sedges Red top prairie Grass: patches of willow, hardhack, crab apple, rose Grass, hardhack, willow
Hardhack, willow, crab apple, rose
Spruce forest: crab apple, willow, alder
Swamp forest: cedar, spruce, hemlock, alder Data unavailable
N
km 0 1 2 3
LULU ISLAND
BOUNDARY BAY

29
3.6 Origin and Development of Burns Bog
When sea-levels stabilized about 5,000 years ago (Clague 1989; Williams and Hebda 1991), sand and silt began to accumulate at the front of the growing Fraser River delta and provided the first “foot-hold” for plants that would begin the development of Burns Bog. Patches of bulrushes (Scirpus spp.) began binding the loose sediments (Hebda 1977, 1990). As this tidally-influenced zone began to stabilize, cattails, sedges (Carex spp.) and Pacific water-parsley (Oenanthe sarmentosa) colonized the increasingly fresh water. These plants thrived along the emerging delta front and in the channels of the ancient Fraser River under the daily influence of tidally mixed brackish water. Fresh-water river wetland communities of sedges and grasses replaced the brackish marshes between 4,000 and 5,000 years ago as the delta surface built up (Hebda 1977). Parts of the Bog were occasionally influenced by salt water during this interval. Peat, mixed with fine silt from the flooding Fraser River, accumulated so that by about 3,500 years ago, the ground surface rose sufficiently above flood level that shrubs, such as sweet gale (Myrica gale) and hardhack, could thrive. The leaves, twigs and stems of these shrubs contributed to the formation of woody peat (Hebda 1977). The accumulating peat, and the dense, poorly drained organic silts below it, nearly sealed the surface of the ground to the downward movement of water. As the peat deposit grew upward, the main source of water changed from nutrient-rich flood water and groundwater to nutrient-poor winter rainfall. Plant matter continued to collect on the surface and formed progressively more acidic peat. The first true bog-associated species, Labrador tea, colonized this acid habitat and soon thereafter, Sphagnum species made their first appearance. Toward the eastern edge of the Bog, in the vicinity of the Delta Nature Reserve, predominantly woody peat seems to have accumulated with Sphagnum growth beginning later than in the main part of the Bog. With the growth of Sphagnum, the wetland turned very acidic, creating conditions unfavourable to normal upland plants, but favouring the special collection of species that thrive in bogs. Sphagnum peat continued to accumulate forming the present raised bog with scattered clusters of small pools. As the peat mass became thicker, a partly-decomposed, nearly-impermeable zone, called the catotelm, formed. From this point on, the living and “porous” skin of the overlying acrotelm transformed the Bog into the ecosystem complex present prior to twentieth century disturbance. At this stage of development, water now drained outward from the Bog into a lagg or collecting zone and onto the flat neighbouring lowlands. It was with the arrival of European settlers that major changes occurred in the bog ecosystem. Clearing, draining, extensive burning, filling and especially peat mining substantially altered essential ecosystem characteristics of the Bog. Ditches drained more water from the Bog than before, and water storage was diminished by peat removal and conversion of parts of the Bog to other purposes. The current condition of the Bog is a result of these changes.

30
3.7 Land Use
3.7.1 Recent Land Use
Large tracts of Burns Bog have been disturbed by various types of land use (see Section 5.2.1). Prior to the 1940s, agricultural use predominated in the area. From the 1940s to the mid 1980s, extensive peat mining occurred within the Bog (Burns 1997). Encroachment by urban development and intensifying industrial uses are trends that continue to the present. Farmers have attempted to drain and manage the shallow peat around the periphery of the Bog for many years. Farming began as early as the 1870s (Scott, Pinder and Cridge 1873-77, unpublished field notes) and farms were well established by the 1900s (Anrep 1928). Until buried by the City of Vancouver landfill, the south-western end of the Bog was crisscrossed by the remains of an old drainage system from the early part of the twentieth century (Hebda and Biggs 1981). In the last 20 years, agricultural activity moved from the Bog margins into the Bog itself. Cranberry farms have been established in the north-west portion of the Bog (Figure 3.4), with further tracts of land prepared for development in 1999. A small blueberry field occupies land along the western edge. A large parcel in the north-east corner is zoned for agricultural purposes and is included in the Agricultural Land Reserve, but has yet to be developed (Figure 3.4). The Bog’s margins are bordered primarily by dairy farms and forage production, and some market gardens. The building of extensive tracts of greenhouses is a recent development, but most of these are located south of Highway 99. A substantial proportion of the Bog has been excavated or disturbed by peat mining (Figure 3.4, listed as extractive industry). The land occupied by the City of Vancouver landfill in the south-western portion (Figure 3.4, large tract listed as transportation, communication and utilities) has been alienated from the bog ecosystem complex. Various industrial uses are concentrated between Burns Bog and the Fraser River (Figure 3.4). The development has occurred on lands filled and alienated from the Bog, not just on lands which are outside of the historical extent of the Bog. Other major land uses in the Burns Bog area include urban development and the associated infrastructure. Residential development dominates the eastern margins, covering much of Panorama Ridge (Figure 3.4). Highway 91 cuts through the eastern portion of the Bog and the associated interchanges occupy lands of the bog periphery and in the Bog itself (Figure 3.4). In addition to the highway, several other transportation and utility corridors occur along the margins of, and within the Bog. These include BC Hydro transmission lines, natural gas lines, and sewer lines. Railroads pass along the eastern and northern boundaries (Figure 3.4). Other current uses of the Bog include waterfowl hunting and all-terrain vehicle riding. A shooting range has been established next to the unpaved extension of 80th Street. The largest existing park or protected area within the study area is the Delta Nature Reserve in the north-eastern part of the Bog (Figure 3.4).

31
The varied land uses have each had their associated impacts on the species and processes associated with the bog ecosystem complex, some direct and obvious, others more subtle. These effects are discussed throughout the rest of the report.
3.7.2 Land Use and Extent of the Bog
Since the early 1900s, the area of Burns Bog has been reduced by land uses that eliminated original bog communities, covered or removed the peat surface and changed the hydrology. Reports of the original size of the Bog vary markedly. Osvald (1933) wrote that the Bog was as large as 100 km2 or 10,000 ha, whereas Rigg and Richardson (1938) described it as covering 12,000 acres or about 4,800 ha. An estimate of the Bog area as indicated by the vegetation pattern in areal photographs from 1930 (Figure 4.8, Section 4.2.5.2), and verified by comparison to the historic vegetation pattern (Figure 3.3, Section 3.5), yields an estimate of 4,300 ha, much closer to Rigg and Richardson’s (1938) value. Based on his description of the Bog, it is unlikely that Osvald (1933) measured the area of the Bog directly, but obtained it from informants. The informants may have included other wetland areas such as wet meadows (see Figure 3.3, Section 3.5). Biggs (1976) estimated the area of Burns Bog to be 4,000 ha in the mid 1970s, somewhat smaller than the estimates of the extent in the 1930s. The reduced size was largely the result of the establishment of the City of Vancouver landfill and filling for industrial development on the Bog’s northern margin. Since that time, large areas of the Bog have been permanently alienated by conversion to a variety of uses. The City of Vancouver landfill has expanded markedly and effectively cut off the original southern extension of the Bog. Filling on the northern margin has eliminated further large tracts of the original ecosystem complex. Highway 91 and its interchanges removed more land. Cranberry and blueberry fields in the north-west sector have also eliminated bog communities. The area of the Burns Bog complex which persists today was calculated by the Land Use Coordination Office (Province of British Columbia) using a Geographic Information System (GIS) and 1999 aerial photographs. This area was estimated to be 2,821 ha and is the extent of the Bog which remains “ecologically available”. By including the cranberry and blueberry fields, the area increases to 3,041 ha. This is the area of the Bog which is “hydrologically available”. Throughout this report, Burns Bog is defined as the ecologically available bog unless otherwise stated. In addition, when discussed, the area of the historical Bog is assumed to be 4,800 ha as reported by Rigg and Richardson (1938).
3.8 First Nations Use/Interests
First Nations people are known to have used Burns Bog. The Tsawwassen, Semiahmoo and Sto:lo First Nations indicated to the EAO that the area continues to be extremely important to them in terms of cultural, archaeological, traditional and current uses. Others, such as the Musqueam Indian Band, share these interests. In a submission to the Burns Bog Ecosystem Review, the Tsawwassen First Nation indicated that the Bog contains areas of great importance for sustenance activities. Historically, the Tsawwassen claim to have utilized the network of waterways in Burns Bog and adjacent lands to access the area. The Bog was an important canoe

32
portage area. They also claim to have hunted Black Bear, Black-tailed Deer and elk, as well as perhaps ducks. Blackberries, blueberries, cranberries, Labrador tea, salal and Sphagnum are of particular interest to the Tsawwassen. The Tsawwassen First Nation have also indicated that the gathering of plants for medicinal purposes did occur in the Bog, but specific details are not available. The Burns Bog Ecosystem Review did not specifically include consideration of cultural and heritage issues, although First Nations were invited to submit comments indicating the nature of the importance they place on the area (Appendix A). The Review did not study past or current First Nations land use. Given the limited information regarding historic activities, further archaeological research is required to develop a more complete understanding.

33
Figure 3.4 Regional land use (1994-1996 data from the Greater Vancouver Regional District).

34

34
4.0 Biophysical Characteristics of Burns Bog
4.1 Introduction
Field studies provided important information about the physical and biological components of the Bog. The results of these studies characterized features of the Bog and bog-related plant communities and wildlife habitats by examining and mapping aspects of geology, hydrology, soils, water chemistry, plants and plant communities, wildlife and fisheries (see Appendix D). The information from the separate technical studies was then related through the use of a Geographic Information System (GIS) to help identify the needs of unique and key species and processes associated with the bog ecosystem complex (see Sections 5.0 and 6.0). The preliminary results of the component field studies were evaluated for content and interpretation by the EAO and participants of the Technical Review Meetings (see Appendix C and Appendix D). Suggestions received from local, regional and international scientific experts, as well as information from the scientific literature and work not included in the field studies, were combined with field data to prepare the summaries of biophysical characteristics that follow. In a few cases, additional field data were collected to fill gaps in knowledge or verify original observations. These are explicitly noted in the text.
4.2 Physical Setting
4.2.1 Geology
The geologic framework provides the template for peat formation and strongly influences hydrology and the development of plant communities. This framework includes both subsurface and surface deposits. The peat deposits of Burns Bog rest upon a 300-800 m-thick complex of unconsolidated glacial outwash, till, marine sediments, and post-glacial deltaic sediments of sand, silt and clay, which overlie deeply buried bedrock (Clague et al. 1998). The sediments were deposited as a result of a complex sequence of glacial advances and retreats, sea-level fluctuations, delta building and floodplain aggradation in the Fraser Lowland.
Two major geologic units occur near the surface under the peat (Figure 4.1). A well-sorted deltaic sand, from 10-20 m thick, occurs beneath most of the Bog (Monahan et al. 1993). The top of this unit varies in depth from 5-10 m below the surface in much of the area, but may not be present between Highway 91 and Panorama Ridge (Newton Upland). These sands accumulated in the delta's distributary channels (Monahan 1999). Silt, clayey silt, and organic silt overlie the sand unit. These formed as overbank or intertidal deposits. Generally, the silt unit is sandier at the base (AGRA Earth & Environmental Limited 1999a) and more organic at the top (Hebda 1977). The unit varies from 1-7 m thick west of Highway 91, but increases to 10-17 m thick in

35
the trough between Panorama Ridge and Highway 91 (AGRA Earth & Environmental Limited 1999a).
A notable geological feature is a north-south striking subsurface sand ridge located about 1 km in from the eastern edge of the Bog, marked by the location of Highway 91 (see Figure 4.2). Peat deposits thin across this subsurface sand ridge (Hebda 1977; AGRA Earth & Environmental Limited 1999a, 1999b). Deposits at or near the surface in the vicinity of the Bog include intertidal sands and silts, fine overbank sand and silt deposits, peat, glacially-derived outwash sand and gravel, and glacial till (Figure 4.2). Much of the zone between Boundary Bay and Burns Bog is covered by a 15-45 cm thick layer of organic rich sandy loam to clay loam. This layer rests upon thick tidal flat and distributary channel sediments (Armstrong and Hicock 1980). The thin sediments, enriched in organic matter, probably represent the remnants of incipient peat deposits formed in marshy wetlands on the emerging delta surface (Hebda 1977). Late Pleistocene outwash sand and gravel deposits and till form the Newton Upland on the Bog's eastern border (Armstrong and Hicock 1980). Also on the eastern margins of the Bog, Blake and Cougar (Canyon) Creeks have laid down silty alluvial deposits derived from the adjacent glacial-age sediments (AGRA Earth & Environmental Limited 1999a). The peat deposits, capping the silt and clayey silt, are of varying thickness and degree of decomposition. Originally, the peat varied from 4-5 m thick at the centre of the Bog, where peat is more fibrous and less decomposed. At the periphery, the peat was only 1 m thick and more decomposed (see Section 4.2.3). Mining has removed large volumes of peat and changed the elevation of the Bog surface and thickness of peat deposits (see Section 4.2.2). Improved drainage has likely led to increased decomposition of the organic deposit, further thinning the peat unit. Today, peat deposits at Burns Bog range from 2-3 m thick on average, generally being thicker in the west, thinner in the north-east, and thicker in places east of Highway 91 (Hebda 1977; AGRA Earth & Environmental Limited 1999a). Geologic deposits play an important role in the hydrologic pattern. The underlying sand unit acts as a regional aquifer (see Section 4.2.5). The clayey silts underlying the peat deposits have very low hydraulic conductivity and impede drainage. The north-south ridge inside the eastern margin has led to the accumulation of more peat, containing woody remains, east of the ridge. The description of the geology of the Bog was intended to provide a general framework for the interpretation of soils and hydrology. Though this objective is met, the data are limited in terms of comprehensively describing peat depth and the nature of sediment beneath the Bog. Rigg and Richardson (1938) show the occurrence of a shallow basin with lake sediment near the centre of the Bog. Data collected by the EAO (2000) reveal a relatively uniform depth of peat (1.5-2.3 m) and no indication of a major subsurface depression in the north-east sector. A high resolution, shallow coring investigation would help resolve whether and where basins or other relatively narrow geological features occur beneath the peat cover.

36
Figure 4.1 East-west geologic cross-section through Burns Bog (adapted from AGRA Earth & Environmental Limited 1999a). Vertical lines indicate the position of boreholes. Codes in parentheses refer to Figure 4.2.
/
LEGEND
PEAT BOG DEPOSITS, LOWLAND PEAT DEPOSITS UP TO 8m THICK (Sab)SAND SILT LOAM: COARSE OVERBANK AND ESTUARINE DEPOSITS (Fb)SILT AND CLAYEY SILT : FINE OVERBANK DEPOSITS (Fc)SANDSAND, SILT AND CLAYTILL (Va)SANDS AND GRAVELS : GLACIOFLUVIAL (PVb)GEOLOGIC CONTACT: KNOWN AND INFERRED
250
Vertical Exaggeration (40 x) 0 250 500 750 1000m
Horizontal Scale 1 : 25,000NOTE: Modified from Piteau Associates 1983

37

37
Figure 4.2 Surficial geology of the Burns Bog area, with the location of geologic section (A-A') as shown in Figure 4.1.

38

38
4.2.2 Bog Profiles
Cross-sectional profile construction is a standard approach in describing raised bogs (Ingram 1983; Glaser and Janssens 1986; Ingram 1992; Heathwaite et al. 1993). Elevational profiles help visualize whether the Bog has a truly domed shape or is shaped more like a plateau. From the profile, the steepness and width of the zone of transition (rand) to the surrounding landscape can be seen. Comparison of pre- and post-disturbance profiles provides insight into the amount of peat lost, the amount of decomposition of the peat that has occurred, and changes in the all-important water mound. The profiles of the present-day Bog were constructed using 0.5 m interval elevation contours superimposed on the orthophoto map prepared from August 1999 aerial photography (Figure 4.3). Elevational profiles were constructed for six north-south and five west-east transects at approximately 1 km intervals. Elevations were plotted at the points where a transect crossed a contour line or passed near a spot elevation. The elevation between two known points was assumed to change according to a straight-line interpolation. Most minor changes over a short distance (i.e., less than 100 m) were not included. Historic elevation profiles were constructed along the same transects as were the modern profiles to allow for direct comparison and calculation of the differences in elevation. Historic elevations were obtained from historic topographic maps (Department of Lands and Forests 1958a, 1958b; Department of Energy, Mines and Resources 1961a, 1961b) in the same manner as for the modern profiles. Where peat workings occurred on a historic map, the height of the Bog between known points was interpolated along a straight line. Figure 4.4 shows the present-day and historic elevation profiles for Burns Bog. The historic profiles clearly show that the Bog consisted largely of an extensive, relatively flat plateau with a surface between 4-5 m above sea level. The slopes rose about 2 m above the surrounding terrain within about 0.5 km of distance. This transitional rand zone was most sharply defined on the southern margin (Figure 4.4). A similar, relatively steep slope existed on the north side of the central part of the Bog. The north-west corner of the Bog, however, was characterized by a slight depression inside the perimeter of the peat mass. Independent verification for the historic south-north profiles is provided by Rigg and Richardson’s (1938) stratigraphic profile through the centre of the Bog. Their profile spanned about 5 km more or less at the position of south-north profile 3 (Rigg and Richardson 1938, Figure 18). Their profile does not take into account the domed shape of the Bog, but assuming an elevation of about 1.5 m above sea level at the south end of the transect, it is clear that the central part of the Bog reached 4-5 m above sea level. They must have encountered a small 3 m deep basin at about the mid-point of the Bog.

39
West-east historic profiles show a more complex outline (Figure 4.4). The northern-most profile appears to rise relatively gradually on the west and reach a broad dome of about 4.5 m high. The height declines somewhat and extends eastward about 4 km until it reaches a small 5+ m dome within 1 km of the toe of Panorama Ridge. A narrow, 0.5-1 m deep depression separates the slope from the secondary dome. A kilometre to the south, the elevational profile is generally similar, except that the height of the 5+ m high zone is more pronounced and there is no separate height of peat before the toe of Panorama Ridge. Rather, the peat surface decreased to about 3.5 m above sea level before meeting the slope. The gradual slope to the profile between 3-6 km may be an artifact resulting from a lack of original surface data points in this zone of peat workings. West-east profile 3 (Figure 4.4) intersects the same north-south elevated zone of peat as in the previous two transects. It shows clearly that the surface of the south-east portion of the Bog was essentially flat at 4 m above sea level before decreasing to the surrounding delta surface. West-east profiles 4 and 5 (Figure 4.4) suggest a more typical raised bog profile with relatively sharply rising sides and a height of about 4 m. Modern north-south profiles (Figure 4.4) show clearly that a great volume of peat has been removed from the Bog. Three profiles, south-north profiles 1, 2, and 3, reveal that 1-2 m of peat have gone from the northern two-thirds of the Bog. On the southern margin, though, the elevation (south-north profiles 1 and 3) remains as it was before significant disturbance in other parts of the Bog. In parts of the Bog largely mined by the Atkins-Durbrow method of peat extraction (Appendix H), the overall shape of the profile has not changed (south-north profiles 4 and 5). Even the irregularities, such as the depression on the north-west sector, remain. Instead, the entire Bog surface had been lowered or collapsed by about 0.5-1.0 m because of the internal removal of discrete packets of peat, with minimal disturbance of the surface outline. Like the north-south profiles, the west-east profiles clearly show the great mass of peat lost in the north-east sector of the Bog (Figure 4.4). West-east profile 3 shows the collapse of the surface even though the overall profile form is retained. Notably, the broad ridge of peat in the west-central sector of the Bog remains, but it is now 1 m lower than it was in the 1950s. West-east profile 4 is the most remarkable, because the modern profile, with the exception of a few ditches, is almost the same as it was before major disturbance. It is along this west-east stretch that the least disturbed plant communities persist (compare Figure 4.4 with Figure 4.19, Section 4.3.1.1). In summary, profile analysis reveals that Burns Bog:
1. Had a large flat plateau 4-5 m high; 2. May have had two heights of peat - a broad north-south 5 m high ridge in the
west-central part of the Bog and a 5+ m zone near Panorama Ridge; 3. Had large quantities of peat removed, especially in the north-east; 4. Had suffered collapse of the mound in the western sector, while still retaining profile
shape; and 5. Has retained most of its original profile along a west-east strip in the southern third of the
Bog.

40
Figure 4.3 Current elevations within Burns Bog at 0.5 m intervals.

41
Figure 4.4 Historic and current surface elevation profiles throughout Burns Bog.

42
4.2.3 Native Soils
Soil development in Burns Bog has been shaped by the impeded drainage of low-lying, relatively flat clayey silts at the surface, a moist climate, the occurrence of peat-forming vegetation, and the passage of time. These factors have led to the accumulation of peat and peaty mineral soils over 3,000-4,000 years. Recent draining, filling and other forms of soil disturbance have affected soil formation (Hebda and Biggs 1981; AGRA Earth & Environmental Limited 1999b). Peat extraction especially, has resulted in major changes throughout much of the Bog. Two broad groups of soils are recognized in the study area: those developed in predominantly mineral terrain, and those developed in organic (peaty) terrain (Table 4.1). Mineral soil types include both those composed mostly of mineral constituents and those with organic or peat deposits up to 40 cm thick on the surface. In the context of Burns Bog, these peaty phases are transitional from mineral to organic soils. Organic soils have a peat layer on the surface greater than 40 cm thick. Organic soils are classified on the basis of degree of decomposition of the peat and its botanical origins (from what plants it was formed). AGRA Earth & Environmental Limited’s (1999b) detailed soil study recognized eleven soil series (major types) in the Burns Bog area (Figure 4.5). Six of these series are mineral soils; three are mostly mineral dominated (Delta, Embree, Kitter) and three are transitional to organic soils having peaty phases (Annis, Blundell and Vinod). Several of these soils are limited in distribution. There are five extensively distributed organic soils developed from either Sphagnum, moss-sedge or forest peat. These are the Annacis, Lumbum, Lulu, Richmond and Triggs soils. Mineral soils surround much of the study area (Luttmerding 1980; Catherine Berris Associates Inc. 1993) but have limited extent within the area surveyed by AGRA Earth & Environmental Limited (1999b) (Figure 4.5). Mineral soil texture of these generally poorly-drained soils varies from silty clay to silty loam. The soils are classified mainly as Rego or Orthic gleysols. Three of the soils (Annis, Blundell and Vinod) have a surface organic layer up to 40 cm thick, whereas the other three (Delta, Embree and Kitter) do not. All six mineral-based soils are strongly to extremely acidic at the surface with pH 4.5 or less. Deeper in the profiles, into the more mineral zones, the pH rises slightly above 5.0 (AGRA Earth & Environmental Limited 1999b). Three of the soils (Blundell, Delta and Vinod) are saline in parts of the profile. Generally, mineral soils have moderate to low cation exchange capacities6 and a range of exchangeable cation (calcium and magnesium) concentrations (AGRA Earth & Environmental Limited 1999b, Appendix A and E).
6 Cation exchange capacity is the total amount of cations (positive ions) that the active surfaces of a soil can take up or “exchange” from a solution.

43
Table 4.1 Soil series and variants of the Burns Bog area (AGRA Earth & Environmental Limited 1999b).
series soil subgroup material
Organic soils
Annacis Typic Humisol Moss-sedge-forest peat
Annacis, mesic variant Mesic Humisol Moss-sedge-forest peat
Lumbum Typic Mesisol Sphagnum peat
Lumbum, fibric variant Fibric Mesisol Sphagnum peat
Lumbum, forest peat and fibric variant
Fibric Mesisol Forest peat
Lumbum, forest peat variant Typic Mesisol Forest peat
Lumbum, humic variant Humic Mesisol Sphagnum peat
Lulu Terric Mesisol Sphagnum peat
Lulu, fibric variant Terric Fibric Mesisol Sphagnum peat
Lulu, humic variant Terric Humic Mesisol Sphagnum peat
Richmond Terric Humisol Moss-sedge-forest peat
Richmond, mesic variant Terric Mesic Humisol Moss-sedge-forest peat
Richmond, mesic variant Terric Mesic Humisol Sphagnum peat
Triggs Typic Fibrisol Sphagnum peat
Triggs, mesic variant Mesic Fibrisol Sphagnum peat
Triggs, cutover variant Mesic Fibrisol Sphagnum peat
Mineral soils
Annis Rego Gleysol, peaty phase
Deltaic and floodplain, moderately fine to fine textured
Blundell Rego Gleysol, saline and peaty phase
Deltaic, medium textured
Delta Orthic Humic Gleysol, saline phase
Deltaic, medium textured
Embree Rego Humic Gleysol, saline phase
Deltaic, medium textured
Kitter Orthic Gleysol Deltaic, medium textured
Vinod Rego Gleysol, saline and peaty phase
Deltaic, moderately fine textured

44
Organic soils cover almost all of the study area (Figure 4.5). They range from soils with well-decomposed upper layers (Annacis, Richmond) through those that are moderately decomposed (Lumbum, Lulu) to the Triggs soil, in which the upper layer is mostly undecomposed. Richmond soils have a thinner organic upper layer than Annacis soils, but both occur at the margins of the peat body (Figure 4.5). They developed in part on sedge or woody peat. Both are saline at depth, especially in the mineral portion of the profile. Generally, organic soils have high cation exchange capacities but low cation (calcium and magnesium) concentrations (AGRA Earth & Environmental Limited 1999b). Lumbum and Lulu soils have developed on partly decomposed peat (AGRA Earth & Environmental Limited 1999b). Lulu soils have a relatively shallow organic upper layer, whereas Lumbum soils exhibit a thick organic zone. Lumbum soils occur widely in the study area, especially at the margins, but also within the Bog at sites of deep or extensive peat workings (Figure 4.5). Lulu soils are scattered at the margins of the peat body outside the zone of Lumbum soil. Both soils have largely developed in Sphagnum peat. They exhibit more and less decomposed upper layers leading to the recognition of humic (more decomposed) and fibric (less decomposed) variants. Lumbum variants LM-1 and LM-2 have developed because of the removal of undecomposed peat on the surface and exposure of underlying moderately decomposed peat. LM-1 occurs in the northern part of the Bog where much of the undecomposed cover has been removed. The LM-3 variant occupies large areas in the middle of the Bog where patches of Triggs (original cover) bog soil remain mixed with mined zones. Variants LM-2, LM-4, and LM-5 represent soils in which wood is common in the peat (forest peat in AGRA Earth & Environmental Limited 1999b) and largely occur in the eastern part of the Bog. Lumbum soils are extremely acidic with pH below 4.5 and have low nitrogen content. Triggs soils are typical of acid bog conditions at the core of the Bog. These are Fibrisols (fibrous soils) composed largely of slightly decomposed peat, mainly Sphagnum remains. The peat is typically 2 m deep or more. More decomposed peat occurs at depth. Two variants are recognized: TR-1 is the typical Triggs soil, whereas TR-2 includes areas with more decomposed peat and inclusions of Lumbum type soils. TR-1 soils predominate in the southern third of the Bog under undisturbed vegetation. TR-2 soils are mapped where the more decomposed deep peat occurs closer to the surface because of mining, and where ridges of TR-1 soil occur within a partly harvested landscape. The TR-2 variant is further subdivided on the basis of harvesting method and resulting surface form. TR-2 soils predominate in the middle of the Bog, mixed with patches of Lumbum soils, especially in the west. Triggs soils are extremely acidic with pH ranging from 3.2-4.0 and occasionally lower (AGRA Earth & Environmental Limited 1999b). Nitrogen concentrations are low, most values being less than 1%.
4.2.3.1 Soils and Disturbance
Drainage of the Bog, by the excavation of ditches and peat harvesting, affects several soil properties. The unsaturated surface layer (the acrotelm) becomes thicker and decomposes more rapidly, turning Fibrisols (fibrous peat) to Mesisols (moderately decomposed peat). Under agricultural use, the structure of the peat breaks down rapidly, mineral material is brought to the surface and the organic layer often disappears after repeated cultivation. Mesisols are converted to Humisols (well-decomposed peat). Organic soils may even be turned into mineral soils. Soil properties, including chemistry and paths of water transmission, change. Drainage alone alters

45
plant species composition through the release of more nutrients (nitrogen for example) and changing primary productivity and nutrient cycling (see Section 5.2). There is clear evidence that such changes have occurred in Burns Bog as suggested by relatively well-decomposed peat in the surface or near-surface layers (commonly about 20 cm thick) at several sites (AGRA Earth & Environmental Limited 1999b). This decomposed peat (in a “mesic” stage of decomposition) is in contrast to the underlying fibric peat. Other well-decomposed peat layers evident in the Bog may be related to natural historic causes, such fires (Osvald 1933; Hebda and Biggs 1981; North and Teversham 1984) and changes in regional hydrology related to river channel movements (Clague et al. 1998). Peat harvesting has also influenced the native soil characteristics of Burns Bog. The surficial fibric layer (0.3-1 m thick) has been removed in many areas (Section 4.2.2). In these areas, the underlying, more decomposed layers are now closer to the surface and affect water storage and transmission properties, as well as chemical characteristics. The conversion of Triggs type soils to Lumbum soils in the main part of the Bog is an example of this effect. In summary, the study area consists of five organic soil types surrounded by a complex of mineral-based soils. Three organic soils predominate. The outer-most organic soils have developed a shallow to moderately deep, highly decomposed surface peat horizon. Soils with a moderately decomposing upper peat horizon (Mesisols) occur around the margins of the Bog and extend well inside the Bog where peat mining has altered the original bog soil. The typical bog soil, with a relatively undecomposed upper horizon, occurs in the middle and southern third of the Bog. Original soil characteristics have been altered over a wide part of the study area by human activity. The peat is least decomposed in the central part of the Bog and most decomposed near the edges of the Bog. Lowering of the water table by drainage in recent decades may have increased aeration in the surface peat layers, leading to accelerated decomposition. A lower land surface elevation and the presence of frequent standing water at the surface is a significant feature of the soil landscape in the peat mined areas. The soil study by AGRA Earth & Environmental Limited (1999b) is of a higher resolution than of any previous studies of Burns Bog. A more comprehensive study of the relationship between soil type and vegetation is desirable, particularly if restoration of ecosystems is anticipated.

46
Figure 4.5 Native soils of the Burns Bog area.

47

47
4.2.4 Contaminated Soils, Surface Water and Groundwater
A historical review of contaminated soils, surface water and groundwater in Burns Bog and surrounding lands was conducted to identify potential sources of contamination that may be due to previous or current land use activities (AGRA Earth & Environmental Limited 1999c). Known contaminated sites were identified, as well as sites where activities had occurred that could have caused, or have the potential to cause contamination (Figure 4.6). Contaminated sites included landfills (primarily sulphates, chlorides and metal contaminants), industrial and commercial operations (contaminant dependent upon operation), shooting ranges (metal contaminants), and former pump house facilities and dredges abandoned from peat harvesting facilities (primarily fuel and oil contaminants). In addition, roads constructed of hog-fuel (possible source of toxic leachate), sewer lines (possible source of sewage), and roads and railway corridors (possible source of chemicals and fuels from accidents) were identified as potential sources of surface and groundwater contamination. An additional issue of contamination identified by this study was the release of pesticides resulting from agricultural use in or near the Bog (AGRA Earth & Environmental Limited 1999c). The potential for a contaminated site to negatively impact the Burns Bog ecosystem complex is dependent on the type and concentration of the contaminant, the existence of a pathway by which the contaminant can travel, and the distance of the contaminant source from the sites of possible impact (AGRA Earth & Environmental Limited 1999c). In general, contaminants migrate in surface water and groundwater or in air either in a gaseous form (a volatile) or as very small particles (a particulate). AGRA Earth & Environmental Limited (1999c) noted that the characteristics of the surficial geology of Burns Bog, specifically the peat deposits (which tend to bind and hold contaminants) and underlying silts and clayey silts (which have a low permeability), act as barriers that inhibit the migration of contaminants. A point of concern for this study, however, is that the contaminant standards used (i.e., the criteria used to determine if a particular substance was present in sufficient quantities or concentration to deem the site contaminated) were based on current land use at the particular site in question (i.e., commercial or industrial use for soil standards). AGRA Earth & Environmental Limited (1999c) notes that a stricter standard may be appropriate for protection of the ecosystem complex. Most of the contaminated sites are located along River Road or in the Progress Way industrial estate (Figure 4.6). The potential for these sites to impact Burns Bog negatively is relatively low because the general groundwater flows toward the north, away from the Bog (see Section 4.2.5). Surface water flow to the south of these sites is expected to be intercepted by drainage ditches, which are located between the contaminated sites and Burns Bog, or the sewer system within the industrial estate (AGRA Earth & Environmental Limited 1999c). The majority of leachate compliance issues associated with the landfills along River Road relate to discharges at the north end of these sites (AGRA Earth & Environmental Limited 1999c). The Technical Review Meetings (Sims et al. 2000a) confirmed that there is little existing evidence of significant contamination based on industrial standards. AGRA Earth & Environmental Limited (1999c) concluded that the City of Vancouver landfill may be of concern.

48
The City of Vancouver landfill is located adjacent to the south edge of Burns Bog. Therefore, in the event that leachate from the landfill migrated into the Bog, there could be an impact on bog ecosystems. Leachate from the City of Vancouver landfill is collected in a perimeter leachate collection system and treated. Regular water-quality monitoring of ground and surface water around the landfill indicates that the landfill leachate is not adversely impacting ground and surface water systems. The likelihood of Burns Bog being affected by metal contaminants from the Delta Police Rifle Range is low because migration of contaminants is likely inhibited in the organic soils (AGRA Earth & Environmental Limited 1999c). Local hydrocarbon contamination had been reported at one of the former pump station sites, but the extent of the spill was limited (AGRA Earth & Environmental Limited 1999c). There are several potentially contaminated sites that, due to their location near Burns Bog and the nature of the activities associated with them, present a risk to bog ecosystems. As identified by AGRA Earth & Environmental Limited (1999c), these sites include the former pump station sites used during peat harvesting. There may be traces of fuel or oil at these locations. Hydrocarbon contamination could also be present at the sites of two abandoned peat harvesting dredges (AGRA Earth & Environmental Limited 1999c). There is also a potential for petroleum hydrocarbon contamination to impact the Bog if a leak occurred in underground storage tanks present on the Mainland Contracting Company site (AGRA Earth & Environmental Limited 1999c). These sites are only of concern because not enough is known about them. Overall, the evidence indicates few concerns for contaminated soils, surface water or groundwater affecting the Bog. However, the study by AGRA Earth & Environmental Limited (1999c) was based only on a review of existing information. No new testing was performed. Soil analyses were conducted, however, as part of the native soil characterization study (Section 4.2.3). Samples showed no signs of metal contamination within Burns Bog. Results of analyses obtained for a typical deep, fibrous peat site indicated that the concentration of all metals were well below contamination standards for sensitive uses (i.e., agricultural, residential, and urban park use; AGRA Earth & Environmental Limited 1999c). Discussions during the Technical Review Meetings (Sims et al. 2000a) noted that other contaminants that have yet to be quantified (e.g., from agricultural activities and hog-fuel roads) may be important. There are also global atmospheric contamination issues which may affect the Bog (Sims et al. 2000a). These should be monitored over the long term.

49
Figure 4.6 Contaminated soil sites of the Burns Bog area.

50
50
4.2.5 Hydrology
Hydrology exerts a primary control on raised bog ecosystems and their biophysical properties (see Section 2.0). Many factors affect hydrology including climate, geological features, drainage patterns, vegetation, and disturbance (Naucke et al. 1993). Understanding basic hydrologic patterns in Burns Bog provides insight into those factors vital to its ecological integrity. Understanding changes in hydrology and their consequences provides tools by which to assess risks to ecosystem sustainability and the factors that affect the level of risk. This section describes the Bog’s hydrologic characteristics beginning with a brief account of local climate. A description of the pre-disturbance historical conditions of hydrology follows and sets the stage for description of, and comparison with, the modern pattern. Hydrogeology is described next. Finally, emphasis is placed on the Bog’s water storage and water balance because they are major elements in the analysis of the requirements for ecological integrity and sustainability presented in Section 6.0. The description and interpretation that follow are based on reports by Piteau Associates (1994), Helbert and Balfour (2000), field observations made by EAO staff, review of literature and consultation with experts. Additional data were obtained and analyses carried out by EAO staff, consultants and the GIS support staff at the Land Use Coordination Office (Government of British Columbia) in Victoria.
4.2.5.1 Climate
Burns Bog occupies an area that spans a precipitation gradient from about 1,018 mm mean annual precipitation (Figure 4.7) to about 1,200 mm (Helbert and Balfour 2000). The mean annual temperature is 9.6qC (Helbert and Balfour 2000). Annual changes in temperature and precipitation are important to the Bog’s hydrology because together they define the interval of summer moisture deficit and provide data for calculating water balance values. Comparing mean monthly temperatures and precipitation values, the interval of moisture deficit extends from April to October (Hebda and Biggs 1981; Oke and Hay 1998; Helbert and Balfour 2000). During this interval, the Bog loses more water to evaporation and transpiration than it receives from the atmosphere. Other aspects of climate are discussed in the section on water balance (Section 4.2.5.6).

51
Figure 4.7 Isohyets of annual precipitation (adapted from Piteau Associates 1994).
Burns Bog
City of Vancouver landfill site
Perimeter of major upland area
Notes: Modified from Piteau Associates 1983
4.2.5.2 Historical Hydrologic Configuration and Drainage Patterns
Aerial photographs from 1930 (Figure 4.8), old maps, and surveyors' notes provide insight into the hydrologic conditions of the Bog before peat mining and widespread artificial drainage works began (summarized in Helbert and Balfour 2000). Historically, the Bog was situated between the South Arm of the Fraser River to the north, and poorly drained flat lands associated with Boundary Bay to the south (Figure 4.8). Crescent Slough bounded the peat body on the west. To the east, the Bog received discharge from the slopes of Panorama Ridge of the Newton Upland. Floodwaters from the Fraser River freshet must have extended onto the north parts of the Bog in late spring, though the extent of inundation is not known (Helbert and Balfour 2000). As is the case today, tides must have influenced surrounding and underlying groundwater.

52
The Bog exhibited a relatively typical raised or domed form with a high zone (see Section 4.2.2), which shed water in the central region to receiving systems at the margins. The drainage divide appears to have run more or less west to east along the axis of the oval peat body (Figure 4.8 Helbert and Balfour 2000). Early topographic maps (Mapping and Charting Establishment 1970; Surveys and Mapping Branch 1970) suggest there may have been two broad high points - a dome in the west-central area and a gradually rising apron extending to the base of Panorama Ridge. The two high zones were connected by a broad ridge. The surface of the Bog hosted at least seven zones of small ponds, distributed on either side of the drainage axis. The clusters consisted of a few tens to possibly as many as 200 ponds. Ponds were about 5-10 m across. Smaller groups of ponds and single ponds occurred nearly to the southern margin. Ponds covered slightly less than 1 km2 at the time the 1930 aerial photograph was taken (Helbert and Balfour 2000). In 1930, few drainage channels are apparent in the Bog (Figure 4.8). Most of these seem to have been shallow, narrow and, perhaps, ephemeral. Three to five poorly-defined branching water courses drained the south-eastern portion of the Bog to the margin. North and west sectors had essentially no outward surface drainage. A relatively well-defined and long watercourse carried water southward from the extreme eastern portion of the Bog, and another stream probably carried water northward to the Fraser River from the north-east portion. It appears that much of the excess water in the Bog drained by lateral flow and seepage to a well-developed marginal lagg system. The lagg on the north and west margins was well defined. It carried water from at least half of the northern periphery south-westward, joined with streams from non-bog lowlands and entered Crescent Slough. Crescent Slough formed the lagg along the western margin, eventually directing water away from the Bog. Drainage along the southern margin was complex. In the south-west, there appear to have been seepage zones associated with small marginal ponds and poorly defined water courses (Figure 4.8). Along the south-central and south-eastern margins, discharge collected in a lagg zone from which well-defined sinuous channels flowed to Boundary Bay. A well-developed looping drainage system carried water from the south-east sector of the Bog including, apparently, waters from Cougar (Canyon) Creek (Figure 4.9) (Paulik 1999) and much of the eastern Bog. The drainage system joined Big Slough, which emptied into Boundary Bay. The 1930 aerial photographs and field observations (Hebda 1977) suggest that a few drainage ditches cut into the south-west portion of the Bog, which is now covered by the City of Vancouver landfill. Overall, natural and artificial water courses directly drained about 682 ha of the Bog (based on a ditch influence of 100 m; see Figure 4.10a,b). This amounts to about 17% of the total historic Bog area. Helbert and Balfour (2000) estimate that about 30% of the water drained to Boundary Bay and 70% drained to the Fraser River.

53
Figure 4.9 1898 chart of the Fraser River delta showing Burns Bog area (horizontal lines) and drainage (arrow) to the south (adapted from Paulik 1999).

54
Figure 4.8 Historical drainage patterns of Burns Bog superimposed on 1930 aerial photograph.

55
Figure 4.10a Modern effect of drainage ditches.

56
Figure 4.10b Historic effect of drainage ditches.

57
57
There are no water table measurements available for the historic condition. However, the vegetation cover, as described in surveyors’ notes (Hebda and Biggs 1981) and depicted in the 1930 aerial photograph, reveal that Sphagnum and heath bog communities covered the Bog almost to the edges. These bog plant communities grow where the water table decreases to no more than 30-50 cm below the surface for a short interval during the late summer. Thus, based on the vegetation pattern prior to 1930, the water table must have been high and relatively stable throughout the entire Bog. The widespread occurrence of small natural ponds further supports this conclusion. An important implication of the historic drainage pattern, especially the lack of well-defined water courses on the Bog surface and absence of a well-marked lagg along the southern margin, is that the Bog likely did not shed water quickly in large quantities. Overall, the Bog consisted of four drainage zones:
1. A large north-western zone which flowed out through Crescent Slough; 2. A moderate sized southern zone consisting of several weakly developed streams which
flowed to Boundary Bay; 3. A large south-eastern zone which also took substantial volumes of water from Panorama
Ridge and drained southward via Big Slough; and 4. A small north-eastern zone (inferred from incomplete 1930 aerial photographs and
topographic maps) that carried some water from Panorama Ridge and drained a small portion of the north-east Bog directly to the Fraser River.
The Bog had a well-developed central plateau, rand (relatively sharply rising marginal zone), and a lagg (along two thirds of the margin). The main water dome likely occupied a large zone in the centre of the Bog. At its highest, it probably stood as much as 5.5 m above sea level (inferred from Mapping and Charting Establishment 1970; Surveys and Mapping Branch 1970). A second partial dome of water stood about 5.5 m high near the east-central margin of the Bog.
4.2.5.3 Modern Surface Hydrologic Patterns
The hydrologic pattern of the Bog in 1999 resembles historic conditions in a general way, but there are major differences in the distribution of structural components, drainage and water storage. Figure 4.11 summarizes features of the modern hydrology of the Burns Bog area. One major change is the relationship of the Bog to its surrounding landscape features such as the Fraser River. Today, dykes, large drainage ditches, and a railroad built on sand fill separate the Bog from the Fraser River (Piteau Associates 1994; Helbert and Balfour 2000). No major flooding occurs onto the Bog; rather, river water reaches the Bog via the ditches, which are controlled by pumps, flapgates, and floodboxes (Table 4.2; Table 4.3) (Anonymous 1999; Helbert and Balfour 2000). The contact with the lowlands to the west remains similar to the past, but ditches have replaced

58
natural drainage features. Ditches also have changed the relationship of the southern margin of the Bog to adjacent lowlands, but in general, the setting remains similar to the historic condition. The major difference is the construction of an artificial upland through the development of the City of Vancouver landfill. The eastern margin has undergone major changes with highway and ditch construction (Piteau Associates 1994). The Hydrology remains under tidal influence as in the past, which may extend hundreds of metres into the Bog (Helbert and Balfour 2000). Piteau Associates (1994) measured tide-related pressure changes in the underlying sediments. Water backs up some of the ditches along the northern portion of the Bog when flapgates are closed by the incoming tide (Helbert and Balfour 2000).

59
Table 4.2 Discharge structures controlling flow to and from the Fraser River (Helbert and Balfour 2000).
number name location structure drainage area
1 Green Slough L-312
Mouth of Crescent Slough south, at River Road and Admiral Blvd. in Ladner
Pump station and floodbox
Crescent Slough south, North-east Ladner, South-west corner of Burns Bog
2 Vasey Vasey Road at River Road north of east entrance to George Massey Tunnel
Floodbox Agricultural land west of the Bog.
3 Mitchell North end of Deas Slough, south of Deas Island access road
Floodbox Crescent Sough North: Harris Ditch, North-west Burns Bog, cranberry farm detention ponds, 76th St. Ditch.
4 McDonald L-313
River Road at 62B St.; near west end of Tilbury Island
Pump station and floodbox
Local industrial area surface drainage.
5 Tilbury l-314 River Road and 80th St.
Pump station with outfall and flapgate
Local industrial area surface drainage.
6 80th St. River Road and 80th St.
Floodbox (open during low tide)
Burns Bog Ditch, overflow from cranberry farm detention pond and north-west Bog area, 80th St. Ditch.
7 Alexander River Road at Alexander Road
Outfall with flapgate
Burns Bog north, Burns Bog Ditch to Alexander Street ditch.
8 Gravel Ridge l-318
River Road 1200m west of Alex Fraser Bridge
Pump station and floodbox
Burns Bog Ditch, north-east Bog, River Road
9 Silda River Road immediately west of Alex Fraser Bridge
Floodbox Local surface runoff, Nordel Way, possibly minor north-east Bog.
10 Interceptor (River Rd. Floodbox Tidal Gates)
River Road immediately east of Alex Fraser bridge
Floodbox North-east Interceptor Canal, Cougar (Canyon) Creek and other runoff from west Newton uplands.

60
Table 4.3 Discharge structures controlling flow into Boundary Bay (Helbert and Balfour 2000).
number namea location structure drainage area
1 Airport L-303 Boundary Bay Airport Pump station Boundary Bay Airport
2 Beharrel L-302
Between 88th and 96th Streets
Pump station Beharrel Ditch and local agricultural land.
3 Oliver L-301 Pump station and floodbox
South-east Bog, Lorne Ditch, McKee Ditch, Watershed Ditch and south Newton uplands, Robertson Slough, Weaver Slough, South McKee Connector Ditch, Center Slough, Charlton Ditch, 104th St. Ditch, 112th St. Ditch, Big Slough and Oliver Slough.
aDischarge structure names are taken from the Delta Drainage Map (Anonymous 1999).
Drainage Zones Modern surface drainage exhibits a more or less radial pattern from a high point in the west-central portion (dome) of the Bog (Figure 4.11) (Helbert and Balfour 2000). Field observations in December (DeMill 1999a) and in February 2000 (EAO 2000) revealed a limited westward flow from the elevated area east of Highway 91 in addition to local ditch drainage. M.A. Whelen and Associates Ltd. (1999) show a similar flow direction. Peripheral and internal ditches carry water directly to major, largely artificial, external drainage systems. Defining watersheds or catchments, with precision, within the study area is problematic. The gradients are so low that a slump or beaver dam within a ditch can change the direction of flow (Helbert and Balfour 2000). Sphagnum growth in old ditches may have the same effect. Furthermore, water is apparently pumped from the Bog for use in cranberry fields, thus temporarily moving water across a drainage divide (Piteau Associates 1994; Helbert and Balfour 2000). Interpreting catchment boundaries in the north part of the Bog is further complicated because there appear to be two exit points to the Fraser River from one single catchment (Anonymous 1999; Helbert and Balfour 2000). New drainage works in the north-west portion of the Bog have also altered drainage patterns.

61
To account for these uncertainties, the concept of drainage zones is applied to the description of patterns within the study area. A drainage zone is an area that mostly drains through a particular exit, but whose boundaries, and hence surface area and characteristics, may vary over the short term or be undergoing permanent change. Helbert and Balfour (2000) call these "drainage catchments" but recognize that the boundaries are not well defined. Six drainage zones are recognized today (Table 4.4) (Figure 4.11). Five zones (zones F1-F5) drain northward to the Fraser River and one (zone B1) drains southward to Boundary Bay. Today, the proportion of water discharging to the Fraser River is greater than in the 1930s.
Table 4.4 Comparison of contemporary runoff fluxes from drainage zonesa (adapted from Helbert and Balfour 2000).
pond ditch total annual average annual drainage zones area areac area runoff runoff flux
(%)b (%)b (km2) (m3/yr) (l/s1/km2)
Fraser River
F1 8.6% 0.5% 13.9 7.88 x 10⁶ 17.9
F2 0.0% 1.4% 1.2 1.34 x 10⁶ 34.8
F3 2.8% 3.3% 1.8 1.29 x 10⁶ 23.0
F4 13.7% 0.8% 5.8 3.08 x 10⁶ 16.7
F5d 0.0% 1.8% 2.2 9.97 x 10⁵ 14.6
Total for Fraser River
8.2% 0.9% 24.9 1.46 x 10⁷ 18.6
Boundary Bay
B1 0.5% 1.1% 9.3 2.94 x 10⁶ 10.1
Total for Bog 6.1% 1.0% 34.2 1.75 x 10⁷ 16.3 a Includes all of present extent of relatively undisturbed bog and excludes most developed areas. b Pond and ditch areas expressed as a percentage of total area of drainage zone. c Area of ditches estimated from linear length multiplied by an average width of 3.0 m. d F5 does not include the City of Vancouver landfill area of 226.5 ha.

62
The largest drainage zone, F1, covers about 13.9 km2 (Figure 4.11) and collects water from much of the north, central and eastern parts of the Bog (Figure 4.11) (Helbert and Balfour 2000). Overall, flow is northward, with major eastward and westward components according to location within the drainage zone (Figure 4.11). Water drains from extensive peat workings within the zone. Helbert and Balfour (2000) include the east side of the water mound in this zone, but the new ditches dug in 1999 have captured part of this drainage and likely added it to zones F3 and F4 to the west. In February 2000, strong westward flow was observed in the new east-west ditch just north of the City of Vancouver landfill (Table 4.5). Also in February 2000, water from the elevated zone east of Highway 91 was observed to enter drainage zone F1 through culverts under the highway. Overflow from the Northeast Interceptor Canal may also flow westward across the peatlands east of the highway and possibly pass through culverts into zone F1 (M.A. Whelen and Associates Ltd. 1999). This pattern reflects the natural westward flow direction before the building of the railroad and interceptor ditches at the base of Panorama Ridge (Piteau Associates 1994). The Burns Bog Ditch receives most of the zone’s water and delivers it to a north-south ditch (96th Street) which discharges into the Fraser River at the Gravel Ridge floodbox and pump station (Table 4.2). Whether some discharge from the zone goes northward to the River Road ditch, then to the Gravel Ridge floodbox during intervals of overflow from the west end of the Burns Bog Ditch (Anonymous 1999), is not clear. Zone F1 discharges approximately 7.9x10⁶ m3 of water annually. It includes large areas of permanent ponds (9%) and extensive temporary ponds that occupy previous peat workings (Table 4.4).

63
Figure 4.11 Modern hydrology of the Burns Bog area.

64

64
Table 4.5 Water flow observations in Burns Bog, February 8, 2000 (EAO 2000). Numbers in brackets refer to EAO observation stations. n = no measurement made.
location/ site direction velocitya
(m/s) cross-sectional
area (m2) discharge
(l/s)
Beyond end of 80th St. extension (1) W 0.039 4.40 171.6 Beyond end of 80th St. extension (2) north-south ditch
S 0.008 1.29 10.32
Beyond end of 80th St. extension (3) W 0.038 4.40 168.3 Beyond end of 80th St. extension (4) N 0.016 3.72 59.52 End of 80th St. extension (5) N 0.039 2.00 78.0 End of 80th St. extension (6) east-west ditch
W n n n
End of 80th St. extension (7a) east-west ditch
W n n n
End of 80th St. extension (7b) south-north ditch
N n n n
80th St. extension, flow through road (8) W n n n 80th St. extension (9) N 0.032 0.99 31.6 80th St. extension (10) N n n n 80th St. extension, near shooting range (11)
N 0.193 0.53 10.35
80th St. extension, south of caretaker’s place (12)
W, N n n n
80th St. extension, near caretaker’s place (13)
E, N n n n
96 St. Ditch (14) N n n n Burns Bog Ditch, at weir (15) E n n n Burns Bog Ditch, at weir (16) E n n n Ditch from Bog N n n n Burns Bog Ditch, at weir (17) E n n n Burns Bog Ditch, at weir (18) n n n n Highway 91 (26) N n n n Highway 91 (27) W n n n At gate along highway (28) W n n n Along dirt road, 450 m west of Highway 91 (29)
W stagnant
n n n
a Flow correction coefficient = 0.85

65
Drainage zone F2 includes the north-east part of the Bog east of Highway 91. The Northeast Interceptor Canal is the dominant feature (Figure 4.11) (Anonymous 1999). The Canal collects upland water from Cougar (Canyon), and Blake Creeks and the slope of Panorama Ridge. It presumably receives some water from the peatlands to the west at normal flow. The extent of the drainage zone to the west of the canal is unclear because water from these areas between Highway 91 and Panorama Ridge also flows westward down slope and under Highway 91 during heavy rain in the winter (Table 4.5) (M.A. Whelen and Associates Ltd. 1999; DeMill 1999a). Zone F2 discharges to the Fraser River through the Interceptor Canal floodbox east of the Alex Fraser Bridge (Table 4.2). Zone F2 is the smallest of all drainage zones and, according to Helbert and Balfour (2000) discharges about 1.3x10⁶ m3/yr (Table 4.4). There are no ponds in the zone. Zone F3 encompasses the north-west portion of the study area (Figure 4.11). Since the 80th Street ditch was extended southward, the extent of the zone and its relationship to zones F1 to the west and F4 to the south have changed. Before the ditch was extended, zone F3 covered about 1.8 km2. It drained old peat workings and the relatively natural areas east of 80th Street as well as cranberry fields and other disturbed lands west of 80th Street (Helbert and Balfour 2000). Most of the water exited to the Fraser River through the 80th Street floodbox (Table 4.2). Some water may have at times flowed westward to the Crescent Slough drainage system. Like zone F1, zone F3 contains a large area of ponds (Table 4.4). Since the 80th Street ditch was extended and ditches were excavated to the east of it, zone F3 captures water from the west side of the water mound. At times (e.g., November 1999), it also collects some water that flows from the west side of the 80th Street extension, well south of the old peat processing plant (Table 4.5). Consequently, the F3 drainage zone is much greater than it was in the spring of 1999. Flow directions and rates observed in February 2000 (EAO 2000), suggest that zone F3 now collects a large volume of the water from the western and eastern portion of the water mound, extending the drainage zone boundary nearly to the southern limit of the Bog today. Not all of the flow in the new ditches is directed northward. Water still flows radially from the water mound across the dominant flow directions of the new ditches. For example, water flows southward in a small side ditch while flowing westward in the main ditch just north of the City of Vancouver landfill (compare station 1 and 3 to station 2 in Table 4. 5). Water also moves westward in several places through the north-south hog-fuel road along the 80th Street ditch extension (compare station 9 to station 5 in Table 4.5). North of a large hog-fuel landing, which extends eastward from the new hog-fuel road, there is strong northward flow into the 80th Street ditch and out of the Bog. During medium to low water in summer, most of the water in this zone likely flows northward. At high water levels, it seems to also flow radially from the height of land either into the porous acrotelm or through the filled road base onto the surface to the west of the new road base and then into the acrotelm. Zone F4 encompasses the western part of the study area and drains to the north segment of Crescent Slough and from there to the Fraser River via the Macdonald floodbox and pump station and via the Mitchell floodbox (Figure 4.11 and Table 4.2). Before ditch construction in 1999, zone F4 covered about 5.8 km2 and discharged 3.6x10⁶ m3/yr of water according to

66
Helbert and Balfour (2000). It included the largest proportion of pond area of any of the drainage zones. The current extent of zone F4 is much less than it was before the expansion of the 80th Street ditch complex and preparation for new cranberry fields. When the water table is high, zone F4 collects water from east of the hog-fuel road. However, when the water level is low, much of the area once in zone F4 likely now drains as part of zone F3. Zone F5 encompasses the remaining south-west portions of the bog ecosystem complex (Figure 4.11). It also apparently surrounds the City of Vancouver landfill, whose waters are pumped into the sewage treatment system (Helbert and Balfour 2000). Zone F5 includes a large expanse of relatively undisturbed bog vegetation adjacent to Crescent Slough. Water from the zone is collected by peripheral ditches and the ditch under the BC Hydro power line along the 72nd Street right-of-way and carried to Crescent Slough from where it is discharged via the Green Slough pump station and floodbox to the river (Table 4.2). Within the Bog, the drainage zone encompasses about 2.2 km2 and discharges about 1.2x10⁶ m3/yr of water (Helbert and Balfour 2000). Zone F5 is now effectively smaller because some of the drainage is carried northward in the new ditches into zone F3 (Table 4.5). Zone B1, the only drainage zone that discharges to Boundary Bay, includes the southern and south-eastern parts of the Bog almost as far north as 72nd Avenue (Figure 4.11). The zone drains much of the undisturbed portion of the Bog, mostly by lateral flow to peripheral ditches. Few well-defined ditches enter the Bog in this zone except along the Highway 91 corridor. The zone covers about 9.3 km2 and is the second largest of the drainage zones. It discharges about 3.6x10⁶ m3/yr of water. Water from the zone flows mostly southward and eastward through agricultural ditches to Big Slough where it is discharged to Boundary Bay through the Oliver Pump Station and floodgate (Table 4.3) (Helbert and Balfour 2000). Cranberry fields are a recent hydrologic feature of the Bog. Water is used for harvesting and frost protection. Most of the water is apparently drawn from outside the Bog, but some may also be drawn from the Bog (Helbert and Balfour 2000).
Ponds The surface of the Bog contains numerous permanent and ephemeral water bodies that resulted from peat mining. Permanent ponds vary from a few metres across to a large body of water about 200x600 m in the middle of the Bog (Figure 4.11). A large cluster of medium-sized and relatively deep ponds covers an area of 800x600 m the south-west portion of the Bog. Another large cluster of smaller, but also relatively deep, ponds occurs in the north-west sector (Figure 4.11). A large part of the north-east Bog is covered by extensive shallow bodies of water that occupy vacuum harvested sites. In winter, the water is 20-40 cm deep, but late in the summer and early fall these areas dry out. Almost none of the small natural ponds visible on the 1930 aerial photographs exist today, and most had disappeared by the mid 1970s (Hebda 1977). Ponds cover about 210 ha in the Bog (Helbert and Balfour 2000). Beavers and beaver dams are evident in the Bog. Their overall hydrologic role has not been assessed but their dams are expected to have an impact. Specifically, the dams raise the water table up-stream of each structure. Beaver dams were noted during field visits in fall of 1999 in

67
the outside perimeter ditch at the north-west corner of the City of Vancouver landfill and in the Burns Bog Ditch. During field work in November 1999, Z. Gedalof and K. Brown (pers. comm.) noted widespread beaver activity in the south-east portion of the Bog.
Ditches None of the natural drainage channels that once occurred in the Bog persist (Helbert and Balfour 2000). Instead, several ditches reach in to the centre from many directions and drain Burns Bog (Figure 4.10a,b and Figure 4.11). The pattern consists of a few major channels fed by numerous small ditches (Helbert and Balfour 2000). The hydrological function of each depends on in-growth by Sphagnum and other plants and by slumping from the sides, factors which in large part are related to time since the ditches were last maintained. Helbert and Balfour (2000) estimate that 110 km of ditches occur in Burns Bog. The most important system of ditches was renovated and expanded in 1999 and drains the north-west portion of the Bog (Figure 4.10a and Figure 4.11). It consists of a 3-4 m-wide main channel excavated to a depth of 1-1.5 m below the surface which extends southward along 80th Street and then, with several breaks, along a newly-constructed roadbase to within 0.3 km of the southern boundary of the Bog. Side ditches are up to 3 m wide and are about 0.5 m deep. More than 4 km of ditches collect water from the east, draining the west slope of the Bog's water mound. During the winter of 1999/2000, the main ditch contained a great deal of water, but many of the side ditches were empty or contained water only 0.1-0.2 m deep (EAO 2000). The highest portion of the water mound is entirely surrounded by the new ditch system. About 15 km of long ditches collect water from a large area in the north-east part of the Bog (Figure 4.11). These were constructed as part of the peat operations of various types over the past 50 years (Appendix H). Today the ditches are about 1-1.5 m wide and less than 1 m deep. Water from this system of ditches is delivered northward to the Burns Bog Ditch. Reverse flow can occur in the lower parts of this ditch complex if the gate at the Fraser River is shut at high tide and water backs up in the ditch. Water from the Fraser River has entered the Bog at least once and flooded the lowest elevations of the peat surface (D. DeMill, pers. comm., November 1999). Several small and shallow ditches deliver water from the relatively undisturbed bog to a major drainage corridor associated with the BC Hydro power line and BC gas line inside the western margin of the Bog. The outside perimeter ditch surrounding the City of Vancouver landfill drains into this system as well (Helbert and Balfour 2000). Shallow ephemeral watercourses form along trails and survey lines where peat has been eroded and compressed mainly by foot traffic. At times of high water, especially during the winter, water collects in the low areas and eventually flows from the height of land outward to the margins. The water is usually shallow, but flows along a swath several metres wide.
Comparison of 1999 to 1930 internal drainage Figure 4.10a,b and Table 4.6 compare the estimated influence of water courses draining the Bog in 1999 to conditions in 1930. Under the relatively undisturbed conditions of the 1930s, about

68
43 km of channels entered the Bog or flowed at its perimeter (Figure 4.10a,b). The estimated drainage effect of ditches on the water table varies widely from a few metres to more than 150 m (Boelter 1972; Hobbs 1986; Bradof 1992). The ecological effect in Burns Bog is greater than 100 m (Section 5.2.4). Small changes (10 cm) in the water table are felt to have major effects on woody plant growth (Sims et al. 2000a). Assuming each ditch had an influence of 100 m on either side (see Figure 2.4), the area under direct ditch drainage was 682 ha (only the bog side of marginal ditches is included in this area). Today, total ditch length is at least 58 km for the ecological Bog (67 km in the hydrological Bog) and the drainage area is approximately 1,082 ha. Modern ditches are deeper and many are much wider than natural channels would have been. Prior to disturbance, water courses impacted about 16% of the entire pre-disturbance Bog area and only 14% of the Bog area that currently remains. (Table 4.5). Today, ditches impact at least 38% of the much smaller remaining Bog. Balfour and Helbert (2000) estimate the channel length to be 41 km in 1930 and 110 km today. Accordingly, the channel density has increased 5.5 times compared to the 1930 condition. No matter what method is used to examine the change in the role of ditches, the result is the same. The drainage capacity today is much greater than it was before major disturbance of Burns Bog.

69
Table 4.6 Lengths, areas and relative coverage of ditches and estimated drainage areas in Burns Bog.
lengths and areas 1 m ditches 50 m drainage 100 m drainage
bog type ditch typea length (m) area (m2) area (ha) area (m2) area (ha) area (m2) area (ha)
Historic Condition
n/a Full 27,721 133,190 13 2,907,363 291 5,560,123 556
n/a Half 15,657 15,642 2 750,932 75 1,263,271 126
Sum 43,.378 148,832 15 3,658,295 366 6,823,394 682 Current Condition
Ecological Full 36,166 72,154 7 5,285,942 529 8,045,870 805
Ecological Half 21,669 27,270 2 1,389,861 139 2,778,476 278
Sum 57,836 99,424 9 6,675,803 668 10,824,346 1,082
Hydrological Full 43,091 97,193 10 6,468,469 647 10,219,822 1,022
Hydrological Half 24,126 18,556 2 934,603 93 1,836,202 184
Sum 67,217 115,748 12 7,403,072 740 12,056,024 1,206
relative coverage
bog type drainage density (m/m2) 1 m ditches as % of area 50 m buffer as % of area 100 m buffer as % of area
Total area 0.0010640 0.36% 8.97% 16.73%
Ecological 0.0007120 0.36% 7.07% 13.93%
Historic Condition
Hydrological 0.000674 0.36% 6.76% 13.49%
Ecological 0.002051 0.35% 23.67% 38.38% Current Condition
Hydrological 0.002211 0.38% 24.35% 39.65% a A half ditch occurs at the Bog margin and only the drainage effect on the Bog side of the ditch is included in drainage estimates.

70
4.2.5.4 Hydrogeology and Groundwater
The hydrologic properties of Burns Bog are influenced by the character of peat, as is typical of raised bogs, and by the top-set mineral deposits of the Fraser River delta. The acrotelm peat zone is highly porous and permeable. It has hydraulic conductivities of 10-3-10-4 m/s (Helbert and Balfour 2000). Hydraulic conductivity typically varies in the acrotelm of bogs from very high values at the surface to values approaching those of the catotelm at the base. The catotelm consists of much less permeable peat than in the acrotelm. Hydraulic conductivities within this layer in Burns Bog are on average 5x10⁻⁷ m/s, 1,000 to 10,000 times less than in the acrotelm (Piteau Associates 1994; MacAlister 1997; Helbert and Balfour 2000). Like the catotelm, the underlying peaty silt has low hydraulic conductivity. Piteau Associates (1983) reported vertical hydraulic conductivity in the range of 10-9 m/s. The peaty silt and catotelm nearly isolate the surface acrotelm waters from the deltaic sand beneath the Bog. The medium-grained, relatively porous parts of the sand layer (Figure 4.1) have a relatively high hydraulic conductivity of 10-4-10-5 m/s (Piteau Associates 1994), comparable to or slightly less than that of the acrotelm. The sand layer acts as an aquifer, collecting and transmitting water (Helbert and Balfour 2000). Overall, the Bog acts as an area of groundwater recharge. This means that the Bog receives water and delivers a very small proportion of it to the groundwater table. Small amounts of water move downward through the underlying catotelm and silts, and eventually reach the sand aquifer (Piteau Associates 1994). In the aquifer, the water generally moves westward under the Bog and down-gradient either northward or southward from the east-west elevational axis of the Bog. Groundwater apparently used to discharge out of the sand aquifer on the southern and western margins of the Bog (Piteau Associates 1994). There is also a discharge zone in the eastern part of the Bog where water from the foot of Panorama Ridge comes to the surface (Helbert and Balfour 2000).
Bog Water Table Water table characteristics and behaviour in Burns Bog are understood only in part because of lack of long-term (interannual) and short-term (intra-annual) data (Piteau Associates 1994; Helbert and Balfour 2000) and an inadequate number of sample sites. Generally, the water table is closer to the surface in the middle of the Bog than at the edges, especially during the summer. For example, late summer measurements at a couple of sites near the top of the water mound had water within 50 cm of the surface (Figure 4.11 – value calculated from the difference between surface elevation and water table elevation). Progressing outward from the mound’s centre, water levels were 60-75 cm below the surface. In a relatively narrow zone near the periphery, the water table is as low as 150 cm below the surface in the summer (Figure 4.11 - value calculated from the difference between the surface elevation and water table elevation). Water table measurements taken in July 1997, show this feature clearly (MacAlister 1997, Table 2). Much of the change in water table occurs within the first kilometre from the Bog margin.

71
Annual variation in the water table is well demonstrated by a ten month set of readings for a series of dip wells in the south-east portion of the Bog (Figure 4.12). Summer and early fall water table positions are low at each site along the transect, declining gradually between July and September. The water table rises slowly with the fall rains and with corresponding reduced evapotranspiration. In the fall of 1998, an exceptionally rainy week caused the water table to rise rapidly to near maximum values. Following this event, regular and heavy rains maintained the water table at a high point near its maximum position until the end of March 1999, at which time the water table began its slow decline. The greatest change in water table took place at a site near the Bog margin (82 cm at TH14 in Figure 4.12).
Figure 4.12 Water table variation and precipitation, June 1998 to April 1999, in south-east Burns Bog (MacAlister 2000). Stations TH13 to BB2 are located in order along a transect from the edge of the peat mass toward the centre of the Bog. The transect spans approximately 2 km. Station BB7 is located in undisturbed peat-forming vegetation in the western part of the Bog.
0
20
40
60
80
100
120
140
160
-1.2
-1
-0.8
-0.6
-0.4
-0.2
0
0.2
0.4
P mm BB2TH13TH14TH15TH16BB1BB2BB7
bog surface
72
This annual water table variation is consistent with that observed in other bogs in the region. Golinski (1999) shows similar overall trends, in bogs on the east coast of Vancouver Island, of gradually decreasing summer and early fall water tables followed by rapid winter recovery. Her observations also reveal that annual water table change in the forested Bog edge is usually much greater than in the typical wet bog communities. Similar annual variation is known for European raised bogs (Eggelsmann et al. 1993). As has been observed in other bogs (Clymo 1991; Valgma 1998) the water table also appears to vary markedly with heavy rain events in some portions of the Bog (Figure 4.12). Piteau Associates (1994) observed sudden water level increases in response to a heavy rain in February 1983. The water level was observed to decline almost as quickly. The relatively quick response of the water table at these monitoring sites may occur because they are located near ditches. At sites distant from ditches, there is not as rapid a drop in the water table after it rises (Figure 4.12). Deep pools, associated with excavations in the western and central portions of the Bog, are full year round. The shallow pools produced by vacuum peat harvesting are not. Many of these latter pools accumulate water 30 cm deep or more by late November. There may still be water in them in August (Figure 4.11), but by mid September 1999, much of the surface was dry with the water table 5 cm below the surface (EAO observations, October 1999). The position of the water table in the Bog has changed markedly since 1930. By inferring the summer low point of the water table from the vegetation pattern evident on the 1930 aerial photographs, it was possible to delineate the historic extent of the water table. Figure 4.13a,b depicts the extent of two water table depths, less than 70 cm and less than 50 cm. By comparing the areas underlain by different water table depths (Figure 4.13a,b), it is clear that most of the Bog remaining today had a water table less than 50 cm in 1930. Now, a large part of it is in the 50-70 cm zone. Thus, the water table today is, on average, significantly lower than it was in 1930.


73
Figure 4.13a Comparison of the extent of area with water-table position above 70 cm.

74
Figure 4.13b Comparison of the extent of area with water-table position above 50 cm.

75
4.2.5.5 Water Storage
Water storage capacity is a critical characteristic of peat bogs and a key parameter in long-term sustainability (Sims et al. 2000a). It is especially important in the climates with pronounced summer drought and during drought years. A summer water table below about 30-40 cm for a long interval jeopardizes the peat-forming community and favours plant species which do not form peat and may increase the rate of water table decline over the summer (Dierssen and Dierssen 1984; Damman and French 1987; Verry 1997). Modelling changes in water storage permits an assessment of the risk to a peat body from serious disturbance by drought or human activity (Ingram 1992). Long-term changes in the volume and partitioning of water storage into different storage features, such as ditches or peat excavations, have profound implications to the survival of a bog. Water is stored in a bog in two fundamentally different ways: as static storage and as dynamic storage (Table 4.7). Static storage occurs in the catotelm. It changes little over the short term, unless catotelm peat is removed directly. In the long term, healthy raised bog ecosystems add catotelm storage at a rate of about 0.5 mm/yr (Tallis 1983; Egglesmann et al. 1993). In degrading bogs, however, catotelm storage is lost over the intermediate to long term (decades to centuries) directly as a result of changes in short-term or dynamic storage. Dynamic storage changes monthly and even daily. It consists of three major components: the acrotelm, pools, and ditches. Each of these components has different storage properties. Of the three, the acrotelm stores the largest volume of water throughout the year. There are two general types of acrotelm in a disturbed bog: functioning or true acrotelm and non-functioning acrotelm. These two types also have different storage properties (Table 4.7). True acrotelm occurs in the healthy or growing portion of the bog in association with the Sphagnum-dominated peat-forming community. A normal acrotelm zone is reported to be about 10-35 cm thick (Clymo 1983), though some believe it tot be 9-14 cm thick (Warner 1996). Throughout the year, the acrotelm storage changes as much as 500 mm at any point. For Burns Bog, this amount is nearly 50% of the annual precipitation of 1,100 mm. In an undisturbed raised bog, the acrotelm is filled at the time of maximum precipitation and minimum evapotranspiration, and perhaps even overfilled if it swells though mire breathing (see Section 2.1). The acrotelm loses water in various ways and at various rates throughout the year (Carter 1986). In the summer, storage is largely lost to evapotranspiration. After heavy precipitation, water is lost though lateral flow to the bog margin or to ditches.

76
Table 4.7 Types of water storage, their characteristics and comparison of pre-disturbance to modern condition.
storage type volume relative to other storage types
discharge
modern condition
pre-disturbance condition
Static
Catotelm Very large Very slow Large volume but 20-40% less than before disturbance; very slow discharge
Very large volume; very slow discharge
Deep Pools Very small Very slow Volume small, has increased markedly because of excavations; very slow discharge
Very small volume; very slow discharge
Dynamic
Acrotelm Large Slow Medium volume Large volume
- active Varies throughout the year
Slow to intermediate
Small to medium volume, lost to peat mining; intermediate discharge
Large, slow to intermediate discharge
- non-active Varies throughout the year
Intermediate Medium-large volume, increased because of drainage; intermediate to rapid discharge
Small, intermediate discharge
Shallow pools, upper part of deep pools
Medium Slow to intermediate
Medium-large area in very large pools
Medium area in many small pools
Ditches and water courses
Very small Intermediate to rapid, depending on condition
Small volume; very rapid discharge
Very small volume; rapid to intermediate discharge

77
Non-functional acrotelm occurs widely in disturbed bogs and in Burns Bog. It consists of the porous and decomposing surface layer where peat-forming vegetation no longer grows. Essentially, it functions as a porous peaty soil sitting upon remnant catotelm. This soil-like zone is usually greater than 50 cm and as much as 150 cm thick. Piteau Associates (1994) noted such thick "acrotelm" zones in the Bog. It no longer has the water-regulating and storage properties of the original acrotelm. Though it has large storage volume, it readily releases stored water to marginal drainage and to the ditches that usually occur in it. Since trees and shrubs usually replace Sphagnum cover, it is not protected from evaporative water losses by the "dry carpet" effect of Sphagnum (Bavina 1967; Belotserkovskaya et al. 1969; Eggelsmann et al. 1993; van Breemen 1995). Rather, the woody plants extract moisture from deeper levels in the peat. For example, Takagi et al. (1999) report a 23% greater loss of moisture in the summer from portions of a peatland covered by vascular plants compared to portions of the same peatland covered by Sphagnum. Pools store water in both a dynamic and static manner. Deep pools have a deep static portion that occurs at and below the level of the catotelm. Water below this level cannot readily drain. It is lost only if evaporation in the summer lowers the water surface below the catotelm surface. Water stored in a deep pool above the catotelm is subject to loss through evaporation and lateral flow through the acrotelm. Shallow pools form upon the bog surface and sit upon, and adjacent to the acrotelm but above the catotelm. These pools provide dynamic storage. In the wet season, they fill up to the water level in the surrounding acrotelm and provide detention (holding) storage above the water table. When water is lost from the acrotelm zone by lateral seepage and evapotranspiration, the shallow pool water recharges the acrotelm adjacent to it and the water mound (Beets 1992) until the pool itself dries out. Sphagnum at the pool edge can draw upon the seasonally stored water through capillary forces as well (Clymo and Hayward 1982). Ditches provide detention storage for only a matter of days as Piteau Associates (1994) demonstrated. The volume they hold in the Bog is relatively small, about 5x10⁴ m3 (Table 4.6, Section 4.2.5.3). Ditches discharge water quickly; hence, they provide no storage for use by the peat-forming communities. Since the 1930s, major human-induced changes have occurred in both static and dynamic storage of Burns Bog. Understanding these changes provides valuable insight into what the bog ecosystem complex needs to survive in the long term. The modern storage volume of the Bog can be calculated by estimating the extent of the remaining Bog and knowing the depth of peat within this area. As outlined in Section 3.7.3, the Bog's ecologically available area is about 2,800 ha. Peat depth was calculated by assuming that peat was, on average, deposited on a flat surface with an elevation of 1.0 m above sea level. This elevation is more or less the level of the regional mineral surface. Any peat below this level is at the regional groundwater table and would not participate in the water mound and in storage (Figure 4.14). Using GIS, the area enclosed by each 0.5 m elevational contour on the Bog was calculated (Table 4.8). Peat volume was then determined by multiplying the area enclosed by the contour by the thickness of peat above the 1.0 m elevation. The mid-point between the contour lines in question was chosen for peat depth calculations, assuming that elevations between the contours were evenly distributed. The area occupied by Highway 91 was excluded

78
from volume calculations. Using this method, the volume of peat currently available for storage is approximately 58x106 m3. This volume of peat contains about 90% water (Boelter 1969; Ivanov 1981; Hobbs 1986; Eggelsmann et al. 1993); hence, it holds about 52x106 m3 of water.
Figure 4.14 Method of calculating volume change.
Table 4.8 Area enclosed by 0.5 m contours in Burns Bog.
contour interval (m) area (ha)
5.5-6.0 35
5.0-5.5 38
4.5-5.0 25
4.0-4.5 175
3.5-4.0 405
3.0-3.5 1,010
2.5-3.0 440
2.0-2.5 450
1.5-2.0 250 The historic volume of peat and water within the today’s remaining Bog were estimated using elevational profiles constructed from topographic maps of the Bog before much peat was
Notes:
1. Difference between original surface and modern surface in the first 200 m segment is 1 m. 2. Average loss over the profile = (1+1+1+0.75+0.75+0.75+0.5)/7 = 0.75 m. 3. Calculate the average loss for all profiles and multiply by the area of the Bog.
2.5
3.0
3.5
4.0
4.5
0.2 0.4 0.6 0.8 1.0 1.2 1.4 1.6
Distance (km)
He
igh
t a
bo
ve
se
a le
ve
l (m
) original bog surfacemodern bog surface
1.0 1.0 1.0 0.75 0.75 0.75 0.5

79
removed (Section 4.2.2). By superimposing historic pre-disturbance profiles on modern profiles, it was possible to determine the amount of peat lost over the Bog surface (Table 4.9a,b). The vertical loss of peat was estimated from profiles (Figure 4.4) for every 200 m segment of each profile. The peat thickness lost for each 200 m segment within each profile was determined to be the difference, in metres, between the original profile and the modern day profile (Figure 4.14) estimated to the nearest 0.25 m. The total number of metres of peat lost along each profile was divided by the total number of 200 m segments along that profile to give an average change in peat thickness (Table 4.9a,b). Two estimates were made for the purpose of comparison and verification - one using south-north profiles and one using west-east profiles.
Table 4.9a Summary of south-north cross-sectional profile changesa.
profile length (km) number of sample
segmentsb total height change (m)c
average height change or peat
thickness lost (m)
1 5.4 25 30.25 1.21
2 5.2 23 20.5 0.89
3 5.4 26 32.75 1.26
4 6.2 20 13.75 0.69
5 6.0 20 12.00 0.60
6 4.2 6 0 0
Table 4.9b Summary of west–east cross-sectional profile changesa.
profile length (km) number of sample segmentsb
total height change (m)c
average height change or peat
thickness lost (m)
1 7.2 32 44.5 1.39m
2 7.0 30 39.5 1.31m
3 7.4 30 23.75 0.79m
4 7.0 32 5.50 0.17m
5 6.6 Not within ecologically available bog a For profile locations see Figure 4.4. b Does not include segments outside of the peat mass. c Total height change is the sum of height changes of all profile sample segments.
The south-north profiles included 120 estimates yielding an overall average of 0.91 m of peat lost. Losses ranged from an average of 0.69 m in the west part of the Bog to 1.26 m in the middle of the Bog. There were 134 estimates represented in the west-east profiles, averaging

80
0.17 m of peat lost in the south to 1.39 m lost in the northern-most profile. The overall average loss for west-east profiles is 0.84 m. The lower values for the west-east estimates occur because the profiles include the unmined zone east of Highway 91, resulting in a lower overall average of peat loss. Thus, the average peat loss is estimated at 0.88 m within the present boundaries of the Bog, which is equivalent to a volume of 24.6x10⁶ m3 (0.88 mx28 km2). The pre-disturbance water volume would have been about 74.3x10⁶ m3 (90% of 82.6x10⁶ m3) of water. Thus, the loss constitutes a 30% decline in the storage volume within the modern extent of the Bog. The actual storage volume lost is much greater than this because the calculations do not include portions of the Bog alienated over the past decades. A large portion of the Bog has been irreversibly converted to other purposes such as the City of Vancouver landfill. Before disturbance, the average peat thickness was 2.95 m above an elevation of 1.0 m above sea level. For the area of about 4,800 ha reported for the 1930s by Rigg and Richardson (1938), the additional loss since then is estimated to be 59x106 m3. The total loss of storage is estimated to be 83.6x10⁶ m3 (24.6x10⁶+59.0x10⁶) or about 59% of the total volume of 141.6x10⁶ m3 of peat contained in the bog. The loss of stored water would have been approximately 90% of 83.6x10⁶ m3, or 75.2x10⁶ m3. The water storage loss may have been even greater than the preceding estimate because Osvald (1933) reported that the Bog had an area of about 100 km2 (see Section 3.7.3). This size is not consistent with the extent of the modern peat body and likely, much of the additional area was covered by shallow sedge peat and not strictly in the raised bog portion of the wetland. Estimating the original peat depth in the marginal zone is difficult. By the time the first sufficiently detailed surveys of elevation had been conducted, the Bog’s margins had long been converted to agricultural uses and a significant volume of peat may have decomposed. The preceding calculation of storage loss includes both static and dynamic volume components. The relative loss of dynamic storage, compared to static storage, can be estimated by assuming an average original peat depth of 2.95 m (see above) of which 0.50 m consisted of dynamic acrotelm storage. Considering losses from the completely converted part of the Bog, 49x106 m3, or 83% of the loss was from the catotelm, and 10x106 m3, or 17%, was from the acrotelm. In the remaining Bog, an area of about 800 ha still has a fully functioning acrotelm. Factoring this into the amount of storage lost, yields 14.6x10⁶ m3or 59% in the catotelm and 5x10⁶ m3 or 41% in the acrotelm. Combining losses in both areas and considering the original Bog volume of 141.6x10⁶ m3, about 76% of the original volume was lost from static (catotelm) storage and 24% from dynamic (acrotelm) storage. It is important to note that within the remaining Bog, assuming 800 ha of functioning acrotelm remain, 71% (2,000ha/2,800ha) of the original acrotelm surface and storage has been lost. This estimate is based on the current area of relatively undisturbed bog vegetation. Some of this has been replaced by the newly developing acrotelm in old peat workings, but the original volume has far from recovered. Though most of the loss has been from static storage, the greatest impact to the Bog has come from the changes in dynamic storage (Table 4.7). First, a large portion of the acrotelm has been destroyed so that long-term dynamic storage has declined markedly. Second, intermediate to short-term storage in non-functional acrotelm has increased because of the expansion of the

81
peripheral zone into areas that once were covered in functional acrotelm. Furthermore, the non-functional acrotelm layer is thicker than the functional acrotelm layer. Combined with these changes, the proportion of short-term ditch storage has increased markedly (Figure 4.10a,b). The excavation of deep pools has had little impact on the static storage component but may have led to the loss of acrotelm storage. Whether the volume and total area of shallow pools have changed since disturbance is hard to determine. The characteristics of the shallow pools have certainly changed though. The once widely distributed small pools have disappeared and been replaced by very large pools at the sites of vacuum and scratch mining (Section 4.2.5.3). Overall, total dynamic storage has declined sharply and shifted from the relatively slow discharge characteristic of functional acrotelm and shallow pools, to much more rapid discharge from a less extensive, thinner functional acrotelm. The net effect is a shorter residence time for water in the Bog, lower average annual water table, and reduced opportunity for peat accumulation. These changes in dynamic storage must be reversed if the Bog is to maintain its ecological integrity.
4.2.5.6 Water Balance
The water balance for Burns Bog was calculated to understand the impact of ditches on changes in water storage and water levels in the peat mass, and to develop a model to assess the impacts of drought (see Section 6.5.2). A high water table is critical to the long-term survival of peat-forming communities (Section 2.0) (Brooks and Stoneman 1997; Sims et al. 2000a). The behaviour of the water table can be understood through an analysis of the terms of the water-balance equation. Maintaining, or even increasing, the water storage is most important to sustainability (Ingram 1992; Sims et al. 2000a). In its simplest form, the water balance appears as:
Water in minus water out equals change in water stored “Water in” consists of precipitation and groundwater entering the bog. “Water out”, in a relatively undisturbed system, consists of evapotranspiration (evaporation to air and loss by plants transpiring), surface and near-surface flow out of the bog, and vertical seepage to the regional groundwater table. The “change in water stored" is simply the change in the volume of water held in the peat mass. Conceptually, the terms in the equation are straightforward, but obtaining quantitative values is a challenge, particularly in a complex hydrological and ecological setting such as Burns Bog (Helbert and Balfour 2000). Discussions during the Technical Review Meetings emphasized the importance of calculating the water balance, but also noted that some of the required estimates and assumptions are not easy to verify (Sims et al. 2000a). One way of approaching the water balance question is to establish, quantitatively, the annual contribution of each of the elements of the water-balance equation at one point or location in the bog. Basically, the exercise consists of balancing out, or budgeting, the water which is supplied at one point during the year. Point calculations can easily be converted to area and volume values by multiplying the point values (expressed in millimetres of water) times the area of the bog to which the values apply.

82
For a point in Burns Bog, the “water in” as precipitation (P) can easily be determined from climatic data. Helbert and Balfour (2000) used three nearby climatic stations and modelled the precipitation by zones over the Bog (Figure 4.7). Being a raised bog, it is assumed that other water input terms, such as the inflow (called N in water-balance equations) from groundwater, are negligible (Helbert and Balfour 2000) though this is not always the case (Glaser et al. 1997; Verry 1997). The only potential source seems to be the Newton Upland and, today, much of the water flowing from it is diverted from the Bog by the Northeast Interceptor Canal (Piteau Associates 1994; Helbert and Balfour 2000). Water losses (“water out”) are much more difficult to establish (Bauer and Mastin 1996; Sims et
al. 2000a). Normally, when studying the water balance of an upland watershed, the drainage or outflow is measured in the stream which drains the watershed. Outflow is difficult to measure for a bog which has radial discharge and other complicating factors such as tides (in the case of Burns Bog). No long-term flow measurements have been made for Burns Bog, so this component of water loss is not known (Piteau Associates 1994; Helbert and Balfour 2000). For any modelling of changes in storage, it must be known. There are theoretical models for calculating losses due to evapotranspiration. Helbert and Balfour (2000) used the Thornthwaite model in their water balance calculation for the Bog. This model generalizes losses to evaporation and transpiration using the amount of solar energy (heat) available in the atmosphere to evaporate water. The model does not take into account the different evapotranspiration properties of different vegetation types. This limitation may be a particularly thorny issue for bog water balances in cases where there are numerous trees (Heikurainen 1963; Eggelsmann 1990; Schouwenaars 1990; Göttlich et al. 1993; Sims et al. 2000a). The model does not take directly into account that trees intercept and evaporate a high proportion of moisture back into the atmosphere. Moisture losses (N) to the regional groundwater table are estimated to be 4% for Burns Bog because of the low hydraulic conductivities of catotelm peat and underlying peaty silts (Piteau Associates 1994; MacAlister 1997; Helbert and Balfour 2000). The Thornthwaite model requires knowledge of the storage capacity values for different soils. Using the Thornthwaite model (Thornthwaite and Mather 1955, 1957), Helbert and Balfour (2000) calculated monthly and annual water balances as summarized in Figure 4.15. According to these calculations, the average annual evapotranspiration ranges from 564-592 mm and there is an excess of 441-613 mm (average 530mm) from the annual precipitation that is discharged from the Bog, assuming the storage remains constant from year to year. The discharge of excess precipitation for each of the drainage zones in the Bog is summarized in Table 4.4.

83
Figure 4.15 Monthly water balance for a Triggs soil in the central portion of Burns Bog (Helbert and Balfour 2000). Zone 2 (medium precipitation) - S1 (Triggs soil)
Jan Feb Mar Apr May Jun Jul Aug Sep Oct Nov Dec YearTemperature,qC 2.5 4.5 5.9 8.6 12.0 14.8 16.8 16.8 13.9 9.7 5.7 3.5 9.6 Heat Index 0.35 0.85 1.29 2.27 3.76 5.17 6.26 6.26 4.70 2.73 1.22 0.58 35.44Potential Evapotranspiration 'PE',mm
9 17 28 48 75 96 113 104 72 44 21 11 638
Precipitation 'P', mm 150 118 101 65 53 45 33 39 64 117 154 175 1116P-PE 141 101 73 17 -22 -51 -80 -65 -8 73 133 164 478 Accumulated Potential Water Loss, mm
-22 -73 -153 -218 -226 -692
Peat/Soil Moisture Storage, mm
400 400 400 400 378 333 272 231 227 300 400 400 4141
Storage Change, mm
0 0 0 0 -22 -45 -61 -41 -4 73 100 0 0
Actual Evapotranspiration, mm
9 17 28 48 75 90 94 80 68 44 21 11 585
Peat/Soil Moisture Deficit, mm
0 0 0 0 0 6 19 24 4 0 0 0 53
Peat/Soil Moisture Surplus, mm
141 101 73 17 0 0 0 0 0 0 33 164 529
Total Runoff (surface + subsurface), mm
116 109 91 54 27 14 7 4 0 0 17 91 530
Peat/Soil Moisture Detention, mm
516 508 491 454 405 346 279 234 231 300 416 490 4670
Average Water Balance - Zone 2 Triggs (400 mm storage)
0
20
40
60
80
100
120
140
160
180
200
Jan Feb Mar Apr May Jun Jul Aug Sep Oct Nov Dec
Month
Prec
ipita
tion
or E
vapo
tran
spira
tion
(mm
)
PrecipitationPotential Evapotranspiration
Actual Evapotranspiration

84
The monthly water budget shows that this excess of moisture occurs only in the winter and spring months. According to Helbert and Balfour’s (2000) calculations, the Bog's storage capacity is filled to maximum during this interval and excess water is shed as drainage. During the summer and early fall, losses exceed supply and the water storage and the water table decline until replenished with late fall and early winter rains. In other words, the peat-forming ecosystems, which must have a high water table, live off the excess water of winter and spring. Flow measurements in ditches (Piteau Associates 1994; Helbert and Balfour 2000) suggest that discharge behaves more or less as predicted by the Thornthwaite model. However, the real value of the discharge remains unknown, particularly since the Thornthwaite model has not been adapted to natural conditions, especially bogs. Furthermore, the limited number and size of channels apparent on the 1930 aerial photograph (Figure 4.8) do not suggest the high volumes and rates of discharge implied by the results of the Thornthwaite model. Also, recent studies in the Pacific Northwest demonstrate clearly that interception plays an unexpectedly large role in the water balance of forested ecosystems (Bauer and Mastin 1996). Accordingly, a water balance was constructed with values believed to be more appropriate to bog ecosystems and regional climatic conditions. The two critical terms in the water balance that need to be verified for the Bog are evapotranspiration and interception. In assessing evapotranspiration (E) in Burns Bog, it is necessary to consider the following symbols and terms:
x E – actual evapotranspiration of a bog or other vegetation type; and x Et – potential evapotranspiration (this is the evapotranspiration from a short green crop
kept well watered to prevent water stress) (Penman 1948, 1963). Lysimeter studies of actual evapotranspiration (E) from various types of wetlands provide results that are highly variable and incongruent (see also comments of the Technical Review Panel in Sims et al. 2000a). Values depend on the instruments and techniques applied, and the type and location of the wetland. Furthermore, E has an inherent high variability. However, many researchers (Eggelsmann 1963 in Ingram 1983; Verry 1997) believe that evapotranspiration from most wetland types is near potential rates (E/Et | 1.0 r 15%) - that is, E more or less equals Et. Sphagnum-dominated bogs may transpire less than Et, whereas fens with abundant vascular plants usually transpire somewhat more than Et. In Minnesota, the discharge from black spruce (Picea mariana)-Sphagnum bogs was approximately equal to Et measured by the Thornthwaite method (Verry and Timmons 1982). As another example, the actual evapotranspiration (E) of Thoreau's Bog in Massachusetts was determined to be 70% of the total precipitation (Hemond 1980). The evapotranspiration (E) from Sphagnum-dominated bogs depends on the level of the water table. E approximately equals the potential rate (Et), or is slightly higher, when the water table is close to the surface (<2 cm) (Virta 1966). If the water table drops to 11 cm below the surface, the E of the Bog may decrease by 40%. Other data (Romanov 1968) suggest that the evapotranspiration decreases by 40-45% when the water table decreases to 30-40 cm below the surface, and by 75% when the water table decreases to 75 cm below the surface. During dry

85
summer months in Minnesota, when the water table stood at greater than 30 cm below the surface, E was about half of Et in a Sphagnum-black spruce mire (Bay 1967). These observations are in line with the findings of Belotserkovskaya et al. (1969) who found that the E of Sphagnum hummocks is 20-30% lower than evaporation from pools (which is more or less the same as potential evapotranspiration). This difference is usually attributed to the absence of efficient vertical water transport systems in Sphagnum (Hayward and Clymo 1982) that causes the upper parts of Sphagnum plants to dry out easily under the water stress. In contrast, vascular plants have efficient vascular system that allows them to "pump" and transpire water even when the water table drops considerably (Ingram 1983; Takagi et al. 1999). Other mechanisms, such as the increased albedo (light reflection) of dry Sphagnum moss, may also play a role in decreased evapotranspiration of Sphagnum surfaces during dry periods (Ingram 1983; van Breemen 1995). The actual evapotranspiration (E) of a bog, which is a combination of physical evaporation from open surfaces and transpiration from vegetation, also depends on the vegetation type. Various sources give conflicting measurements, but as a rule of thumb, E/Et | 1.1 for treeless Sphagnum bogs (Ingram 1983). Most data indicate that the E from forested or shrub bogs does not differ more than 10-15% from this figure (Eggelsmann et al. 1993). Given that the present water balance is an approximation, it is assumed that on average for the different plant communities of the Bog, E = Et (actual evapotranspiration more or less equals potential evapotranspiration). This value is estimated to be 638 mm for Burns Bog by Helbert and Balfour (2000). A relatively high value for E is supported by conclusions of the Technical Review Panel (Sims et al. 2000a). Loss of water through interception is another potential consideration in a water balance. The Thornthwaite model used by Helbert and Balfour (2000) simply includes interception in Et, the assumption being that the same energy is used to evaporate the water from the trees or from the ground. Recent studies from the Pacific Northwest demonstrate that this assumption does not hold (Bauer and Mastin 1996). Consequently interception must be factored directly into the “water out” part of the water balance. Interception (represented by "I" in water-balance equations) is a complex and poorly studied process in the general hydrologic cycle (Bauer and Mastin 1996; Sims et al. 2000a). Even the definitions vary substantially. It can be defined as the trapping, storage and disposition of precipitation on the surface of vegetation (Zinke 1967). Zinke (1967) concludes that the intercepted water does not reach the ground and, thus, does not contribute to the water mound of a bog. Therefore, Zinke (1967) does not include interception in evapotranspiration. On the other hand, Ingram (1983) defines interception loss as the evaporation of water from plant surfaces which have been wetted by rain, dew or fog (he does not include snow interception). Thus, he decisively places interception as one of the processes that comprise evapotranspiration (as in the Thornthwaite approach).

86
There are further difficulties associated with not considering interception in addition to evapotranspiration. During the mild rainy winters experienced in the north-west coast of North America, wind adds extra energy for evaporation (Bauer and Mastin 1996). The same twig and needle surfaces are wetted and dried several times, intercepting and evaporating a volume of water many times their storage capacity. Bauer and Mastin (1996) discovered that Douglas-fir-salal stands in southern Washington State intercepted about 50% of the annual precipitation before it reached the ground. Most of the interception occurred during the rainy winter and spring months (Bauer and Mastin 1996, Figure 8). This observation may seem counter-intuitive at first glance. One would think that once the intercepting surfaces are saturated, the rest of the precipitation runs off. This, however, is not the case for the north-west coast of North America, probably, as Bauer and Mastin (1996) suggest, because of the mild windy winters. Whatever the reasons for the phenomenon, interception (I) must constitute a significant water loss factor in the water balance of Burns Bog. How to apply observations of interception under Douglas-fir and salal vegetation to the lodgepole pine and shrubby stands of the Bog (see Section 4.3.1) is an important issue. The shrubby salal component is common to both situations, but the dominant coniferous species and canopy densities differ. Furthermore, Burns Bog supports a mosaic of forested and non-forested ecosystems (Section 4.3.1). Interception storage varies widely between species; it is generally higher for trees than for shrubs and herbs, and higher for conifers than for deciduous trees, being broadly proportional to the total surface area of all plant parts (Zinke 1967; Eggelsmann et al. 1993). In general, there are few real data. For example, mature lodgepole pine forest intercepted about 30% of rain during the summer, whereas partially cut areas intercepted 10-20% of rain (Niederhof and Wilm 1943). A chapparral scrub (shrubby vegetation perhaps comparable to the tall shrub vegetation in the Bog) in California intercepted about 15% of rain over the year, but in driest months (precipitation 2.5-5 mm), this proportion increased to 50% (Zinke 1967). Not only is the species composition of the vegetation of concern, but so is the nature of the precipitation event. Munn (quoted in Zinke 1967) found that, for light canopy densities, interception depended on the precipitation during a single event (shower) as follows: 100% intercepted at less than 0.25 mm; 68% at 1-2.5 mm; 27% at 2.6-7.5 mm; and 16% at 10-25 mm. Considering Bauer and Mastin’s (1996) observations for the region’s climate, the importance of interception of winter rainfall (not accounted for by the Thornthwaite approach), and the complex structural pattern of bog vegetation, a value of 20% of the annual precipitation is assumed as a prudent estimate of interception losses. This value is in excess of any interception accounted for by Et in the Thornthwaite model. The mean annual precipitation for the Bog is about 1,100 mm (Helbert and Balfour 2000); therefore, the interception (I) losses in the water budget are approximately 220 mm. The interception component could even be larger, but, without field data, the real value can only be estimated. Annual vertical water losses (V) are relatively well understood on the basis of hydraulic conductivity measurements (Piteau Associates 1994; MacAlister 1997). Helbert and Balfour (2000) estimated that 4% or almost 44 mm/yr of the annual precipitation passes out vertically.

87
To review, using annual average values, water inputs to the Bog consist only of precipitation (P) which is 1,100 mm annually. Water outputs or losses consist of evapotranspiration (E) of 638 mm/yr, plus interception (I) of 220 mm/yr and vertical discharge (V) of 44 mm/yr. The water-balance equation, with the values of P, V, E and I having been established is: P - D - V - E - I ±K = 'W or, (1,100 mm/yr)-D-(44mm/yr)-(638mm/yr)-(220mm/yr)±K = 'W or, 198 mm/yr - D±K = 'W Three parts of the water balance remain to be resolved. The value of K represents a measure of uncertainty and is difficult to assess. It can be positive or negative and is included for the purpose of indicating the likely range of values. For watershed-level ecosystems it is reported to be around 12-15% (Verry 1997) or as much as 20-30% (R. Rothwell pers. comm., January 2000), even for water balances studied in great detail. The goal of the water-balance analysis is to calculate the discharge (D), which can then be used in the drought disturbance model (see Section 6.5.2) and in understanding the role of ditches in the water balance. This leads to a consideration of the change in water storage ('W) in the water-balance equation. The change in water storage ('W) on an annual basis is not an important factor in calculating the annual surplus water (D). But, over the long term, it is critical to know whether 'W is a negative or positive value. Healthy sustainable bogs must have a positive water balance for peat to accumulate. A negative value indicates that the discharge component is likely larger on an average annual basis than it would be under sustainable circumstances. The water-storage change in Burns Bog over the past few decades is clearly negative as concluded by the Technical Review Panel (Sims et al. 2000a). Comparisons of surveyors’ notes (summarized in Hebda and Biggs 1981; North and Teversham 1984), reports of ecologists in the early part of this century (Osvald 1933), and 1930 aerial photographs to the present vegetation, reveal that almost all of the remaining 2,800 ha of the Bog was previously covered in wet peat-forming communities. The average annual water table for this type of vegetation is in the range of 30-40 cm below the surface (see sites BB2, BB7 in Figure 4.12). Today, the average annual water-table position for the entire area is likely more in the 50-65 cm range (see Figure 4.13a,b), considering the extent and vigor of lodgepole pine stands. The difference between these two averages is about 25 cm. The change has occurred largely between 1940 and the present, an interval of 60 years. The result is an annual change of storage at any point of 4 mm/yr. This value may seem trivial on the scale of 1,100 mm/yr of precipitation, but when combined with the storage lost due to the removal of peat, it has clearly been enough to cause major changes in plant communities (Madrone Consultants Ltd. 2000). This small annual change is not part of the surplus water available for discharge; rather, it is in addition to it. The water storage decrease could be the result of several different factors such as increased evapotranspiration resulting from changes in vegetation and increased interception because of the expansion of forested stands. Most likely though, it results from increased discharge to drainage ditches. The ditches simply remove the water from the Bog more quickly than had occurred prior to

88
disturbance, lowering the water table earlier in the year and keeping it low for a longer interval. Consequently, the effect of summer evapotranspiration on the water table reaches deeper into the soil than during any other time of the year. The result is a lower water table, on average, and a progressive decrease in storage (W). In other words, the magnitude of actual discharge (D) is greater than the calculated discharge simply by considering the basic components of the water balance. The annual water-balance equation as calculated by the preceding approach is now: 198 mm/yr - D ±K = -4mm/yr or, D±K = 202 mm/yr A D of 202 mm/yr (ignoring the error term) now consists not only of moisture surplus, but also of drainage. It is important to note that these calculations apply to an average year and that the values for D can easily be 100 mm more or less than the calculated value (Sims et al. 2000a). On this basis, D could reasonably range from 100-300 mm/yr. It is important also to note that in dry years there could clearly be no surplus climatic moisture. The implications of this situation are discussed further in Section 6.5.2. The monthly dynamics of the water balance also need to be considered. Seasonal changes in the water table are particularly critical to the survival of peat-forming plant communities and sustainability of bog ecosystems (Ivanov 1981). These fluctuations are driven by the cycle of monthly changes in the water balance. In particular, the monthly water balance is strongly shaped by the seasonal distribution of precipitation and evapotranspiration. The monthly balances for an average year, calculated using the Thornthwaite method, show a moisture deficit beginning in May and persisting to September (Figure 4.15). Assuming that the water table is at the ground surface in winter, the water table will have dropped about 17 cm below the surface by the end of September, well within the acceptable zone for the peat-forming ecosystems. Using the water balance that incorporates interception, the monthly balance becomes negative in April and remains so until September (Figure 4.16). Though the moisture deficit interval is about the same duration as that calculated by the Thornthwaite method, the monthly declines are much greater. By the end of September, the water table may have been lowered by as much as 29 cm below the surface, closer to the lower limit for peat-forming vegetation. Consequently, the time required for the water table to rise back to the surface is much greater as well (December to January). The water balance calculations thus far assume a wet season water-table position at the surface. For a direct comparison to real water-table positions in Burns Bog, the mean monthly water-table position below the surface needs to be adjusted for the normal wet season water-table position in the Bog. Sites BB2 and BB7 from the zone of functioning acrotelm in Burns Bog (Figure 4.12) suggest a mean wet month water-table position of about 10 cm, not 0 cm as used in the models.

89
The adjusted low water-table positions using the Thornthwaite method would be 27 cm below the surface and, using the model with interception included, 39 cm below the surface. The lower of these two values is more in line with water table measurements in the Bog (MacAlister 2000). The relatively low, summer water-table position, as revealed by the monthly water-balance analysis, may explain why Burns Bog is located near the climatic limits for raised bogs on the west coast of North America (Vitt et al. 1999). This observation is consistent with Proctor’s (1995) and Damman’s (1977) conclusions concerning the critical role of summer moisture deficit. The monthly water-balance analyses also suggests that Burns Bog is potentially sensitive to drought, a topic explored in Section 6.5.2.

90
Figure 4.16 Monthly summary of water balance for Burns Bog, interception included.
Precipitation,
mm
Lateral recharge,
mm
Calculated lateral
discharge, mm
Vertical discharge,
mm
Evapo-transpiration,
mm
Interception,
mm
Change in water
table, mm
Mean water table position below the
surface, mm January 150 0 43 4 9 50 44 -61 February 118 0 40 4 17 40 17 -17
March 101 0 33 4 30 10 24 0 April 65 0 19 4 49 5 -12 -12 May 53 0 9 4 76 5 -41 -53 June 45 0 4 4 96 3 -62 -115 July 33 0 2 4 114 2 -88 -203
August 39 0 0 4 105 1 -71 -274 September 64 0 0 4 73 4 -17 -291
October 117 0 0 4 45 10 58 -232 November 144 0 5 4 21 40 74 -158 December 171 0 33 4 11 50 73 -85
Total 1100 0 190 44 646 220 0 -125
Water Balance, average year
-400
-300
-200
-100
0
100
200
Jan Feb Mar April May June July Aug Sept Oct Nov Dec
Month
Prec
ipita
tion
or E
vapo
tran
spira
tion
(mm
)
PrecipitationEvapotranspirationWater Table

91
4.2.6 Water Chemistry
4.2.6.1 Raised Bog Water Chemistry
The chemical characteristics of bog or mire water help identify the type of bog it is (Damman 1987; Malmer et al. 1992; Naucke et al. 1992; Mitsch and Gosselink 1993, p.380). Water chemistry strongly influences the species of plants that can grow in the mire (Glaser et al. 1981; Banner et al. 1988; Gorham 1990). These specialized plants not only provide the biotic framework for the ecosystem, but also drive the peat-forming processes essential to sustaining the Bog. Bog water chemistry is shaped by many factors (Damman 1987). From the perspective of water supply, these include the chemistry of atmospheric precipitation (rain, snow, and fog) and the chemistry and relative role of surface and groundwater. Wind-borne mineral particles from the sea or soil from adjacent lands also have an effect (Damman 1987; Malmer et al. 1992). Water chemistry is also shaped by the botanical origin of the peat, physiological processes of bog plants, and the degree of biological activity in the peat mass (Damman 1987; Naucke et al. 1993). The activity of soil micro-organisms depends on the water-table position and on temperature. Generally, higher temperature and a lower annual average water-table position lead to greater rates of decomposition and more rapid release of chemical constituents to the water of the bog (Damman 1987). Furthermore, biochemical processes in the aerated zone (acrotelm) and non-aerated zone (catotelm) lead to different water chemistries (Damman 1977; Johnson and Damman 1993). Raised bog ecosystems are generally fed by nutrient poor precipitation (Gorham 1956; Moore and Bellamy 1974; Damman 1987). Groundwater inflows can occur under exceptional circumstances (Glaser et al. 1997) but these do not usually reach the surface and the active peat-forming community. The surface and near-surface flowing waters of raised bogs tend to be low in minerals, rich in dissolved organic substances and have extremely strong acid reactions (low pH) (Gorham 1956; Damman 1977; Glaser et al. 1981; Damman 1987). The colour of the discharged water is brown to dark brown because of humic acids (organic compounds) released through the decomposition process (Hemond 1980). Raised bog waters have a low dissolved mineral load in the range of 30-100 mg/l (Naucke et al. 1993:300). The dissolved organic substance content ranges from 40-150 mg/l (Naucke et al. 1993:300). pH values (related to hydrogen ion concentrations) vary from 3.5-6.0 but are usually less than 4.5 (Gorham et al. 1985; Damman 1987; Gorham and Janssens 1992; Mitsch and Gosselink 1993, p.381). Electrical conductivity (related to concentrations of total dissolved solids and ions) is relatively low, especially compared to surrounding groundwater values (Glaser et al. 1981). Dissolved ion concentrations in raised-bog surface waters are very low (Damman 1987; Mitsch and Gosselink 1993; Naucke et al. 1993). Typically, calcium occurs in concentrations of 0.1-2.5 mg/l (Gorham 1956; Glaser et al. 1981; Damman 1987; Malmer et al. 1992), magnesium at 0.1 mg/l, iron at less than 0.1 mg/l, and nitrogen at 0.2-0.4 mg/l (Naucke et al. 1993). Toward the margins of a bog or deep into the peat profile, concentrations generally increase as the influence

92
of groundwater, rich in mineral ions, becomes greater (Glaser et al. 1981; Damman 1987; Malmer et al. 1992). Water chemistry also changes with time of year and degree of drainage. Autumn waters may exhibit increased ion concentrations because of substances released by relatively rapid summer decomposition (Vitt et al. 1995). Increased drainage may have a similar effect (Naucke et al. 1993). Water chemistry is also strongly influenced by the rate of peat accumulation (Damman 1987). Slowly accumulating peat and associated surface water contain higher concentrations of ions than rapidly accumulating peat. The peat and water contain many more years of input from precipitation in a much smaller volume than is the case for rapidly accumulating peat (Damman 1987). Fire and erosion affect surface water chemistry as well (Damman 1987). Both disturbances increase the supply of nutrients. Nutrients released by fire stimulate decay, which slows peat accumulation. Accumulation stagnates and nutrient concentrations rise further (Damman 1987). Erosion exposes the acrotelm to more intense aeration and increased nutrient supply. Peat mining and clearing the shoulders and borders of ditches have effects similar to erosion.
4.2.6.2 Regional Water Types
Balfour and Banack (2000) undertook a review of previous work and collected new data to help provide a description of the water-chemistry characteristics of the study area. They noted that no systematic study had been undertaken to describe the Bog’s water chemistry, but much water-quality data had been collected during several related projects. Most of the previous data were collected during studies mainly of groundwater related to landfill water quality (Piteau Associates 1983, 1994). Some data were obtained by the Corporation of Delta, mostly from ditches around the Bog. Balfour and Banack (2000) collected and analyzed additional water samples from 35 sites, including groundwater monitoring wells and a variety of open water bodies. Balfour and Banack (2000) provide data for four broad regional water types: rainwater (meteoric water), surface drainage from Newton Uplands, groundwater underlying the Bog, and peat water. Rainwater in the area (Vancouver International Airport data) is slightly to moderately acidic with pH values of 3.8-7.2 (average 5.0) and relatively low in dissolved minerals, most values being less than 2.0 mg/l (Piteau Associates 1994; Balfour and Banack (2000). Water chemistry characteristics, such as pH and specific conductance, vary widely in the short term. Balfour and Banack (2000) ascribe these variations to characteristics of individual air masses. The pH values of water draining from the Newton Uplands ranges from 6.6-9.9 (average 7.4). Mineral ion concentrations are much higher than for rainwater. For example, calcium concentrations are 17 mg/l and magnesium concentrations 4 mg/l. Groundwater, derived from the silt layer under the Bog, has pH values of 5.3-7.2 (average 7.0). Ionic concentrations are relatively high compared to rainwater. For example, calcium occurs at an average of 29 mg/l and magnesium at 22 mg/l.

93
Peat-derived water is acidic to very acidic, having pH values of 3.8-6.2 (average 4.3). Ionic concentrations are in the 0-15 mg/l range. Peat water characteristics are described in more detail in the following section. For comparison, Fraser River water has a pH of 8.1, higher than typical bog water, and calcium concentrations of 18.2 mg/l. Notably, it also has higher dissolved oxygen concentrations than bog water (Balfour and Banack 2000). Boundary Bay water, as might be expected, has very high concentrations of major cations (e.g., 322 mg/l calcium) and relatively high pH (8.4).
4.2.6.3 Burns Bog Water Types
A primary objective of the water chemistry investigation (Balfour and Banack 2000) was to provide data and analyses that could be linked to plant community distribution and help identify the parts of the study area essential to the long-term sustainability of the bog ecosystem. Balfour and Banack (2000) identified three broad water types based on calcium concentrations and pH (Table 4.10; Figure 4.17). Calcium concentrations and pH values are recognized discriminants of typical raised bog waters (see Section 4.2.6.1).
Table 4.10 Summary of water chemistry characteristics of Burns Bog water types (Balfour and Banack 2000).
water type pH (pH units) calcium (mg/l)
I Bog Water 3.5–5.5 0–3
II Transitional Water 4.5–6.0 3–10
III Non-bog Water 5.0–8.0 >10
Type I water has low pH (3.5-5.5) and relatively low calcium ion concentrations (0-3 mg/l). This water type is interpreted to represent typical bog water, an interpretation consistent with data from other raised bogs (Glaser et al. 1981). Type I water occupies much of the ecologically available bog and correlates closely with the water mound (compare Figures 4.11 and 4.17). In the south and west, the Type I water zone extends to the City of Vancouver landfill perimeter and to the 72nd Street BC Hydro power line (Figure 4.17). In the north, the bog water type extends to within 300 m of the Burns Bog Ditch. Eastward and south-eastward, the margin of the Bog water zone appears to occur well inside the edge of the study area. There are, however, few sample sites in this portion of the Bog and the limits of the three water types must be considered speculative. Type II water, called “transitional water” by Balfour and Banack (2000), exhibits higher pH and contains more calcium than bog water. pH ranges from 4.5-6.0 and calcium concentrations range from 3-10 mg/l. The distribution of Type II water surrounds Type I water, and like Type I, appears to be restricted to the peat mass. The zone of Type II water is very narrow on the south-west, west and north periphery of the Bog, but widens to 1 km in the east and south-east (Figure

94
4.17). East of Highway 91, the relatively wide extent of this zone may be attributable to the influence of surface waters from Panorama Ridge (Piteau Associates 1994). The explanation for the broad width of the band in the south-east sector is not clear. Again, a lack of sampling sites is a serious limitation in delineating the extent of the water types. Type III water, called “non-bog water” by Balfour and Banack (2000), has slightly acid to slightly alkaline pH (5.0–8.0) (Table 4.10). Calcium concentrations are relatively high, being greater than 10 mg/l. The water is rich in dissolved anions and cations. Electrical conductivity is high. Ammonia concentrations are high, as are the levels of iron and manganese. Type III water occurs outside of Type II transitional water and appears to occur only outside of the peat deposit, except in the area of cranberry fields in the north-west (Figure 4.17).
4.2.6.4 Water Chemistry and Vegetation Type
In general, Type 1 surface water is characteristic of White beak-rush-Sphagnum (RS) and Pine-Sphagnum (LS) ecosystems occupying the main core of the Bog (see Section 4.3.1). For example, Terrestrial Ecosystem Mapping (TEM) field plots E28 and E68 (see Balfour and Banack 2000, Table 14), both associated with RS type vegetation, had low calcium concentrations and low pH. Pond water from the centre of the Bog had similarly low pH and very low calcium (0.73-0.86 mg/l) and magnesium concentrations (0.8-0.9 mg/l). No surface water data are available for pine-dominated vegetation. The groundwater of two Lodgepole pine-Sphagnum, low shrub (LS3a) sites (E29 and E33 in Balfour and Banack 2000, Table 14) exhibit intermediate pH values (4.4-5.6) and relatively high calcium (2.3-11.6 mg/l), but relatively low magnesium (1.3-1.9 mg/l) concentrations. Groundwater from a single Lodgepole pine-Salal (LG) site (E32 in Balfour and Banack 2000, Table 14) fell within the range of the LS3a values. These groundwater values more or less fit in the Type II category of Balfour and Banack (2000). The chemistry of the surface water is unknown. The groundwater sample from a single Hardhack (HH) site (E37) has moderate pH (5.2) but high calcium (68.4 mg/l) and magnesium (52.5 mg/l) concentrations. It falls into the Type III category, but again there are no surface water data. Two samples, one from surface water and one from groundwater, reveal that Western redcedar-Skunk cabbage vegetation east of Highway 91 is associated with Type II to Type III waters. The sites nearest the outflow of Blake Creek, exhibit moderate calcium concentrations (11-14.4 mg/l) and low magnesium concentrations (3-4.2 mg/l). Further from the influence of Blake Creek, but near the base of Panorama Ridge, pH, calcium and magnesium concentrations are lower and in the range of Type II water (Balfour and Banack 2000).

95
Figure 4.17 Distribution of water types of Burns Bog based on water chemistry.

96

96
Overall, water chemistry reflects vegetation patterns in a general way, with Sphagnum-
dominated vegetation having lowest pH and cation concentrations. However, the low sample number, combined with limited representation of acrotelm and catotelm waters, make it impossible to relate ecosystems to water chemistry in a more specific way. It would be useful to know how the water chemistry has changed in parts of the Bog as the plant communities have changed (i.e., changes from Lodgepole pine-Sphagnum to Lodgepole pine-Salal or Birch-Salal vegetation (see Section 4.3.1). A closer correlation of vegetation types and water chemistry might help understand these ecological changes. It would be particularly useful to understand the water chemistry of the acrotelm zone that is regenerating on old peat workings and compare it to the water chemistry of undisturbed vegetation in the south. There are so few analyses available from the main part of the Bog that only a very general understanding of acrotelm water chemistry is possible. Also, many of the "acrotelm" samples appear to have originated at 1-2 m below the surface, well below the normal acrotelm/catotelm boundary (see Balfour and Banack 2000, p.7). Important questions remain. For example, how does the water chemistry of intact acrotelm compare to catotelm? What has been the effect of fire and surface disturbances on water chemistry? Also Balfour and Banack (2000) demonstrate that water chemistry varies throughout the year because of ionic concentration through evaporation. For the purpose of strict comparison water chemistry samples would have to be taken at the same time of the year.
4.3 Biological Setting
4.3.1 Plant Communities, Plants and Fungi
Peatland plant communities are a defining characteristic of bogs. Without them, peat will not form, and a bog will degenerate. Also, the plant communities and constituent species reflect the bog’s hydrologic characteristics, vital to the continued functioning of a bog, and provide wildlife habitat. The plants and plant communities of Burns Bog have been documented since the late 1800s (Hebda and Biggs 1981). Osvald (1933) described the vegetation in 1927 and noted characteristic plant species. Before the mid twentieth century, the Bog was covered in open heath and Sphagnum communities with scrub pines. Dominant species included Labrador tea, bog cranberry (Oxycoccus palustris), salal, and lodgepole pine, as well as peat mosses. Hebda and Biggs (1981) identified and described eight vegetation zones present in 1977: heathland (including a wet Sphagnum subtype and a Ledum subtype), pine woodland, birch woodland, Spiraea brushland, mixed coniferous forest, salmonberry brushland, alder woodland, and disturbed heathland. Since the mid 1970s, Burns Bog has undergone significant changes resulting from more peat mining, the building of a highway, growth of the City of Vancouver landfill and the construction of cranberry fields, among other factors. A comprehensive study of the Bog's plant communities and constituent plant species was undertaken to establish the current vegetation patterns of the Bog and to provide a ground-based framework for looking at which parts of the Bog were

97
critical to its ecological viabilty. A study of plant species permitted an assessment of the Bog's importance to rare and endangered species and those near the limits of their geographic range. An inventory of macrofungi was also undertaken to gain a preliminary understanding of the diversity of this rarely studied group as one measure of biological diversity. The vegetation types described by Hebda and Biggs (1981) and aerial photographs were used as the basis for carrying out initial fieldwork and developing a field sampling strategy (Madrone Consultants Ltd. 1999). Field work was conducted during September and October of 1999. Using Terrestrial Ecosystem Mapping (TEM) methodologies (Resources Inventory Committee 1998a) (see also Appendix G), plant community types were identified, described and mapped as polygons at a scale of 1:10,000.
4.3.1.1 Plant Communities
Twenty-four different ecosystem types were identified, mapped and described within the study area (Table 4.11). The types were grouped into seven forest ecosystems, nine shrub or herb dominated ecosystems, and six sparsely to non-vegetated, largely anthropogenic ecosystems (Figure 4.18). Three of the forested ecosystems (Western redcedar-Skunk cabbage (RC), Western redcedar-Grand fir-Foamflower (RF) and Western redcedar-Douglas-fir-Kindbergia (RK)) likely existed prior to European settlement and disturbance. Old-growth trees certainly persist north of 72nd Avenue (Gedalof 1999). All three ecosystems occur today at the margins of the Bog and are most extensive east of Highway 91. Western redcedar-Skunk cabbage (RC) ecosystems exist in tall shrub to mature forest structural stages. As an ecosystem, this type is recognized by the consistent occurrence of skunk cabbage, salmonberry and lady fern (Athyrium filix-femina) in the understorey. RC ecosystems in the Bog are largely in early to middle stages of succession; hence, they are dominated by deciduous or mixed deciduous canopies. For example, Pacific crab apple (Malus fusca) predominates at some sites in the tall shrub structural stage. Red alder predominates at other sites. Vine maple and cascara (Rhamnus purshiana) also occur. The RC ecosystem occurs widely east of Highway 91 on Humisols in areas noted to support "bog forest" by early surveyors (Figure 4.18) (North and Teversham 1976). It covers approximately 1.5% of the study area.
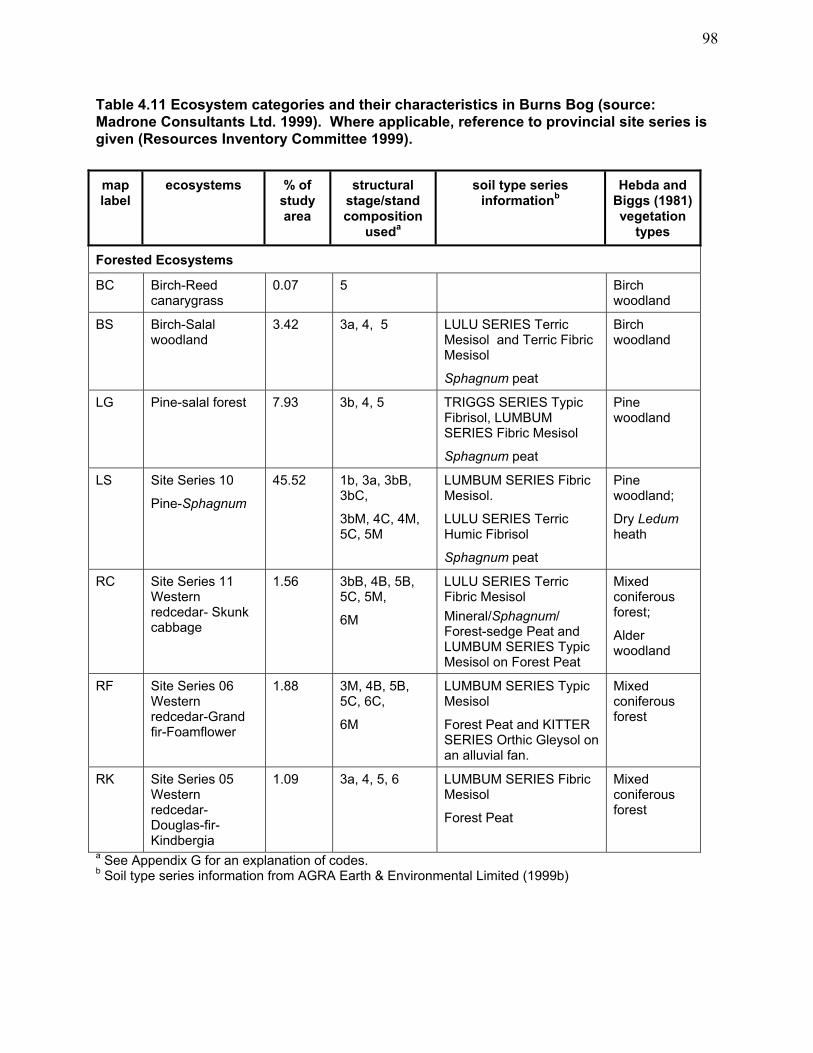
98
Table 4.11 Ecosystem categories and their characteristics in Burns Bog (source: Madrone Consultants Ltd. 1999). Where applicable, reference to provincial site series is given (Resources Inventory Committee 1999).
map label
ecosystems % of study area
structural stage/stand composition
useda
soil type series informationb
Hebda and Biggs (1981) vegetation
types
Forested Ecosystems
BC Birch-Reed canarygrass
0.07 5 Birch woodland
BS Birch-Salal woodland
3.42 3a, 4, 5 LULU SERIES Terric Mesisol and Terric Fibric Mesisol
Sphagnum peat
Birch woodland
LG Pine-salal forest 7.93 3b, 4, 5 TRIGGS SERIES Typic Fibrisol, LUMBUM SERIES Fibric Mesisol
Sphagnum peat
Pine woodland
LS Site Series 10
Pine-Sphagnum
45.52 1b, 3a, 3bB, 3bC,
3bM, 4C, 4M, 5C, 5M
LUMBUM SERIES Fibric Mesisol.
LULU SERIES Terric Humic Fibrisol
Sphagnum peat
Pine woodland;
Dry Ledum heath
RC Site Series 11 Western redcedar- Skunk cabbage
1.56 3bB, 4B, 5B, 5C, 5M,
6M
LULU SERIES Terric Fibric Mesisol Mineral/Sphagnum/ Forest-sedge Peat and LUMBUM SERIES Typic Mesisol on Forest Peat
Mixed coniferous forest;
Alder woodland
RF Site Series 06 Western redcedar-Grand fir-Foamflower
1.88 3M, 4B, 5B, 5C, 6C,
6M
LUMBUM SERIES Typic Mesisol
Forest Peat and KITTER SERIES Orthic Gleysol on an alluvial fan.
Mixed coniferous forest
RK Site Series 05 Western redcedar-Douglas-fir-Kindbergia
1.09 3a, 4, 5, 6 LUMBUM SERIES Fibric Mesisol
Forest Peat
Mixed coniferous forest
a See Appendix G for an explanation of codes. b Soil type series information from AGRA Earth & Environmental Limited (1999b)

99
Table 4.11 (continued). Ecosystem categories and their characteristics in Burns Bog (source: Madrone Consultants Ltd. 1999). Where applicable, reference to provincial site series is given (Resources Inventory Committee 1999).
map label
ecosystems % of study area
structural stage/stand composition
useda
soil type series informationb
Hebda and Biggs (1981) vegetation
types
Shrub and Herb-Dominated Ecosystems
BL Bracken wet meadow
0.32 2a Mesisol Dry (Ledum) heathland
CH Reed canarygrass-Hardhack
0.76 2b Terric Mesisol -
CS Tawny cotton-grass-Sphagnum
0.36 2b Humisol-Mesisol Disturbed heathland
HH Hardhack shrub 3.22 3a, 3b RICHMOND SERIES Terric Mesic Humisol Sphagnum peat Mesisol
Spiraea brushland
JS Common rush-Sphagnum
0.63 2b Hydric Fibrisol Disturbed heathland
RD White beak-rush-Three-way sedge
11.53 1, 2b TRIGGS SERIES Mesic Fibrisol
Disturbed heathland
RS White beak-rush-Sphagnum
13.66 2b TRIGGS SERIES Typic Fibrisol
LUMBUM SERIES Fibric Mesisol
LUMBUM SERIES Humic Mesisol
All on Sphagnum peat
Wet Sphagnum heathland-Rhyncho-spora lows; also in disturbed heathland
WG Wool-grass wetland
0.13 2b Humisol-Mesisol Disturbed heathland
WW Yellow-waterlily-Watershield
0.75 1b, 2c - Nuphar ponds
a See Appendix G for an explanation of codes. b Soil type series information from AGRA Earth & Environmental Limited (1999b)
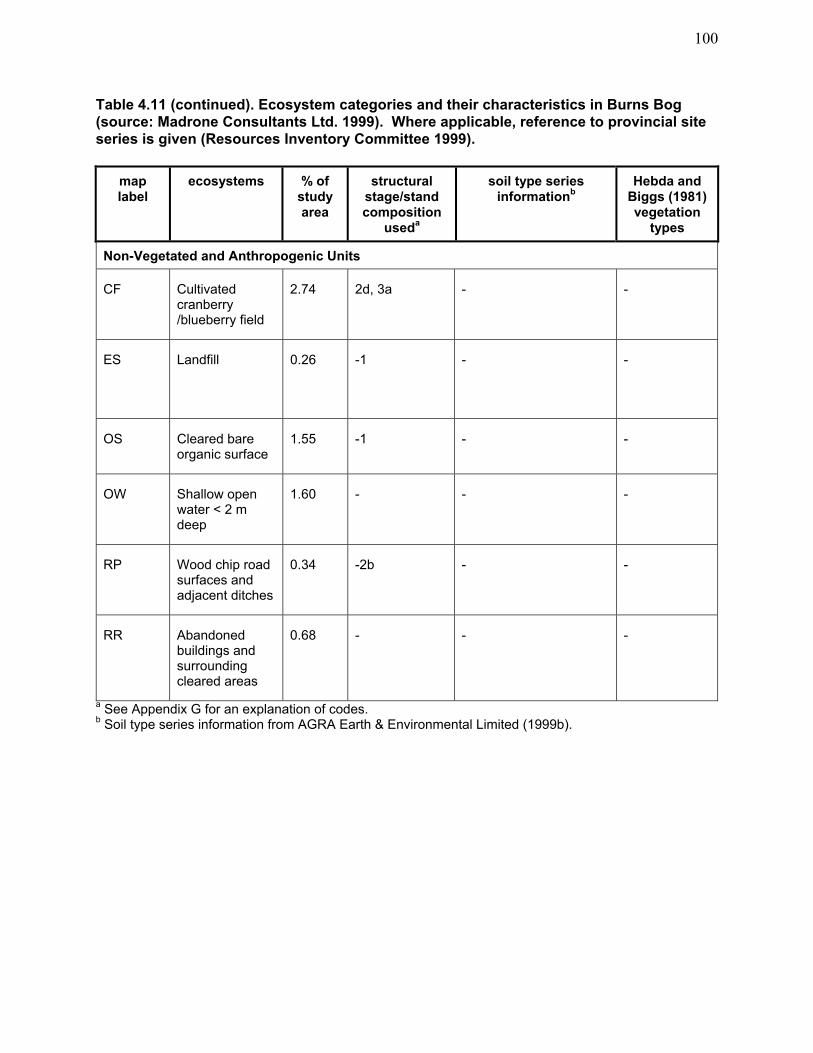
100
Table 4.11 (continued). Ecosystem categories and their characteristics in Burns Bog (source: Madrone Consultants Ltd. 1999). Where applicable, reference to provincial site series is given (Resources Inventory Committee 1999).
map label
ecosystems % of study area
structural stage/stand composition
useda
soil type series informationb
Hebda and Biggs (1981) vegetation
types
Non-Vegetated and Anthropogenic Units
CF Cultivated cranberry /blueberry field
2.74 2d, 3a - -
ES
Landfill 0.26 -1 - -
OS Cleared bare organic surface
1.55 -1 - -
OW Shallow open water < 2 m deep
1.60 - - -
RP Wood chip road surfaces and adjacent ditches
0.34 -2b - -
RR Abandoned buildings and surrounding cleared areas
0.68 - - -
a See Appendix G for an explanation of codes. b Soil type series information from AGRA Earth & Environmental Limited (1999b).

101
The Western redcedar-Grand fir-Foamflower (RF) forested ecosystem is recognized on the basis of the abundance of ferns, especially wood ferns (Dryopteris spp.). Western redcedar, red alder and western hemlock are the main tree species. Salmonberry (Rubus spectabilis) is a consistently occurring shrub. Grand fir and foamflower (Tiarella spp.), species typical of this ecosystem type elsewhere, do not occur in the Bog stands. RF vegetation occurs only east of Highway 91 (Figure 4.18) and occupies about 2% of the study area, having developed on organic Mesisols and mineral soils. The Western redcedar-Kindbergia (RK) forest type mostly has a young tree canopy of western hemlock, western redcedar and lodgepole pine. Salal and, occasionally, skunk cabbage grow under the trees. There is a well-developed and diverse moss layer at some sites. This ecosystem occurs on relatively well-drained, but nutrient-poor, peaty soils east of Highway 91 and at the western margin of the Bog adjacent to Crescent Slough (Figure 4.18). It grows, in part, on sites not covered historically by forest (Madrone Consultants Ltd. 1999). The remaining four forested ecosystems appear to have developed since disturbance of the Bog during the twentieth century (North and Teversham 1976; Hebda and Biggs 1981). These sites are dominated either by lodgepole pine or birch species. All four types have developed subsequent to drainage, or drainage and disturbance of what was original unforested bog vegetation. Birch-Salal woodland (BS) consists mostly of closed stands of paper birch (Betula papyrifera) and European birch (Betula pendula), under which grows a dense stratum of salal. Scattered lodgepole pines occur with the birches. Evergreen blackberry (Rubus laciniatus) and Labrador tea grow with the salal. Mosses are uncommon. This ecosystem occurs in shrub to young forest structural stages. It grows mainly on Humisols at the Bog's margins, especially near Highway 99, and covers about 3% of the study area (Table 4.11). Two small Birch-Reed canarygrass (BC) stands consist of an open tree stratum of European birch and lodgepole pine in a dense mass of reed canarygrass (Phalaris arundinacea), possibly as result of moist sites at the Bog's margins (Madrone Consultants Ltd. 1999). Closed, tall shrub to young forest stands of lodgepole pine rise over dense masses of salal in the Lodgepole pine-Salal (LG) ecosystems. The vegetation consists of tall shrub to young forest structural stages of closed canopy lodgepole pine stands. Western hemlock may occur abundantly, especially on the eastern portion of the Bog. Small amounts of Labrador tea always grow in the dense mass of salal under the trees. Mosses and herbs occur sparsely, with bracken fern (Pteridium aquilinum) being the only species of note. The LG ecosystem covers about 8% of the study area and is distributed mainly around the periphery of the Bog, on the Bog side of Birch-Salal (BS) stands (Figure 4.18). LG stands are most extensive on unexcavated peat in the south and north-west sectors of the Bog. LG also occurs on unexcavated remnants among peat workings. Pine-salal vegetation has largely developed on Typic Fibrisols (Triggs series) and slightly more decomposed Fibric Mesisols (Lumbum series).

102
Figure 4.18 Distribution of simplified vegetation types in Burns Bog.

103

103
Lodgepole pine-Sphagnum (LS) stands consist of a lodgepole pine canopy of varying structural stages above dense Labrador tea and a carpet of Sphagnum species (Madrone Consultants Ltd. 1999). In the low shrub form, LS3a (pines 2 m tall or less), bog blueberry and Labrador tea are abundant as are shrubby heath species, such as bog-rosemary (Andromeda polifolia) and bog laurel (Table 4.12). Common red Sphagnum (Sphagnum capillifolium) forms large hummocks and patches of maritime reindeer lichen (Cladina portentosa ssp. pacifica) occur on dry microsites. The wetter parts of the LS3a ecosystem are likely the main areas of peat formation in the undisturbed condition of the Bog. Their composition and soil most closely resemble the Bog’s original vegetation (Osvald 1933; North and Teversham 1976; Hebda 1977). LS3a resembles peat-forming vegetation elsewhere (e.g., Glaser et al. 1981). In the tall shrub stage of Lodgepole pine-Sphagnum (LS3b), the taller pines form a canopy over rampant growth of tall (0.9-1.1 m) Labrador tea. Bog blueberry is abundant, but the open heath species occur less commonly. Instead, velvet-leaf blueberry (Vaccinium myrtilloides) and salal participate in the shrub stratum. Hummocks of Sphagnum cover the ground, as in the low shrub stage (LS3a). At some sites, where peat mining or fire have disturbed the surface, paper birch and European birch combine with pine to form mixed stands. Under tall pine trees, in pole sapling and young forest structural stages (LS4 and LS5), salal is a more abundant component of the shrub stratum, occurring with cover equal to that of Labrador tea. Lodgepole pine, western hemlock and birches contribute to the open tree stratum. Bog blueberry grows beneath Labrador tea. The ground is covered by many mosses, especially step moss (Hylocomium splendens) and red-stemmed feather moss (Pleurozium schreberi). Sphagnum hummocks (most commonly Sphagnum capillifolium) occur, hence the LS designation of the plant community. Collectively, Lodgepole pine-Sphagnum (LS) vegetation types cover about 45% of the study area, of which the low shrub stage is most extensive at 23% (Figure 4.18). LS predominates on the unmined remnants of bog vegetation in the north and south parts of the Bog (Figure 4.19). It occurs also on the ridges between excavated peat workings. The plant community grows on Fibric Mesisols (Lumbum series) and Mesic Fibrisols (Triggs series) (Madrone Consultants Ltd. 1999). Three shrubby or herbaceous ecosystem types occur primarily at the Bog margins (Figure 4.18). Hardhack shrub (HH) is the only ecosystem dominated by shrubs. This low to tall shrub community consists mainly of dense hardhack thickets, occasionally including one or more of sweet gale, Labrador tea, salal, cascara or Pacific crab apple. There are no, or few herbaceous species and the bryophyte cover varies from little to extensive. Many Sphagnum species grow under hardhack in the western part of the Bog. Hardhack vegetation occurs at the margins of the peat body of the Bog, covering about 2% of the study area (Figure 4.18). It is associated with Humisols having a mineral horizon approximately 1 m below the surface.

104
Table 4.12 Lodgepole Pine–Sphagnum ecosystems (adapted from Madrone Consultants Ltd. 1999). Bold face indicates consistently occurring species. See Appendix F for explanation of structural stage coding.
structural stage and stand composition
3a low shrub undisturbed surface
3bb, 3bm, 3bc tall shrub undisturbed surface
3bb, 3bc tall shrub disturbed by excavation
3a/3bb, 3bc shrub disturbed by fire
4, 4m, 4c open pole sapling
5, 5m, 5c young forest
tree species - lodgepole pine birch
birch (paper and European) lodgepole pine western hemlock
- lodgepole pine European birch paper birch western hemlock
western hemlock lodgepole pine birch
tall shrub species birch lodgepole pine
lodgepole pine western hemlock birch
lodgepole pine birch (paper and European) western hemlock
lodgepole pine birch (paper and european)
lodgepole pine western hemlock birch
lodgepole pine western hemlock
low shrub species Labrador tea bog blueberry lodgepole pine salal velvet-leaved blueberry
Labrador tea bog blueberry salal velvet-leaved blueberry
lodgepole pine Labrador tea bog blueberry
lodgepole pine birch (paper and european) labrador tea velvet-leaved blueberry salal bog blueberry
Labrador tea salal bog blueberry velvet-leaved blueberry
Labrador tea salal bog blueberry
herb layer species bog rosemary bog laurel crowberry, bracken bog cranberry cloudberry round-leaved sundew
bog laurel bog cranberry
tawny cotton-grass fireweed bracken wool-grass
bog laurel bog laurel
bryophytes and lichens
common red Sphagnum reindeer lichen bog haircap moss broom moss step moss red-stemmed feathermoss Oregon beaked moss
common red sphagnum reindeer lichen step moss red-stemmed feathermoss bog haircap moss broom moss
great variation in composition and abundance
haircap mosses Variation. Can include step moss Oregon beaked moss lanky moss electrified cat’s tail broom moss Sphagnum sp.
step moss red-stemmed feathermoss electrified cat’s tail lanky moss broom moss Sphagnum sp.

105
Figure 4.19 Relatively undisturbed plant communities of the Burns Bog area.

106

106
Reed canarygrass-Hardhack (RC) is related to HH, but consists mainly of dense swards of reed canarygrass. There is sparse cover of hardhack, scattered birches and weedy shrubs, notably blackberries. Except for reed canarygrass, herbaceous and bryophyte cover is poorly developed. This combination of species is associated with cleared sites under power lines, roadsides and the edges of the Bog (Madrone Consultants Ltd. 1999). RC covers less than 1% of the study area. Bracken wet meadow (BL) vegetation is a minor type along the Bog’s margins, covering less than 0.5% of the study area (Madrone Consultants Ltd. 1999). Bracken dominates, with scattered Labrador tea, hardhack and velvet-leaved blueberry beneath its canopy. It occurs adjacent to or within birch (BS) and pine (LG) stands. Six well-developed herb and shrub-dominated ecosystems occur within the main body of the Bog. Two of them, White beak-rush-Sphagnum (RS) and White beak-rush-Three-way sedge (RD) cover relatively undisturbed areas or have spread into excavated zones. The other four have developed directly as a result of peat mining and invasion by alien species (Madrone Consultants Ltd. 1999). The RS ecosystem consists mainly of stands of white beak-rush (Rhynchospora alba) above a continuous carpet of Sphagnum species, especially Sphagnum tenellum. Bog cranberry trails widely over Sphagnum mats and hummocks. Round-leaved sundew (Drosera rotundifolia) also grows widely in the ecosystem. Lichens occupy hummocks in relatively dry spots. Tawny cotton-grass (Eriophorum virginicum) grows in disturbed settings. Undisturbed forms of RS dot the Pine-Sphagnum (LS) community of the south and south-west portions of the Bog. The surface of abandoned peat workings in the centre of the Bog has been occupied by this ecosystem. RS covers about 13.5% of the study area (Figure 4.18). It has developed on Fibrisols (Triggs series) and Fibric Mesisols (Lumbum series) (Madrone Consultants Ltd. 1999). Together with wetter parts of the Lodgepole pine-Sphagnum low shrub phase, the RS ecosystem is a peat former. The White beak-rush-Three-way sedge (RD) ecosystem resembles the RS ecosystem in that white beak-rush predominates. The vegetative cover is often incomplete, in contrast to RS. Three-way sedge (Dulichium arundinaceum) often grows on relatively bare wet sites in RD, in which Sphagnum patches may also occur. Scattered bog shrubs, including Labrador tea, sweet gale, and bog blueberry, appear. RD has developed only on sites where peat was removed by the hydropeat or vaccuum methods (see Appendix H) and the remaining surface consists of moderately decomposed Triggs Fibrisols. RD covers 11.5% of the study area (Figure 4.18). Three herbaceous ecosystems (Common rush-Sphagnum wetland (JS), Wool-grass wetland (WG) and Tawny cotton-grass-Sphagnum (CS), form small patches in old peat workings and total less than 1% of the study area (Figure 4.18) (Madrone Consultants Ltd. 1999). JS consists of common rush (Juncus communis) growing in a floating or grounded carpet of Sphagnum
pacificum, which fills ponds excavated by the Atkins-Durbrow mining method. Pure stands of wool-grass (Scirpus cyperinus) constitute the WG ecosystem, which occupies a small site at the north margin of the Bog where the vacuum or scratch mining method was used (Madrone Consultants Ltd. 1999). Tawny cotton-grass and bulbous rush (Juncus bulbosus), growing in a

107
continuous mat of Sphagnum pacificum, dominate CS vegetation. Like WG, the CS ecosystem occurs in a small area mined by the vacuum technique in the northern potion of the Bog. The Yellow waterlily-Watershield (WW) community is the major vegetated aquatic ecosystem. Yellow waterlily (Nuphar polysepalum) and watershield (Brasenia schreberi) float in ponds among masses of Sphagnum pacificum in the area worked by the Atkins-Durbrow mining method (Figure 4.18). WW also occurs in ponds too small to map in undisturbed natural areas. All six of the sparsely vegetated or anthropogenic units are the result of disturbance. Cultivated fields (CF) of cranberries and blueberries cover almost 3% of the study area (Figure 4.18). Organic surfaces (OS), prepared for cranberry farming, and open water (OW) are next in area, covering about 1.5%. Bare mineral surfaces (ES) (i.e., landfill), wood chip road surfaces (RP) and abandoned buildings and surrounding cleared areas (RR) constitute slightly more than 1% of the study area (Figure 4.17). Several of these are the result of recent disturbance and are expected to be colonized by plants in the near future. Weedy species, in particular, have begun to grow on the roads and abandoned industrial sites (Madrone Consultants Ltd. 2000).
4.3.1.2 Plant, Lichen and Fungal Species
Burns Bog supports at least 188 taxa of vascular plants, 51 moss species (including 12 Sphagnum species), and 16 liverworts (Table 4.13 ). Ninety-four species of macrofungi and 26 lichen species also grow in the Bog (Table 4.13).
Table 4.13 Past and present plant and macrofungus species inventories (adapted from Madrone Consultants Ltd. 1999).
species Madrone Consultants Ltd.
(1999)
Hebda and Biggs (1981)
Beak Consultants Limited (1982)
Vascular species 188 107 90
Mosses (not Sphagnum)
41 32 14
Sphagnum 12a 6 4
Liverworts 16 8 0
Lichens 26 5 to genus only 0
Macrofungi 94 0 0
Total 377 158 108 a Sphagnum mendocinum added by K. Golinski in February 2000; Sphagnum cuspidatum, in the broad sense, was collected and identified by A. Damman. Of the vascular plant species identified, 58% (108) are native species, whereas the remaining 42% (80) are introductions. Province-wide, 21% of all vascular plant species are introduced;

108
thus, there is a high proportion of introduced species in the bog flora. However, most of the introduced species are associated with cultivated fields and other areas disturbed by human activities, such as roads, trails and abandoned peat processing plants. The undisturbed parts of the woodlands, heath and wetlands within the Bog host few invasive vascular plants. In general, these areas support a relatively small number of native vascular plant species, which is characteristic of bog or bog woodland habitats (Glaser et al. 1981). There are two main groups of introduced species: Old World species, typical of urban areas (occurring along transportation corridors and where the bog surface has been heavily disturbed); and species associated with blueberry and cranberry cultivation from eastern North America. The moss Campylopus introflexus is unique because it has been introduced from the Southern Hemisphere. Twelve of the introduced species are invasive or potentially invasive because they often become dominant species and change the structure of the vegetation. Sites sensitive to invasion include regenerating peat workings and places where hydrology has markedly changed. Among the 12 invaders, six species have become well established. European birch was not observed by Hebda and Biggs (1981), but now occurs widely with paper birch. Tawny cotton-grass was first reported in 1994 (Taylor 1994) and is now widespread in some sites. Brown-fruit rush (Juncus pelocarpus) predominates at the margins of some peat excavation ponds. Large cranberry (Oxycoccus macrocarpus) has spread widely and forms dense mats on disturbed and excavated peat. Highbush blueberry (Vaccinium corymbosum) has started to colonize the LS community and has the potential to hybridize with bog blueberry (Madrone Consultants Ltd. 1999). Evergreen blackberry is entrenched in the Birch-Salal woodland vegetation. Campylopus
introflexus, another recent arrival, has been noted as a serious problem in coastal dunes and heathlands in Europe (Equihua and Usher 1993). The remaining potentially invasive species occur rarely or, as yet, are not a serious threat (Madrone Consultants Ltd. 1999, Table 3.8). Six species listed provincially as noxious weeds occur on disturbed non-organic surfaces and do not appear to pose a threat to bog ecosystems (Madrone Consultants Ltd. 1999). The list of vascular plant species for Burns Bog is the most comprehensive to date (Table 4.13). Nevertheless, additional species must be expected especially since the inventory was carried out in late summer and fall. For example, DeMill (1999b) has verified that ladies-tresses (Spiranthes
romanzoffiana) continues to grow in the Bog. Weedy species, new to the list, can be expected along the imported wood waste fill used to extend the 80th Street road bed. A comprehensive investigation of aquatic habitats might also add new species. The lists of mosses and lichens must also be considered incomplete because Goward and Schofield (1983) included more species in their previous study. Intensive year-long collecting by specialists is the only way to obtain comprehensive lists of these two groups.
4.3.1.3 Rare Ecosystems and Species
Nearly all forested ecosystems of the Coastal Douglas-fir biogeoclimatic zone (CDF) within the Chilliwack Forest District have been listed by the Province of British Columbia as vulnerable, threatened or endangered, because much of the area has been cleared for farming and housing (Madrone Consultants Ltd. 1999). Consequently, undisturbed, near climax forms of all the site series in the study area are classified as rare (Madrone Consultants Ltd. 1999) (see Flynn 2000 for criteria used to recognize threatened or endangered ecosystems).

109
The Pine-Sphagnum ecosystem, so common in the Burns Bog, is mostly in the shrub or young forest structural stages. However, several plant species (Vaccinium myrtilloides, Empetrum
nigrum, Rubus chamaemorus, and Andromeda polifolia) occur near their southern geographical limit in this ecosystem. The LS association is provincially red-listed by the Conservation Data Centre (A. Ceska, pers. comm.). Most of the other forested sites series mapped in the study area have developed on peat, a condition not typical of the Moist Maritime subzone of the Coastal Douglas-fir zone (Madrone Consultants Ltd. 1999). Their ranking with respect to rare or threatened status is not known at this time. All other ecosystems identified within the Bog are likely unique to the study area, but many are a result of disturbance and some are dominated by introduced species. These would not be considered as threatened or vulnerable (Madrone Consultants Ltd. 1999). Of the plant species, only rice cutgrass (Leersia oryzoides) is provincially listed (blue-listed). It was collected from a cranberry field and adjacent drainage ditches in the western part of the Bog. There is, however, a notable group of species found in the Bog that are at or near their southern geographical limits of distribution. Species at the limits of their range are of particular conservation concern because range limits are focal points for the development of genetic diversity and evolutionary change (Schonewald-Cox et al. 1983; Hansson et al. 1992). They are, in a sense, ‘signals’ of special biodiversity values. The species at their range limits include cloudberry, crowberry, bog-rosemary and velvet-leaved blueberry; the first three are typical bog species. The list of fungi is preliminary because the collecting time was limited and represents only a small part of the year. To obtain an accurate inventory of fungi, collections need to be made throughout the seasons over a period of several years due to the irregular production of diagnostic fruiting bodies (Madrone Consultants Ltd. 1999). Furthermore, there are no comprehensive comparative lists of fungi in British Columbia, specific for bogs. However, Hapalopilus nudilans has been collected only once before in British Columbia and is rare. Suillus umbonatus is common in California, but is only found occasionally in south-western British Columbia (Madrone Consultants Ltd. 1999).
4.3.2 Wildlife and Fisheries
4.3.2.1 Birds
One hundred and seventy-five bird species have been recorded from the central areas of Burns Bog (Gebauer 1999a). This number does not include bird species using adjacent urban, industrial, agricultural, riverine and marine areas. These 175 species represent approximately 43% of all species within the Vancouver region, including 68% of all regularly occurring birds (Toochin 1998; Gebauer 1999a). Gebauer (1999a) believes that several other species, not yet documented for Burns Bog, are likely to occur on an irregular basis. Field studies for the Burns Bog Ecosystem Review focussed on documenting the occurrence and habitat use by waterbirds (Summers and Gebauer 1999a) and raptors (Summers and Gebauer 1999b). The Greater Sandhill Crane (Grus canadensis tabida) was identified at the onset of the Review as a species of specific concern and was the subject of a separate study (Gebauer 1999b).
110
The confirmed and potential rare and endangered bird species in Burns Bog also received special attention by Gebauer (1999a).
Greater Sandhill Crane The Greater Sandhill Crane is a provincially blue-listed (vulnerable) species (Fraser et al. 1999). Of the six subspecies that occur in North America, three occur in British Columbia (Cooper 1996). The Greater Sandhill Crane breeds in the Lower Mainland (10-15 breeding pairs) (Gebauer 1999b), the Cariboo-Chilcotin (about 1,500 nesting pairs), the northern Okanagan Valley (one breeding pair), the East Kootenays (two breeding pairs), and possibly on Vancouver Island (Cooper 1996). Greater Sandhill Cranes of British Columbia are considered part of California's Central Valley population, which includes birds from northern California and southern Oregon (Cooper 1996). Greater Sandhill Cranes occur in Burns Bog from approximately early April to mid-October (Gebauer 1995). They are thought to winter in the Central Valley of California, where they are joined by cranes which breed in southern Oregon and north-eastern California (Pogson and Lindstedt 1991). Overall, the Central Valley crane population may be declining (Cooper 1996). There is little historical information on the occurrence of Greater Sandhill Cranes in Burns Bog Gebauer (1999b). Gebauer (1995) carried out the first intensive surveys in 1993 and 1994, followed by further surveys in the spring of 1999. A late summer/early fall study was conducted as part of the Burns Bog Ecosystem Review (Gebauer 1999b). Surveyed areas included the central parts of Burns Bog and agricultural lands to the west and south of the Bog. Figure 4.20 shows the field observations of the Greater Sandhill Crane during the spring and fall of 1999. In 1994, the summer population of Greater Sandhill Cranes in Burns Bog was estimated by Gebauer (1995) to be approximately 10 birds, consisting of two to three breeding pairs. The 1994 Lower Mainland population was estimated at a maximum of 31 individuals, with nesting occurring in the Pitt Meadows area, Langley Bog, and Burns Bog (Gebauer 1995). Breeding surveys conducted in May of 1999 estimated the spring population to be three to four breeding pairs and two to three non-breeding individuals, for an estimated total population of nine to 11 birds (Gebauer 1999b). The total number of breeding cranes in the Lower Mainland in 1999 is estimated to be between 20 and 30 (Gebauer 1999b). Surveys in August 1999 confirmed a summer resident population of approximately 11 birds (Gebauer 1999b). Throughout much of August, cranes were most frequently observed in central parts of the Bog, with most recorded south of 72nd Avenue and west of 88th Street (Figure 4.20). Over the spring and summer of 1999, DeMill (in Gebauer 1999b, Appendix 2) observed cranes widely using the central part of the Bog, including the zone north of 72nd Avenue and sites east of the 96th Street line (Figure 4.20). Use of the zone north of the 72nd Avenue line is consistent with Gebauer's (1995) earlier observations. In late August of 1999, increasing numbers of cranes were reported within the Bog (i.e., 13 on August 30th). This increase in abundance is thought to be due to a post-breeding dispersal of cranes from the Pitt Meadows area (Gebauer 1999b). In early September 1999, cranes began flying out during the day to agricultural fields in the Crescent Slough area. Fourteen cranes were observed in the fields on September 1st and a maximum of 21 birds were seen on September 15th (Gebauer 1999b).
111
Gebauer (1999b) reports that in both 1994 and 1999, the greatest activity in Burns Bog was observed in open heathland and wetland habitats in the vicinity of the pond complex in the north-west portion of the study area (Figure 4.20). Other areas of activity included the series of ponds in the south-west part of the Bog, wetlands in the south-east part of the Bog north of 96th Street, and wetlands in the east-central area of the Bog along 72nd Avenue. The most utilised areas are characterized by open White beak-rush-Sphagnum habitats with small ponds and shrub-covered islands (Gebauer 1999b). Activity may be focussed in some of these areas because they centre on nesting sites (Dunbar 2000). Nests of Greater Sandhill Cranes are typically built on mounds of vegetation in shallow wetlands within stands of emergent vegetation (Walkinshaw 1949; Campbell et al. 1990; Cooper 1996). In Burns Bog, such conditions occur in disturbed parts of the Bog that have begun to recover from past peat mining. More recently disturbed areas, where vegetation cover is incomplete or poorly developed, do not appear to have as high a value for nesting (Gebauer 1999b). Figure 4.21 shows the distribution of Greater Sandhill Crane habitat suitability in Burns Bog, with reference to provincial standards and based on the available information concerning species biology, distribution and habitat preferences (Gebauer 1995; Enviro-Pacific Consulting 1999; Gebauer 1999b), combined with Terrestrial Ecosystem Mapping data (Gebauer 2000). The mapping of habitat suitability considers the ability of a habitat in its current condition to provide food, shelter or other important life requisites for a particular species or species group. Open heathland and white beak-rush dominated communities in the central western part of the Bog and other open peat-mined areas are of highest habitat value for the Greater Sandhill Crane (Class 2 or moderately high, meaning a 50-75% suitability relative to the best habitats for Greater Sandhill Cranes in the province) (Gebauer 2000). Moderate habitats (Class 3, or 25-50% of the best in the province) are located throughout most other disturbed, open habitats in central areas of the Bog. Many recently disturbed sites are of lower habitat value for crane use; however, as recovery of the ecosystem takes place, these sites will become more suitable (Gebauer 1999b). Although breeding cranes may have been successful in hatching young in 1999, it was not possible to verify whether young were successfully raised to fledging age (Gebauer 1999b). The absence of immature birds in the fall crane flocks led Gebauer (1999b) to suggest that recruitment into the Lower Mainland population did not occur in 1999 or was very low. However, two separate family groups of cranes were observed at Burns Bog in 1994. A pair of cranes with a single chick was photographed in 1998 in open heathland of Burns Bog (DeMill, cited in Gebauer 1999b) confirmation that successful rearing has occurred in the recent past.

112
Figure 4.20 Greater Sandhill Crane occurrence in spring and fall of 1999 in the Burns Bog study area.

113
Figure 4.21 Terrestrial Ecosystem Mapping of habitat suitability for the Greater Sandhill Crane in the Burns Bog study area.
114
Burns Bog is one of only two remaining documented breeding areas for the Greater Sandhill Crane in the Lower Fraser Valley and appears to be an important fall staging area for other cranes that nest in the Lower Mainland (Biggs 1976; Gebauer 1995, 1999b). The birds are likely attracted to the Bog by the large breeding and refuge habitat and its association with extensive agricultural fields. Other similar sites in the Lower Mainland do not have these characteristics in as large an area as Burns Bog (Gebauer 1999b). Despite the several Greater Sandhill Crane studies in Burns Bog, none have focussed on searching systematically for nests, and presumably as a consequence, nest sites have not been located. However, specific habitats have been identified as likely breeding locations (Gebauer 1999b). Use of the Bog by cranes during the months of June and July is not well understood because of insufficient surveying. Other limitations noted by Gebauer (1999b) include a lack of knowledge concerning nocturnal use; the impact of predation on breeding success; what cranes eat in the Bog; site fidelity during the breeding season (i.e., whether there is movement between other Lower Mainland breeding sites); and the impact of human disturbance on breeding success and other activities. The question remains whether or not Burns Bog can support more Greater Sandhill Cranes, either for breeding or fall staging. Gebauer (1999b) and Dunbar (1999) conclude that there is habitat for a larger population. There is also the broader unanswered question concerning the Central Valley population, which appears to be declining (Dunbar 1999), and what such a decline may mean to the Bog's cranes. The Bog's contribution to this population is small compared to other regions (Cooper 1996). However, the Bog population is a major part of the endangered Lower Fraser Valley population (Dunbar 1999; Gebauer 1999b).
Waterbirds Waterbird surveys were conducted in Burns Bog during the late summer months of August and September of 1999 as a component of the Burns Bog Ecosystem Review (Summers and Gebauer 1999a). Twenty-nine species were recorded during surveys, including grebes such as Pied-billed Grebe (Podylimbus podiceps), Great Blue Heron (Ardea herodias), geese (two species), ducks (11 species), Sora Rail (Porzana carolina), American Coot (Fulica americana), shorebirds (11 species), and Belted Kingfisher (Ceryle alcyon). Broods of five species of waterbird were observed (Summers and Gebauer 1999a). Summers and Gebauer (1999a) estimate that a minimum total of 700 waterbirds per day used the surveyed portions of the Bog during the late summer of 1999. The most abundant waterbirds in Burns Bog during the survey period included night-roosting Canada Goose (Branta canadensis) and day-roosting dabbling duck species, especially Mallards (Anas platyrhyncos) (Summers and Gebauer 1999a). At night, small numbers of Great Blue Heron, dabbling ducks (primarily Mallard), and shorebirds, such as Least Sandpiper (Calidris minutilla) and Solitary Sandpiper (Tringa solitaria), were recorded. Barnard (1988) indicated that more than 500 Canada Geese used Burns Bog as a night-roost. During the late summer of 1999, Summers and Gebauer (1999a) observed from 291 (September 1st) to 604 (August 28th) Canada Geese leaving the Bog on morning surveys until the opening of the goose hunting season when numbers decreased (e.g., 171 recorded on September 17th).

115
Mallard was the second most abundant species recorded by Summers and Gebauer (1999a). For August surveys, Mallard numbers varied between 14 and 63 birds, with the exception of one survey count of 279. September survey counts ranged from 155 to 532, with an average of 269 birds observed. The understanding of seasonal variation of duck abundance is limited because most of the Bog remains unsurveyed during the non-breeding season (Summers and Gebauer 1999a). For example, TERA Planning Ltd. (1992) estimated between 200 and 400 dabbling ducks during the winter and up to 1,000 in spring. TERA Planning Ltd.'s (1992) study was limited by scope and methodology (Barnard 1992). Other reports (i.e., Barnard 1988) noted the presence of thousands of migrating ducks using Burns Bog in August and September (i.e., upwards of 5,000, primarily Mallard and Northern Pintail (Anas acuta)). These numbers are much greater than observed in late summer of 1999 by Summers and Gebauer (1999a). An estimated 3,500 to 4,500 waterfowl used wetland areas in the south of the Bog during one survey day in September, 1992 (unpublished data of T. Barnard, reported in Summers and Gebauer 1999a). The results of hunter surveys also indicate that Burns Bog is used by large numbers of dabbling ducks during the non-breeding season. Extrapolations from historical duck-kill statistics led to an estimate of a minimum of 10,000 ducks using the Bog during the winter months (Biggs 1976). During the late summer surveys in 1999, many dabbling ducks were observed in the southern portions of the Bog, confirming previous reports and lending support to the conclusion that high numbers of waterfowl should be expected in the Bog. How regionally important to waterbirds is the habitat provided by Burns Bog during the winter months? Up to 750,000 waterfowl use the Fraser River delta annually (Butler and Campbell 1987). During the September and April peak-use period, Butler and Cannings (1989) recorded between 22,000 and 100,000 dabbling ducks during monthly ground surveys. Breault and Butler (1992) recorded as many as 175,000 ducks during one year. Jury (1981) estimated that 80,000 to 90,000 waterfowl, mostly dabbling ducks, used the Fraser River delta foreshore and upland habitats between October 1980 and March 1981. The number of dabbling ducks using Burns Bog in a winter season could exceed 10,000 based on available information (Summers and Gebauer 1999a). This number represents a significant proportion of the estimated Fraser River delta wintering duck population. Summers and Gebauer (1999a) note that winter duck use of agricultural lands adjacent to Burns Bog is strongly influenced by the degree of flooding of the fields. The actual amount of agricultural land in the Fraser River delta that floods in the winter varies and depends on, among other factors, drainage works installed by governments and landowners. Lacking adequate information about the degree of flooding on farmlands, detailed comparisons with Burns Bog are not possible (Summers and Gebauer 1999a). However, as many as 50,000 ducks use the flooded agricultural lands of Richmond, Delta and Surrey each day, compared with reports of up to 5,000 ducks in one day on Burns Bog (Barnard 1988; Summers and Gebauer 1999a). Land conversion and new drainage works in Richmond and Surrey are expected to decrease the amount of agricultural land available for waterbird use. This decrease may be of particular concern for local dabbling duck populations. The reasons that waterfowl use the flooded habitats in Burns Bog during the non-breeding season are uncertain, but if either feeding or resting are important

116
uses during these times, the Bog could be making a considerable contribution to the needs of waterfowl in the Fraser River delta (Summers and Gebauer 1999a). During the breeding season, Burns Bog serves as a nesting area for as many as 16 species of waterfowl and other waterbirds (Summers and Gebauer 1999a). The major breeding species are Canada Goose, Green-winged Teal (Anas crecca), and Mallard. Of the five species observed in the late summer 1999 survey, the Ring-necked Duck (Aythya collaris) may be a first breeding record for the Greater Vancouver area (Summers and Gebauer 1999a). Based on a subjective assessment of habitat quality, Summers and Gebauer (1999a) estimate that a minimum of 100 pairs of waterbirds can potentially nest in the Bog, although much more work is needed to determine actual breeding populations. Barnard (1988) estimated a potential breeding population of 100 pairs of Canada Goose. The quality of the Bog’s open water areas as breeding habitat for most waterbird species may be improving as vegetation succession advances in former peat-cutting areas (Summers and Gebauer 1999a). In summary, seven major waterbird species groups have been recorded in Burns Bog (Summers and Gebauer 1999a): grebes (Pied-billed), herons, geese (three species), dabbling ducks (10 species), diving ducks (six species), coots and rails (three species), and shorebirds (11 species). In addition, Trumpeter Swan (Cygnus buccinator), Caspian Tern (Sterna caspia), several gull species, and a Belted Kingfisher (Ceryle alcyon) have been reported. Three waterbird habitat types, based on the annual duration of open water, can be distinguished in Burns Bog (Summers and Gebauer 1999a):
1. Permanently inundated areas of deep pools (used year-round and of primary importance for brood rearing);
2. Persistently flooding areas (likely important for migration and spring territorial use); and 3. Seasonally flooding areas (used by waterbirds primarily in the winter and spring).
Permanent ponds are used by the greatest diversity of waterbird species (Summers and Gebauer 1999a). They serve as breeding habitat for Pied-billed Grebe, Canada Goose, several species of dabbling ducks, and Sora Rail (Porzana carolina). The ponds also provide Canada Goose and other species with secure roosting areas isolated from predators such as coyote (Canis latrans) (Summers and Gebauer 1999a). Summers and Gebauer (1999a) note that their field work was restricted to the interval between August 13th and September 20th 1999, and additional information is limited. As a result, the results reported here may not be representative. The variation in bird use from year to year, and use throughout the year need to be studied comprehensively. In particular, the extent and distribution of waterbird use within the Bog during the breeding, moulting, migration and wintering periods are poorly known. There is a clear need for more baseline information to determine accurately the extent of use of Burns Bog by waterfowl.
Raptors

117
During August and September of 1999, raptor surveys focused on determining the abundance, distribution and habitat associations of diurnal birds of prey (Summers and Gebauer 1999b). Summers and Gebauer (1999b) detected eight diurnal raptor species and two owl species in the central Burns Bog area. Northern Harrier (Circus cyaneus) and Red-tailed Hawk (Buteo
jamaicensis) were equally abundant and together accounted for two-thirds of the raptor sightings. The other raptor species recorded were Sharp-shinned Hawk (Accipiter striatus), Cooper’s Hawk (Accipiter cooperii), American Kestrel (Falco sparverius), Merlin (Falco
columbarius), Peregrine Falcon (Falco peregrinus) and Osprey (Pandion haliaetus). Northern Harrier and falcon sightings were concentrated around open ponds created by peat harvesting, whereas Red-tailed Hawk and accipiter sightings were more widely distributed throughout the Bog (Summers and Gebauer 1999b). The two owl species detected were Great Horned Owl (Bubo virginianus) and Northern Saw-whet Owl (Aegolius acadicus) (Summers and Gebauer 1999b). Two hawks (Red-tailed Hawk, Cooper’s Hawk) and four owl species used the perimeter forests (Summers and Gebauer 1999b). Two old Cooper’s Hawk nests were found in the coniferous forests east of Highway 91. Two Red-tailed Hawk nests were found in cottonwood trees along Crescent Slough, and another was seen in a birch stand on the north side of the study area. Two Bald Eagle (Haliaeetus leucocephalus) nests were observed in cottonwood trees, one south of Burns Bog west of 96th Street and a second along Crescent Slough (Summers and Gebauer 1999b). The four species of raptors detected in the adjacent agricultural lands include Northern Harrier, Cooper’s Hawk, Red-tailed Hawk, and Peregrine Falcon (Summers and Gebauer 1999b). The rate of detection of raptors is similar inside Burns Bog as in adjacent agricultural lands. Three provincially red- or blue-listed raptor species occur in Burns Bog: Peregrine Falcon, Short-eared Owl, and Barn Owl (Summers and Gebauer 1999b). Peregrine Falcons occur regularly (Summers and Gebauer 1999b), though suitable nesting habitat (see Campbell et al. 1990) is not available within Burns Bog. Short-eared Owls were noted in the centre of the Bog by previous studies (Biggs 1976; Enviro-Pacific Consulting 1999; Perdichuk 1999); however, suitable nesting habitat is limited and the widespread dense thickets may hinder the hunting of prey (Summers and Gebauer 1999b). Typical nesting habitats consist of open treeless sites such as grasslands, rangeland, dry marshes, farmland and brushy fields (Campbell et al. 1990). The perimeter forests of the Bog provide roosting sites for the blue-listed Barn Owl (Tyto alba), which is believed to forage primarily in the surrounding farmland (Andrusiak 1992; Summers and Gebauer 1999b). Feeding may also occur in the Bog because small forest-dwelling mammal remains have been found in some Barn Owl pellets (Summers and Gebauer 1999b). Of the rare and endangered raptor species, the Barn Owl warrants the greatest management concern for these reasons (Summers and Gebauer 1999b).

118
The relative abundance of Northern Harriers and Red-tailed Hawks, during the fall of 1999, is consistent with the results of previous surveys (Biggs 1976; TERA Planning Ltd. 1991). The populations of resident birds are probably supplemented by the movement into the Bog of post-breeding birds from other areas. The abundance of both species increased from August to September of 1999 (Summers and Gebauer 1999b). The number of raptors observed in September also likely increased because American Kestrels and Merlins began to move into the Bog. Summers and Gebauer (1999b) conclude that many raptors present at this time of the year are foraging on migrating ducks, shorebirds and passerine birds which inhabit the Bog. American Kestrels were likely also foraging on dragonflies or other invertebrates (Summers and Gebauer 1999b). An evaluation of year-round habitat suitability for all raptor species (Figure 4.22) was prepared by Gebauer (2000). Habitats of moderately high suitability (Class 2) include the forested communities (i.e., western redcedar, pine and birch forests) (Gebauer 2000). These areas provide nesting habitat for most owls, Bald Eagle, Cooper’s Hawk and Red-tailed Hawk, and also provide foraging habitat for owls and accipiters, and roosting trees for Bald Eagle, Red-tailed Hawk, and Barn Owl (TERA Planning Ltd. 1993; Summers and Gebauer 1999b; Gebauer 2000). Sites with snags are potentially useful to cavity nesting raptors, such as American Kestrel and Northern Saw-whet Owl (Summers and Gebauer 1999b). Northern Harrier is the only raptor that nests on the ground in open areas, and suitable nesting habitats occur throughout shrub and herbaceous communities (Summers and Gebauer 1999b). Ponds are also centres of activity for resident and migrating passerines, waterfowl and shorebirds, thus attracting predators such as Northern Harrier, falcons and accipiters (Summers and Gebauer 1999b). Highly modified or recently cleared areas of the Bog (e.g., for cranberry farming) are deemed of low habitat value to raptors at the present time (Figure 4.22) (Gebauer 2000). Overall, the Lower Fraser Valley is believed to be used by 22 species of birds of prey in fall and winter, and regularly by 12 species in the summer (Butler and Campbell 1987). The Burns Bog Ecosystem Review survey of raptors (Summers and Gebauer 1999b) and a review of previous studies (e.g., Barnard 1988; Gebauer and Bekhuys 1994), identified 13 species of hawks and eagles in Burns Bog. During the non-breeding season, the Bog is used by night-roosting diurnal raptors and by resident nocturnal raptors, and is of value for foraging. The Bog provides nesting and foraging habitats for raptors during the breeding season. These habitats are not available in unforested and actively cultivated agricultural habitats of the Fraser River delta (Summers and Gebauer 1999b). Eight or nine raptor species likely breed in the bog forests, whereas one species likely nests in the open areas of the central Bog (Summers and Gebauer 1999b). Summers and Gebauer (1999b) note that their inventory and review revealed significant data gaps concerning the use of Burns Bog by breeding owls, breeding diurnal raptors, migrating diurnal raptors and wintering raptors. Further, they note that there is little known about how raptors use different parts of the Bog. As with many other vertebrates, not much is known about annual or seasonal variations in use, and specific habitat and species associations.


119
Figure 4.22 Terrestrial Ecosystem Mapping of habitat suitability for raptors in the Burns Bog study area.

120

120
Rare and Endangered Bird Species Two provincially red-listed (endangered or threatened) bird species occur in Burns Bog – the Peregrine Falcon (Falco peregrinus) 7 and the Purple Martin (Progne subis) (Table 4.14) (Gebauer 1999a). Suitable nesting sites for the Peregrine Falcon (Campbell et al. 1990) are not available in Burns Bog. Gebauer (1999a) notes that important foraging sites for the species include foreshore areas, such as Boundary Bay. Consequently, Peregrine Falcons are considered to be of low management concern in Burns Bog. Purple Martin also are not expected to nest naturally within the Bog and, therefore, this led Gebauer (1999a) to conclude that they are also of low management concern. However, natural habitat for any red-listed species warrants consideration. Provincially blue-listed (vulnerable) species confirmed to occur in Burns Bog are shown in Table 4.14. Open ponds and areas dominated by the common rush, likely provide the most suitable habitat for the American Bittern (Gebauer 1999a; Summers and Gebauer 1999a). Gebauer (1999a) concludes that because of the low abundance and vulnerability of the American Bittern in the Lower Mainland, the ponds and adjacent habitat in the Bog may be important breeding locations. As discussed previously in this section, the Greater Sandhill Crane is known to use Burns Bog for breeding and staging (Gebauer 1995, 1999b). Open White beak-rush-Sphagnum ecosystems are habitats of high value for this species (Gebauer 1999b, 2000). The Great Blue Heron, which has been reported regularly in Burns Bog, is believed to be using the Bog for foraging (Gebauer 1999a). Suitable habitat exists in mixed and deciduous forests along the southern end of the Bog and east of Highway 91 (Gebauer 1999a), although nesting has not been reported. Barn Owl occurs in the central zone of Burns Bog and roosts in the peripheral forests (Gebauer 1999a; Summers and Gebauer 1999b). The Barn Owl likely forages mostly in adjacent agricultural fields, but the Bog's peripheral forests are of high value for roosting (Gebauer 1999a; Summers and Gebauer 1999b). The other blue-listed bird species, noted in Table 4.14, are not believed to be of specific management concern in the study area (Gebauer 1999a). The occurrence of two additional red-listed species in Burns Bog – Horned Lark (Eremophila
alpestris strigata) and Vesper Sparrow (Pooecetes gramineus affinis) – remains unconfirmed (Gebauer 1999a). Suitable nesting sites exist within the Bog, but the species were not observed during late summer field studies. Gebauer (2000) assigned ratings for the suitability of habitats, collectively considering four selected rare and endangered bird species (Figure 4.23) – American Bittern, Barn Owl, Greater Sandhill Crane, and Hutton’s Vireo. On this basis, much of the study area receives a moderately high (Class 2) or moderate (Class 3) rating.
7 Surveys did not distinguish between the red-listed anatum subspecies and the blue-listed paelei subspecies. We have assumed, as did Gebauer (1999a), that both occurred.

121
Table 4.14 Provincially red-listed (endangered or threatened) and blue-listed (vulnerable) bird species confirmed for Burns Bog. Species in bold print are of specific management concern according to Gebauer (1999a).
common name scientific name provincial status
Peregrine Falcon, anatum subspecies
Falco peregrinus anatum red-listed
Purple Martin Progne subis red-listed
American Bittern Botaurus lentiginosus blue-listed
Great Blue Heron Ardea herodias blue-listed
Green Heron Butorides virescens blue-listed
Trumpeter Swan Cygnus buccinator blue-listed
Peregrine Falcon, pealei subspecies
Falco peregrinus pealei blue-listed
Greater Sandhill Crane Grus canadensis tabida blue-listed
Short-billed Dowitcher Limnodromus griseus blue-listed
Caspian Tern Sterna caspia blue-listed
California Gull Larus californicus blue-listed
Barn Owl Tyto alba blue-listed
Short-eared Owl Asio flammeus blue-listed
Hutton’s Vireo Vireo huttoni blue-listed

122
Figure 4.23 Terrestrial Ecosystem Mapping of habitat suitability for four rare and endangered bird species (American Bittern, Barn Owl, Hutton’s Vireo, Greater Sandhill Crane) in the Burns Bog study area.

123

123
4.3.2.2 Mammals
The mammal fauna of Burns Bog has never received systematic study. Gebauer (1999a) lists a total of 41 mammals that have been reported to occur within Burns Bog. Several mammal species, including Coyote (Canis latrans), Black-tailed Deer (Odocoileus hemionus
columbianus), Douglas’ Squirrel (Tamiasciurus douglasii), Gray Squirrel (Sciurus carolinensis) and Eastern Cottontail (Sylvilagus floridanus) are reported to be common within Burns Bog and in the vicinity (Gebauer 1999a). Beaver (Castor canadensis), Racoon (Procyon lotor) and Shrew-mole (Neurotrichus gibbsii) are also encountered on a regular basis (Gebauer 1999a). Bats are observed regularly over the area, but the bat fauna in the Bog has yet to be described (Gebauer 1999a). Based on a comparison of the results of more recent studies with historical records (with the caution that it is not possible to determine the reliability of all of these records), several mammals may have been extirpated from Burns Bog. These include Snowshoe Hare (Lepus
americanus washingtonii), Townsend’s Chipmunk (Tamias townsendii), Yellow-pine Chipmunk (Tamias amoenus), Porcupine (Erethizon dorsatum), Red Fox (Vulpes vulpes) and Spotted Skunk (Spilogale gracilis) (Gebauer 1999a). To gain a clearer understanding of the mammal fauna, especially red- and blue-listed species, studies of small mammals (Fraker et al. 1999) and Black Bears (McIntosh and Robertson 1999) were undertaken. Black-tailed Deer also received attention as part of the Black Bear study.
Small Mammals Insectivores, rodents, hares and rabbits, and weasels were the primary focus of an inventory of small mammals in Burns Bog and adjacent lands (Fraker et al. 1999). From August through to early October 1999, a combination of pitfall, live and snap traps were used (Fraker et al. 1999). No species-specific sampling strategies were employed. More or less equal sampling effort was made in each of nine vegetation cover types (Fraker et al. 1999, p.2 and Figure l). A total of 301 individuals, comprising 9 species of rodents and insectivores, were captured. In addition, a Pacific Water Shrew (Sorex bendirii) was identified on the basis of skull parts found in owl pellets on the north-west margin of the Bog. The large majority of the small mammals captured (256 of 301, or 85% of captures) were Deer Mice (Peromyscus maniculatus). Notably, seven individuals of the red-listed Southern Red-backed Vole (Clethrionomys gapperi occidentalis) were captured. Most small mammal captures occurred in what could be characterized as mixed coniferous forest (113 of 301, or 38% of captures), whereas many others were captured in mixed deciduous forest (74 of 301, or 25%) and pine woodland (47 of 301, or 16%) (Fraker et al. 1999). Figure 4.24 maps the habitat suitability for small mammal diversity as analyzed by Gebauer (2000). The highest collective ratings (Class 2, or moderately high) were given to western redcedar advanced shrubland and forests. Moderate ratings (Class 3) were given to lodgepole pine and paper birch forests, and herbaceous and shrubland communities in western redcedar forests. Ponds and habitats with significant recent disturbance (e.g., cranberry fields) were assigned a very low to nil rating (Class 5 or 6).

124
Table 4.15 shows the insectivores, small rodent, lagomorph and mustelid species confirmed for the Burns Bog study area. In addition, Long-tailed Weasel (Mustela frenata), Snowshoe Hare (Lepus americanus), Meadow Vole (Microtus pennsylvanicus), Northern Bog Lemming (Synaptomys borealis), Norway Rat (Rattus norvegicus) and Gray Squirrel (Sciurus carolinensis) have been reported for the study area (Fraker et al. 1999; Gebauer 1999; Perdichuk 1999), however, Fraker et al. (1999) were unable to confirm their occurrence. Nevertheless, several of these species likely occur in the area and some, such as the Snowshoe Hare, certainly did occur (Butler and Foottit 1974). Townsends’s Vole (Microtus townsendi) is common in the agricultural lands of the Lower Mainland and, thus, is likely present in areas adjacent to Burns Bog (Fraker et al. 1999). The small mammal survey provided the first systematic investigation of small mammals in the Bog. However, it was limited in several ways. First, despite the amount of trapping, the effort was too small to have detected all of the species, especially the rare ones (Bury and Corn 1987). Bury and Corn’s (1987) results suggest at least 60 days of trapping are needed to obtain a reasonable inventory. Second, the study spanned only a short part of one year; hence, it cannot have detected annual and multi-year variations (Fraker et al. 1999). Third, no special sampling or observation techniques were used to detect specific rare and endangered taxa. Fourth, considering the large area and habitat diversity, a greater sampling density may have been appropriate. Finally, several effective techniques, such as use of a sooted track-plate station, were not employed (Fraker et al. 1999).

125
Figure 4.24 Terrestrial Ecosystem Mapping of habitat suitability for small mammal diversity in the Burns Bog study area.

126

126
Table 4.15 Small mammals (insectivore, small rodent, lagomorph and mustelid species) confirmed for Burns Bog (Fraker et al. 1999).
common name scientific name
Pacific Water Shrew Sorex bendirii
Common Shrew Sorex cinereus
Dusky Shrew Sorex monticolus
Trowbridge’s Shrew Sorex trowbridgii
Vagrant Shrew Sorex vagrans
Shrew Mole Neurotrichus gibbsii
Eastern Cottontail Sylvilagus floridanus alacer
Southern Red-backed Vole, occidentalis subspecies
Clethrionomys gapperi occidentalis
Creeping Vole Microtus oregoni
Deer Mouse Peromyscus maniculatus
Northern Flying Squirrel Glaucomys sabrinus
Douglas’ Squirrel Tamiasciurus douglasii
Pacific Jumping Mouse Zapus trinotatus
Coyote Canis latrans
Ermine Mustela erminea

127
Black Bears and Black-tailed Deer McIntosh and Robertson (1999) document the presence of sign (i.e., tracks and scat) and occasional sightings that confirm the occurrence of Black Bears in Burns Bog. During the field study, most bear sign was recorded in the eastern and southern parts of the Bog. The study was not able to confirm the number of bears using Burns Bog with any certainty. Previous estimates have varied from 1-2 bears (Biggs and Hebda 1976) to 12 bears (Beak Consultants Limited 1982). Habitat suitability for both the Black Bear and the Black-tailed Deer was analyzed (McIntosh and Robertson 1999). Using information on the habitats present in the study area from Madrone Consultants Ltd. (1999), supplemented by field visits, McIntosh and Robertson (1999) identified and mapped areas that potentially provide important feeding sites or cover. Black-tailed Deer were incorporated as part of the Black Bear study because their habitat requirements overlap those of Black Bears and there was abundant sign of deer. Most habitats in Burns Bog provide only moderate feeding and low cover ratings (McIntosh and Robertson 1999). However, there is no evidence that habitat quality is limiting the number of bears. There are numerous potential sources of food for Black Bears in the Bog because Black Bears are opportunistic omnivores, and their diets change with the season and availability of food resources (Amstrup and Beecham 1976). In spring, sedges, grasses, willows, red alder, black cottonwood, fireweed (Epilobium angustifolium), skunk cabbage, and crowberry (Empetrum nigrum) could be used by bears in the Bog (compiled by McIntosh and Robertson 1999 from Biggs 1976; Hebda 1977; Keystone 1999). In summer and fall, bears can rely heavily on berries from numerous species, as well as on fireweed and clover. When available, insects (i.e., wasps, bees and ants), deer, amphibians and reptiles (i.e., frogs and snakes), and small mammals are eaten (see McIntosh and Robertson 1999). Turned-over planks and ripped-up hummocks in the Bog provide evidence that insects are being consumed by bears (McIntosh and Robertson 1999). Domestic berry crops (i.e., cranberries and blueberries), corn and garbage are also available nearby. Only four out of the 22 habitats identified in Burns Bog can support Black Bear denning (McIntosh and Robertson 1999). The necessary mature and old growth habitats required for denning in the Bog are provided by Western redcedar-Skunk cabbage (RC), the Western redcedar-Grand fir-Foamflower (RF), and the Western redcedar-Kindbergia (RK) ecosystems (McIntosh and Robertson 1999). Mature and old growth Lodgepole pine-Salal (LG) habitats may also provide low value denning habitat. McIntosh and Robertson (1999) conclude that the continued presence of Black Bears in Burns Bog could be significantly affected by the loss of mature and old forests, primarily east of Highway 91, because of a lack of other denning opportunities. However, they note that slash piles, abandoned equipment and buildings, and drained sites throughout the Bog might provide opportunities for dens.

128
Black-tailed Deer are relatively common in the Bog (McIntosh and Robertson 1999). Moderate feeding habitat for the deer occurs in the central part of the Bog, whereas limited cover and winter habitat is provided by the perimeter habitats. McIntosh and Robertson (1999) also note that deer feed in the agricultural and urban habitats surrounding the Bog. McIntosh and Robertson (1999) were unable to draw conclusions regarding the Black Bear population trend in Burns Bog due to a lack of information. Home range analysis suggests that the Bog can potentially support approximately five bears (four females and one male) (McIntosh and Robertson 1999). However, estimates of home range sizes for Black Bears vary considerably, depending on the characteristics of the area (i.e., from 2.35-19.6 km2 for females, and from 5.05-110 km2 for males; see summary in McIntosh and Robertson 1999). Choosing the appropriate home range is difficult because no previous analyses have been conducted for habitats with characteristics similar to those found in the Bog. Other factors important to consider for the maintenance of Black Bears in Burns Bog include the extent of the isolation from other populations, the occurrence of corridors to allow for movements between adjacent habitats, the proximity of a large human population, and the risks presented by nearby transportation corridors (McIntosh and Robertson 1999). It was beyond the scope of the study to determine whether or not the bear population is genetically isolated. Maintaining genetic viability of the Burns Bog population may not require frequent breeding interactions with adjacent populations (McIntosh and Robertson 1999). Further study is required to clarify this issue.
Rare and Endangered Mammal Species Two provincially red-listed mammals, the Pacific Water Shrew (Sorex bendirii) and the Southern Red-backed Vole (Clethrionomys gapperi occidentalis) occur in Burns Bog (Fraker et al. 1999; Gebauer 1999a). The Pacific Water Shrew is also considered threatened by the Committee on the Status of Endangered Wildlife in Canada (COSEWIC) (Cannings et al. 1999). One provincially blue-listed (vulnerable) mammal, Trowbridge’s Shrew (Sorex trowbridgii), also lives in the Bog (Fraker et al. 1999; Gebauer 1999a). Fraker et al. (1999) note that prior to their study, the Southern Red-backed Vole (occidentalis
subspecies) was known in British Columbia from only two specimens (Cannings et al. 1999), the most recent collected over 50 years ago. All the Southern Red-backed Vole specimens from Burns Bog were captured in pine woodland with a dense understory of salal (Fraker et al. 1999). Mixed deciduous forests may also provide important habitat for this species because the voles prefer cool, moist forests with dense shrub cover (Gebauer 1999a). On this basis, moderately high and moderate habitat suitability for the Southern Red-backed Vole exists in the forested zones of the study area (Figure 4.25) (Gebauer 2000). The moderately high habitat ranking (Class 2) is the highest given for this subspecies in the province (Gebauer 2000). Martell (1981, 1983) notes that other subspecies of this vole are strongly linked to mature conifer forests with well-developed shrub and moss understories.

129
Pacific Water Shrew prefers sluggish low-elevation streams, marshes and other wetlands with riparian habitats in mature, old-growth forests, especially where the ground is covered by fallen trees and a fine litter (Nagorsen 1996; Cannings et al. 1999). Gebauer (2000), noted that peripheral western redcedar forests in riparian areas and wetlands are of highest habitat value for this species in the study area. Trowbridge’s Shrew lives in a wide variety of lowland coastal forests, preferring habitats with dry, loose soil and deep litter (Nagorsen 1996). Based on these broad habitat requirements, all forest habitats in the study area, including mixed deciduous forest, mixed coniferous forest and pine woodland, are likely important to this species (Fraker et al. 1999). Gebauer (1999a) notes that, although provincially blue-listed, the species is relatively common in the Lower Mainland. The combined habitat suitability mapping results for the three confirmed rare and endangered or vulnerable mammal species for Burns Bog (i.e., Pacific Water Shrew, Southern Red-backed Vole, and Trowbridge’s Shrew) highlight the importance of forested habitats near, and at the Bog’s margins (Figure 4.26). In addition to these confirmed species, unconfirmed provincially red-listed species that may occur in the Bog include Townsend’s Mole (Scapanus townsendii), Keen’s Long-eared Myotis (Myotis keenii), Snowshoe Hare (Lepus americanus washingtonii), and Long-tailed Weasel (Mustela frenata altifrontalis) (Gebauer 1999a). The blue-listed Townsend’s Big-eared Bat (Corynorhinus townsendii) may also occur (Gebauer 1999a). Additional intensive sampling, over at least an entire year, is required to be certain of the habitat requirements and preferences of the confirmed listed species. Targeted sampling programs need to be carried out to establish whether the unconfirmed rare species occur.

130
Figure 4.25 Terrestrial Ecosystem Mapping of habitat suitability for the Southern Red-backed Vole in the Burns Bog study area.

131
Figure 4.26 Terrestrial Ecosystem Mapping of habitat suitability for three rare and endangered mammal species (Pacific Water Shrew, Southern Red-backed Vole, Trowbridge’s Shrew) in the Burns Bog study area.
132
4.3.2.3 Invertebrates
A brief and limited survey of the invertebrate fauna of Burns Bog revealed the presence of over 400 species (Kenner and Needham 1999). Information from a number of sources was used, including specimens in the Spencer Entomology Museum (University of British Columbia), records from private collections, records in published scientific papers, and a field study undertaken by Kenner and Needham (1999) between August and October 1999. Sampling efforts in the field study focused on aquatic insects because these could be identified using available expertise and because insects adapted to acidic conditions in bogs are known to occur in these specialized habitats. Terrestrial insects and other invertebrates (primarily spiders) were opportunistically collected as well. Kenner and Needham (1999) note that the total number of invertebrate species identified during their study likely represents less than 10% of the total invertebrate species present in the Bog. Eight rare or potentially rare insect species occur in Burns Bog, and five others are suspected to be present (Table 4.16) (Kenner and Needham 1999). Two of the confirmed species are ground beetles (Carabidae), two are water bugs (Corixidae), three are butterflies (Lycaenidae), and the remaining three are dragonflies. Five of the nine species go through an aquatic immature stage and thus require an aquatic habitat (Kenner and Needham 1999). One of these, the water boatman Cenocorixa andersoni, is endemic to the Pacific Coast (Jansson 1972) and the waters of Burns Bog are likely to be an important habitat (Kenner and Needham 1999). Another water boatman, Cenocorixa blaisdelli, is listed from previous collections, but Kenner and Needham (1999) believe that these specimens have been misidentified and the species does not occur in the Bog. Kenner and Needham (1999) note that of those species not found, but likely to occur in Burns Bog (Table 4.16), the dragonfly Aeshna tuberculifera is the most likely candidate. This species breeds in boggy marginal lakes and ponds and has been reported from Sphagnum bogs elsewhere in Canada (Walker 1958). In the Lower Mainland, the dragonflies Epitheca canis and Pachydiplax longipennis are associated with relatively neutral pH waters and would probably be restricted to the periphery of the Bog (Kenner and Needham 1999). Another dragonfly, Erithemis collocata, has not been reported from the Lower Mainland for over 60 years (Kenner and Needham 1999). The nearest extant populations of the rare butterfly Johnson’s Hairstreak (Mitoura johnsoni) are in Stanley Park and Pacific-Spirit Park (Scudder 1994). No information is available about the occurrence of this rare butterfly in Burns Bog. Kenner and Needham (1999) found that the invertebrate fauna in the forested sections of the Bog is more diverse than in shrub and herbaceous habitats. The forests also contain a larger proportion of introduced species than other habitats. No introduced species were detected among the aquatic arthropods (Kenner and Needham 1999). Although the invertebrate fauna of aquatic habitats in the central part of the Bog was not sampled extensively, it is likely to be the most distinctive with the largest portion of rare or potentially rare species, well-adapted to living in acidic waters (Kenner and Needham 1999). The continued survival of these species likely depends on the persistence of acidic wet environments in Burns Bog.

133
Critical habitats for most species are associated with their requirements for breeding (Kenner and Needham 1999). Breeding locations could only be determined for a few of the identified species. The water boatman Cenocorixa andersoni likely breeds at the sites where it was collected (Kenner and Needham 1999). The collection of several larvae of the dragonfly Sympetrum vicinum is proof of breeding in the ponds of the south-east and north-east part of the Bog (Kenner and Needham 1999). Previous records suggest that S. vicinum also breeds in the west part of the Bog (Kenner and Needham 1999). Aeshna subarctica reproduces in shallow
Sphagnum-covered ponds in the south-east part of the Bog. Kenner and Needham (1999) speculate that such ponds may form the core habitat for the local population. More sampling over the critical spring and summer periods must be carried out to understand the role of Burns Bog in the breeding of bog invertebrates. From the observations it is evident, however, that maintaining suitable water quality characteristics is critical for the aquatic insect species.
Table 4.16 Confirmed and potential rare and endangered species of invertebrates in Burns Bog (Kenner and Needham 1999).
family scientific name provincial status
Carabidaea Agonum belleri no provincial status
Carabidaea Omus audouini red-listed
Corixidaeb Cenocorixa andersoni red-listed
Corixidaea Cenocorixa blaisdelli no provincial status
Lycaenidaea Incisalia mossii no provincial status
Lycaenidaea Lycaena mariposa no provincial status
Lycaenidaec Mitoura johnsoni red-listed
Aeshnidaeb Aeshna subarctica no provincial status
Aeshnidaeb Aeshna sitchensis no provincial status
Aeshnidaec Aeshna tuberculifera blue-listed
Corduliidaec Epitheca canis blue-listed
Libellulidaec Erythemis collocata red-listed
Libellulidaec Pachydiplax longipennis blue-listed
Libellulidaeb Sympetrum vicinum blue-listed a Previously reported from Burns Bog; b Found during Burns Bog Ecosystem Review field study; c Not previously reported, but likely to occur

134
Comprehensive sampling and identification of the invertebrate fauna was not possible in the short time available. Sampling takes time, is expensive and requires specialized knowledge (Kenner and Needham 1999). Many different taxanomic experts are required for accurate species identification. Kenner and Needham (1999) note that only one-fifth of the collected ants (Formicidae) had been identified because of the limited availability of the expert taxonomists. Many of the Hymenopterans collected by Kenner and Needham (1999) have not been identified to the species level, yet there are 79 species of Hymenoptera of conservation concern in British Columbia (Scudder 1994, as cited in Kenner and Needham 1999). Thus, the role of Burns Bog, as far as Hymenopterans are concerned, is poorly understood. There are also other groups of invertebrates, other than the insects, for which detailed information for Burns Bog is not available. For example, Kenner and Needham’s (1999) specimens of Arachnida (spiders) and Myriapoda had not been identified to species at this time. Such gaps in knowledge are certainly significant. It is estimated that one in six species of Arachnida in British Columbia is of possible conservation concern. Approximately one-third of the millipede species (part of Myriapoda) in BC are considered rare or endemic (Scudder 1994). Clearly, a great deal more work is required to understand the character and significance of the invertebrate fauna of Burns Bog. Nevertheless, it does contain rare, bog-related water boatmen and dragonflies, and likely supports hundreds of species unknown to Science.
4.3.2.4 Amphibians and Reptiles
Knopp and Larkin (1999) investigated the amphibian and reptile species of Burns Bog, focusing on red- and blue-listed species such as the Oregon Spotted Frog (Rana pretiosa), the Red-legged Frog (Rana aurora) and the Rubber Boa (Charina bottae). They also reviewed existing amphibian and reptile data pertaining to Burns Bog and adjacent areas. In the late summer/early fall of 1999, the most commonly observed species in the Bog and in surrounding drainage ditches included two introduced amphibian species – the Green Frog (Rana
clamitans) and the American Bullfrog (Rana catesbeiana) (Knopp and Larkin 1999). Five native amphibian species were observed (Figure 4.27) including the Northwestern Salamander (Ambystoma gracile), the Western Red-backed Salamander (Plethodon vehiculum), the Long-toed Salamander (Ambystoma macrodactylum), the Red-legged Frog and the Pacific Tree Frog (Hyla regilla). Ensatina (Ensatina eschscholtzii oregonensis) and the Western Toad (Bufo
boreas) were not seen in Burns Bog, but they are known from sites adjacent to the Bog (Rithaler 2000). The Rough-skinned Newt (Taricha granulosa) was not observed during this survey, but has been seen previously (DeMill 1994; Perdichuk 1999). Reptiles commonly observed by Knopp and Larkin (1999) included the Common Garter Snake (Thamnophis sirtalis) and the Northwestern Garter Snake (Thamnophis ordinoides) (Figure 4.27). A sighting of the Western Terrestrial Garter Snake (Thamnophis elegans) remains unverified, as the individual was not captured. Anecdotal reports of other reptiles (Perdichuk 1999) include the provincially blue-listed Painted Turtle (Chrysemys picta) and the Northern Alligator Lizard (Elgaria coerulea). The Painted Turtle occurs in other parts of Delta where it may have been released from captivity (Rithaler 2000). Searches for the provincially blue-listed Rubber Boa (Charina bottae) failed to locate any individuals. Knopp and Larkin (1999) conclude

135
that it is unlikely to inhabit Burns Bog because of the lack of suitable habitat. However, Gebauer (1999a) notes that little is known of the habitat preferences of this species. Knopp and Larkin (1999) especially searched for the provincially red-listed and COSEWIC (Committee on the Status of Endangered Wildlife in Canada) listed Oregon Spotted Frog (Rana
pretiosa) but were unable to find it. Two earlier studies noted the species occurrence in Burns Bog (see Knopp and Larkin 1999; Perdichuk 1999), but these earlier records cannot be verified. The typical habitat includes shallow ephemeral pools, small flood plain wetlands near permanent water bodies (Haycock 1999), all of which occur in the study area. The COSEWIC vulnerable-listed Red-legged Frog (Rana aurora) was observed in the central heathland habitat of Burns Bog and in the north-eastern mixed forest (Figure 4.27) (Knopp and Larkin 1999). Though native amphibian species of Sphagnum habitats are not well known, Red-legged Frogs use lowland bog habitat as well as upland forested sites in the Fraser Valley (Knopp 1996). Breeding sites for the Red-legged Frog could potentially occur in ponds in Burns Bog and adjacent areas (Knopp and Larkin 1999). Gebauer (2000) assigned ratings for amphibian diversity based on occurrence records in the Bog and on habitat preferences of amphibian fauna (Figure 4.28). Permanent ponds and riparian western redcedar forests are believed to constitute habitat for the greatest diversity of amphibian species. These habitats provide breeding habitats (i.e., ponds) and likely play an important role in the dispersal of juveniles and adults (Gebauer 2000). The limitations to Knopp and Larkins' (1999) study include the short duration of their survey and the lack of seasonal data and observations to indicate annual variations in species occurrence. Their observations concerning habitat use in the Bog were also limited. Keeping these limitations in mind, it is not possible to rule out the occurrence of other amphibian and reptile species which may reasonably be expected to occur.

136
Figure 4.27 Location of sightings of native amphibian species and reptiles in the Burns Bog study area during the late summer and early fall of 1999.

137
Figure 4.28 Terrestrial Ecosystem Mapping of habitat suitability for amphibian diversity in the Burns Bog study area.

138
4.3.2.5 Fisheries
M.A. Whelen and Associated Ltd. (1999) investigated fish occurrences during the late summer at sites located within and around the Bog. Most of the sampling efforts took place within the central portion of the study area, with the remainder occurring in sloughs, ditches and creeks of the study area periphery. The study focused on the question of the occurrence of fishes within the core of Burns Bog because little was known about fish within typical bog habitats or about connections between Burns Bog and known adjacent fish-bearing waters (M.A. Whelen and Associates Ltd. 1999). Previous studies were also reviewed. M.A. Whelen and Associates Ltd. (1999) also assessed water quality and fish habitat with respect to the potential of the Bog to support fish.
Water Quality and the Potential to Support Fish Surface water quality measured during September 1999, generally indicates central bog water to be warm (mean temperature of 19.6°C, with a range of 16.6-25.5°C), moderately to highly acidic (mean pH of 4.7, with a range of 3.9-6.5), and having low levels of dissolved oxygen (mean dissolved oxygen of 4.4 mg/l, with a range of 1.0-8.0 mg/l) (M.A. Whelen and Associates Ltd. 1999). Water bodies at the periphery of the study area are cooler (mean temperature of 16.3°C, range of 14.8-17.7°C) and less acidic (mean pH of 6.7, range of 3.9-7.2). Dissolved oxygen levels in the peripheral water bodies are also low (mean dissolved oxygen of 4.1 mg/l, range of 0.6-7.1 mg/l). According to M.A. Whelen and Associates Ltd. (1999), the comparatively higher pH and lower surface water temperatures at most peripheral sites are believed due, at least in part, to freshwater inflow, groundwater influence and tidal flushing (i.e., the Fraser River and local drainage ditches). Bottom water temperatures are generally 1-3°C cooler than at the surface, and bottom dissolved oxygen levels average 20% of surface values (M.A. Whelen and Associates Ltd. 1999). Maximum water depths range from 0.2-2.5 m at central study area sites, and from 0.3-2.0 m at peripheral sites. Water samples from the centre of the Bog (four sites) have low total alkalinity (less than 5 mg/l CaCO3), which M.A. Whelen and Associates Ltd. (1999) note is indicative of low buffering capacity. Total dissolved solids also exhibit low values (range of 81-113 mg/l), an indication of low amounts of fine inorganic and organic particulate matter. The water temperatures recorded at most sites during the late summer/early fall of 1999 are near the upper limits but not lethal for sustained salmonid production (Sigma Environmental Consultants Ltd. 1983). They are, however, suitable for other fish such as minnows and sculpins (see M.A. Whelen and Associates Ltd. 1999). Lower water temperatures probably prevail at these sites during other times of the year. Dissolved oxygen levels of less than 6.0 mg/l cause stress in juvenile salmonids (CCME 1996), and values of less than 4.3 mg/l can kill much of a population after prolonged exposure (Sigma Environmental Consultants Ltd. 1983). Dissolved oxygen levels at some sites in the Bog during September of 1999 were extremely low and would kill fish. Furthermore, low pH values at some sites may also limit fish. pH values of less than 5.0 are known to be harmful to most fish species (M.A. Whelen and Associates Ltd. 1999), and values of 4.5-5.0 are likely to harm eggs and fry of salmonids. The threespine stickleback (Gasterosteus aculeatus), however, tolerates waters with low pH values (Reimchen 1992, as cited in M.A. Whelen and Associates Ltd. 1999).

139
Considering these conditions, the water quality of some sites during September of 1999 was not adequate to support fish populations. In many other sites, the water quality was sufficient to support fish, particularly those more tolerant of low pH waters. Further studies are required to establish whether fish occur in unsuitable sites during the wet, cool winter and spring months when dissolved oxygen values are likely higher and temperatures lower.
Potential Fish Habitat Fish habitat quality (spawning, rearing and overwintering) varies widely from poor to good throughout the study area. M.A. Whelen and Associates Ltd. (1999) concluded that sites with water depths greater than 0.7 m, having functional fish cover, provided good rearing habitats. The most abundant type of fish cover included in-stream vegetation, followed by over-stream vegetation, deep pools and large woody debris (M.A. Whelen and Associates Ltd. 1999). Peat substrates predominate (65% of sites), but mud and compact organic substrates (26% of sites) also occur. Gravel or fine mineral substrates occur less frequently (9% of sites) (M.A. Whelen and Associates Ltd. 1999). Substrates suitable for spawning by most salmonids were observed at three sample sites on the northern periphery of the Bog. Mud and/or compact organic substrates, suitable for some minnows, catfish and stickleback spawning, occur at nine peripheral sites (M.A. Whelen and Associates Ltd. 1999).
Fish Occurrence M.A. Whelen and Associates Ltd. (1999) did not capture any fish from sites within the core of the Bog, although DeMill (1994) reported the occurrence of the threespine stickleback from the same area. M.A. Whelen and Associates Ltd. (1999) attributed the absence of fish within the central Bog ponds and ditches to isolation from peripheral fish-bearing waters and low pH values. Though no fish were detected during September, some sites connected to peripheral water courses may have fish during other times of the year. Fish were detected at most sites within the study area periphery (M.A. Whelen and Associates Ltd. 1999). One hundred and thirty-six specimens, comprising seven species, were captured during the 1999 survey. In order of abundance, the species included carp (Cyprinus carpio), threespine stickleback, northern squawfish (Ptychocheilus oregonensis), prickly sculpin (Cottus
asper), brown catfish (Ameiurus nebulosus), pumpkinseed (Lepomis gibbosus), and goldfish (Carassius auratus). Previous studies reported similar and additional species from the Bog's periphery and associated watercourses (DeMill 1994; DeMill and Paulik 1997). Coho salmon (Oncorhynchus kisutch), chum salmon (Oncorhynchus keta), cutthroat trout (Oncorhynchus clarki clarki) and rainbow trout (Oncorhynchus mykiss) were reported from Northeast Interceptor Canal and Watershed Park drainages. Western brook lamprey (Lampetra richardsoni) has been observed in Blake Creek. Chum and other unidentified salmonids occur in drainage ditches along River Road near their respective confluences with the Fraser River. Brassy minnow (Hybognathus hankinsoni), a provincially blue-listed species, was reported to occur in the Crescent Slough drainage area and in a bog ditch near the intersection of Highway 91 and 72nd Avenue. Peamouth chub (Mylocheilus caurinus), black crappie (Pomoxis nigromaculatus) and cutthroat trout were seen in Crescent Slough (Anonymous 1983).

140
The limited duration of M.A. Whelen and Associates Ltd.'s (1999) study made it impossible to shed light on seasonal fish use of peripheral drainages and the extent of intrusion of fish into the central part of the Bog. Previous studies determined fish assemblages in the winter and spring (Anonymous 1983) and early summer (DeMill 1994) primarily in the bog periphery, but little work has been done in the core of the Bog. Higher water levels increased precipitation and dissolved oxygen, and lower water temperatures during winter and spring may increase the abundance of fish and change the species assemblages in the study area. More work is required to describe annual variation of the composition and characteristics of the fish fauna.
Connections to Fish-bearing Waters A preliminary assessment of the connections of the study area to fish-bearing waters was completed by M.A. Whelen and Associates Ltd. (1999) (Figure 4.29). Watercourses in the south-eastern study area (i.e., Lorne Ditch and Watershed Creek) are collected in Big (Robertson) Slough and discharged into Mud/Boundary Bay via the Oliver Pump Station (Figure 4.29). M.A. Whelen and Associates Ltd. (1999) believe that the Oliver Pump Station may present a partial barrier to downstream migration of juvenile salmonids and upstream migration of spawning trout during spring freshets when the pump is operational. The presence of adult coho salmon, observed in Watershed Creek and Lorne Ditch drainages in previous investigations, indicates that the pump station does not completely prevent such migrations. Sloughs and ditches in the southern part of the study area (Centre Slough, 80th Street and 88th Street ditches) are collected in Beharrel Ditch and discharged into Boundary Bay via the Beharrel Pump Station (Figure 4.29). No salmon were captured in the associated drainages, possibly because the Beharrel Pump Station prevents salmonid migrations or because habitat quality within those ditches and sloughs is insufficient to sustain salmon (M.A. Whelen and Associates Ltd. 1999). Most waterways within the western part of the study area drain into Crescent Slough prior to discharging into the Fraser River via the MacDonald Pump Station (Figure 4.29). The historical occurrence of small numbers of juvenile cutthroat trout in central Crescent Slough (Anonymous 1983) implies that the pump station was passable at one time and that Crescent Slough likely provided useable rearing habitat. Since no salmonids of any age were encountered by M.A. Whelen and Associates Ltd. (1999), the pump station may now be impassable or the habitat quality within Crescent Slough inadequate to sustain salmon. The role of the Tilbury Pump Station as a fish barrier was not investigated (M.A. Whelen and Associates Ltd. 1999). Water that drains the study area to the north (i.e., through Burns Bog Ditch, 80th Street Ditch and several unnamed ditches) is collected at three primary locations along River Road – the 80th Street floodbox, 84th Street outfall, and the Gravel Pump Station (Figure 4.29). The 96th Street ditch, upstream from the Gravel Pump Station, is accessible to juvenile salmonids as observed by DeMill (1994). Adult salmon may only move into the ditch from the Fraser River at high water periods because of the shallow water in the culverts during low tide (M.A. Whelen and Associates Ltd. 1999).

141
The Northeast Interceptor Canal collects stream (i.e., Blake Creek and Cougar (Canyon) Creek drainages) and storm discharge from Sunshine Hills and other parts of North Delta adjacent to Burns Bog, prior to emptying into the Fraser River via the interceptor floodbox located near the intersection of 104th Street and River Road (Figure 4.28). The floodbox is not believed to prevent salmon movements (M.A. Whelen and Associates Ltd. 1999). The canal mostly collects and drains discharge from the creeks to the north-east, but M.A. Whelen and Associates Ltd. (1999) note that fish may be introduced periodically into eastern Burns Bog ditches from the salmonid-bearing Cougar (Canyon) Creek and Blake Creek during overbank floods. M.A. Whelen and Associates Ltd. (1999) concluded that the fish species composition and diversity within the study area is similar to that reported for other lower Fraser River tributary floodplains (e.g., Healey 1997).

142
Figure 4.29 Connectivity of sloughs and ditches associated with Burns Bog drainage to major fish producing water bodies.

143

143
5.0 Results of Integration Studies
5.1 Introduction
The individual biophysical elements described in Section 4.0 provide insight into the pieces that make up the Burns Bog ecosystem. The Review is concerned with the ecological viability of the bog ecosystem complex as a whole, not just its pieces. The pieces are linked through ecosystem processes. It is important to know where these processes occur in the study area and how they are connected to the surrounding landscape. The nature and functioning of these processes can be investigated and understood by relating the distribution of species to factors such as disturbance and regeneration. These two processes are directly linked to the potential for sustaining the Bog. Recognizing that the Bog has already been disturbed by human activity, the topic of restoration is also considered (Sims et al. 2000a). An analysis of ecosystem health or integrity (e.g., Karr 1993; Rapport et al. 1996; Sims et al. 2000b) is another way to gain insight into the condition of an ecosystem and what is required to maintain ecological viability. Ecosystem integrity analysis techniques are in the early stages of development; nevertheless, specific ecosystem attributes, such as hydrology, can usefully be examined. Burns Bog plays an important regional ecological role by providing habitat for rare species and ecosystems and by providing corridors and refuges for wide-ranging species. It also contributes to provincial, national and global biodiversity. Understanding those roles helps provide insight into the Bog’s ecological processes and its links to adjacent ecosystems, populations, biodiversity, and processes in general. The regional and global comparisons help identify those unique characteristics of the Bog which must be maintained. Regional and global comparisons help determine where Burns Bog fits on a larger scale and indicate whether it is unique in a global context.
5.2 Ecosystem Processes
Bogs, and raised bogs in particular, are characterized by well-defined ecological processes such as peat accumulation and decomposition. Hydrologic processes, in particular, play a primary role in bog ecology. These processes are modified by plant communities through the peat-forming mechanism. The maintenance of such processes is critical to ecosystem sustainability (Sims et al. 2000a). These processes were investigated through studies of disturbance, Sphagnum regeneration, plant and animal indicators and tree-ring patterns.
5.2.1 Disturbance
Disturbance of plant and animal communities results in changes in ecosystem processes. The changes can be described, mapped and related to a specific cause. Some disturbances are on-going normal features of the ecosystem (see Section 1.0) whereas others are not. The nature, location, and extent of disturbed vegetation within the study area provide insight into where

144
critical hydrologic and biotic processes are potentially at risk, a risk that threatens the viability of the bog ecosystem. Furthermore, knowing the patterns of bog development and the successional status of bog communities helps in the analysis of the potential for recovery and the time required. Burns Bog has been subject to many types of disturbance (Table 5.1) ranging from a major landfill to minor compaction and trampling. These disturbances affect many ecosystem components including hydrology, soil development and function, plants and animal life. It is important to note that disturbance occurs not only in the Bog. The Bog itself is largely surrounded by heavily disturbed ecosystems such as the City of Vancouver landfill and adjacent agricultural fields (Madrone Consultants Ltd. 2000). Disturbance of the surrounding lands also affects the Bog by changing hydrology and water chemistry, and providing a source of exotic species (Barendregt et al. 1995; Heathwaite 1995)
Table 5.1 Disturbance types in Burns Bog (Madrone Consultants Ltd. 2000). See Appendix H for an explanation of peat harvesting methods.
disturbance total area
(ha) % of the
study areagrouping for hydrology
discussion
abandoned railway line 29.9 1.0 landfill cultivation 79.9 2.7 minor soil disturbance fire 136.2 4.6 fire forest harvesting 92.0 3.1 land clearing
gas and power lines 52.9 1.8 land clearing land clearing (bog) 40.0 1.3 minor soil disturbance landfill (including abandoned peat plants and some roads)
30.0 1.0 landfill
peat excavation 1164.35 39 minor soil disturbance for hand cutting and vacuum method; major soil disturbance for hydropeat methods.
trails (includes old vehicle tracks, old boardwalks, and current recreational trails)
81.9 2.7 minor compaction
roads (wood chip surface) not estimated
<2 (estimated)
landfill
ditches 12 0.4 water management invasive plant species total area of
polygons containing invasive plants
not estimated
n/a

145
5.2.1.1 Peat Harvesting and Ditches
Over 57% of the study area has been disturbed on a scale large enough to be mapped using polygons (Figure 5.1). Disturbances too small to map in polygons (roads, trails) have impacted much of the remaining area of Burns Bog. Peat extraction has affected nearly 40% of the Bog (Table 5.1) (see Appendix H for peat harvesting methods). Plant cover was removed and parts of the soil profile, including the acrotelm and upper layers of the catotelm, were destroyed. Disturbance of the soil profile changed the physical and chemical characteristics of the soil sufficiently to affect its classification in parts of the Bog (AGRA Earth & Environmental Limited 1999b). Excavation of ponds and ditches altered local hydrology drastically by changing topography. The excavated ponds and ditches have altered storage capacity and evaporation, which directly affect the water balance. Ridges, left behind by peat mining, are now much drier than they would have been prior to disturbance. Perhaps the most damaging impact has been the removal of the acrotelm, the layer that regulates hydrology, directly contributes to peat formation and ensures the long-term sustainability of the Bog by maintaining hydrological and peat-accumulation processes. Excavated areas have lost their original vegetation. Where patches of original vegetation remained between excavated area, these remnants have served as a source of propagules (spores, seeds, bits of plant) that have colonized the bare peat surface. On many sites, bog plant species including Sphagnum mosses and heaths, have begun the process of acrotelm formation. In deeply excavated areas, aquatic habitats have been created, in some ways similar to, but much larger and often deeper, than the small ponds that once dotted the centre of the Bog. These new ponds are occupied largely by native species especially yellow waterlily and watershield, although some also support tawny cotton-grass (see Section 4.3.1). White beak-rush, three-way sedge and Sphagnum tenellum have colonized vacuum-harvested fields. Peat harvesting has converted relatively uniform, wet heathland vegetation into a complex of pools, lawns, heath and scrub habitats. Piles of tree roots provide habitat for plants and shelter for wildlife. Some wildlife species, such as Black Bear, have lost habitat, but others, especially waterfowl, have gained habitat. For example, nesting sites on islands in ponds have likely become more abundant. The increase in size and number of water bodies has likely benefited beaver and muskrat, now commonly reported in the Bog (Madrone Consultants Ltd. 2000). White beak-rush-Sphagnum communities, covering sites mined by dredging, now provide habitat for Greater Sandhill Crane. Ditching has also disturbed the study area. Ditches directly disturb plant communities and soil in a manner similar to, but on a scale smaller than peat excavation. Ditches, however, have a wide-ranging impact on hydrology throughout the Bog (see Section 4.2.5.3). Locally, ditches create an adjacent zone of more rapid lateral flow than normal resulting in a lower water table nearby (Helbert and Balfour 2000). Furthermore, they directly channel water away from the Bog rather than leaving it to exit the Bog by slow interflow through the acrotelm. Some ditches extend well into the catotelm and, hence, have altered the hydrologic, physical and chemical properties of this zone. Beavers also build dams in ditches, thereby influencing the hydrology over an area much greater than that directly impacted by the ditch.
146
Ditches excavated throughout the Bog have led to lower average water table depths over extensive areas (see Section 4.2.5). The lower water table has contributed to the expansion of shrubby and forested plant communities in sites where the vegetation and peat surface were not physically disturbed (Sims et al. 2000a) (Section 5.2.4). The lower water table, especially in the vicinity of a ditch, causes increased aeration followed by increased decomposition and settling of the ground surface (Armentano and Menges 1986). A lower water table leads to changes in soil porosity and water chemistry, including increases in nutrient levels (Gorham 1956; Braekke 1981; Madrone Consultants Ltd. 2000). The most important effect of the ditches throughout Burns Bog has likely been to lower the average water table, with the greatest change occurring at the Bog's margins. The lower water table has led to the development and expansion of forest ecosystems such as Birch-Salal and Lodgepole pine-Salal (Hebda and Biggs 1981; Madrone Consultants Ltd. 2000; Sims et al. 2000a). These hydrologic and habitat changes reduce the extent and quality of the environments occupied by the unique bog-dependent invertebrate fauna (see Section 4.3.2.3). On a local scale, ditches have provided an opportunity for the expansion of rice cut-grass, a blue-listed species. The large extent of open water in ditches has increased waterfowl habitat. On the other hand, expansion of forest habitats has likely reduced Greater Sandhill Crane habitat. Forest dwellers, such as juncos and the Southern Red-backed Vole, may have benefited as a result of increased forest cover (Madrone Consultants Ltd. 2000). Ditches may have provided corridors for the invasion of exotic species, especially the American Bullfrog and Green Frog because of the accompanying increase in permanent deep water.

147
Figure 5.1 Distribution of disturbance types in Burns Bog.

148

148
5.2.1.2 Fire
Fires disturbed Burns Bog many times in the past (Osvald 1933; Hebda 1977) and played a role in the natural dynamics of Sphagnum communities (Banner et al. 1988). First Nations may have used fire to increase cranberry yields (Turner 1975). In recent decades, human-caused fires have burned widely in the study area (Hebda 1977; Madrone Consultants Ltd. 2000). In the last decade, 136.2 ha, or 4.6% of the Bog burned during three widely-distributed fires. Direct impacts of fire on bog hydrology are relatively minor. The burned area temporarily transpires less because plant cover has been removed. This results in the water table rising (Madrone Consultants Ltd. 2000). When the peat and Sphagnum burn, depressions are created (Banner et al. 1988, Figure 8-26). More water may be contributed to discharge because less is transpired. Fires also convert the nutrients tied up in biomass into forms readily available for uptake by plants. The nutrients are not likely leached out of bog ecosystems, but used by recolonizing or regenerating plants that sprout after the disturbance. Fires also alter the peat accumulation rate and lead to nutrient concentration (Damman 1987). Depending on the intensity, fires destroy a part of the acrotelm and eliminate much of the peat-forming Sphagnum community (Damman 1987; Banner et al. 1988). Shrub species, whose underground parts survive a burn, resprout as a consequence of fertilization and locally altered hydrology (Banner et al. 1988). Plant community composition changes following a fire (Zoltai 1998) and species thrive that are not typically favoured in the bog ecosystem complex. Madrone Consultants Ltd. (2000) note that the growth of spiny wood fern is widespread in older burned areas in the eastern parts of Burns Bog. Birches colonize and grow rapidly (Hebda 1977; Madrone Consultants Ltd. 2000). Included among the colonists are exotic invaders such as European birch. Wool-grass, common rush, Labrador tea, salal and velvet-leaf blueberry respond with vigorous growth. Haircap mosses grow widely at first but eventually Sphagnum species return. For the most part, burned tracts in the Burns Bog are returning to drier Pine-Sphagnum (LS) ecosystems, changing from the wetter White beak-rush–Sphagnum (RS) plant association observed in earlier times by Hebda (1977). Fires kill both vertebrate and invertebrate wildlife. Martin (1999) noted significant changes in the bird community after a fire in Burns Bog in 1996, including a reduction in the number of bird species and their abundance. Burned snags provided new habitat for woodpeckers and post-fire shrub thickets provide nesting opportunities for small birds (Madrone Consultants Ltd. 2000).
5.2.1.3 Landfill
Landfills range from extensive areas covered by municipal waste and construction debris to former peat plant sites on mineral fill, to linear transportation corridors such as roads and abandoned railways on hog-fuel. Fill sites occur mainly along the northern and south-west borders of the Bog (AGRA Earth & Environmental Limited 1999c), but also extend far into the central areas (Madrone Consultants Ltd. 2000). Landfill disturbance of various kinds occupies about 4% of the current extent of the Bog (Table 5.1), but has alienated a much greater area of the original Bog (Section 4.2.5.4).

149
Landfills create sites that are higher than the surrounding ground and are composed of materials different from the surrounding peat. Consequently, landfills shed water of very different chemical composition into adjacent bog ditches and ecosystems. The impact of leachate from fill varies according to composition of the fill material. Almost invariably, leachate affects water chemistry. Landfills also have a physical effect on the bog. Peat below a landfill is compressed by the weight of the fill. This creates a barrier to the normal interflow process of water in bogs (Helbert and Balfour 2000; Madrone Consultants Ltd. 2000). The fill creates a depression around it and concentrates flow away from it. A different type of soil surface develops on the fill with different characteristics than are normally found in bogs. Landfills eliminate bog vegetation and host non-bog species, many of which are introduced. Typically, the flora is dominated by species of weedy urban habitats (Madrone Consultants Ltd. 1999). Even if the surface of the landfill is reclaimed, the site is alienated permanently from bog vegetation. Destruction of bog vegetation eliminates habitat (Pfadenhauer and Klötzli 1996) for bog animal species and favours non-bog animals. Landfills, especially the City of Vancouver landfill, benefit scavenging species such as crows, gulls, coyotes and bears (Madrone Consultants Ltd. 2000). Once capped, the landfill site may provide new open upland habitat for birds such as Savannah Sparrow and Horned Lark, but this is at the cost of specially-adapted bog species. The old railway lines for transporting harvested peat in the north-east part on the Bog were constructed largely of hog-fuel and other organic based fill. Birch-Salal (BS) woodland has developed on the rail line and now provides nesting sites and habitat values for a variety of birds and snakes (Madrone Consultants Ltd. 2000). Bears and other mammals likely use the linear raised corridors for easy travel through the Bog (McIntosh and Robertson 1999). The railroad system and several roads (i.e., 80th Street extension) provide pathways for invasion by introduced species. For example, both species of introduced blackberry now grow on roadways that reach well inside the Bog. Coyotes and humans have relatively easy access to sites well within the Bog. Easy access has likely led to increased hunting and predation pressure and disturbance of sensitive species such as the Greater Sandhill Crane (Gebauer 1999b; Madrone Consultants Ltd. 2000).
5.2.1.4 Clearing
Selective to complete removal of natural vegetation has occurred in at least 6.2% of the study area in addition to sites excavated for peat (Table 5.1). Clear-cut and selective logging in the original forests east of Highway 91 have led to the current cover of young mixed forest interspersed with old growth trees (Gedalof 1999; Madrone Consultants Ltd. 2000). Brush has been removed from powerline rights-of-way. A 40 ha plot of bog vegetation was cleared in 1999 in preparation for cranberry farm development. Machinery used in the clearing process causes compaction of the peat surface, reducing the porosity of the acrotelm. If the compacted and depressed zone covers a narrow area (e.g., a machine track), it may act as a barrier to interflow (Madrone Consultants Ltd. 2000). As in disturbance by fire, the removal of vegetative cover may lead to more rapid run-off and generally a higher water table at the site (Roy et al. 1997). The removal of plant biomass permanently
150
exports nutrients from the nutrient-poor ecosystem. In the case of the clearing for cranberry fields, the fibrous acrotelm has been removed, leading to severe alteration of normal hydrologic processes. Clear-cut logging east of Highway 91 has led to the development of red alder stands where old-growth conifers once grew (Hebda and Biggs 1981). Coniferous stands of mixed age have replaced older stands in selectively logged areas and probably opened the understorey to more vigorous growth of shrubs. Under power lines, the effects of clearing vary. In many places, hardhack thickets have grown in response to clearing, probably associated with compaction. Along the BC Gas line (72nd Street) on the west side of the Bog, Pine-Sphagnum vegetation appears to be regenerating, perhaps because the disturbance was of low intensity. The vegetation patterns in the utilities corridor across the northern part of the study area are complex, likely because a mix of clearing and other types of disturbance have occurred (Madrone Consultants Ltd. 2000).
5.2.1.5 Cultivation
Cranberry and blueberry fields cover 2.7% of the study area and also occupy an extensive zone that was once bog habitat in the north-west sector of the Bog (compare Figure 4.18 to Hebda and Biggs 1981; Madrone Consultants Ltd. 1999). Preparation for both crops involves removal of original bog vegetation and the acrotelm. Preparation substantially alters site hydrology by reducing interflow, increasing drainage to ditches and creating depressions. Soil preparation and cultivation leads to increased aeration of the lower peat layers and further decomposition, a process likely exacerbated by the addition of fertilizers. Cultivated fields have also become centres of invasion for plants from eastern North American wetlands (Table 5.2). The water table is manipulated by pumping water in and out (Helbert and Balfour 2000). Generally, cultivated fields have low habitat diversity and low wildlife use. However, waterfowl use ditches and flooded fields. A variety of bird and mammal species forage on berries. The impact of agricultural pesticides on the fauna, especially insects, is unknown, but may be a potential negative factor in long-term persistence of bog organisms (AGRA Earth & Environmental Limited 1999c).

151
Table 5.2 Invasive and potentially invasive plant species of Burns Bog (adapted from Madrone Consultants Ltd. 2000).
scientific name common name status
Betula pendula European birch This species has formed clumps in drier areas of the Pine-Sphagnum heath (LS) within Burns Bog. In some places it becomes co-dominant with paper birch in the Birch-Salal (BS) stands. The other introduced species, Betula pubescens, has a scattered occurrence in areas regenerating after peat extraction, but it is not as invasive as Betula pendula.
Campylopus introflexus
bog loosestrife This moss, introduced from the southern hemisphere, was first reported in Canada from Burns Bog (Taylor 1994; Taylor 1997). In North America, it has been previously recorded in Oregon and California (Schofield 1997), while in Europe it has spread in the oceanic part of Europe to become a serious invader of coastal dunes and heathlands (Equihua and Usher 1993).
Eriophorum virginicum tawny cotton-grass
Taylor (1994) recently made the first report of this species in Burns Bog. It is now a common plant in areas where mechanical peat extraction has taken place. In some areas, it forms extensive stands with Juncus bulbosus, underlain by a carpet of Sphagnum pacificum. In other areas, it is noticeable above a ground cover of white beak-rush and Sphagnum tenellum. When Eriophorum virginicum occurs in the more natural white beak-rush wetlands and Labrador tea heath, its distribution is scattered.
Hypericum boreale northern bog St. John's-wort
This species, along with Triadenum fraseri, has become established in Burns Bog along ditches.
Juncus canadensis Canadian rush This rush is relatively rare in Burns Bog, but it can be invasive in wet habitats. It is most noticeable in the areas where peat was extracted and the roots were then piled into heaps in the north-central part of the Bog. The rush forms dense stands in the wet pockets around the piles of roots in White beak-rush-Sphagnum units. Within the Lower Mainland, it also occurs along the Pitt River.

152
Table 5.2 (continued) Invasive and potentially invasive plant species of Burns Bog (adapted from Madrone Consultants Ltd. 2000).
scientific name common name status
Juncus pelocarpus brown-fruit rush This rush is a dominant species in stands around the margins of ponds created by mechanical peat extraction in Burns Bog. These occur in the White beak-rush-Three-way sedge units.
Lysimachia terrestris bog loosestrife This species has been observed in one stand near a recently established cranberry plantation in the north-west corner of Burns Bog. This is a species that may become an invader in wetlands of the coastal parts of British Columbia. It has all it needs for rapid invasion – it can produce numerous seeds and it has plenty of vegetative buds that can facilitate its spread. Lomer (1995) reported it from other places in Greater Vancouver: “Widespread, but not common, and not restricted to cranberry fields: Coquitlam, Lulu Island, and Annacis Island.”
Oxycoccus macrocarpus
large cranberry The cultivated cranberry is spreading in disturbed excavated areas of Burns Bog and has also become established in some relatively undisturbed areas of the White beak-rush-Sphagnum ecosystem unit. This domestic species occurs in the same habitat as the native Oxycoccus palustris and may pose a threat to it.
Rubus armeniacus Himalayan blackberry
This species is restricted to disturbed areas along the roads and dykes in Burns Bog.
Rubus laciniatus evergreen blackberry
This species has become a common component of Birch-Salal stands of Betula papyrifera and Betula pendula in Burns Bog.
Triadenum fraseri Fraser's marsh St. John's-wort
This species, along with Hypericum boreale, has become established along ditches and in areas where peat was harvested by the hydraulic suction technique.
Vaccinium corymbosum
highbush blueberry
The cultivated blueberry is spreading into the relatively undisturbed Pine-Sphagnum heath areas on the west side of Burns Bog and occurs in the regenerating heath to the north of the Bog where mechanical peat extraction has taken place. This invasion may pose a threat to the native blueberry species Vaccinium uliginosum and Vaccinium myrtilloides.

153
5.2.1.6 Other Disturbances
Many tracks and trails cross the study area, creating diffuse but widespread disturbance (Madrone Consultants Ltd. 2000). For example, all-terrain vehicle tracks mark the southern relatively undisturbed parts of the Bog. Trails follow old survey lines and ditches into the Bog. Old boardwalks remain among peat workings in the central Bog. Tracks and trails in the main part of the Bog cause compression and erosion of the acrotelm, and cause the substrate to be wetter than normal. Sphagnum species colonize and expand on some of these sites, often within otherwise shrubby plant communities (Madrone Consultants Ltd. 2000). Trail and track margins often foster profuse growth of round-leaved sundew. On the other hand, trails in the drier forested zone east of Highway 91 have become sites for the invasion and growth of exotic species rather than peat-forming species (Madrone Consultants Ltd. 2000). Tracks and trails provide corridors for the movement of wildlife, especially predators such as coyotes. Feral cats and dogs likely have used the trails in the eastern part of the study area to prey on native mammals, possibly leading to the local decline of some species (Madrone Consultants Ltd. 2000).
5.2.2 Exotic Species
Invasive animals and plants, comprising of mostly exotic species (species from outside the region), have the potential to degrade ecosystems and threaten ecological integrity. The flora of the study area hosts a relatively high percentage of invasive plant species in particular (see Section 4.3.1). Madrone Consultants Ltd. (2000) assessed the current distribution and potential impact of the most abundant or potentially troublesome species (Table 5.2). The six plant species from Burns Bog, that are listed as noxious weeds by Cranston et al. (1996), do not pose a serious threat to the Bog because they thrive mainly in non-bog habitats (Madrone Consultants Ltd. 2000, Table 2 and p.12). There are, however, 12 invasive plant species in the Bog that can grow on peaty and moist substrates (Table 5.2). Four of these species (European birch, evergreen blackberry, highbush blueberry and tawny cotton-grass) rank high in Madrone Consultants Ltd.’s (2000) analysis of potential impact. Brown-fruit rush and large cranberry have been given medium rating for potential impact (see Madrone Consultants Ltd. 2000 for rating criteria). European birch occurs widely in the Bog. It contributes to Birch-Salal (BS) vegetation, which has developed as a result of disturbance and appears to have invaded and spread rapidly since the mid 1970s. It has changed the composition and structure of the Pine-Sphagnum ecosystem (PS) (Madrone Consultants Ltd. 2000). Peat formation takes place mainly in this community and the widespread invasion by birch may affect this vital bog process. For example, birch may change the ecological conditions on the ground (e.g., by shading and smothering Sphagnum with dead leaves), leading to the decline of Sphagnum. Evergreen blackberry predominates in the shrub stratum of some birch (BS) stands around the bog periphery (Madrone Consultants Ltd. 1999). It occupies better-drained settings along abandoned railroad lines and other fill sites within the Bog. The arching and scrambling

154
branches overwhelm native shrubs such as salal and hardhack. It posses a threat to the BS ecosystem but is not likely to invade intact bog communities (Madrone Consultants Ltd. 2000). Highbush blueberry has dispersed from cultivated fields and now grows in seven plant communities in the study area. Although it has relatively low cover values, this blueberry has invaded undisturbed ecosystems, particularly the Lodgepole pine-Sphagnum (LS) type. Highbush blueberry has the potential to displace native bog blueberry species and even Labrador tea. In an abandoned field south of the study area, highbush blueberry forms a 2 m high shrub canopy under which little else grows (Madrone Consultants Ltd. 2000). Tawny cotton-grass has invaded the Bog recently (Taylor 1994) and spread rapidly and widely (Madrone Consultants Ltd. 2000). It now dominates some regenerating sites where White beak-rush-Sphagnum (RS) communities would normally be expected to grow. It also forms dense stands in the shallow water of peat working ponds in the western part of the Bog. The long-term impact is difficult to assess, but its rapid spread and rise to dominance at some sites, and the visual impact suggest a significant potential threat to typical bog species. Like the highbush blueberry, large cranberry has dispersed from cultivated fields. It has similar ecological requirements to the native bog cranberry and has the potential to displace this species. For the time-being, it thrives in disturbed wet sites but has the potential to predominate in regenerating peat workings. At Langley Bog, it is dominant beneath native vegetation in undisturbed high ground between harvested areas (Golinski 2000). Brown-fruit rush occupies a narrow niche in shallow standing water at the edge of large ponds resulting from disturbance. The species may eventually be displaced as peat-forming bog communities such as LS and RS re-establish (Madrone Consultants Ltd. 2000). Five exotic animal species occur in the main part of the Bog and likely have impacted the native fauna. The abundant and highly predatory American Bullfrogs have likely reduced populations of other amphibians (Keisecker and Blaustein 1998; Lawler et al. 1998) and perhaps affected birds and small mammals. Green Frogs are extremely abundant and their occurrence apparently leads to the decline of native frog species such as the Red-legged Frog (Knopp and Larkin 1999). North American Opossum preys on small vertebrates and invertebrates, and takes bird eggs (Nagorsen 1996); thus, it has the potential to negatively affect native species. Eastern Grey Squirrel and Eastern Cottontail have the potential to displace native species of small mammals.
5.2.3 Dynamics of Indicator Species
Certain plant and animal species, because of their key role in an ecosystem (Mills et al. 1993), relatively narrow ecological requirements, or sensitivity to specific ecological changes, are useful as indicators of ecosystem dynamics or changes (Pearson 1994; Sims et al. 2000a). Indicator species are particularly useful in bogs because the atypical hydrologic and chemical conditions require special adaptations. For the purpose of the Burns Bog Ecosystem Review, patterns of Sphagnum moss regeneration, and changes in the distribution and abundance of selected animal and plant species were explored as indicators of ecological change (Madrone Consultants Ltd. 2000).

155
5.2.3.1 Sphagnum Regeneration
Sphagnum species are widely recognized as keystone species for bogs (Malmer et al. 1994; van Breemen 1995; Wheeler and Shaw 1995) because they are vital to peat-formation and raised bog growth. Burns Bog provides an exceptional opportunity to examine the dynamics of Sphagnum species, especially the issue of regeneration because there are surfaces of known different ages that can be related to disturbance type (DeMill 1999c). Consequently, Sphagnum regeneration can be related to time and type of disturbance. A study of Sphagnum growth also answers the question of whether or not regeneration is occurring and at what rate. Madrone Consultants Ltd. (2000) undertook a study of the rate and extent of Sphagnum regeneration in Burns Bog according to the following methods. Eighteen transects at sites representing different ages and types of peat excavation were sampled. Presence or absence of Sphagnum was scored at one hundred randomly chosen sites along each transect. The depth of the Sphagnum to the excavated surface was measured. Bulk density was determined for six samples from each transect, two each from the three different growth forms: hummock, mat and floating mat. In sites too wet to access, Sphagnum occurrence was estimated visually. Madrone Consultants Ltd.’s (2000) study revealed that there are six species of Sphagnum involved in colonizing all types of surfaces. These include Sphagnum capillifolium, S. fuscum,
S. pacificum, S. papillosum, S. rubellum and S. tenellum. Sphagnum cover values range from 1-97% and average 27% (Table 5.3) (Figure 5.2). The amount of cover varies according to the peat harvesting method. On sites excavated until the 1980s by the Western Peat Hydropeat Method and the vacuum (scratch) method (see Appendix H for explanation of harvesting methods), Sphagnum cover was relatively low (4-7%). Hand-cut areas have 16% Sphagnum cover. Sites excavated using the by the Atkins-Durbrow Hydropeat Method exhibit high Sphagnum cover (average 30%). On average, the regenerating peat layer is 15 cm thick. Dry biomass accumulation varies from 0 tonnes/ha on some sites mined by the vacuum and hydropeat methods to 9.34 t/ha on sites mined using the Atkins-Durbrow method between 1960-1969. The average accumulation rate is 3.17 t/ha at an annual rate of 0.13 t/ha. Sphagnum biomass has been increasing with time (Figure 5.3), but Madrone Consultants Ltd. (2000) noted a 3-year lag before Sphagnum colonized a bare surface. The results of the study are somewhat limited because only areas disturbed by peat mining were sampled. Furthermore, no measurements were made of environmental factors such as position of the water table. Nor was it possible to relate the regeneration to previous conditions at the site. For example, a specific site may not have supported Sphagnum before a disturbance occurred (Madrone Consultants Ltd. 2000).

156
Table 5.3 Sphagnum biomass and accumulation rates (AD=Atkins-Durbrow, WP=Western Peat) (Madrone Consultants Ltd. 2000). See Appendix H for explanation of peat-harvesting techniques.
method harvest
date range minimum time since
last harvested
(yr)
site number
sample type
approx. transect
length (m)
Number of
sampling points
proportion of remnant strips (% of sampling points on remnant strips)
predominant growth form of regenerating Sphagnum
proportion of regenerating Sphagnum in
harvested areas (% of sampling
points where Sphagnum
present)
mean depth of regenerating Sphagnum
(cm)
number of depths of regenerat-
ing Sphagnummeasured
regenerating Sphagnum
biomass (t/ha)
regenerating Sphagnum
accumul. rate (t/ha-1/yr-1)
AD Hydropeat
1941-48 51 4 transect 170 87 7 hummock and mats
51 18 10 4.37 0.09
AD Hydropeat
1941-48 51 12 visual - - - hummocks 50 15 0 7.38 0.14
AD Hydropeat
1949-52 47 18 transect 145 85 0 hummocks 32 13 10 5.45 0.12
AD Hydropeat
1949-52 47 13 visual - - - hummocks 30 15 0 4.43 0.09
AD Hydropeat
1957-63 36 3 transect 190 100 22 hummocks 76 27 10 6.24 0.17
AD Hydropeat
1957-63 36 11 transect 205 100 13 hummock and mats
32 19 10 2.60 0.07
AD Hydropeat
1963-66 33 10 transect 140 76 39 mats 50 8 10 5.42 0.16
AD Hydropeat
1963-66 33 6 transect 165 100 34 hummocks 44 23 10 4.24 0.13
AD Hydropeat
1963-66 33 5 visual - - - hummocks 15 20 0 1.66 0.05
AD Hydropeat
1966-69 30 1 transect 155 83 16 hummocks 97 23 10 9.34 0.31
AD Hydropeat
1966-69 30 9 visual - - - floating 5 20 0 0.06 0.00
AD Hydropeat
1966-69 30 2 visual - - - hummocks and floating
10 15 0 0.82 0.03
AD Hydropeat
1969-74 25 16 transect 170 95 26 hummock and mats
64 12 10 8.22 0.33
AD Hydropeat
1969-74 25 7 transect 180 100 27 hummock and mats
58 11 10 8.13 0.33
AD Hydropeat
1969-74 25 14 visual - - - hummocks 35 20 0 3.88 0.16

157
Table 5.3 (continued) Sphagnum biomass and accumulation rates (AD=Atkins-Durbrow, WP=Western Peat) (Madrone Consultants Ltd. 2000). See Appendix H for explanation of peat-harvesting techniques.
method harvest date range
minimum time since
last harvested
(yr)
site number
sample type
approx. transect
length (m)
Number of
sampling points
proportion of remnant strips (% of sampling points on remnant strips)
predominant growth form of regenerating Sphagnum
proportion of regenerating Sphagnum in
harvested areas (% of sampling
points where Sphagnum
present)
mean depth of regenerating Sphagnum
(cm)
number of depths of regenerat-
ing Sphagnummeasured
regenerating Sphagnum
biomass (t/ha)
regenerating Sphagnum
accumul. rate (t/ha-1/yr-1)
AD Hydropeat
1969-74 25 15 visual - - - floating 20 20 0 0.22 0.01
AD Hydropeat
1969-74 25 8 visual - - - floating 20 20 0 0.22 0.01
AD Hydropeat
1974-76 23 21 transect 100 44 20 hummocks 23 15 8 3.40 0.15
AD Hydropeat
1976-78 21 19 transect 195 100 19 hummocks 27 11 10 5.44 0.26
Hand Cutting 1941-48 51 23 transect 135 80 65 hummocks 32 13 9 5.45 0.11 Hand Cutting 1941-48 51 29 transect 165 100 58 - 0 0 0 0.00 0.00 Vacuum 1952-
57(80) 19 26 transect 145 83 0 - 0 0 0 0.00 0.00
Vacuum 1957-63(80)
19 27 transect 170 100 0 hummocks 1 7 1 0.32 0.02
Vacuum 1957-63(80)
19 24 visual - - - mats 30 4 0 6.50 0.34
Vacuum 1963-66(80)
19 28 transect 170 100 0 - 0 0 0 0.00 0.00
Vacuum 1963-66(80)
19 25 visual - - - hummocks 1 20 0 0.11 0.01
WP Hydropeat
1978-79 20 20 transect 175 100 0 hummocks 4 14 4 0.63 0.03
WP Hydropeat
1978-79 20 17 visual - - - floating 1 20 0 0.01 0.00
WP Hydropeat
1979-82 17 22 transect 170 100 2 mats 4 10 4 0.35 0.02
WP Hydropeat
1982-84 15 30 visual - - - floating 10 20 0 0.11 0.01

158
Figure 5.2 Sphagnum cover in Burns Bog.

159

159
Comparison to other bogs reveals that the rate of biomass accumulation of regenerating Sphagnum in Burns Bog is much less than the natural rate in unharvested peatlands (Elling and Knighton 1984). The rate is also less than that reported for a harvested bog in Minnesota. Notably, recovery of the harvested biomass in Burns Bog must take much longer than the 42 years estimated by Elling and Knighton (1984). It should be noted that little comparative regeneration data are available for bogs from the climatic conditions of the Pacific Coast of North America.
Figure 5.3 Sphagnum biomass accumulation in relation to time since peat harvesting. The line shows the linear regression fitted to the data, excluding outlier (biomass=0.1272 x time - 0.4271; R=0.4639; p <=0.01146; t=2.721; df=27) (adapted from Madrone Consultants Ltd. 2000). See Appendix H for an explanation of peat harvesting.
The major conclusions of the Sphagnum regeneration study are:
1. Sphagnum is accumulating and should continue to accumulate on disturbed sites in Burns Bog;
2. The rate of regeneration is strongly dependent on the peat mining method that caused the disturbance; and
3. Rates of regeneration are slower than those observed in other regions.
0
1
2
3
4
5
6
7
8
9
10
0 10 20 30 40 50 60
Minimum Number of Years Since Harvesting
outlier
Reg
en
era
tin
g S
ph
ag
nu
m P
eat
Bio
mass (
t/h
a)
Hand Cutting - TransectVacuum - TransectVacuum - VisualAD Hydropeat - TransectAD Hydropeat - VisualWP Hydropeat - TransectWP Hydropeat - VisualLinear Regression
Peat HarvestingSampling Methods

160
5.2.3.2 Other Indicators of Ecosystem Change
Changes in the distribution and abundance of both animal and plant species have the potential to provide insight into ecosystem dynamics and ecosystem integrity. Both can help answer questions such as whether true bog communities are shrinking, stable or expanding. Plant species-cover data provide a most direct indication of change (Madrone Consultants Ltd. 2000). The record of historic animal species abundance and distribution is poor, but several taxa associated with shrinking or newly developing habitat types have the potential to be useful indicators. Madrone Consultants Ltd. (2000) compiled a list of plant species that can be useful as indicators of ecological change or “problems” in the bog ecosystem (Table 5.4) (Madrone Consultants Ltd. 2000, Table 4.1 on p.65). The indicators highlight changes related to a lower water table and nutrient enrichment. The change in cover values of these species and salal compared to cover of Sphagnum and lichens along transects into the Bog was used to delineate the point at which functioning bog vegetation was replaced by non-functioning bog vegetation (Madrone Consultants Ltd. 2000). For example, as total moss and Sphagnum cover increase along a transect into the Bog, salal cover decreases sharply (Figure 5.4). The major change from true bog to non-functioning bog vegetation takes place in the tall shrub stage of the Pine-Sphagnum ecosystem (LS3b in Madrone Consultants Ltd. 1999). Using the same indicators of decreased moisture, birch (BS, BC), pine (LG) and young coniferous forest stands (RK) all indicate drying. These ecosystems, which lack significant Sphagnum cover, now cover about 13% of what was originally peat-forming heathland vegetation (Figure 5.5). Functioning bog communities cover 51% of the original remaining Bog area (Madrone Consultants Ltd. 2000).

161
Table 5.4 Plants that indicate potential problems with respect to revegetation by bog species (adapted from Madrone Consultants Ltd. 2000)
species potential problem
Indicators of dry conditions
Birch/pine Extensive invasion probably indicates conditions are too dry.
Bracken Suggests that conditions are too dry and possibly disturbed.
Red-stemmed feathermoss, broom moss These species may be present in small quantities in bog vegetation; their establishment and spread in the absence of the aquatic or main peat-building Sphagnum species would suggest that conditions are dry.
Indicators of nutrient enrichment
Cattail, willow, alder Indicates minerotrophic water source and nutrient enriched.
Common rush May indicate eutrophication and/or disturbance.
Figure 5.4 Cover of indicator species along a 250 m transect from the edge of Burns Bog inward (adapted from Madrone Consultants Ltd. 2000).
0102030405060708090
100
50 100 150 200 250
Distance (m)
Co
ve
r (%
)
Moss TotalSphagnumBrackenSalalBirchPine
Plants
162
The Pine-Sphagnum tall shrub community (LS3b) is interpreted to represent the transition from peat-forming to drying vegetation. It covers 14.5% (420 ha) of the original heathland vegetation, occurring mostly between forested ecosystems at the Bog’s margins and the wet central core. Considering that most of the remaining area of the Bog was once covered in functioning, peat-forming vegetation, 27.5% has either dried out or is now drying and only 51% supports functioning Bog vegetation. These observations are consistent with the conclusions of the Technical Review Panel that the Bog is shrinking (Sims et al. 2000a) Animal indicators of ecosystem dynamics have limited value at present, because there is a lack of historical data. Unlike the case with past vegetation, aerial photographs and surveyors’ notes cannot be used as a historical data source. There are historical observations that breeding Greater Sandhill Cranes were once more abundant (Biggs 1976). These cranes presumably used the natural open vegetation and ponds as habitat. Today, they seem to favour the ponds and adjacent open areas created by peat harvesting (Gebauer 1999b). Although their numbers have declined, the cranes may have benefited, to an extent, from disturbance. Consequently, their use as indicators of past dynamics is problematic. The cranes do have the potential to be used as indicators of open bog habitat. Their numbers might increase as open Sphagnum communities expand. On the other hand, cranes do not favour pine and birch forests, so their numbers can be expected to decline if the Bog continues to dry out and the extent of forest and tall shrub ecosystems expand. In contrast, the abundance of three other vertebrates, Dark-eyed Junco, Southern Red-backed Vole and the Douglas’ Squirrel are good candidates as indicators of forest expansion (Madrone Consultants Ltd. 2000). All favour the forested habitat. Juncos are common in the forests during the breeding season. Voles, as far as is known, only occur in forested or semi-forested habitats. The squirrels feed on conifer seeds, although they also eat fruit (Madrone Consultants Ltd. 2000). Each of these vertebrates could be used in a multi-year systematic monitoring program, provided observations were made of other factors that might affect their abundance and distribution. The following points summarize disturbance in Burns Bog:
x Disturbance today is much more extensive and more disruptive of normal ecosystem processes than in the past;
x Major disturbances, such as landfills, have alienated large parts of the original bog; x Peat excavation has been responsible for the most wide-ranging disturbance; x The consequence of most of the disturbance in the remaining Bog has been to eliminate or
seriously damage about half of the Bog’s acrotelm; x Most peat excavations are recovering naturally; x Increased drainage has indirectly disturbed the bog ecosystem complex by lowering the water table; x Exotic species have invaded the study area, but their impact is largely confined to sites of major
disturbance such as roads and other filled areas; and x The relatively natural bog community supports few invasive species.

163
Figure 5.5 The dynamic status of ecosystems in Burns Bog.

164

164
5.2.4 Tree Ring Studies
Tree rings are widely recognized as tools for detecting environmental changes (Fritts 1976; Cook 1990; Schweingruber 1996). They are most often applied to understanding climatic variation and phenomena such as insect outbreaks (Swetnam et al. 1985). Tree rings can also be used to detect local environmental events and track stand dynamics (Parish et al. 1999). They are particularly useful to examine the effect of hydrologic changes on wetland ecosystems (Dang and Leiffers 1989; Schulthess 1990, in Schweingruber 1996). A study of tree-ring patterns (Gedalof 1999) was undertaken as part of the Review with the general objective of documenting historical changes in ecosystem processes in Burns Bog. Specifically, the objectives were to describe the extent of ecosystem change in the Bog and to relate change to specific disturbance events such as peat mining, drainage and fires. The study involved sampling lodgepole pine trees at 18 sites along 4 transects that extended inward from the edge of the Bog. Transects were 2 km long, where possible, extending from forested pine-salal (LG) communities into open Pine-Sphagnum (LS) ecosystems. In addition, three sites, representing three different drainage disturbance types (Atkins-Durbrow large ponds, Atkins-Durbrow narrow ponds and ridges, large drainage ditch), were sampled. A single increment core was obtained from each of 10 trees per site at ground level to ensure the longest possible record and to establish the time that the trees began to grow. A further nine Sitka spruces were sampled in the forest stands east of Highway 91 to determine their age. Samples were prepared according to standard methods and were measured using the WinDednro computer-based image analysis system (Gedalof 1999). Standard detrending techniques were applied to the data to remove the age-related growth curve and the strong influence of previous years’ growth on the present year’s growth, but not low frequency patterns related to phenomena such as disturbance and competition. Appropriate statistical techniques were used to detect and recognize the climatic signal. The resulting curves were compared to model response curves of different types of intervention (disturbance) to understand the nature of the disturbance likely responsible for the change in the tree-ring pattern (Gedalof 1999, Figure 13). The tree-ring patterns exhibited three features that required specific statistical treatments. First, the patterns exhibited high autocorrelation (strong influence of preceding years’ growth). Second, rings had a low year-to-year variability related to climate (called “sensitivity” in tree-ring work). Third, trees largely behaved in an individualistic manner, rather than responding collectively to factors that influence growth. The results of the tree-ring analyses (Figure 5.6) lead to several observations related to the ecosystem dynamics of the Bog. First, radial tree growth is weakly related to climate. Wet winters result in slightly increased growth, whereas, dry springs are associated with reduced growth. These observations suggest that the forested part of the Bog (largely the margin) may experience a soil moisture deficit in late spring and summer.

165
Second, hydrologic disturbance, by peat mining and ditch digging, enhances growth and seedling establishment. These hydrologic changes appear to affect radial tree growth several hundred metres distance (at least 200 m in Transect B) from the site of the disturbance (peat workings). The growth response is marked (400% in some trees) and rapid (Figure 5.6, Transects A, C). Tree-ring patterns suggest that partial hydrologic recovery appears to take place within 2-10 years following the disturbance (Figure 5.6, Transect B). But, post-disturbance growth rates are higher than before the disturbance, suggesting a long-term decline in the water table. This observation is particularly important because it confirms that Burns Bog responds to water-table disturbance in the manner proposed for raised bogs (Ingram 1992). In addition, seedling establishment appears to occur in pulses, probably related to local water table changes caused by drainage (Gedalof 1999) and possibly fire. Third, stand-age distribution suggests that forested ecosystems are expanding into the non-forested communities of the Bog. Furthermore, overall growth rates appear to be increasing at most sites in the Bog, except those undergoing competition or further disturbance (Gedalof 1999). The implication is that continued forest expansion under the current hydrologic regime is “probable” (Gedalof 1999). Gedalof (1999) further notes that pine seedlings are widespread. This observation supports the conclusion that the surface of the Bog is drying. Finally, the reconnaissance tree-ring study east of Highway 91 reveals that the Sitka spruces are 222-492 years old, with many greater than 300 years old (Table 5.5). These stands are clearly remnants of old-growth forests.
Figure 5.6 Filtered ring-width series for Transects A, B, and C in Burns Bog (adapted from Gedalof 1999). Arrows on Transects A and C plots show rapid increase in growth rates in the early 1950s. Transect B plot shows that trees grew relatively rapidly at first (arrow ➀) followed by gradually decreased growth (arrow ➁) after a new hydrologic state was established.
0
0.2
0.4
0.6
0.8
1
1.2
1.4
1.6
1.8
1920 1924 1928 1932 1936 1940 1944 1948 1952 1956 1960 1964 1968 1972 1976 1980 1984 1988 1992 1996 2000
Years
BBA
BBB
BBC
BBD
TRANSECTSTransect A

166
Figure 5.X (continued) Filtered ring-width series for Transects A, B, and C in Burns Bog (adapted from Gedalof 1999). Arrows on Transects A and C plots show rapid increase in growth rates in the early 1950s. Transect B plot shows that trees grew relatively rapidly at first (arrow ➀) followed by gradually decreased growth (arrow ➁) after a new hydrologic state was established.
0
0.2
0.4
0.6
0.8
1
1.2
1.4
1.6
1.8
1920 1924 1928 1932 1936 1940 1944 1948 1952 1956 1960 1964 1968 1972 1976 1980 1984 1988 1992 1996 2000
Years
BBG
BBH
BBI
BBJ
TRANSECTSTransect B
¦
§
0
0.2
0.4
0.6
0.8
1
1.2
1.4
1.6
1.8
1920 1924 1928 1932 1936 1940 1944 1948 1952 1956 1960 1964 1968 1972 1976 1980 1984 1988 1992 1996 2000
Years
BBK
BBL
BBM
BBN
TRANSECTSTransect C

167
Table 5.5 Tree-ring-width statistics for site 99-BBS east of Highway 91 (Gedalof 1999).
core identification number
number of rings
mean ring width (mm)
diameter at breast
height (cm)
estimated age(years)
99-BBS 801B 55 2.23 69 222
99-BBS 802 71 3.58 56 261
99-BBS 803 86 3.42 129 397
99-BBS 804 62 4.35 125 351
99-BBS 805 134 2.14 145 492
99-BBS 806 116 2.15 92 347
99-BBS 807 99 2.76 95 346
99-BBS 808 91 2.45 89 314
99-BBS 809 102 2.89 100 366 The tree-ring study provides a large-scale overview of ecosystem processes and hydrology. A more comprehensive understanding of stand dynamics and their relationship to disturbance requires a greater number of sample sites and more cores per tree. The additional sample sites would best be located next to places where the exact date of the disturbance was known. Furthermore, several sites of similar disturbance need to be compared. In summary, tree-ring analyses confirm that Burns Bog has been undergoing a trend toward a lower mean annual water table. Peat mining and associated drainage have had wide-ranging impacts, among them the development and expansion of pine-dominated woody ecosystems. Under the current hydrologic conditions, that expansion is continuing.
5.3 Restoration Techniques
The extensive impact of peat mining and other disturbances raises questions as to whether appropriate restoration activities in Burns Bog could enhance the likelihood of it persisting as a viable bog ecosystem complex (Sims et al. 2000a). Accordingly, a review of bog restoration literature was undertaken to determine whether there exist well-developed techniques that apply to the conditions in Burns Bog. The objective of the review was to assess whether known restoration strategies and techniques can be applied to the specific disturbance circumstances in the Bog.

168
Restoration broadly aims to return an ecosystem or area to a previous, relatively undisturbed condition, including features of ecosystem function, structure, and composition (Collier 1999). The nature of the restoration work depends greatly on the nature of the predominant ecological processes, the nature and degree of disturbance, and the desired final condition. In the case of bogs, restoration of hydrology and the peat-forming community, including an active acrotelm, are primary objectives (Wheeler et al. 1998). Restoration of the hydrological conditions largely concerns returning the water table to an appropriate position and behaviour, and ensuring that the water quality is consistent with the needs of the peat-forming vegetation. Restoring vegetation includes re-establishing the peat-forming Sphagnum ecosystems. In some cases, restoration involves managing exotic species and woody growth. Bog restoration is a relatively new undertaking, yet despite its short history, much research has been carried out. Two recent comprehensive guides, Wheeler and Shaw (1995) and Brooks and Stoneman (1997a), cover the full scope of the wetland and bog restoration process (Collier 1999). These two works provide valuable information on planning and implementing restoration projects and describe methods and techniques suitable to Burns Bog. Peatland restoration was the topic of the recent International Peat Symposium held in Duluth, Minnesota in July 1998 (Malterer et al. 1998). There has been recent extensive experimentation with peatland restoration techniques, especially in eastern Canada (e.g., Rochefort and Campeau 1997). Several articles (see Collier 1999) and a “Peatland Restoration Guide” (Quinty and Rochefort 1997) have been produced as a result. Collier (1999) demonstrates that there is a wealth of information on restoration strategies and techniques that apply to Burns Bog (Table 5.6). In Quebec, for example, restoration on bare peat achieved self-sustaining Sphagnum cover in 6 years. Self-sustaining Sphagnum cover is a critical first step in the regeneration of the functioning acrotelm. Collier (1999) notes that there is no ready restoration plan because each site has its specific requirements, and he cautions that evaluations of restoration experiments cover less than 10 years. One of the important issues in peatland restoration concerns the extent to which intervention is needed in the restorative process, and to what extent a peatland can “restore” itself. In this context, Burns Bog has several advantages over many other disturbed bogs (Collier 1999). First, there remain many patches of bog vegetation within the disturbed zone. Second, there is a large zone of natural bog vegetation surrounding the disturbed zone (Madrone Consultants Ltd. 1999). These two features favour widespread and effective natural regeneration of the peat-forming community (Poschold 1995; Wheeler and Shaw 1995). Madrone Consultants Ltd. (2000) has documented widespread and active Sphagnum regeneration (Section 5.2.3.1) within Burns Bog, demonstrating that these processes are indeed active.

169
Burns Bog exhibits two additional features that strongly favour successful regeneration. Most of the peat extraction took place in the centre of the Bog in contrast to the bog periphery, as is the case in many European bogs (Wheeler and Shaw 1995). This configuration has maintained naturally wet conditions in large areas, reducing the need for rewetting the surface and raising the water table through the expensive construction of bunds (dyke-like structures which keep the water table high). Second, the Bog’s large size provides more internal site diversity and a large buffer from outside impacts compared to the much smaller peatlands of concern in Europe and elsewhere (Collier 1999). In summary, Collier’s (1999) restoration analysis concludes that:
1. Extensive general information exists and is applicable to Burns Bog; 2. Restoration is required to reduce the impact of peat mining and speed recovery; and 3. Conditions are favourable to restoration intervention in Burns Bog, compared to
examples elsewhere.

170
Table 5.6 Disturbance types in Burns Bog, relevant restoration literature and topics covered (Collier 1999).
disturbance type references topics
abandoned railway Wheeler & Shaw 1995; Brooks & Stoneman 1997a
industrial archaeology and impacts of trails and tracks are discussed.
cultivation No specific literature reviewed.
techniques for water management and revegetation may be applicable.
gas and power lines No specific literature reviewed.
techniques for water management, invasive species, and revegetation may apply, depending on disturbance impacts and restoration objectives.
fire Brooks & Stoneman 1997a; Wheeler & Shaw 1995
fire control measures, recovery; and vegetation succession are discussed.
forest harvesting No specific literature reviewed.
forest restoration literature is not within the scope of this study.
land clearing No specific literature reviewed.
techniques developed for extraction sites would apply. (see peat excavation)
landfill No specific literature reviewed.
no literature on restoring landfill sites to bog ecosystems was found. Techniques that apply to water management and revegetation may apply, depending on disturbance impacts and restoration objectives.
peat excavation Brooks & Stoneman 1997a; Money 1995; Rochefort & Campeau 1997; Poschlod 1995; Sliva et al. 1997; Sliva & Pfadenhauer 1999; Smart et al. 1989; Wheeler & Shaw 1995; Wheeler et al. 1998
revegetation techniques, water management methods, and establishing priorities for restoration are the main topics applicable.
ditching and water management
Brooks & Stoneman 1997a; Price 1998; Wheeler & Shaw 1995
hydrological monitoring, ditch blocking, surface wetting, mulching, and water level and quality control methods and techniques are discussed.
roads (1) Brooks & Stoneman 1997a
impacts are discussed but little is provided on restoration techniques.
trails (1) Brooks and Stoneman 1997a
impacts are discussed.
invasive exotic species Brooks and Stoneman 1997a; Brooks & Stoneman 1997b; Wheeler & Shaw 1995
tree removal methods, shrub control/removal, and water level influence are the topics applicable to Burns Bog.
processing bldgs. & equipment
Wheeler and Shaw 1995; industrial archaeology

171
5.4 Ecosystem Integrity
Ecosystem integrity is a loosely and widely defined concept and is, at times, used synonymously with ecosystem health (Rapport et al. 1996). In the broadest sense, integrity can be simply defined as the “soundness” or “wholeness” of the ecosystem. An example of a specific definition of integrity is provided by Karr and Dudley (1981): ecosystem integrity is “the capacity of supporting and maintaining a balanced, integrated, adaptive community of organisms having species composition, diversity, and functional organization comparable to that of natural habitat of the region.” Regier (1993) notes that “a living system exhibits integrity if, when subjected to disturbance, it sustains an organizing, self-correcting capability to recover toward an end state that is normal and ‘good’ for that system.” Kay and Schneider (1994) define integrity as encompassing three facets of ecosystem organization – the ability to maintain normal operation under normal environmental conditions, the ability to cope with changes in environmental conditions (stress), and the ability to continue the process of self-organization (to evolve and develop). Whatever definition of integrity is chosen, indicators must be adopted to assess that integrity8. An evaluation of ecosystem integrity requires knowledge about the types and condition of ecosystem elements and processes required to maintain a system within defined limits. The evaluation also involves human judgements regarding acceptable or desirable ecosystem conditions. Valued and/or required ecosystem elements and processes must be considered explicitly in terms of societal values (e.g., Cairns and McCormack 1992; Karr 1993; Harwell et
al. 1999; Kay et al. 1999). The Burns Bog Ecosystem Review was charged with gaining a full understanding of what is needed to preserve the ecological viability of the Bog (see Section 1.0). The Review took this to mean that the desired states of ecosystem organization are those that are consistent with a raised bog and its constituent and supporting ecosystems. As described in previous sections (Sections 2.0 and 4.2.5), this requires Burns Bog to have a growing water mound (i.e., net increase in water storage) and a functioning acrotelm layer, which in turn will promote the peat accumulation process. Maintaining a viable condition also involves the re-establishment of peat-forming and associated communities widely throughout the Bog and the promotion of conditions that encourage the persistence of key wildlife including rare and endangered species. The viable state also involves maintaining bog-related biodiversity and habitat complexity within the Bog and the adjacent ecosystems and ecological connections to adjacent habitats. Identifying the viable condition also requires an examination of specific threats to integrity, such as disturbances from human uses and agents such as fire and drought.
8 Indicators represent attributes that are otherwise difficult or impossible to measure directly (such as ecosystem integrity). Well-chosen indicators provide information that reflects key aspects of the attribute of concern.

172
Sims et al. (2000b) noted that there are many “constraints” to developing a specific concept of integrity applying it to a given ecosystem: (i) Ecosystems are inherently dynamic and can change in time and space; (ii) Processes within an ecological system operate on a variety of scales, each having
distinctive characteristics; (iii) The ecosystems being examined may, at the time of investigation, exhibit symptoms of
stress that are not “normal”; and (iv) The concept of integrity involves human value judgements, which are specific to the
socio-economic context of the day and can change. Constraint (iii) may be a key consideration in the assessment of ecosystem integrity of Burns Bog because of the considerable degree of disturbance that it has experienced (Section 5.2.1) (see conclusions of the Technical Review Panel in Sims et al. 2000a). However, the “normal” or baseline conditions can be established relatively well from the analyses of the historic condition (for example, see Section 4.2.5) and the available scientific knowledge base regarding bogs in general. Indicators of integrity that may apply specifically to domed bogs include (Sims et al. 2000b): (i) Rates of organic decomposition and accumulation; (ii) Hydrologic patterns and rates of processes; and (iii) Distribution and character of plant communities. The characteristics of all three of these broad categories provide critical information regarding the functioning of the bog ecosystem complex. There are other indicators that more generally apply to terrestrial and wetland ecosystems especially as measures of disturbance. These disturbance or stress indicators include:
x Biodiversity measures; x Indicator guilds (identified groupings that are related to the level of ecosystem
complexity and can be used to represent a range of ecosystem attributes); x Measures of exotic species (extent of invading organisms as indicators of ecosystem
stress); x Rare species (representing the ability of the ecosystem to support distinctive and unique
elements); x Plant biomass (representing long-term ecosystem characteristics); and x Intermediate trophic species biomass (representing food web complexity by focusing on
intermediate level trophic groups that may be particularly good indicators of ecosystem disturbance and stress; e.g., amphibians).

173
Sims et al. (2000b) present a framework by which to examine the ecosystem integrity of Burns Bog and carry out a preliminary ecological integrity analysis, with the caution that the condition of many indicators is not well understood yet. Table 5.7 shows the ecological measures used in the analysis and the essential ecosystem characteristics that they reflect. Sims et al.'s (2000b) analysis rates 17 of 22 selected ecosystem characteristics. Based on the current condition of these characteristics, as indicated by the knowledge of the corresponding ecological measures, ratings of high (indicating high ecological integrity or an unimpaired condition), moderate, or low (indicating an impaired condition with low ecological integrity) are applied. The ecosystem characteristic of surface and groundwater flow is rated relatively high. Important moderately-rated ecosystem characteristics include primary production, resilience, vegetation structure, landscape connectivity and fire regime (see Table 5.7 for corresponding ecological measures). These ratings imply that these ecosystem characteristics persist and function in the Bog, but that they have been somewhat compromised and have departed from the normal functioning state. Essential ecosystem characteristics that appear to have been strongly compromised include spatial extent, community composition, several hydrologic attributes related to discharge and area covered by ponds, and native soil conditions. Disturbance by humans and the prominent role of non-native species is also of concern. Overall, these preliminary ratings indicate that the Bog maintains important ecosystem characteristics but that many no longer have the qualities of an uncompromised raised bog. Defining more specific quantitative objectives or "ecosystem endpoints" (Harwell et al. 1999) as it relates to sustaining Burns Bog is desirable. The preliminary analysis by Sims et al. (2000b) of the integrity of the Burns Bog ecosystem complex establishes a starting point for further refinement of the indicators and subsequent ecosystem monitoring.

174
Table 5.7 Essential ecosystem characteristics, associated attributes and indicators for assessing the integrity of the Burns Bog ecosystem complex as suggested by Sims et al. (2000b).
essential ecosystem characteristic
subcategories ecological measures
Habitat quality spatial extent percentage of area as functioning bog
landscape connectivity needs more consideration
habitat structural diversity species/area relationships
fragmentation needs more consideration
Integrity of the biotic community
community composition coverage by Sphagnum dominated communities
vegetation structure extent of encroachment of Pinus contorta
red- and blue-listed wildlife species
number of species
non-native species percentage of non-native species
Ecological processes primary productivity primary productivity of Sphagnum
resilience extent of Sphagnum regeneration
biogeochemical processes plant indicators of eutrophication

175
Table 5.7 (continued) Essential ecosystem characteristics, associated attributes and indicators for assessing the integrity of the Burns Bog ecosystem complex as suggested by Sims et al. (2000b).
essential ecosystem characteristic
subcategories ecological measures
Water quality chemical characteristics changes in bog water pH
organo-chemical pollutants changes in organo-chemical pollutants
heavy metal pollutants changes in heavy metal concentrations
Hydrological system surface and groundwater flow average annual and seasonal pattern of runoff flux
standing water percent coverage by standing water
groundwater channels channel density
Disturbance regime anthropogenic disturbances percentage coverage by disturbance community types
fire disturbances frequency of fire occurrence
Sediment/soil quality extent of native soil area covered by native soils
Atmospheric processes methane discharge changes in methane emissions

176
5.5 Global and Regional Significance
Vitt et al. (1999) reviewed the global and regional distinctiveness of Burns Bog. Sphagnum-dominated peatlands are found across North America, with the most extensive areas located in the boreal interior of the continent (Zoltai et al. 1998; Halsey et al. 2000). Along the west coast they extend as far south as Coos Bay, Oregon, and north into Alaska (Halsey et al. 2000). Of the west coast peatlands, non-forested domed bogs are generally restricted to the Fraser Lowland, Vancouver Island, and the Queen Charlotte Islands (Banner et al. 1988). Domed bogs also extend into Washington State, although there is a lack of published information from which to describe the distributional extent of these systems (Vitt et al. 1999). Burns Bog is recognized as the largest bog of the Fraser Lowland (see Section 5.5.2). It represents the southernmost extension of Sphagnum-dominated domed bogs in Canada and is one of the southernmost raised bogs in western North America (Vitt et al. 1999). Domed bogs also occur in other regions of North America. They are common in eastern North America (Glaser and Janssens 1986) but generally absent from the interior of western Canada (Vitt et al. 1996; Halsey et al. 1997). The majority of the domed bogs in eastern North America are forested or semi-forested, however, domed bogs in the maritime areas of New Brunswick, Nova Scotia and Maine have only stunted spruces or no trees at all (Damman 1979a; Glaser and Janssens 1986; Davis and Anderson 1991). Domed bogs also occur in other parts of the world with coastal climates, such as Ireland (Hammond 1979), Finland (Ruuhijärvi 1960; Eurola 1962), and Sweden (Sjörs 1983). However, North American domed bogs are morphologically distinct from European domed bogs (Vitt et al. 1999). Relative to European raised bogs, Burns Bog has a much lower dome considering the amount of annual precipitation it receives (Vitt et al. 1999). This feature is attributed to higher rates of evapotranspiration during the summer, resulting in lower productivity and increased rates of decay (Damman 1979b). Coastal bogs, such as Burns Bog, are chemically distinct. Surface waters within continental Sphagnum-dominated peatlands are different from those found in coastal areas of North America (Zoltai and Pollet 1983; Banner et al.1988; Malmer et al. 1992), the former Soviet Union (Botch and Masing 1983), and Europe (Eurola et al. 1984). Under the influence of oceanic precipitation chemistry, coastal peatlands have sodium (Na) as the dominant base cation, whereas calcium (Ca) is the dominant base cation in continental locations (Pakarinen and Tolonen 1977; Malmer et al. 1992). Vitt et al. (1999) concluded that "a unique combination of climatic, physiographic, and historical factors have made Burns Bog floristically distinct at regional, national and international levels."
5.5.1 Global and Regional Comparisons of Biological Diversity
Vitt et al. (1999) evaluated the global and regional distinctness of the Bog’s biological diversity in addition to considering chemical and morphological characteristics.

177
The vegetation of oceanic bogs like Burns Bog is distinct from that in bogs of continental areas. Coastal bogs, for example, lack black spruce (Picea mariana) tree cover characteristic of inland bogs, and support plant species such as shore-pine (Pinus contorta) var. contorta that can not survive in bogs without maritime conditions (Vitt et al. 1999). Bogs on the west coast of North America are also vegetatively distinct from coastal bogs located along the eastern coast of North America and Europe. Regionally, due to variations in climatic conditions, Burns Bog is believed to have a lower habitat and species diversity than similar Vancouver Island bogs (Osvald 1933; Banner et al. 1988). Hebda and Biggs (1981) speculate that bogs of the Fraser River delta are influenced less by maritime moisture and mineral sub-layers than other coastal bogs, and thus cannot support as many maritime plant species. Several species, which are associated with more continental climates (e.g., the lichen, Parmeliopsis aleurites), are more predominant in Burns Bog than in Vancouver Island bogs (Goward and Schofield 1983). Human disturbances in Burns Bog may have resulted in a reduction of its biological diversity compared to the historic condition (Hebda and Biggs 1981). Considering the incompleteness of species inventories especially for animals and fungi, it is difficult to determine the overall impacts of disturbance on bog species diversity. A certain level of disturbance may in fact increase species diversity. For example, Goward and Schofield (1983) note that human impacts have created new microhabitats and suitable conditions for the growth of new species of lichen in the Bog. However, with increasing disturbance the survival of unique bog species may be put in jeopardy. Burns Bog undoubtedly contributes to ecosystem diversity within the Fraser Lowland (Section 5.5.2). Seventeen distinct plant communities have been identified for the Bog (Section 4.3.1; Madrone Consultants Ltd. 1999). Some plant associations in Burns Bog resemble those of coastal bogs to the north along the outer coast (Tarnocai et al. 1999). However, the drier climate of Burns Bog has led to the exclusion of many sensitive maritime species, thus distinguishing Burns Bog from other south coast bogs (Hebda and Biggs 1981). Nevertheless, rare plant communities do exist in Burns Bog (Madrone Consultants Ltd. 1999). How the ecosystem diversity of the Bog might compare with other domed bogs in other parts of the world is also not clear without a comprehensive study of widespread bog floras. The Bog's role in plant and vegetation diversity in the Fraser Lowland is considered in Section 5.5.2.
5.5.2 Bogs of the Fraser Lowland
Bogs are uncommon ecosystems in the Fraser Lowland. A study by Ward et al. (1992) found that wetlands cover approximately 419 km2 or 13.6% of the Fraser Lowland north of the United States border (a total area of 3,081 km2). Bogs account for only 4.5% of the total wetland area, and Burns Bog accounts for almost 80% of this, making it the largest bog in the region at approximately 3,000 ha, followed by Langley Bog (96 ha), Surrey Bend (79 ha) and Blaney Bog (60 ha). Figure 5.7 shows the historic and current locations of bogs in the Fraser Lowland, and Table 5.8 summarizes the status of the remaining bogs.

178
Table 5.8 Status of remaining bogs in the Fraser Lowland (Golinski 2000).
bog name(s)
type current size (historic
size)
disturbance history characteristics of bog flora
Burns Bog Delta Bog1
Great Delta Bog2, 3
delta 3,000 ha5
(3,920 ha6) (4,800 ha3)
drainage, cultivation, peat extraction, industrial use, highway, fire
• Remnant dwarf shore pine community unique in the Fraser Lowland • Heavily disturbed in parts, many exotic species • Near periphery of range: Andromeda polifolia, Rubus chamaemorus, Vaccinium myrtilloides • < 2 occurrences in region: Empetrum nigrum, Tofieldia glutinosa, Sphagnum austinii • Only location in BC: S. cuspidatum s. lat. • Sphagnum species: 12
Langley Bog delta 96.5 ha7
(500 ha8,9) cultivation, peat extraction, logging, drainage
• Heavily disturbed by peat extraction, many exotic species • Near periphery of range: A. polifolia • Sphagnum species: 11
Surrey Bend Tynehead Bog1 Tyne Head Bog2
delta 79 ha10
(149 ha6) sewer line, fire, logging, railway, drainage
• Flooded: 1948, 2 units: forested swamp with bog elements; bog forest • Near periphery of range: V. myrtilloides, R. chamaemorus (may be extirpated) • < 2 occurrences in region: Carex limosa • Sphagnum species: 10
Blaney Bog basin 59.6 ha7
(unknown) cultivation, drainage • Some parts disturbed
1 Anrep (1928); 2 Osvald (1933, 1970); 3 Rigg and Richardson (1938); 4 Rigg (1925); 5 based on orthophotos by ENKON (1999); 6
based on map in North and Teversham (1984); 7 based on orthophotos by Triathlon Mapping Corporation (1995); 8 Douglas (1995); 9
Douglas and Chapman (1998); 10 Kistritz et al. (1992); 11 Ward et al. (1992); 12 Pojar et al. (1976); 13 Whyte and Adams (1998); 14
estimated.

179
Table 5.8 (continued) Status of remaining bogs in the Fraser Lowland (Golinski 2000).
bog name(s)
type current size (historic
size)
disturbance history characteristics of bog flora
Richmond Nature Park Larger Lulu I. Bog1
delta 47.8 ha11 (1870 ha6)
drainage, fire, highway • Disturbed by drainage, many exotic species
Pitt Polder Pitt Lake Bog1,2
delta 42 ha12 (unknown)
drainage, cultivation, dyking
• Bog forest resulting from heavy drainage • Near periphery of range: R. chamaemorus • Sphagnum species: 5 or 6
Glen Valley Bog delta 29.5 ha7
(91.2 ha7) cultivation • Remnant bog surrounded by agricultural
development
SE Lulu I. Bog Larger Lulu I. Bog1
delta 22.9 ha11
(1870 ha6) drainage, roads, landfill, forestry
• Small remnant bog surrounded by agricultural and urban development
Burnaby Bend Bog Burnt Rd. Bog1 Byrne Rd. Bog4
delta 15 ha7 (630 ha6)
urban development, cultivation, railway, fire, road
• Heavily disturbed bog surrounded by industrial development
Camosun Bog
basin 13.8 ha7
(unknown) landfill, drainage, power lines, fire
• Active restoration of small remnant bog • Sphagnum species: 8?
Unnamed bog, W of Cloverdale Bog
basin 12.9 ha7
(162 ha6)
1 Anrep (1928); 2 Osvald (1933, 1970); 3 Rigg and Richardson (1938); 4 Rigg (1925); 5 based on orthophotos by ENKON (1999); 6
based on map in North and Teversham (1984); 7 based on orthophotos by Triathlon Mapping Corporation (1995); 8 Douglas (1995); 9
Douglas and Chapman (1998); 10 Kistritz et al. (1992); 11 Ward et al. (1992); 12 Pojar et al. (1976); 13 Whyte and Adams (1998); 14
estimated.

180
Table 5.8 (continued) Status of remaining bogs in the Fraser Lowland (Golinski 2000).
bog name(s)
type current size (historic
size)
disturbance history characteristics of bog flora
Coquitlam River, lower reach
delta 6.9 ha11
(106 ha6) urban development
Deer Lake basin 5.5 ha11
(23 ha6) • Shore bog
Hett Wetlands basin 3.3 ha13
(< 5 ha14) gas line, road • Heavily disturbed peatlands along dirt road
• Sphagnum species: 3?
Beaver Lake basin < 5 ha
(< 5 ha14) recreational development • Narrow shore bog
Burnaby Lake basin < 5 ha
(unknown) • Heavily disturbed shore bog
Trout Lake basin < 1 ha (< 5 ha14)
recreational development • Heavily disturbed narrow shore bog • Sphagnum species: 3
1 Anrep (1928); 2 Osvald (1933, 1970); 3 Rigg and Richardson (1938); 4 Rigg (1925); 5 based on orthophotos by ENKON (1999); 6
based on map in North and Teversham (1984); 7 based on orthophotos by Triathlon Mapping Corporation (1995); 8 Douglas (1995); 9
Douglas and Chapman (1998); 10 Kistritz et al. (1992); 11 Ward et al. (1992); 12 Pojar et al. (1976); 13 Whyte and Adams (1998); 14
estimated.


181
Figure 5.7 Locations of peatlands in the Fraser Lowland.

182

182
Over the past century, many bogs have been destroyed or degraded by peat harvesting, agriculture and urban development (Table 5.9). A number of bogs described in early publications (e.g., Rigg 1925; Anrep 1928; Osvald 1933; Rigg and Richardson 1938; Osvald 1970) or noted on botanical specimen labels, no longer exist (e.g., Cloverdale Bog, Port Mann Bog). Others remain, but only as remnants that support a reduced bog flora (e.g., Lulu Island Bog/Richmond Nature Park).
Table 5.9 Bogs eliminated by urban development and agriculture in the Fraser Lowland (Golinski 2000).
bog name(s) bog type
historic size
primary disturbance
Lulu Island Bog1, 2, 4
Smaller Lulu I. Bog3 delta 1520 ha5 agriculture
Port Mann Bog3 delta 476 ha5 urban development
Alouette Bog3 delta Unknown agriculture
Pitt Meadows Bog4 delta 491 ha5 agriculture
Cloverdale Bog2 delta 268 ha5 agriculture
S. Port Mann Bog2
Pacific Hwy. Bog3 delta 30 ha5 urban development
Unnamed bog delta 8 ha5 residential development
Unnamed bog delta 18 ha5 residential development
Unnamed bog delta 23 ha5 residential development
Unnamed bog delta 76 ha5 industrial development
1 Rigg (1925); 2 Osvald (1933, 1970); 3 Anrep (1928); 4 Rigg and Richardson (1938); 5 based on map in North and Teversham (1984).
Of approximately 10,500 ha of peatland in the Fraser Lowland recorded by land surveyors between the years 1858 and 1880 (based on the map in North and Teversham 1984) and noted in early publications (e.g., Rigg 1925; Anrep 1928; Osvald 1933; Rigg and Richardson 1938), only around 3,500 ha remain (based on interpretation of 1995 orthophotos by Triathlon Mapping Corporation with limited field verification), including areas damaged by peat extraction. That amounts to a 66% loss of bog area in the Fraser Lowland. None of the remaining bogs are considered to be in pristine condition.

183
Despite high levels of disturbance throughout Burns Bog, central areas continue to support plant species and communities uncommon in the region. Several bog-associated plant species found at Burns Bog only occur in one or two locations in the Fraser Lowland. These include few-flowered sedge (Carex pauciflora), great sundew (Drosera anglica), crowberry (Empetrum
nigrum), sticky false-asphodel (Tofieldia glutinosa), Sphagnum austinii and S. cuspidatum (in the broad sense). Based on different templates of peatland formation (Moore and Bellamy 1974) reflecting distinctly different topographic settings, geological substrates and hydrology, two types of peatlands occur in the Fraser Lowland: 1) larger bogs associated with the Fraser River delta; and, 2) smaller bogs occurring within topographic basins. Some of the smaller “bogs” occupy the shores of small lakes and are technically “poor fens” not true bogs (e.g., Beaver Lake in Stanley Park, Trout Lake in East Vancouver), whereas others are more extensive and occupy peat-filled basins (e.g., Camosun Bog). The two different templates under which peatlands of the Fraser Lowland were formed are reflected in both biological and functional diversity (Bedford et al. 1999).
5.5.2.1 Vascular Plants
Trees and shrubs characteristically found in both larger and smaller bogs in the Fraser Lowland include shore pine (Pinus contorta var. contorta), Labrador tea (Ledum groenlandicum), western bog-laurel (Kalmia mircophylla), cloudberry (Rubus chamaemorus), bog cranberry (Oxycoccus
palustris), bog blueberry (Vaccicium uliginosum), velvet-leaf blueberry (Vaccinium
myrtilloides), salal (Gaultheria shallon) and hardhack (Spiraea douglasii). Less common shrub species include bog-rosemary (Andromeda polifolia), which is found at Burns Bog, Langley Bog and Richmond Nature Park, and crowberry (Empetrum nigrum), which is restricted to Burns Bog. Bogs represent the last remaining habitat in the Fraser Lowland for several of these plant species, although some such as salal and lodgepole (shore) pine also occur in upland forests, and hardhack is common in swamps. Bog-associated sedge species are poorly represented in the region, likely because disturbed bogs lack suitable wet habitats. For example: x Shore sedge (Carex limosa) has only been reported from Surrey Bend (Foster et al. 1976); x Chamisso’s cotton-grass (Eriophorum chamissonis) was once widespread but now occurs
only at Burns Bog (Madrone Consultants Ltd. 1999) and possibly at Richmond Nature Park (as listed in Taylor 1973);
x Narrow-leaved cotton-grass (Eriophorum angustifolium), which was collected from Burns Bog in 1975 and from Lulu Island in 1960 but was not included in Madrone Consultants Ltd.’s (1999) inventory, may only remain at Camosun Bog (as listed in Pearson 1985); and
x Few-flowered sedge (Carex pauciflora) seems to occur only at Burns Bog (noted in Madrone Consultants Ltd. 1999), while white beak-rush (Rhynchospora alba) is known from three bogs – Burns Bog (Madrone Consultants Ltd. 1999), Langley Bog (Douglas 1995; Douglas and Chapman 1998) and Richmond Nature Park (Taylor 1973).

184
Other bog-associated plant species found in bogs throughout the Fraser Lowland include round-leaved sundew (Drosera rotundifolia), northern starflower (Trientalis arctica) and bracken (Pteridium aquilinum). The only known recent occurrence of great sundew (D. anglica) is at Burns Bog (Madrone Consultants Ltd. 1999), although it was collected from Lulu Island in 1898. Sticky false-asphodel (Tofieldia glutinosa) is reported only from Burns Bog (Madrone Consultants Ltd. 1999) and Camosun Bog (Pearson 1985). Bogs of the Fraser Lowland also support important populations of plant species occurring near the southern periphery of their range in western North America. Species at the limits of their range are of particular conservation concern because range limits are focal points for the development of genetic diversity and evolutionary change (Schonewald-Cox et al. 1983; Hansson et al. 1992). These species include cloudberry, bog-rosemary and velvet-leaf blueberry. A survey of herbarium specimens indicates that these species do not occur in Washington State.
5.5.2.2 Sphagnum
Fraser Lowland bogs support a relatively diverse Sphagnum flora, which includes the following species:
x Sphagnum magellanicum
x S. palustre
x S. henryense
x S. papillosum
x S. austinii
x S. squarrosum
x S. tenellum
x S. angustifolium
x S. pacificum
x S. mendocinum
x S. cuspidatum (in the broad sense)
x S. fuscum
x S. capillifolium
x S. fimbriatum
Of these 14 species, all have been identified from Burns Bog except S. angustifolium and S.
squarrosum (Golinski 2000). Burns Bog, therefore, supports 86% of the Sphagnum species in the extant regional Sphagnum flora, and approximately 31% of the Sphagnum species in British Columbia. The only known population of S. austinii in the Fraser Lowland is at Burns Bog. Sphagnum cuspidatum was identified in the field by Dr. A.W.H. Damman and Prof. Dr. K. Dierssen during a fieldtrip to Burns Bog in November 1999, and later confirmed by Dr. Damman (pers. comm. December 1999) and Dr. K.I. Flatberg (pers. comm. February 2000). This is the first record of S. cuspidatum in British Columbia. Another Sphagnum specimen collected during inventory work for the Burns Bog Ecosystem Review (Madrone Consultants Ltd. 1999) was identified as Sphagnum sjoersii by Dr. R.E. Andrus (pers. comm. to Adolf Ceska, February 2000). This species has not yet been formally described in the literature, however, and is therefore not included in the regional flora. While Sphagnum rubellum is listed in Madrone
185
Consultants Ltd. (1999), Dr. Damman and Prof. Dr. Dierssen suggest that specimens previously identified as S. rubellum are likely S. capillifolium (pers. comm. November 1999). Several species of Sphagnum occurring in the Fraser Lowland are rare according to Andrus et al.
(1992). Using the Nature Conservancy (TNC) and the World Conservation Union (IUCN) ranking systems, Sphagnum pacificum, S. austinii, S. henryense, S. mendocinum, S. tenellum and
S. fimbriatum are all species of concern in North America. Of these, S. pacificum is one of only four species of Sphagnum in North America that is limited to one physiographic region, with the number of occurrences ranging between 21 and 100 (Andrus et al. 1992). As S. pacificum was only recently described as a new species by Flatberg (1987), the number of known occurrences is expected to increase as specimens in herbariams are re-identified and further collections are made. Of the fifteen species of Sphagnum in North America that are considered rare because they are found in a region that is at the periphery of their range (Andrus et al. 1992), the following occur at Burns Bog: S. austinii, S. henryense, S. mendocinum, S. tenellum and S. fimbriatum. Of these, S. austinii is “apparently secure globally” but seems to be rare in parts of its range, especially near the periphery. S. henryense, S. mendocinum, S. tenellum and S. fimbriatum are “demonstrably secure globally”, but are similarly rare in parts of their range, particularly near the periphery (Andrus et al. 1992). On the provincial scale, none of these species of Sphagnum were identified as rare in Ryan’s (1996) report on rare bryophytes of British Columbia.
5.5.2.3 Effects of Disturbance on Bog Vegetation
Disturbance has reduced the diversity of bog-associated plant species and communities in the Fraser Lowland (Golinski 2000). Drainage has led to increased growth and cover of lodgepole pine and shrubs such as Labrador tea and salal (Rigg 1925; Golinski 2000). Greater tree and shrub cover is associated with declining density and diversity of Sphagnum mosses, particularly species associated with wet microhabitats (Golinski 2000). Sedges adversely affected by drainage include Chamisso’s cotton-grass, narrow-leaved cotton-grass, few-flowered sedge and shore sedge. Some shrubs such as western bog-laurel and bog cranberry die out quickly following drainage or burning (Rigg 1925), and herbaceous species like greater sundew, round-leaved sundew and sticky false-asphodel are similarly affected. Some plants species have been extirpated from the Fraser Lowland. These include scheuchzeria (Scheuchzeria palustris) and water clubrush (Scirpus subterminalis). Both were noted from Lulu Island Bog by Osvald (1933), but have not been reported since. Another effect of disturbance is the dominance of non-native plant species in some bogs. Introduced species of concern include European birch (Betula pendula), tawny cotton-grass (Eriophorum virginicum), large cranberry (Oxycoccus macrocarpus) and highbush blueberry (Vaccinium corymbosum) (Madrone Consultants Ltd. 1999). Tawny cotton-grass, highbush blueberry and large cranberry have invaded Burns Bog (Madrone Consultants Ltd. 1999) and Langley Bog (Douglas and Chapman 1998). Both bogs have been subject to extensive peat harvesting and are bordered by commercial cranberry and blueberry operations. Another invasive species found at Burns Bog is Campylopus introflexus, a moss introduced from the southern hemisphere (Taylor 1994; Taylor 1997; Madrone Consultants Ltd. 1999).

186
5.5.3 Policy and Legislative Obligations for the Conservation of Burns Bog
In developing an understanding of the global and regional significance of the biological diversity of Burns Bog, it is important to consider existing and planned biological diversity and wetland conservation legislation, policies and agreements. These may impact decisions concerning future ecosystem management and provide a broad comparative framework in which to consider the Bog's significance. Sims et al. (1999) examined various international conventions, national and provincial policies and legislation, and regional obligations related to wetland and bog conservation. They concluded, as did Technical Review Panel members (Sims et al. 2000a), that legislation and policies are very broad and provide no specific conservation tools that apply to Burns Bog. There are, however, specific initiatives that address wetland conservation concerns. The Burns Bog Ecosystem Review did not undertake a comprehensive assessment of potential obligations. Nevertheless, conventions, policies, and legislation directly applicable to wetlands are briefly outlined here At the international level, the United Nations Framework Convention on Climate Change (in particular, the Kyoto Protocol) seeks to stabilise concentrations of greenhouse gases and specifically addresses the protection of wetlands as important reservoirs of carbon storage (Sims et al. 1999). At this time, however, peatlands remain excluded from international discussions on the Kyoto Protocol (Sims et al. 1999). International efforts are now underway by a number of organizations to produce a Global Peatland Action Plan and a series of regional guidelines for the management of peatland ecosystems (Rubec 1999, as cited in Sims et al. 1999). The United Nations Convention on Biological Diversity calls for nations to commit to the conservation of biological diversity, to use biological resources in a sustainable manner, and to share the benefits of biodiversity fairly and equitably. The important role of wetlands and their contributions to global biodiversity is recognized (Sims et al. 1999). The Ramsar Convention (Convention on Wetlands of International Importance) is another tool through which the conservation and sustainable use of wetlands may be promoted (Sims et al. 1999; Vitt et al. 1999). The convention promotes the protection of internationally significant wetlands, especially those recognized as providing critical international habitat for waterfowl. A listing of these sites, which nations are obligated to conserve, is maintained. Burns Bog has not been nominated for designation as a Ramsar wetland site. The North American Wildlife Management Plan (NAWMP), to which Canada is a signatory, provides for the restoration and protection of waterfowl and other wildlife populations by conserving private and public wetland habitat throughout Canada, the United States and Mexico (see Vitt et al. 1999). Future initiatives under NAWMP have the potential to involve Burns Bog. At the federal level, there is one key policy initiative aimed specifically at wetland conservation, the Federal Policy on Wetland Conservation (Government of Canada 1991; Rubec 1994). Its objective is to “promote the conservation of Canada’s wetlands to sustain their ecological and socio-economic functions” by, in part, “securement of wetlands of significance to Canadians” and the “enhancement and rehabilitation of wetlands in areas where the continuing loss or

187
degradation of wetlands or their functions have reached critical levels” (Government of Canada 1991, as cited in Vitt et al. 1999). The policy directs all federal departments to sustain wetland functions in the delivery of their programs (Lynch-Stewart et al. 1996). Lynch-Stewart et al. (1999) provide an accounting of federal policies and legislation that indirectly address wetland conservation in Canada. Within British Columbia, there are provincial policies and legislation (e.g., the British Columbia Protected Areas Strategy), land tenure responsibilities, and regional and local planning mechanisms and protocols to help ensure that environmental issues, including special provisions for wetland areas, are identified and considered (Sims et al. 1999). However, there are currently no provincial policies specifically designed to address the conservation and management of wetlands. The British Columbia Ministry of Environment, Lands and Parks has a Wetlands Working Group that is working to draft a strategic framework (Sims et al. 1999).
5.5.4 Atmospheric Processes
Humphries and Oke (1999) investigated the role of Burns Bog in atmospheric processes. The importance of Burns Bog regionally to methane generation and carbon fixing and storage was considered specifically as was the Bog's role in regional temperature modification.
5.5.4.1 Methane and Carbon Dioxide
As described previously in this report, decay of organic matter in the acrotelm (upper layer) of bogs occurs aerobically (Johnson and Damman 1993). Decay in the underlying catotelm, in a properly functioning bog, occurs anaerobically because the layer is persistently waterlogged and the diffusion of oxygen into the catotelm is slow. The primary products of decay are methane (CH4) and carbon dioxide (CO2). The question has arisen whether, and in what quantities, methane gas is released from Burns Bog and what role the bog plays in the regional atmospheric methane budget, methane being a concern because it is a greenhouse gas (Johnson and Damman 1993; Zoltai et al. 1998). To understand the potential role Burns Bog can play as a regional source of greenhouse gases (i.e., methane), it is useful to examine estimates of emission inventories at several scales. Estimates for the annual emission rate of methane from bogs range from 1 mg m-2 day-1 to 50 mg m-2 day-1 (Talisman 1991; Friends of the Earth 1992). Talisman (1991) used a methane emission rate of 0.5 g m-2 year-1 or 1.37 mg m-2 day-1 for their wetland inventory for British Columbia. The annual methane emission estimate for Burns Bog depends on the size of the active bog and the assumed emission rate. Using the area of the ecologically available bog of 2,800 ha, and the range of emission rates noted above, the annual methane emission for Burns Bog could be between 10 to 510 t/yr. Humphries and Oke (1999) speculate that the annual methane emission is probably closer to the lower estimate than the higher one. In the absence of comprehensive methane emission flux data for Burns Bog and only a rudimentary understanding of factors affecting methane flux (Brown 1998; Komulainen et al. 1998; Lamers et al. 1999), it is not possible to arrive at a more precise estimate than the likely range of 10-510 t/yr. In fact, in a submission to the Burns Bog Ecosystem Review, R&D Biomass Group Ltd. (2000) assert that the total methane emission from Burns Bog is approximately 2,700 t/yr.
188
The annual methane emission from BC wetlands is estimated to be 1.3x10⁵ t (Talisman 1991), which suggests Burns Bog likely contributes much less than 1% of this (i.e., 0.008-0.4%, assuming emissions of 10-510 t/yr). The total estimated methane emission from all sources within British Columbia for 1990 was 6.9x10⁵ t, of which 1.5x10⁵ t is attributed to natural sources, the remainder being attributed to anthropogenic sources (Levelton 1991). In this context, the normal methane emission from Burns Bog constitutes a small portion of the emissions from all sources in British Columbia (i.e., 0.0015-0.07%). Bogs also play an important role in sequestering atmospheric carbon dioxide (CO2) and as a potential source of it (Armentano and Menges 1986; Gorham 1990; Johnson and Damman 1993; Zoltai et al. 1998). Using the estimate from Biggs (1976) for the dry weight of peat stored in Burns Bog, ENKON (1999) reported that the estimated total carbon stored in the Bog is 1.96x10⁶ t. If all this carbon was to be oxidized, a potential equivalent carbon dioxide amount of 7x10⁶ t would be released (Humphries and Oke 1999). The research conducted as part of the Burns Bog Ecosystem Review indicates that the total volume of peat currently accumulated in the Bog is approximately 5.8x10⁷ m3, or an equivalent of approximately 2.10x10⁶ t of dry peat (36.3 kg/m3 in Biggs 1976). Using the same conversion factor of .475 as ENKON (1999), the estimated total carbon stored in the Bog is 1.0x10⁶ t. To put these estimates into perspective, the total 1995 greenhouse gas emission in British Columbia was estimated to be 5.8x10⁷ t (CO2 equivalent). Hence, Burns Bog is potentially storing the equivalent of 6-12% of one year’s greenhouse gas emission for British Columbia. Drying of the Bog has undoubtedly increased the levels of aerobic decay; and some of the stored carbon is expected to be released back into the atmosphere unless restoration of peat-forming communities occurs. To provide better estimates of methane, carbon dioxide and oxygen concentrations within Burns Bog, direct measures were taken in the field during the fall of 1999 (Humphries and Oke 1999). In situ measurements of methane and carbon dioxide show that the concentration of these gases varies horizontally and vertically at sampled sites. The measurements were designed to assess gas concentrations in the Bog and not to estimate gas emissions. Flux measurements were not possible in the time available. Because a rising water table will “flush out” gases within the peat, the measurements were potentially biased by the high rainfall that had occurred prior to and during the fieldwork (Humphries and Oke 1999). In general, the least disturbed areas of the Bog tended to have the highest concentrations of methane and carbon dioxide and the wettest areas had the lowest concentrations (Humphries and Oke 1999). The natural methane concentration has been found to increase with depth in peat soils (Brown et
al. 1989) with a considerable amount of methane trapped below a depth of 0.5 m within an ombrotrophic bog. Brown (1998) reports that if the water table in an ombrotrophic bog should fall, more of the peat would be exposed to aerobic conditions. Aerobic microbial activity would return much of the accumulated biomass carbon to the atmosphere as carbon dioxide. In addition, the methane produced anaerobically at the lower levels would probably be oxidized to carbon dioxide (and hydrogen gas) before escaping to the atmosphere. Hence, methane emissions are not expected to increase in the long term as a result of draining the bog (Armentano and Menges 1986; Komulainen et al. 1998).

189
Brown and Overend (1993), however, report that disturbance of bogs (e.g., by peat mining activities) and the lowering of the water table may result in the escape of methane into the atmosphere. In other words, if disturbed, the contribution by a bog to greenhouse gases may increase. On the other hand, when bogs are flooded, the standing water allows both carbon dioxide and methane bubbles to coalesce and escape into the atmosphere (Brown 1998). Komulainen et al. (1998) determined that methane emissions rose with the water table after rewetting but remained lower than the emissions from pristine sites. Emission varied with season, peat temperature and moisture conditions. Methane fluxes from wetlands are widely divergent (Bartlett and Harris 1993), with large variations between sites, within sites and inter-annually (Whalen and Reeburgh 1992). As described previously in this report, a large portion of Burns Bog has been disturbed from peat mining and through draining. Overall, it is unclear precisely how disturbances to Burns Bog have affected methane emissions, as the research has yet to provide an adequate explanation of the processes involved. Many unanswered questions remain (e.g., see Brown et al. 1989; Aselmann and Crutzen 1990; Maltby and Immirzi 1993; Yavitt 1997).
5.5.4.2 Thermal Impact of Burns Bog
Peat soils have distinctive thermal climates, directly related to the thermal properties of peat (Humphries and Oke 1999):
x Peat has a low reflectivity (albedo) for solar radiation; hence, it is an excellent absorber of short-wave radiation.
x Peat has high porosity; thus, the moisture content of peat significantly affects its thermal properties. When dry, peat has a low heat capacity. It takes relatively little addition or removal of heat to significantly alter its temperature. However, heat is not easily transmitted within (i.e., low thermal conductivity). Conversely, when wet, the heat capacity of peat is high, dampening its thermal response and increasing its thermal conductivity.
Heat capacity and thermal conductivity define the thermal admittance (Humphries and Oke 1999). When thermal admittance is small, the surface undergoes a large daily range of surface temperature – it gets hotter by day and colder by night than surfaces with higher thermal admittance. Conversely, if thermal admittance is large, the daily range is relatively muted. Peat has an anomalously small thermal admittance when dry, but a moderate value when wet. Satellite infrared data demonstrate that Burns Bog has a unique thermal signature (Humphries and Oke 1999). In the summer, the Bog and the surrounding agricultural land are heated during the day, yet the Bog stands out as a basin of cool surface temperatures at night. With a small thermal admittance during the dry summer months, Burns Bog readily cools at night. Thus, in summer, Burns Bog cools adjacent areas. In the winter, Burns Bog appears to be about the same temperature, or slightly warmer than, surrounding lands (Humphries and Oke 1999). The presence of a scrub or woodland plant cover tends to slightly ameliorate the surface temperature regime of peatland (Humphries and Oke 1999). By day, the cover partially shades the ground and evapotranspiration cools the canopy. At night, the rate of heat loss is slowed. Humphries and Oke (1999) conclude that removal of vegetation cover (e.g., for urban

190
development) and exposure of the peat soil, serves to increase the daily range of surface temperature. The draining of peat soil similarly decreases thermal admittance and, consequently, increases the Bog’s daily temperature range. There are currently no air temperature stations located within Burns Bog from which supplementary information may be gathered regarding thermal influences on adjacent areas.

191
6.0 Analysis and Synthesis
6.1 Approach to Integration and Synthesis
The main goal of the Burns Bog Ecosystem Review is to apply the knowledge and understanding of the physical components and processes of Burns Bog in an analysis of the needs for ecological viability. Several approaches were used to carry out this analysis. First, biophysical data were depicted on a common high-resolution base map in a geographical information system (GIS). This technique facilitates the direct spatial correlation of data. A critical aspect of this approach is the use of ecological base units – the ecosystem polygons (Madrone Consultants Ltd. 1999). These polygons make it possible to locate processes and attributes specifically in the study area and use them in the analysis of ecological viability or sustainability. Second, technical experts considered the data from field and other studies during the Technical Review Meetings (Sims et
al. 2000a). Experts were asked first to review the data available and identify gaps. They also provided information and models from other similar systems and compared these to the Burns Bog case. This material was then applied to identifying, to the extent possible:
1. What are the critical requirements of viability? 2. What is the viable condition for these requirements? 3. Where in the study area must each requirement be located?
The final stage of analysis involved the application of the knowledge and insight gained in the first two stages to a comprehensive spatial analysis. Data and models were applied to the Bog area, the models were further refined, results and approaches compared to literature and sent out for additional expert review as deemed necessary. A draft version of the analysis was sent out for peer-review by ecosystem experts and then revised according to their advice.
6.2 Spatial Extent
Size and shape of the area required to sustain an ecosystem are critical considerations (Primack 1998; Meffe and Carroll 1997). In the case of Burns Bog, size is especially important because large size is one of the features that makes the Bog unique (Vitt et al. 1999). At least three size- and shape-related essential ecosystem characteristics apply to the study area: hydrology, biodiversity needs, and disturbance (Harwell et al. 1999). The three are linked but can be considered separately for the purpose of analysis. A fourth spatial attribute, connectivity, is also considered in the discussion of biodiversity.
6.3 Hydrology
Raised bogs are hydrologic units unto themselves, that is, to a large extent, they shape their own spatial patterns and water requirements. The Technical Review Panel identified restoring appropriate hydrology as a critical issue to the future of Burns Bog (Sims et al. 2000a). In raised bogs, the extent of the hydrologic unit is closely related to bounding higher ground, to a source of groundwater such as an underlying basin or up-welling (Glaser et al. 1997), or to associated groundwater conditions (see Section 2.0). The origin and development of Burns Bog depended

192
at first on the peat-forming template provided by poor drainage of the underlying original substrate composed of the organic silts of the top of the Fraser River delta (Hebda 1977). Once the Bog developed, it became relatively independent of the underlying silts and evolved as a distinct hydrologic feature. The configuration of the Bog and arrangement of components was also shaped by adjacent geologic and topographic features. On the east, the Newton Upland clearly influenced hydrology and peat growth by shedding excess water into the peat-forming area and contributing to the original water mound. The Fraser River at one time likely cut through the forming peat mass (Williams and Hebda 1991; Monahan 1999). In so doing, it constructed natural levees that, in part, established a slightly elevated northern boundary to the Bog. This elevated zone may have resulted in raising the water mound along this margin and enhanced peat growth overall. Flood waters supplied by the river during the late spring freshet may have indirectly contributed to sustaining the water mound by inhibiting drainage during the interval of moisture deficit. These features of the peat-forming template contribute to the Bog’s viability, uniqueness and strongly influence its outline and form. The Bog’s original outline was, as it still largely is, an oval or ellipse. This characteristic of the Bog is not a chance feature, but rather a result of the interaction of the geologic framework, and the way raised bogs develop (Ingram 1982, 1992). The axis of the ellipse ran west-southwest to east-northeast, which is more or less parallel to the south arm of the Fraser River. Originally the drainage axis, and hence hydrologic pattern, developed along this trend (see Section 4.2.5.2). This configuration was related to river channel positions and adjacent elevated land (Panorama Ridge) and its drainage. The outline developed further according to the mechanisms of water mound formation which led to a rounded perimeter (Ingram 1992). The original outline has been significantly modified by disturbance, however the modern configuration remains generally similar to the original state. Altering the Bog’s general outline further can only have negative consequences for viability by disconnecting the ecosystem from its original geologic framework and peat-forming template. Keeping a similar configuration is particularly important, because our knowledge of the hydrologic patterns, especially at depth, is limited. It would seem that to err on the safe side, it is simply sound judgement to retain the original overall north-east south-west axis of the Bog. The basic raised-bog hydrologic unit has specific structural and functional requirements as outlined in Section 2.0. The primary structural features are:
1. A large relatively uniform (hydrologically speaking) dome or plateau, which is rain fed and in which peat accumulation occurs;
2. A narrow transition zone called the rand, often with a relatively steep slope and finally; 3. The discharge zone called the lagg, located at the edge of the transition where the excess
water from the bog collects and drains away (see Section 2.0). For a bog to be viable and maintain its integrity, these structures must be present and must function appropriately (Sims et al. 2000a).

193
Currently the natural lagg zone, to which acidic bog waters and mineral waters from adjacent non-bog waters used to be discharged, has been greatly modified or removed (see Section 4.2.5.3). The original lagg and transitional rand zone have been disconnected from the water mound especially in the east and north-west. Water no longer seeps out or flows into the lagg at the edge of the peat mass. Instead, ditches remove water from within the Bog and lagg-related processes, such as rapid drainage, slice deeply into the ecosystem, lowering the water table in the peat mass and generating extensive hydrologic edge effects. In the north-east sector there is no longer a structural rand. Much of the Bog surface has been lowered to the level of the original lagg zone. Changes in the relationship between the basic structural features have had profound impacts on the vital water mound, most important of which is the lowering of its height (Ingram 1992; Sims et al. 2000a). The configuration of the water mound today (Figure 4.11) clearly reveals in a specific way the underlying hydrologic basis for the required shape and extent of the Bog area. A water accumulation and storage zone, or water mound, elevated above the adjacent mineral terrain, is a primary feature that distinguishes a raised bog ecosystem (Ingram 1982,1992). The high point of the water mound, in the west-central portion of the Bog, is relatively small. This zone is surrounded, however, by a large downward sloping zone that extends out to the western, southern and northern boundaries of the Bog. The gradually eastward sloping configuration of the water mound is not normal, rather it has resulted from the extensive removal of peat over the past five decades. Reconstruction of the Bog's original profile (see Section 4.2.2) clearly shows that the Bog surface, and inferred water mound, rose steeply (relatively speaking) in a transition zone at the margins, then levelled off into a flat plateau. This configuration is clearly the normal or natural condition. To ensure long-term viability, the Bog 's water mound must have the potential to return to this form. Without it, the water mound cannot support large expanses of peat-forming communities and the bog ecosystem complex will degenerate and perish. Ingram (1992) and Wheeler and Shaw (1995) clearly demonstrate that incursions into a peat mass have profound effects on all of the water mound not only at the site of incursion. Though the remaining peat mass may remain undisturbed physically, the water table characteristics inside the entire mass are altered. Changes occur in:
1. The extent of the wet peat-forming zone (equivalent to the area of functioning acrotelm); 2. The overall, annual depth to water table and the position of the late summer low point; and 3. The water mound position within the peat mass.
Theoretical modelling supported by field data (Ingram 1992, Figure 10) reveals that significant removal of peat or digging of major ditches causes a proportional decline of the water mound elevation within a peat mass. The first point to note is that the portion of a bog underlain by the shallow water table required for peat-forming vegetation decreases drastically. The zone of shallow water table is vital in the survival of peat-forming communities, such as Lodgepole pine-Sphagnum, and the integrity of a bog. Using 1930s aerial photographs to interpret vegetation, it was possible to estimate the area of shallow water table and compare it to the current condition (Figure 4.13a,b). Considering today’s 2,800 ha ecologically-available area, 90-100% of the area had an annual water table above 50 cm depth in the 1930s, where as only 52% of the same area has an annual water table above 50 cm depth.

194
Second, there is a more serious short-term impact of disturbing the water mound. The water table may drop sufficiently below the surface of the remaining peat mass that nowhere in the Bog, except in depressions, will it be high enough during the critical drought season to sustain a peat-forming community. A permanent decrease of water table of only 10-15 cm over a few years strongly favours woody vascular plants that grow on hummock tops and a shift away from the peat-forming Sphagnum community (Wheeler and Shaw 1995; Sims et al. 2000a). As Madrone Consultants Ltd. (2000) has reported, this change has already begun in Burns Bog and appears to be continuing. A third consequence of peat removal or digging of major drainage ditches is the lateral displacement of the top of the water mound. The top of the water mound is displaced from the point of disturbance and its original position in the peat mass. The shift in position is considerable. If the disturbance incursion is only half of the radius of a water mound, the top of the mound shifts laterally by about 20% of the water mound's width. In Burns Bog, peat removal in the north-east sector has proceeded into the Bog about 2.0 km at a depth of 2.0 m and about 3.5 km at a depth of 1.0 metre. These incursions amount to approximately 40% and 70%, respectively, of the Bog’s 5.0 km width, values much greater than half a radius. In effect, this amounts to reshaping the outline of the water mound from an ellipse to a near circle. If an incursion occurs in the middle of a water mound, the water mound is split and two separate and lower water mounds result. The drainage ditches constructed south and east of the 80th Street extension in 1999 constitute such an incursion. The creation of two small lower water mounds within the peat mass, poses an extreme risk to the integrity and viability of Burns Bog. The system-wide lowering of the water table has other effects as well. A lower water table leads to increased aeration of the acrotelm and the movement of the acrotelm/catotelm transition zone into the upper part of the catotelm. The overlying peat decomposes and subsides, lowering the bog surface (see Technical Review Panel discussion points in Sims et al. 2000a), releasing nutrients and leading to the further replacement of peat-forming vegetation and progressive loss of the peat mass (Figure 6.1).

195
Figure 6.1 Changes in badly-damaged peat remnants subject to natural processes of peat decomposition. Changes from stage B to stage C are likely to take place very slowly (adapted from Wheeler and Shaw 1995).
The water mound in Burns Bog has been subjected to many of the effects of disturbance described in the preceding discussion. Changes in elevational profile and the reduced extent of peat-forming Lodgepole pine-Sphagnum and White beak-rush-Sphagnum communities indicate clearly that the water mound is lower than before and the wet zone of active acrotelm is much less extensive than before disturbance. The centre of the water mound has been shifted westward. Indeed, the extent of the water mound is much less than it once was. Furthermore, plant community dynamics suggest that it is still shrinking (Madrone Consultants Ltd. 2000). Ingram (1992) points out that system-wide water mound adjustments take a long time to occur within the entire peat mass. Given these considerations, the Bog's water mound cannot undergo any further loss if the Bog is to remain viable. Indeed, the apparent ongoing changes must be reversed by rebuilding active acrotelm over a greater area than it occupies now. Peat and water mounds do not exist in isolation, but must structurally include the transitional rand and marginal lagg zones. These two zones must be included as part of the sustainable Bog area to the greatest extent possible, such that bog hydrological processes, and associated ecosystems, extend to the lagg and that a maximum water storage area and volume are available to the Bog. As a consequence, any spatial configuration must include the lagg and transitional rand on the inside edge of a buffer zone rather than the outside edge. The required width of such a buffer is not well understood. It seems prudent to have it at least 30 m, the guideline used in commercial, industrial, institutional and multifamily land development. A 50 m buffer, now widely under consideration, is desirable. The set back ensures that the Bog’s hydrologic processes and ecosystems are buffered from human activities and disturbances, and internal bog hydrology continues to function in a sustainable manner. This configuration has the added
Unsaturated peat
Permanently saturated peat
(water mound)
A. The original undamaged bog with a permanently saturated catotelm and a thin acrotelm.
B. The margins of the bog have been removed (through peat extraction or conversion to agriculture). The water mound sinks in accordance with the new dimensions. Permanently saturated conditions are now well sub-surface. A new zone of peat that is not permanently saturated becomes established in the upper end of the former catotelm. Peat forming wetland communities become restricted and many disappear entirely, being replaced by woody vegetation and forest.
Parts of Burns Bog have been damaged this way. Further major damage to the peat mass would complete the shift to a stage B condition.
C. After a long time (centuries), the unsaturated surface of the bog gradually wastes (through peat oxidation and decomposition) towards the zone of permanent saturation.

196
benefit of enhancing the zone of habitat complexity for wildlife at the edge of Burns Bog. The spatial implication of including functioning lagg and transition zones is clear. First, as much as possible of the remaining portions of the natural lagg and transitional zones, such as at the western margin where Crescent Slough acts in part as the lagg, have to be included as part of the viable Bog. Along the southern margin of the Bog (excluding the City of Vancouver landfill zone) the structural rand remains relatively intact (Figure 4.4), though the lagg zone has been altered. In this area, effort should be made to re-establish a more natural lagg in support of the remaining rand. The double drainage ditch system along the landfill occurs where the lagg will develop. Activities on the landfill side of the ditch system must not jeopardize this newly developing lagg. The structural configuration in the north-west sector of the Bog is complex because of the occurrence of agricultural and other lands which play a role in the hydrology but not directly in the ecology of the Bog. East of 80th Street, parts of the original transitional rand still survive. In this zone, a natural lagg must be re-established, particularly because the current zone of drainage extends well into the central part of the water dome (Figure 4.11). The lands not currently in the ecologically available Bog could function as a hydrological buffer, supporting the extent and integrity of the water dome in this area of the Bog. Since the water mound extends right to the limits of the ecologically available bog in this section of the Bog, (Figure 4.11) a hydrological and ecological buffer is highly desirable outside the ecological boundary. Much more field data are required along this part of the bog periphery to work out an optimal relationship between lagg and water-mound. On the north boundary of the study area, the lagg zone must have been originally located relatively close to the Fraser River. Today the Burns Bog Ditch effectively functions as a lagg for most of its length and much of the bog habitat has been alienated to the north of it. The Ditch currently receives lateral flow from the Bog to the south as well as flow out of north-south ditches draining the Bog. In other words, it exhibits some relatively natural lagg functions. However; the water level in it is artificially maintained much lower than in the original lagg zone. There is little or no transition zone adjacent to it because much of the peat has been removed. Nevertheless, the ditch could be returned to a “natural” lagg relatively quickly by raising its operating level by blocking feeder ditches, provided the bog ecosystem on the south side of the ditch were permitted to recover to a functioning state and a buffer were maintained on the north side. A minimum 30 m buffer is required to the north of the ditch. The hydrology and structural features of the east side of the Bog are only partly understood at this time. Water was shed westward from the height of peat adjacent to Panorama Ridge and from the ridge itself. The water then flowed mostly southward, from the north-east south-west drainage divide (Figure 4.8). Presumably, there was a lagg zone along the southern margin of the Bog near the Newton Upland and along the original stream courses. Today water flows predominantly westward through culverts under Highway 91 when the water table is high. Further studies are needed to clarify the value of water contributed from the lands east of the Highway to support the water mound west of the highway. Further studies are also required to establish water flow direction with respect to the water mound in the south-east part of the Bog and how this might relate to an appropriate lagg zone.

197
Actual water storage is also an important hydrological consideration for the viability of the Bog. The Bog mass must have adequate water-storage volume to maintain, and to foster, the unique plant communities required for peat accumulation (Sims et al. 2000a). The volume of stored water must be large enough to prevent the water table in the peat-forming acrotelm zone from dropping below 30-40 cm in the summer. Two storage-related factors are critical: area available for sustained water storage (mainly in the acrotelm) and the amount of water lost to drainage ditches. The amount of area available for sustained water storage depends on the proportion of area under the influence of peripheral processes such as drainage associated with steeper hydrologic gradients, widely fluctuating water-table position and relatively low water tables. These create conditions unfavourable to peat-forming communities compared to the area favourable for peat formation within a bog. In undisturbed bogs, the peripheral hydrologic zone is relatively narrow. Water-table fluctuation data (MacAlister 2000) along a transect into the undisturbed part of Burns Bog suggest that the peripheral hydrologic zone penetrates about 1 km. Assuming a circular bog with an area of 28 km2 (2800 ha) the area influenced by peripheral hydrologic processes is 15.57 km2 and the wet or peat accumulating zone is 12.43 km2. If the Bog area were to be reduced to 75% of 28 km², which is 21 km2, the area of the 1 km wide peripheral zone decreases to 13.06 km2 whereas the wet peat accumulating area declines to 7.94 km2. The proportions change in favour of the peripheral processes because the area within a circle or ellipse is related directly to the square of the radius of the circle. From this analysis, it is clear that progressively reducing the area of bog would soon result in all of it being eventually subject to peripheral hydrologic processes. The preceding analysis assumes that all of the Bog margin is essentially subject to peripheral hydrologic processes in the same way. If the lands east of Highway 91 are excluded because they are mostly separate from the water mound then the Bog is already a 94% bog. Furthermore, the peripheral hydrologic processes that hinder peat formation also penetrate the Bog along ditches. The real wet peat-forming area is thus much less than the 100% scenario indicates. In other words, there really is not as much functional raised Bog as the 28 km2 area might imply. The impact of further losses from the current bog area would be much greater than those calculated for the 28 km2 area. Ditches play a critical role in water storage and in the mean annual position of the water table and its low point at the end of the moisture deficit interval in the late summer (Section 4.2.5.5). Basically, if water is lost to drainage, then it is not available for the fixed losses to evapotranspiration (ET), and the water table must decline below the normal required level. The larger the area mostly under the influence of ET and lateral flow through the acrotelm, as compared to the area influenced by ditch drainage, the higher the water table remains overall, and the larger the extent of the peat-forming plant community.

198
Ditches act to lower the average annual position of the water table by discharging water more quickly than normal (Figure 6.2) (Mustonen and Suena 1971; Vompersky et al. 1988). They also act to reduce the delay time for runoff following a precipitation event. In the winter (Figure 6.2a) precipitation falls on a fully charged storage volume and essentially flows off the surface by lateral and limited channel flow on the surface (Bay 1968; Romanov 1968; Goode et al. 1977). Without ditches, the water storage remains essentially full, or drains relatively slowly when there is no precipitation, because the effect of evapotranspiration is small. For a ditched bog in the winter (Figure 6.2a), excess water continues to be lost from the surface and through ditches. When the rain stops, water is still lost from storage through the ditches at a rate much greater than if there were no ditches (Figure 6.2b). The volume of water stored continues to decline despite the limited role of evapotranspiration. With the next heavy rain, the water table may rise to the surface in both ditched and unditched areas, but in the ditched situation it declines again quickly. On average, over the entire bog surface, the net result is that the water table in the ditched bog, even in the wet season, is lower than in the unditched bog. Lateral flow continues to the ditches because of the relatively steep hydrologic gradient (Piteau Associates 1994), whether there is precipitation or not. Lateral flow in the unditched bog declines, as the interval between precipitation events increases. By the time the moisture deficit season arrives in April/May, the water table in the ditched bog must be lower than in the unditched bog and it continues to decline as a result of drainage and evapotranspiration (Figure 6.2c). In the unditched condition, water is lost mostly to evapotranspiration. The net result is a much lower summer water table in a ditched bog than in an unditched bog (Figure 6.2d).
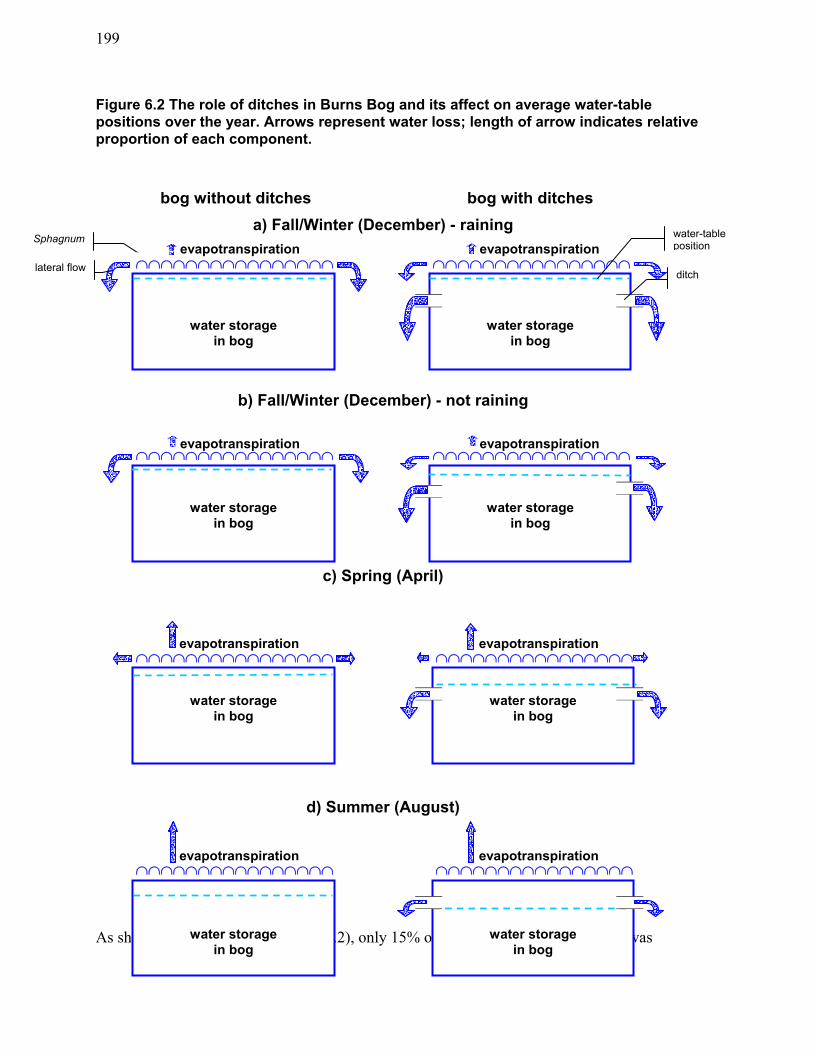
199
Figure 6.2 The role of ditches in Burns Bog and its affect on average water-table positions over the year. Arrows represent water loss; length of arrow indicates relative proportion of each component.
bog without ditches bog with ditches
a) Fall/Winter (December) - raining
b) Fall/Winter (December) - not raining
c) Spring (April)
d) Summer (August)
As shown in Table 4.6 (Section 4.2.5.2), only 15% of the undisturbed (1930s) Bog was water storage in bog
���������������� evapotranspiration
water storage in bog
����������������evapotranspiration
water storage in bog
���������������� evapotranspiration
water storage
in bog
����������������evapotranspiration
water storage in bog
����������������evapotranspiration
water storage in bog
����������������
ditch
water-table positionevapotranspiration
water storage in bog
����������������
evapotranspiration
Sphagnum
water storage in bog
����������������evapotranspiration
lateral flow

200
influenced by drainage channels. These channels likely had less capacity to remove water rapidly because they were shallower and had a rounded cross-sectional profile. More than likely, natural channels did not penetrate the catotelm deeply because of its relatively low hydraulic conductivity (Helbert and Balfour 2000) and because the water table was high in the Bog. The drainage effect was shallow and the volume affected small. Modern ditches affect at least 38% of what now remains of the Bog, most of which had no channels prior to disturbance. Furthermore, modern ditches are much deeper than natural channels were. For example, the new ditches excavated around fields cleared for cranberry farming at the south end of the 80th Street extension, reach about 1.5 m below the surface and have a rectangular rather than rounded cross-sectional profile. As a consequence, they have a much greater drainage capacity. Because the ditches are deeper, the hydrologic gradient is also much steeper, hence the drained zone is deeper and the drainage volume much greater than in the pre-disturbance channels. The consequences are that the mean annual water-table position is lower, and the critical low point in the summer is also lower than an undisturbed ecologically viable bog. As far as the water balance is concerned, water lost to ditches is extra to that lost to evapotranspiration and lateral flow. As described in Section 4.2.5.3, the ditches have likely been responsible for the negative change in water storage observed since the 1940s. Madrone Consultants Ltd. (2000) noted that this loss has directly caused the loss of peat-forming plant communities, and therefore of the functioning acrotelm, and that the loss appears to be continuing. The Technical Review Panel members confirmed these observations during a field visit to Burns Bog in November 1999 (Sims et al. 2000a). The most obvious way to address this serious loss of water is to block drainage ditches, especially those that enter the core of Bog - an approach suggested by the Technical Review Panel (Sims et al. 2000a). In this context, the newly developed ditch system east of the 80th Street extension must be plugged immediately. It is directly draining the water mound and will prevent the maintenance of the peat-forming vegetation in this crucial zone. North-flowing ditches in the north-east sector of the Bog must also be blocked to reduce the loss of shallow water storage in the vacuum-mined peat workings. All ditches that extend into the Bog must be considered as candidates for blocking. This strategy is also consistent with recommendations outlined in Collier’s (1999) restoration report conclusions (Section 5.3) and is a basic step taken in returning raised bogs to a hydrologically more appropriate condition (Wheeler et al. 1998). The full extent and effectiveness of blocking ditches would not be known for several years, and would require monitoring. Given this consideration, it is prudent to maintain the area of the Bog large so that ditch blockage can have a maximum spatial impact on water-table recovery. The area subject to the positive reversal in the water storage trend would be larger in a large area, than in a small area. Only by increasing water storage and having evapotranspiration as the major agent of water loss, will the peat-forming ecosystem have a reasonable chance for long-term survival.

201
6.4 Biodiversity
Biodiversity and wildlife considerations in the analysis of viability and spatial extent can be approached from three perspectives:
1. Preserving the remaining undisturbed bog community; 2. Using indicators, such as listed and keystone species; and 3. Applying principles of conservation biology related to relatively small populations in the
wild.
Preservation of the bog community is considered first. Listed and indicator species and their needs are addressed next. Such species are widely used as a measure of biological diversity. Individual indicators are useful as proxy "stand-ins" for other wildlife elements whose general characteristics and ecological requirements are known, but for which comprehensive data are lacking. In the course of the following analysis, it must be recognized that our knowledge of the species present (especially invertebrates) and their ecological roles, even of the indicators, is limited (Sims et al. 2000a). The application of principles of conservation biology are considered at the end of this section.
6.4.1 Preserving the Bog Community
The most direct indication of the biodiversity of the Burns Bog ecosystem complex are the original unique natural plant and animal communities of the wet acidic environment. As described in Section 3.5, these varied communities, characterized by Sphagnum and members of the Heather family, once covered most of the peat mass. Today barely 800 ha of the original vegetation remain (Figure 4.19). The remaining area is fragmented and much of it is undergoing succession to vegetation characteristic of drier conditions (Madrone Consultants Ltd. 2000). The undisturbed areas host the original complex of plant and small animal species that have lived in the Bog for millennia. More important, these areas no doubt still harbour the many invertebrates, fungi and micro-organisms vital to basic biological processes in the Bog, such as decomposition. The undisturbed communities are distributed mostly within a narrow zone along the southern periphery of the study area, as well as in the north-west sector. They occupy sites where the original peat surface still remains. These communities cannot survive without being linked to the water mound (Section 6.3). Furthermore, the narrow configuration of the area that they occupy leaves the undisturbed communities highly vulnerable to disturbance and fragmentation. Nevertheless, these remnant natural communities are vital as habitat for distinct bog species and as source areas for the regenerating portions of the Bog; they are consequently required for its long-term survival. For these reasons, most remnant undisturbed areas must be preserved as part of the zone required for the viability and integrity of the Bog. As the Bog recovers to a less disturbed condition, the natural areas will ensure that the Bog biota survives to spread into the regenerating zone in the area of the water mound at the centre of the Bog. The preservation of natural remnants is vital to the persistence of the regionally rare pine-Sphagnum association and its plant and animal species. For example, the Bog harbours 86% of
202
the Sphagnum species in the region, most of which are associated with the undisturbed communities. The rare insects such as the water boatmen and the dragonflies are closely associated and require these communities. In the opinion of the Technical Review Panel experts, it is in these areas that many new invertebrate species are likely to be discovered (Sims et al. 2000a). Most of these will likely be rare. It is this habitat which makes the bog biotically unique. Keeping the area of remaining undisturbed plant communities is not enough to endure the Bog's viability. Some of the area is drying and much of it has a high edge-to-area ratios. Hence, areas of undisturbed vegetation are subject to a high degree of edge effect. The viability of the bog biota depends on re-establishing a large contiguous zone of peat-forming vegetation. For these reasons, it is critical to include in the area required for viability, the eastern portion of the water mound and the wet area adjacent to it. This part of the Bog exhibits active Sphagnum growth because it is wet. Furthermore, it occurs near the zone of undisturbed vegetation providing the potential to increase the extent of the vital peat-forming bog community to a size much more likely to persist into the future.
6.4.2 Wildlife
There are two categories of wildlife associated with the Bog: those tied to the peat-forming and related ecosystems; and those which use the Bog but are more broadly distributed. The first category is not well documented at this time but certainly contains significant and unique elements especially in the invertebrate category (Kenner and Needham 1999). Such elements are required for long-term sustainability and the associated risks to it are linked to the persistence of the peat-forming ecosystems which are discussed in Disturbance Analysis (Section 6.6). As far as individual species are concerned, it is assumed that maintaining and fostering the bog communities will protect the associated plants and wildlife. Greater Sandhill Cranes are used in the indicator analysis that follows to represent the peat-forming ecosystem in large part. Provincially red-listed Southern Red-backed Voles occur today only in the Burns Bog area. The vole has to survive in the area required for ensuring the Bog’s viability, but its survival is also directly linked to the long-term viability of the Bog's peripheral ecosystems which themselves are critical to the Bog's hydrology. The red-backed vole is used as a specific example of a listed small mammal in the biodiversity analysis. Red- and blue-listed taxa, collectively, are also used in the indicator analysis to represent the need to conserve overall biodiversity and address the need to maintain trophic structure, an essential ecosystem function.
6.4.2.1 Greater Sandhill Crane
Greater Sandhill Cranes are one blue-listed indicator (Fraser et al. 1999) that can be used to address the question of size and location of the characteristic raised bog ecosystem as it relates to wildlife. It must be stressed that cranes are not strictly bog species in the way obligate insects may be; rather, they have several habitat needs (nesting, foraging) that approximate the characteristics of the open bog environment. The Burns Bog population of Greater Sandhill Cranes is highly significant on a regional basis because breeding populations have declined or been lost elsewhere and have also declined in the

203
Bog (Gebauer 1999). The cranes are also considered vulnerable or threatened in adjacent jurisdictions (Cooper 1996; Dunbar 1999). The spatial needs of the Greater Sandhill Crane population can be assessed by examining habitat needs. The cranes need three habitat attributes: sites surrounded by open water for nesting; nearby areas for foraging; and isolation from disturbance. Burns Bog and adjacent lands provide all three requirements for the cranes. By applying habitat criteria, Gebauer (1999b) mapped the relative importance of crane habitat (Figure 4.21). High and medium importance habitat zones constitute the main area for nesting, rearing and some foraging. This extent of habitat is, however, not necessarily enough because crane breeding appears to be on the decline, and there is little opportunity for recovery under the current conditions. To allow for recovery, part of the low importance habitat known to be used by the cranes must be included. Addition of these areas recognizes that some low value habitat will return to medium or high value habitat in the course of plant community succession. For example, the recently cleared surfaces south of 80th Street were likely medium to high quality habitat before clearing in 1999. Gebauer (1999b) was equivocal concerning the need for a buffer zone around the core habitat zone of the cranes. Dunbar (1999) on the other hand felt that a 400-800 m wide buffer might be appropriate. According to Gebauer (1999) Burns Bog cranes tolerate some human approach on foot. However, in other parts of British Columbia, the cranes are clearly sensitive to disturbance (Cooper 1996). There are no data for the Bog concerning the area of setback needed from crane nesting and brooding sites. Taking these points into consideration, a 500 m buffer around medium to high importance habitat is prudent. Low importance habitat areas may function, in part, as a buffer. However, if these are to be of value in any recovery of the crane population to a sustainable level, it would seem also prudent to include, where possible, a 250 m buffer zone, half of the width for buffering high and medium zones, outside the low habitat margins (see minimum 200 m limit for Florida in Gebauer 1999). A final consideration in the spatial analysis is the apparent foraging use by the cranes of fields to the west and south-east of the Bog (Gebauer 1999b). It seems prudent to maintain flight corridors for the cranes with minimum disturbance in these directions. Based on the preceding considerations the required area for Greater Sandhill Cranes includes all of the western and central portions of the Bog, but does not include a strip on the eastern side of the Bog. The coverage of the water mound includes most of what is required for the cranes.
6.4.2.2 Southern Red-backed Vole
The role of the Southern Red-backed Vole in the spatial analysis is straightforward. Southern Red-backed Voles occur nowhere else in British Columbia, nor are they abundant in adjacent jurisdictions (Fraker et al. 1999). Members of the Technical Review Panel identified the vole’s occurrence as highly significant (Sims et al. 2000a). The size of the population is unknown, but must be small. The known habitat is only based on the site where animals were trapped during this study. Further trapping is needed to adequately understand the habitat needs of this rare mammal. Although the habitat suitability is ranked as only moderately high (Class 2) by Gebauer (2000), it is the only habitat known to be used by the voles today in the entire province.

204
All of the Class 2 and much of the Class 3 habitat mapped by Gebauer (2000) must be considered as important to the vole for its long-term survival. In particular, maintaining disjunct pockets of moderately high and moderate ranked habitat is desirable. The current distribution of this vole is concentrated in such a manner that one large fire could eliminate all the individuals of this red-listed animal from British Columbia. Furthermore, the sites of known occurrence are adjacent to major industrial development. Taking these points into consideration, the required areas include pine woodland on the north-west and western periphery of the study area and much of the Class 2 and Class 3 habitat on the southern and eastern periphery of the Bog (Figure 4.24). The Southern Red-backed Vole species in general is considered to be an indicator of old-growth and undisturbed conditions (Martell 1983; Nagorsen 2000). Furthermore, it requires a relatively large home range (0.1-0.5 ha) (Nagorsen 2000). The species rarely occurs on, and is a poor colonizer of islands (Crowell 1973). These observations suggest that these voles may be subject to relatively high extinction rates and that extinction of small isolated population is likely (Nagorsen pers. comm. February 2000). A consideration of these points emphasizes the need to maintain as large an area as possible of moderate and moderately high rated habitat for the Southern Red-backed Vole in Burns Bog. Wherever red-backed voles are found in future studies in the Bog, those areas must be considered as areas required for ecological viability.
6.4.2.3 Red- and Blue-Listed Species
The Southern Red-backed Vole provides only one example of an animal of high concern and biodiversity significance, and as such represents the needs of only one, albeit important, wildlife example. A more comprehensive method of looking at the long-term spatial requirements for animal biodiversity is to overlap the habitat requirements of groups of listed species. Gebauer (2000) provides just such an analysis by combining standard habitat suitability ratings for several rare taxa or groups of taxa to the terrestrial ecosystem polygons developed by Madrone Consultants Ltd. (1999). When such an analysis is applied to the three listed mammal species, forested ecosystems of the Bog's margins, including lands east of Highway 91, have a moderately high rating (Class 2) (Gebauer 2000, Figure 2). Moderately high ranked (Class 2) habitat for rare birds occurs mostly in the centre of the Bog and east of Highway 91. The data for listed amphibians is limited, but the amphibian habitat ratings are highest for small parts of the centre of the Bog and the lands east of Highway 91. This type of analytical approach emphasizes the importance of both land in the main part of the Bog, and also at the margins. The analysis indicates clearly that at least some of the land east of Highway 91, especially that north of 72nd Avenue must be part of the sustainable bog ecosystem complex to ensure the survival of current wildlife and its function in the food web and trophic structure.
6.4.3 Conservation Biology Analysis
Wildlife that is more broadly distributed but clearly associated with the Bog provides important insight into spatial needs for maintaining biodiversity and related ecological functions (such as

205
trophic structure). A simple approach is to examine where the greatest wildlife diversity is, as we know it today, and to identify where undetected species are likely to be found. Gebauer’s (2000) maps show that the two mixed forest areas at the western and eastern margins of the Bog have the highest vertebrate species diversity. Considering the issues of sampling (Bury and Corn 1987), it is also likely that these and adjacent zones harbour species not yet detected. Furthermore, given unvouchered reports of red- and blue-listed species, it is possible that additional provincially listed species may be found in these sectors of the Bog (Fraker et
al.1999; Gebauer 1999). Biodiversity and wildlife needs in general can be approached from the principles of conservation biology. Aspects of space and configuration have long been at the core of sustainability questions concerning wildlife reserves or preserves (Shafer 1990; Caughley and Gunn 1996; Primack 1998). These discussions have been closely linked to the consideration of the theory of Island Biogeography described by McArthur and Wilson (1967), because areas designated for the long-term survival of species or biodiversity, in the broad sense, are envisioned as islands in a developed or developing landscape. Today, Burns Bog is essentially an island in a developed landscape and fits this conceptual framework well (Figure 3.4) (Sims et al. 2000a). In this context the following general conservation biology principles apply:
1. Large area is better than a small area (minimizes edge effects, more species included, larger population sizes, and greater habitat diversity);
2. Rounder is better (minimizes edge effect, larger buffered core area); 3. Avoid internal fragmentation (reduces edge effect, invasion by exotics, limits internal
barriers to movement and dispersal); and 4. Provide external linkages/corridors (optimizes flow of genes through migration and
offers habitat diversity through access to other habitats). All of these principles apply to the question of the size and configuration that Burns Bog requires to be viable in the long term.
6.4.3.1 Size and Biodiversity
Applying principles of conservation biology to size estimates is a complex process and depends on the objectives for the reserve area (Caughley and Gunn 1996; Meffe and Carroll 1997; Primack 1998). The Burns Bog Ecosystem Review is concerned with many species, not only a single rare element, and ecological functioning, not just the survival of single target species or the preservation of a "state" in the terminology of Caughley and Gunn (1996). Furthermore, the Review has adopted a cautionary approach so that risk of loss of essential attributes is to be kept low. Knowledge of the wildlife at present is limited and knowledge of functional relationships is poor as pointed out by the Technical Review Panel members (Sims et al. 2000a). It is also assumed that the bog ecosystem must “go it alone” at least until working connections to elements in the surrounding natural landscapes are re-established. To sustain an individual small mammal population, especially of a specialist species, requires on the order of a few hundred hectares for a minimum viable population (Primack 1998). The

206
Southern Red-backed Vole is a good example of such a mammal. Presumably, to sustain several such species requires a larger area, since their requirements cannot overlap exactly and a more complex pattern of habitat is needed. Sustaining large herbivores and large carnivores requires a much greater area reaching many tens of square kilometres for large wide-ranging carnivores (Caughley and Gunn 1996; Primack 1998). The size of the actual area required depends on internal habitat quality, on whatever connections may still be functioning, the nature of adjacent habitat and disturbance, and of course the characteristics of the species of concern. These spatial considerations indirectly take ecological function into account based on the assumptions that at least the functions critical to target species are preserved. In the context of sustaining the Burns Bog ecosystem complex, it is not sufficient simply to assume that having adequate area for a group of listed or special species based on considerations of minimum viable population analysis (e.g., Meffe and Carrol 1997; Primack 1998) serves the long-term survival of the ecosystem. For example, the question of a viable trophic structure and food web requires consideration of adequate areas for critical elements (such as carnivore or scavenger functions) of this essential ecosystem attribute. Those elements or species may not be the special or listed ones. In the case of Burns Bog, for example, functionally important wildlife such as raptors nest and roost around the perimeter of the Bog, but eat small mammals closer to and in the central peat-accumulating zone. For this reason, to sustain the food web, essential ecological elements occurring outside the peat-forming complex must be maintained. It is assumed that such functionally important areas correlate well with areas of highest wildlife diversity - the forests at the west and east of the margins of the Bog (see Figure 4.22 and Figure 4.24).
6.4.3.2 Shape and Biodiversity
Burns Bog originally was more or less elliptic- or oval-shaped (Figure 3.3) and conformed to a near-ideal shape for wildlife sustainability from the theoretical perspective because the edge effect on the centre of the ecosystem was minimized (Caughley and Gunn 1996; Primack 1998). This was also the natural or optimally sustainable outline of the ecosystem complex for hydrologic reasons. As a consequence of agricultural, industrial and urban development, the boundary of the Bog moved inward on the northern and especially southern perimeters (Section 3.7). The outline of the Bog area remained relatively elliptical, but major internal disturbance, specifically peat mining, impacted the extent (as above) and shape of the vital undisturbed peat-forming community. Today much of the undisturbed area occurs in a narrow strip along the southern margin of the Bog. For hydrological and biodiversity reasons this strip is at risk in the long term because it is strongly subject to edge effects and it is no longer at the hydrologic core of the Bog. Its attributes must be gradually (through natural processes) added to the hydrologically suitable and active central area of the Bog. Furthermore, a higher-than-present water table must be restored in the area of undisturbed bog vegetation to maintain its unique biodiversity such as rare invertebrates. The most effective configuration (shape) by which this can be achieved is by maintaining a north-east south-west zone with its axis consisting of the undisturbed bog communities. With

207
this configuration, bog-forming communities should develop over time all along the undisturbed zone's wetter northern margin. This configuration ensures the largest possible recovery zone of typical bog habitat and with time reduces the edge effects on the undisturbed remnant communities. Fundamentally, the elongated north-east to south-west shape is the natural shape and is well suited to meet overall biodiversity needs and recovery requirements. It must be maintained if Burns Bog is to remain viable.
6.4.4 Connectivity
As mentioned previously, Burns Bog now exists largely as a natural island within an urban and agricultural landscape. For many animal species, and perhaps for some plant species, connection to adjacent natural or semi-natural environments is critical. For example, the Bog's Black Bear population almost certainly will not survive without interaction with outside populations (McIntosh and Robertson 1999). Waterfowl need to be able to fly safely to Boundary Bay and the Fraser River estuary. Several of the potentially extirpated mammal species such as the Spotted Skunk might be able to re-establish themselves in the Bog via corridors to nearby natural habitats. Fish must have connections to move in and out of the Bog's peripheral waterways. Even insects such as dragonflies and water boatmen may need corridors by which to move from bog to bog. Three zones of connection are likely important to the long-term viability of Burns Bog. The first is a connection to the Fraser River. This connection would serve to link the Bog's marginal aquatic systems directly to the Fraser River and provide a corridor for animals travelling the river corridor, such as bears, to have access to the Bog. Such a corridor or corridors could facilitate the use of the waterways around the Bog by fish. One or two riparian corridors from the northern periphery of the Bog such as along 96th Street would likely suffice. The corridors need to be sufficiently wide for fisheries purposes but also to accommodate large mammals. A 100 m wide strip seems prudent. The second is a connection with upland habitats such as those along Panorama Ridge, and through them to other extensive natural tracts, such as the nearby Watershed Park. This connection will have to extend through the lands east of Highway 91. Its size and character will have to be determined through a more comprehensive analysis. The third connection to Boundary Bay is longer and likely more difficult to re-establish. The important consideration is to leave an option for such a connection to be made. The best possibility for this corridor is southward through the lands between the eastern boundary of the City of Vancouver landfill and the agricultural lands to the east of it. To summarize Section 6.4, the result of this biodiversity analysis is that the area required to sustain the characteristic biodiversity of Burns Bog must be large - thousands of hectares as opposed to hundreds of hectares. It must include all of the lands at the western margins and those in the central and southern portions of the Bog. The area must include a substantial part of the eastern Bog including some lands east of Highway 91. Corridors must remain, or be established to the Fraser River and Panorama Ridge uplands, and the option for a corridor to Boundary Bay must be maintained.

208
6.5 Disturbance
Understanding the role and impact of disturbance is critical in reaching conclusions about ensuring the viability and integrity of Burns Bog. Raised bogs, by their nature and path of origin, are relatively stable (Ingram 1982). They develop and persist over thousands of years (Glaser and Janssens 1986). Disturbances such as fires occur naturally, but do not completely reset the ecosystem to an early successional stage because of the self-generating and regulating capacity of raised bog ecosystems. At least two system-wide disturbance types, fire and drought, have the potential to threaten the survival of Burns Bog. They work both independently and together, and their effects have spatial implications. Fire has been an element of the Burns Bog ecosystem for a long time and has been suggested as one of the drivers of hummock-hollow processes (Hebda 1977; Banner et al. 1988). Prior to European settlement, fires in Burns Bog likely affected small discontinuous patches in a largely wet landscape. This pattern would have met the criteria of a steady-state (sustainable) ecosystem mosaic (Pickett and White 1985). Basically, fires were not likely a threat to the ecosystem because the Bog was large and relatively wet. Today, the fire disturbance regime is different for several reasons. First, the undisturbed vegetation of the Bog occupies a much smaller area than it once did (Figure 4.19). As a consequence, the relative impact of a fire is much greater. Had an 80 ha fire, like the one in 1996, occurred in the undisturbed area, the fire would have destroyed 10% of it compared to less than 2% of natural bog vegetation in the 1930s. Second, though much of the Bog remains wet, many of the wet areas are in the early stages of succession (Madrone Consultants Ltd. 1999) and do not yet function (ecologically or as sites for species) as fully viable bog communities. Third, much of the Bog has dried out over the past few decades, and as a consequence, fire-prone pine stands have spread, now forming a greater proportion of the vegetation than in the past (Hebda 1977; Hebda and Biggs 1981; Madrone Consultants Ltd. 2000). The extent of fires in pine woodland is certain to be greater than in wet Sphagnum heath communities. Fourth, intensified draining over the past decades has resulted in drying of the peat and put the vital acrotelm zone, and even the upper parts of the hydrologically critical catotelm, at risk. Fifth, the frequency of fires may be greater now than in the past because of increased human use of the Bog. As a result of these historic changes in landscape composition and configuration (see Pickett and White 1985), fire is no longer simply a disturbance agent, but is now a known and quantifiable risk to ecological integrity and viability. Assessing the frequency and extent of this impact in the context of remaining bog ecosystem and the rate of recovery provides a direct method of analyzing size requirements for a viable bog. In the last decade, fires burned about 4.7 % of the Bog with the three fires distributed across the Bog (edges and middle). It is useful to compare the actual area burned to important ecosystem characteristics. Had the 80 ha fire of 1996 occurred in the north-west part of the Bog it would have destroyed most of the known habitat of Southern Red-backed Voles in BC and perhaps all the voles themselves.

209
6.5.1 Fire Modelling
The risk of fire disturbance to long-term viability of the Bog, especially in today's early stages of recovery after peat mining, can be examined through a spatial analysis model that compares fire size and frequency to the recovery rate of peat-forming bog communities. To run the model, the Bog area was divided into fifty-eight 45-ha grid squares. An area of forty-five hectares represents the average burn size for the last 10 years. (Three fires burned a total of 136 ha or about 45 ha per burn). Each unit was coded according to its current vegetation based on Terrestrial Ecosystem Mapping (TEM) polygon classification by Madrone Consultants Ltd. (1999). The vegetation was ranked according to a post-disturbance successional stage with respect to a fully functional acrotelm. Coding was based on the dominant (>50% of grid square) category in the grid square in the largest polygon or polygons within the grid square. The grid squares were assigned successional numbers as outlined in Table 6.1.
Table 6.1 Successional stages of modern vegetation cover used to model the impact of fire. Successional stage represented as time in decades.
vegetation stage (decade)
Vegetation cover removed or burned off in the last 10 years 0 Beakrush – three-way sedge (RD) communities on vacuum–mined surface in the north-east Bog. These areas were abandoned in the 1980s but have nothing to burn yet
0
Peat mined mainly 1980-1990 1 Peat mined mainly 1970-1980 2 Peat mined mainly 1960-1970 3 Peat mined mainly 1950-1960 4 Peat mined mainly 1940-1950 5 Lodgepole pine-Salal and Birch-Salal at margins: These can burn but have little or no peat forming/active acrotelm capacity
1
Lodgepole pine-Sphagnum relatively undisturbed vegetation along southern 1/3 margin, assumed to have fully functional acrotelm
19
A random number generator determined which grid squares "burned". In one run of the model, three grid squares were burned per decade assuming the same fire frequency and size of actual fires between 1989-1999. Grids with a successsional value of zero could not burn because they had no fuel. A fire was assumed to reset the successional stage to zero. Hebda (1977; Banner et al. 1988) observed that fires in Burns Bog destroy almost all of the Sphagnum cover leaving behind only small very wet areas with Sphagnum in them, an observation consistent with other bogs (Zoltai et al. 1998). During a fire, the surface is burned down to the water table over much of the area removing all of the hummocks and most of the acrotelm. Shrubby species resprout quickly from underground stems, but Sphagnum establishment and redevelopment of the full thickness of the acrotelm takes much longer (see

210
Sims et al. 2000a). Where the acrotelm burns to the water table a layer of charcoal forms and a slimy or humic layer develops. Eventually, over decades, Sphagnum tenellum occupies this surface (Hebda 1977) but the normal hummock and mat growth takes a long time to re-establish. Glaser and Janssens (1986) reported that in mid-continental bogs Sphagnum cover may return quickly, though they do not indicate how long it takes a functional acrotelm to reform. In bogs of the Maritimes, the process of recovery takes longer (Glaser and Janssens 1986). In Canadian continental bogs, Sphagnum cover is re-established in a few decades (Zoltai et al. 1998). It was assumed for the model that once burned, any grid square, despite its location, could begin succession to the peat-forming acrotelm condition. It is recognized that marginal grid squares originally containing Lodgepole pine-Salal and Birch-Salal ecosystems might not do so because they are too dry. These relatively dry ecosystems are placed in stage 1 of the successional process because they have no functional acrotelm and little Sphagnum cover. It is assumed that the area of squares that do not undergo succession to bog vegetation at the margins compensates for the area of squares in the middle of the Bog that might not burn because they had reached a fully functioning fire-resistant wet condition. There is a large gap in successional stages in the Bog today (Table 6.1). The reason for this is that much of the bog has been mined for peat in the last 50 years and a large expanse of acrotelm has been removed completely. For the sake of simplicity, and because there are no data about disturbance more than 60 years old, all other ecosystems, except those known to have been disturbed in the last decade, are assumed to have fully functional acrotelm. This assumption likely results in an over-estimate of area with fully functioning acrotelm because fires were noted to occur widely in the early 1900s (Osvald 1933). The model was run at 10-year intervals for 20 iterations so that after each run all grids that did not burn moved ahead one successional stage. This change represents a successional step toward a fully functioning acrotelm. Successional stage 20 representing vegetation undisturbed for 190-200 years was assumed to represent the desired climax state. To estimate the extent of remaining peat-forming vegetation for a different size of bog, the model was run for ¾ of the area (1,980 ha = 44 grid squares), of the full Bog of 2,610 hectares. For both the full and ¾ bog areas, the model was run 10 times to establish how the minimum extent of peat-forming vegetation varied with different distributions of random burns over the course of the model run. For the ¾ Bog run, grid squares were removed from the north-east sector. This sector was chosen because it was the most distant from the centre of the water mound, the key feature of the Bog’s hydrology. Average burned area (45 ha) was not adjusted for bog size, because it was assumed that a fire would burn more or less the same area on average whether in a ¾-size or full-size bog. Fire frequency was not adjusted either because there are no data relating number of fires to area in the Bog. A smaller bog might have slightly fewer fires over a long interval of time although Glaser (1992) notes that fire preferentially affects smaller peatlands. To test the sensitivity of the results to a change in fire frequency and size, the model was also run with only two 2 fires of 45 ha each per decade, and a catastrophic 700 ha fire in the first decade.

211
Before describing and explaining the results, the reader is cautioned that the intent of the analysis is not to provide a definitive outline of how fire disturbance will specifically affect Burns Bog. Rather, it is intended to indicate how a disturbance, whose characteristics in the Bog are known, relates to the spatial extent of the peat-forming process and associated vegetation. The minimum area, reached during the model run, of these peat-forming, Sphagnum-dominated communities, provides insight into total area of the Bog required for ecological viability because it reflects what the real extent of peat-forming vegetation and bog habitat might be over the next 200 years. Fire-disturbance analysis of the full bog reveals an important feature concerning bog size and the persistence of peat-forming communities (Figure 6.3). Interpretation of the results assumes that it takes 150-200 years or longer for full acrotelm recovery based on estimates by Damman and Dierssen (pers. comm. November 1999 at Technical Review Meetings also Johnson and Damman 1993). A low threshold of 150-160 years (successional stage 15) is used for the establishment of fully functioning acrotelm. The peat-forming area in the model declined until the 9th decade (90-100 years into the future). In the 11th decade the peat-forming area rose sharply and then recovered gradually so that by the 17th decade it covered an area greater than at the beginning of the analysis. The reason for the spatial bottle-neck is straightforward and relates directly to the existing distribution of plant communities. Nineteen of 58 grid squares are at the climax peat-forming state and all the rest are in the 5th decade stage of recovery or younger. These grid squares are at least 100 years from the earliest interval of acrotelm maturity (150 years). Consequently, as the model run progresses, the mature grid squares are burned off randomly while many of the other grid squares recover slowly. Until the most advanced recovering cohort of grid squares (beginning in their 6th decade) reach the 15th decade, no increase in mature peat-forming vegetation can occur. This pattern is the same no matter whether a smaller total area of bog is used, whether there is a catastrophic large fire to start with or whether only two fires occur per decade (Figure 6.3). The lesson of the analyses is clear. Fire disturbance, if it continues at the current pace and size, will reduce the peat-forming area in the Bog. In the case of the full-size bog, the minimum area is about 450-630 ha (range of 10 separate runs) (mean 540 ha) at the end of this century. Furthermore, if the results of fire disturbance analysis are considered in the context of the distribution of the potential peat-forming area of the Bog today (see discussion about the peripheral drainage zone and the area of peat formation in Section 6.3) the recovery rate will be slower and the size of the minimum peat-forming area likely much smaller than shown in the model. The model suggests that the bog species associated with a mature acrotelm effectively have about a 540 ha Bog for the next century rather than a 2,800 hectare Bog as might appear to be the case. Running the model on an area reduced to ¾ of the present extent yields a different pattern. Like the full-size model, mature peat-forming area declines until the 10th decade (Figure 6.3) for the same reasons. However, the peat-forming area reaches a minimum size of only 300-500 ha (mean 398 ha) rather than 540 ha. At this point, the two recovery patterns for the two models

212
diverge markedly. For the ¾ Bog, instead of recovering to (or even beyond) the pre-modern day extent of peat-forming vegetation, the area recovers to about 500-700 ha and remains there for the next 100 years (the end of the model run). A burn rate of 4.7% of the Bog in a decade may seem large. However, the average rate for Boreal wetlands, similar in many respects to Burns Bog, is 0.5% per year (Zoltai et al. 1998). Over ten years at this rate, 5% of the total Boreal wetlands are burned every 10 years, a value very similar to that observed in Burns Bog. If the fire frequency declined to two 45-ha fires per decade, the area of peat-forming vegetation would still decrease into the 9th decade to a size of 495-720 ha (mean 594 ha). After this point, the peat-forming area quickly recovers to 1,260-1,485 ha by the 13th decade.
Figure 6.3 Fire disturbance model results showing area of climax peat-forming habitat remaining after four different fire scenarios. Values represent the average area for 10 runs of each scenario.
In summary, the fire disturbance analysis strongly suggests that under the current conditions peat-forming communities will become much less extensive than they are today before they begin to recover. Furthermore, if the size of the Bog is reduced much beyond its current extent the peat-forming area will eventually become small and remain so for a long time. Taking into account the uncertainties in the analysis, a bog of much smaller size (75% size) than the ecologically available area of 2,800 ha would face a considerable risk to long-term viability as a consequence of fire disturbance.
0
200
400
600
800
1000
1200
1400
1600
0 50 100 150 200
Years
Three 45 ha fires per decade; 2610 habog (100%) to start
Three 45 ha fires per decade; 1980 habog (75%) to start
Three 45 ha fires per decade;catastophic 700 ha fire in 2610 ha bog(100%) to start
Two 45 ha fires per decade; 2610 habog (100%) to start

213
The preceding analyses consider a fire disturbance pattern like the one over the past decade. They do not address the possibility of a very large catastrophic fire. Such a disturbance may not have been possible in the past because the Bog had little fuel and the water table was relatively high over most of the bog. Under today's condition, the fuel load is much greater than in the past because of the spread of full-size lodgepole pines and expansion of dense shrub cover (Lodgepole pine-Sphagnum tall shrub phase). Also, the current lower water tables may foster the spread of the fire through the dry porous upper peat layer, to an extent much greater than in the past. The peripheral forest stands have a strongly Boreal aspect to them, being dominated by the fire-prone lodgepole pine. Boreal forests are prone to widespread catastrophic fires (Weber and Stocks 1998). When the fire model is started with a 700 ha catastrophic fire, the extent of peat-forming vegetation declines to 135-360 ha in the 10th decade. This bottleneck for the peat-forming area is a serious risk to the viability of the Bog. The original extent of the peat-forming vegetation does not return until the 15th decade, similar to the pattern resulting from three 45 ha fires per decade. Maintaining a large area of the Bog is one way to reduce the possibility of losing the ecosystem from catastrophic fire. Another way is to decrease the drainage to retard the spread of fire by the expansion of wet Sphagnum communities. Decreased drainage would also benefit the distinct plant and animal species of the Bog as well as counter the potential risk from a catastrophic fire.
6.5.2 Drought Modelling
Periodic and known variations in water supply (precipitation) pose another risk, a risk that can be related to area, because area is related to water storage (see Section 6.3) and changes in the water table (see Section 4.2.5.4). Droughts are recognized disturbance phenomena in wetland ecosystems (Glaser 1992; Harwell 1997). The way drought conditions lead to serious ecosystem consequences can be easy to detect, for example by the drying out of ponds. The effects can, however, be very complex, yet still lead to species extirpations. The loss of the Large Blue butterfly (Maculinea arion) from southern England provides an excellent example (Caughley and Gunn 1996) of the indirect impact of drought. Droughts may combine with other agents, such as fire, to result in disturbances much more profound than those resulting from the drought. As long as a wetland ecosystem complex is large, and consists of a mixture of various communities, the wetland can withstand and remain viable. Glaser (1992) noted that continental interior raised bogs maintain their species richness despite drought disturbance, though he does not comment on community structure and composition. In the case of Burns Bog, an active, diverse, extensive, peat-forming acrotelm is the best insurance against drought. Burns Bog is near the south-western limits of Sphagnum-dominated ecosystems in North America (Vitt et al. 1999). The precipitation is adequate over the year to maintain raised bog growth, but water is scarce in the summer season when evapotranspiration far exceeds precipitation. As a consequence, the Bog is likely subject and sensitive to droughts. To be sustained, the peat-forming communities must depend on water stored from the winter. This dependence on stored water is especially important under the current conditions because of the ditch drainage network and the expansion of water-pumping woodland vegetation at the expense of wet communities. The Bog area is further susceptible to drought, compared to the pre-

214
disturbance state, because of the 60% loss of storage in the twentieth century, especially in the acrotelm (see Section 4.2.5.5). As with the loss of the Large Blue Butterfly (Caughley and Gunn 1996), the effects from drought disturbance might not be immediately obvious. But one can imagine that certain species or groups such as the unique and poorly known aquatic invertebrate fauna identified by Kenner and Needham (1999) are at risk to drought. Aside from maintaining a maximum water storage capacity in the acrotelm (see Section 4.2.5.5), a large area with many wet depressions is the best insurance for the long-term survival of this element of the biodiversity and its vital ecological functions (Beets 1992). The monthly water balance was used to assess the susceptibility of Burns Bog to drought in a single year, and multiple drought years. The approach was simple, consisting of changing the annual precipitation, and assuming that its monthly distribution was the same as in a normal year. There are two diagnostic outputs from the model: the lowest point of the water table and the average yearly position of the water table. The minimum summer water-table position is an important factor in controlling the distribution of the Sphagnum-dominated peat-forming community. Prolonged lowered water table over the year leads to a lower summer water table. The critical average, late summer water-table position for Burns Bog is in the range of 30-40 cm below the surface (Section 4.2.5.4). To run the model, the water table in March was assumed, for convenience, to be at the surface, because after winter the peat should be fully recharged. In each model scenario, it is assumed that the Bog can discharge water equally well at all water-table positions. This is known not to be the case, because as the water table approaches the acrotelm/catotelm boundary, the hydraulic conductivity of the peat decreases with depth and water does not flow as readily (Romanov 1968; Damman 1986; Clymo 1991). The model also assumes that actual evapotranspiration is the same in drought years as in normal years, though it is likely to decline as the water table goes deeper below the surface. The model does not take the role of ditches into account either. Furthermore, it is assumed that discharge occurs evenly in proportion to precipitation. Water table measurements in the south-east part of the Bog indicate that this is not the case because the precipitation fills storage first, then discharge occurs. Consequently, the discharge distribution is not as smooth as used in the model. Ditches, as discussed previously, have the net affect of further lowering the average annual water table by reducing detention storage above ground and in the acrotelm. Nevertheless, the model provides important insight into the magnitude of drought disturbance on the water table. A low annual precipitation of 723 mm has been recorded for Vancouver (Oke and Hay 1998). This value was used for the single-year drought scenario. Using the monthly water balance approach (Figure 4.16), the normal monthly water balance shows that the water table declines from April to September reaching 27-29 cm below the surface (Figure 4.16). This value, when corrected for actual winter water-table position (about 10 cm below the surface), is consistent with measurements for the Bog (MacAlister 2000). The mean water-table position for the year is 12.5 cm below the surface. Using the same way of calculating monthly balances (Section 4.2.5.6) the water table during a single dry year of 723 mm precipitation declines to 24.9 cm by July and to 37.4 cm below the surface in September (Figure 6.4). The water table remains below

215
where it would be under normal precipitation conditions until as late as December. A moisture storage deficit is carried into the next year. The mean water-table position for the year is 18.3 cm below surface, 6 cm lower than for an average annual precipitation of 1,100 mm. A single dry year such as this is not likely fatal to the peat-forming plant community and processes. More important to viability in the long term are the consequences of an extended drought. Such droughts are part of the long-term climatic variation of the region as revealed by tree-ring studies (Zhang 1996). The water balance was calculated for three years in a row of 800 mm precipitation (Figure 6.5). In the first year, the water table averages 17 cm below the surface reaching a minimum of 36 cm below the surface. More important, a storage deficit is carried into the next year, because the discharge is great enough that the water table cannot rise to the surface for a significant interval. By the end of the second year, the water table has an average position of 36 cm below the surface. The water level during the dry summer months is extremely low reaching 55 cm below the surface. After another year of drought, the conditions are even more severe with the late summer water table at 77 cm below the surface. When corrected for the Bog's actual water-table position at full storage, the low point of the water table is 87 cm below the surface, a position typical for forested bog, but not for the peat-forming ecosystem. The peat-forming community could not survive such conditions for any length of time, instead birch and pine would thrive and the Bog would rapidly turn to forest. Water tables in forested vegetation are typically in this range (Section 4.2.5.4). Even if wet years followed, the restoration of a healthy acrotelm might take many years.

216
Figure 6.4 Monthly summary of water balance, for a period of one dry year.
Water Balance, dry year
-400
-300
-200
-100
0
100
200
Jan Feb Mar Apr May Jun Jul Aug Sep Oct Nov Dec
Months
Precipitation
ET
WT
January 99 0 28 4 9 33 25 -29 -129February 78 0 26 4 17 26 4 -4 -104March 66 0 22 4 30 7 4 0 -100April 43 0 13 4 49 3 -26 -26 -126May 35 0 6 4 76 3 -54 -80 -180June 30 0 3 4 96 2 -75 -155 -255July 22 0 1 4 114 1 -98 -253 -353August 26 0 0 4 105 1 -84 -337 -437September 42 0 0 4 73 3 -37 -374 -474October 77 0 0 4 45 7 22 -353 -453November 95 0 3 4 21 26 40 -312 -412December 112 0 22 4 11 33 43 -270 -370
Total 723 0 125 44 646 145 -236 -183 -283

217
Figure 6.5 Monthly summary of water balance, for a period of three dry years.
MonthDry year precipitation, m
m
Lateral recharge, m
m
Calculated Lateral Discharge, mm
Vertical Discharge, m
m
Evapotranspiration, mm
Interception, mm
Annual WT Change, m
m
WT below the surface, Yr 1, mm
WT below the surface, Yr 2, mm
WT below the surface, Yr 3, mm
January 109 0 31 4 9 36 29 -36 -203 -405February 86 0 29 4 17 29 7 -7 -196 -409March 73 0 24 4 30 7 8 0 -188 -404April 47 0 14 4 49 4 -23 -23 -211 -428May 39 0 7 4 76 4 -51 -75 -263 -481June 33 0 3 4 96 2 -72 -147 -335 -554July 24 0 1 4 114 1 -96 -243 -431 -651August 28 0 0 4 105 1 -81 -324 -512 -732September 47 0 0 4 73 3 -33 -357 -545 -766October 85 0 0 4 45 7 29 -328 -516 -740November 105 0 4 4 21 29 47 -281 -469 -704December 124 0 24 4 11 36 49 -232 -420 -668
Total 800 0 138 44 646 160 -188 -171 -358 -578
Highest water table
Lowest water table
Water Balance, dry year
-900
-800
-700
-600
-500
-400
-300
-200
-100
0
100
200
Jan Feb Mar Apr May Jun Jul Aug Sep Oct Nov DecMonths
Pre
cip
itat
ion
or
Eva
po
tran
spir
atio
n (
mm
)
PrecipitationETWT, Yr 1WT, Yr 2WT, Yr 3

218
The drought disturbance analysis was carried out on the basis of a water balance at a single point, but it can be extended spatially. The single most important water-balance component is drainage. If the drainage term can be reduced, then more water is available to persist into the water-demanding, high-evapotranspiration season in the summer and early fall. One way to reduce drainage is to eliminate ditches which lower the water table more rapidly than in the undrained state (see Eggelsmann et al.1993), leading to a lower annual and monthly water-table position. Another way to increase storage is to detain as much of the precipitation on the surface of the Bog for use as evapotranspiration in the summer. Part of this extra storage naturally occurs in bogs through the process of mire breathing or swelling (mooratmung) (see Section 4.2.5.5). Another mechanism is provided by storage in shallow surface pools (Beets 1992). Pools which extend deep into the peat mass also contribute to storage but much of the water they hold is below the water table at the depth of the catotelm. But pools that form on the surface and persist for several months provide water for the adjacent slightly raised areas and to the water mound by slow lateral flow. If the pools are deep they will create aquatic habitats too deep to sustain a peat-forming community. Essentially, the pools provide detention storage over and above the soil surface, thus raising the position of the average water table over the year and by the month. A pool 20 cm deep could store 200 mm or 25% of the annual precipitation in a dry year. This amount essentially constitutes all of the surplus precipitation during a normal year (Section 4.2.5.6). A large part of the Bog needs to have the capacity for surface storage because a large area provides a large potential storage volume and decreases the drainage component. The stored volume then acts as insurance against drought and the lowering of the water table below the critical level in the dry months of late summer and early fall (Beets 1992). Specifically, the most important shallow storage is located in the east and north-east sectors of Burns Bog in the old scratch and vacuum peat workings. Most of this area likely provides critical insurance to the Bog against long droughts. This area also provides a low-lying expanse with the potential for rapid regrowth of Sphagnum and rebuilding of the damaged peat mound.
6.6 Gaps and Limitations
Before undertaking a summary analysis of the spatial requirements of the integrity and viability of Burns Bog, a review of the limitations of the data and their implications for the approach to the analysis is necessary. Limitations fall into four categories: data limitations for the study area, lack of data for comparisons, lack of conceptual and tested models by which to interpret data, and few practical examples of this type of spatial analysis. The account that follows acknowledges and discusses the major limitations faced by the Review and explains how they are considered in the spatial analysis in Section 6.8.
6.6.1 Data Limitations
Several types of limitations were identified in Section 4.0 and by the Technical Review Panel members (Sims et al. 2000a), as well as through submissions from the public. Many of the limitations are of a specific nature but they can be grouped into the following categories: 1. Lack of sufficient number of samples/observations;

219
2. Lack of seasonal observations; 3. Lack of multi-year data to account for natural variation; 4. Lack of sufficient sampling density to represent the natural variation in the Bog; 5. Insufficient data on rare and endangered species; 6. Selected coverage of taxonomic groups (i.e., no ant data); and 7. Selected coverage of ecological processes. Any large analytical study faces data limitations because it is simply not practical to study a complex system comprehensively. This constraint was particularly the case in the Burns Bog Ecosystem Review because of the limited time available for field work and the limited number and extent of studies carried out in the past. The Review recognized these limitations and chose, in consultation with the public and experts, strategic areas to study for which reliable information could be obtained (Environmental Assessment Office 1999). The most important data limitations, as far as the analysis is concerned, fall into the areas of hydrology and water chemistry, wildlife and ecosystem processes. Hydrologic data collected for this Review suffer significantly from the first four limitations. Not enough hydrologic attributes were sampled, and sampling density was low. Furthermore, sampling occurred over too short a time to understand the Bog’s hydrology well. Technical Review Panel members noted this point as well as (Sims et al. 2000a). Two examples are the lack of discharge values for drainage zones and the limited observations about the annual water-table fluctuations. Lack of discharge data increases error in the water balance model and makes it more speculative than necessary. This limitation was offset by using data from the literature but necessitated making assumptions about the way the data apply to the case in Burns Bog (see Section 4.2.5.6). A similar approach was used to account for interception for which there are no data from the Bog. The water-table data provided only limited information on the annual fluctuation of the water table and its association with vegetation and the peat-forming community. This information is critical for understanding and interpreting the impact of ditches and assessing the degree of risk from drought. There were some data for Burns Bog (MacAlister 2000) but covering only a short interval, and for a limited area. Water-level data in other parts of the Bog were sufficient to provide a general idea of where the water mound was located (see Figure 4.11). The water mound is a vital feature of the hydrology of a raised bog. In the analysis, the limits of the general extent of the water mound were used, as a primary basis for determining the area required for ecological viability. Additional indicators of bog conditions (such as undisturbed bog vegetation) were added to ensure that other hydrologically critical areas were not missed. Available water chemistry data provide only a general outline of typical bog water, an important indicator of bog conditions. There are far too few data points for the study area given its complex ecology and hydrology. The eastern part of the Bog has almost no data and the data available were not collected in a systematic manner, such as a sampling along a transect. The water chemistry types (Balfour and Banack 2000) are used only to identify important areas in a general way. Along the east side of the Bog, specifically, much more sampling is needed to understand the chemical characteristics of the water.

220
The limitations in the wildlife data were noted by the Technical Review Panel members (Sims et
al. 2000a) and in the reports from consultants. Some groups or taxa such as the Greater Sandhill Crane, seem relatively well-documented, but even with this species there is little long-term information (Gebauer 1999b). For some groups, such as waterfowl, there are notable seasonal gaps. For others, such as small mammals, the information is only preliminary. It is unlikely that there is even a complete species list and that rare and endangered species are among those present in the Bog, but missing from the list. Lack of a reliable inventory clearly limits the consideration of the needs of rare and endangered species. The case of the Pacific Water Shrew is a good example: though it occurs in the study area, there is no clear idea where or in what numbers. In the analysis, this limitation is covered by using selected taxa such as the Southern Red-backed Vole as proxies and considering rare species habitat suitability and areas of high wildlife diversity. This lack of data is also accounted for in part by the application of conservation biology principles. It must be noted though, for these to work best, as much information as possible concerning the specific case is desirable (Caughley and Gunn 1996). For some taxa and groups, such as larger mammals, it was simply not possible to collect any reliable data within the time and with the resources provided to the review process. It is assumed, and hoped that their needs to large extent are addressed by the needs of other wildlife or by consideration of the principles of conservation biology. The group with the least amount of information, yet perhaps most significance in biodiversity analyses, is the invertebrates. As noted by Kenner and Needham (1999), and reiterated during the Technical Review Meetings (Sims et al. 2000a), the invertebrate fauna, especially the insects, certainly contains species new to Science and rare taxa. Furthermore, the insect fauna is likely most diagnostic of the uniqueness of the Bog’s biodiversity and its special bog communities. The lack of data is typical of almost all invertebrate inventories. The important points to note are that there are known rare species in Burns Bog and that new species identified in the future likely will be associated with the distinctive raised bog habitat. Likely, the most important limitation to wildlife data concerns the lack of information of the ecological role or function of the taxa. This type of information is difficult to obtain (Sims et al. 2000a) and takes many years of study, even for a single species. Yet, it is critically important with respect to understanding the question of viability and sustainability of the ecosystem. The issue is not so much what a species may need to survive in the long term but rather the importance of the species or guilds in the functioning of the ecosystem. Pertinent questions include: Which species are most important in the trophic structure? Where are their populations and what are their needs? Such questions simply cannot be answered within the time frame and resources of the Review, and indeed are a well-recognized limitation in sustainability analyses (Scientific Panel for Sustainable Forest Practices in Clayoquot Sound 1995). Again these are best addressed by turning to models and similar examples, and ensuring that the area recommended for viability is relatively large and contains sufficient representation of different habitats to meet the needs of all species and species groups, and maintain essential ecosystem functions (see Section 1.3).
221
6.6.2 Lack of Comparative Data
Once information is collected, there must be some way of putting it into context. This evaluation usually begins with a comparison to other similar sites or adjacent areas. Unfortunately, there are few examples to which to compare Burns Bog and its characteristics. At the scale of the ecosystem complex, no other bog in the region is as well documented as Burns Bog. Furthermore, there no longer remain any relatively undisturbed, similar bogs where normal or typical conditions can be observed. Golinski (2000) examined herbarium specimens and carried out new fieldwork to compare lists of plant species of Fraser Lowland bogs. The limitation is perhaps most acute when trying to compare the list of macrofungi found in the Bog, incomplete as it likely is. The fungi of the region are poorly known in the first place, and there are not any lists for bogs. However, the list does contain at least one rare and one uncommon species. A valuable technique of comparison is to focus on listed species because their regional and provincial occurrence is documented. This is one of the reasons that red- and blue-listed species have an important role in the analysis. In some cases comparative criteria exist, such as habitat suitability classes for wildlife. Whether such categories, largely derived for different conditions than in a bog, apply to Burns Bog is a legitimate question. The spatial analysis in Section 6.8 recognizes this limitation and considers these categories as a guide rather than a clear delineation of areas required or not required. For example, the lack of Class 1 provincial habitat is not so important when the question is: Where is the most important habitat for an indicator species or important functional group in the Bog? In this context, it is the relative ranking of habitat areas that is most important. In the case of data related to processes, there are few or no comparative examples in the region. Comparisons are made to other regions, recognizing that they may apply only in a general way. Such is the case with the consideration of water-table fluctuations, where the conditions in Burns Bog are compared to those in Europe and eastern North America. Similarly, there is little comparative information for assessing the buffer width needs of the Greater Sandhill Crane. In considering this question, information from Florida, other parts of British Columbia, and the opinion of experts are used to obtain a reasonable value. As with the case of lack of data from the Bog, real comparative data are preferable for making site-specific decisions. For this reason, the spatial analysis in Section 6.8 is not intended to provide a comprehensive spatial account of viability for all sites in the Bog. Rather, it presents important attributes using a comparative approach. Decisions about the value of specific sites at the margins of the area required for viability must include adequate data collection for the site.
6.6.3 Concepts and Models
Concepts and models are continually being developed and tested for raised bogs (Ingram 1992) (see also Section 2.0). For example, the Review has chosen the water-mound concept as being fundamental to the spatial analysis. This model is relatively well accepted, but there are other models and ways of thinking about bog hydrology. The methane bubble hypothesis of Brown and colleagues (Brown et al. 1989; Brown and Overend 1993; Brown 1998) is an example. Before the water-mound concept was proposed, hummock-hollow cycling was considered to be a

222
critical concept (Moore and Bellamy 1974). In many ways, these models and concepts are related to each other and really are part of the evolution of thinking about raised bogs. An analysis is only as good as the model it adopts. Using a model is necessary to understand the functioning of ecosystems in the absence of comprehensive data. From such models one can identify the critical elements and locate them on the ground. These are vital steps in a spatial analysis. As far as the Review is concerned, the most appropriate models, as verified by international experts in the field, have been used in the analysis.
6.6.4 Lack of Examples
This Ecosystem Review is really the first example of its kind in British Columbia, certainly as applied to a bog. This means that there is no way of pre-testing or learning from past examples. There is little that can be done about this limitation, except to use the best data and models available in the analysis. The use of a peer review of the analysis was undertaken to ensure that the data and models were applied appropriately, and the limitations of the analysis were recognized. The only way to determine whether appropriate models were used is through monitoring and adaptive management. Data related to indicator species and functions will have to be gathered on a regular and standard basis over many years to ensure that the bog ecosystem is indeed prospering. Harwell and colleagues (Harwell et al. 1999), Pearson (1994) and the Scientific Panel for Sustainable Forest Practices in Clayoquot Sound (1995) have many suggestions for identifying useful indicators. The members of the Technical Review Panel place considerable emphasis on monitoring (Sims et al. 2000a). Panel members noted the need to develop specific criteria and objectives of viability and integrity (Sims et al. 2000a). These criteria could be derived from those used by Sims et al. (2000b) in their analysis of current ecosystem integrity. The first monitoring program should likely focus on the water-table position and how it changes when the major ditches are blocked (Sims et al. 2000a). Other key indicators could include Sphagnum regeneration because there are base line data (Madrone Consultants Ltd. 2000). The condition of the population of a red-listed species might be another measure to track over the years. Whatever monitoring strategy is adopted, if there are signs indicating that critical features of the bog ecosystem are not being sustained, then management changes will have to be considered.
6.7 Summary Analysis
This part of the report combines the separate spatial analyses undertaken in the preceding parts of Section 6.0 into a spatial summary to depict the areas of the study area required for ecological viability. The summary was developed through a series of four summary maps (Figures 6.6-6.9) that summarize essential combinations of characteristics. A map related to ecological viability was then constructed by combining and evaluating the areas in each of the preceding summary maps (Figure 6.10), and modified by general spatial considerations such as the area required to survive disturbance by fire and need for buffers. The ecological viability map combines the requirements for essential ecosystem characteristics so that the requirements are met collectively, not strictly on a case-by-case basis. It should be noted that the boundaries of the required area, where they do not extend to the limits of the ecologically available bog, are approximate. The data available at this time do not permit the definition of a precise boundary. In such places,

223
notably the north-east and south-east parts of the study area, the approximate boundary line is indicated (Figure 6.10). Hydrological attributes (Figure 6.6) are considered to have great importance to the Bog’s viability. The viable bog area must include a functioning water mound and lagg zones. The water mound must also have an adequate water supply to support the functioning of these structures. Furthermore, the water quality, as interpreted from the water chemistry spatial pattern, (Figure 4.17) must be consistent with the typical condition of acidic nutrient-poor Type I water. The bog-water zone should be surrounded by or have the potential to develop a zone of Type II bordering transitional water. As was noted in the analysis of hydrological needs, the peat mass enclosing the water mound must be maintained because incursions into it have effects on the water mound greater than the extent of the incursion, and jeopardize peat-forming communities. For these reasons, the water-mound limits are considered a first guide to the area required for viability. Figure 6.6 shows the water mound to include essentially all of the western and central parts of the Bog. The limits of the water mound are not precisely defined especially in the north-east and east sectors, though they are interpreted to occur at the 1.0 m water-mound contour. In this area, typical bog waters extend beyond the margin of the water-mound boundary. This zone of bog water outside the water mound encompasses important expanses of shallow water storage that likely support the water mound. This bog-water zone also provides a hydrological connection to the east side of Highway 91, which likely delivers water in the winter westward to the shallow pond storage area adjacent to the water mound. The area required for the Bog's ecological viability, encompassed by the water mound, is indicated as Zone 1A in Figure 6.10 to clarify the application of criteria. Areas outside of the main water mound include lands south of the City of Vancouver landfill, lands east of Highway 91, and a zone immediately west of Highway 91. Several pieces of land included in the general outline (Figure 6.6) of the water mound are separated from it by constraining hydrological features such as the Burns Bog Ditch. Functionally these areas are not likely part of the water mound. The water-mound outline and the adjacent zone of bog-type water are taken as a principal guide to the area required for ecological viability. The water mound zone must extend to a functioning lagg. Today this lagg zone is constrained at the margins of the study area by land now alienated hydrologically and ecologically from the bog. Along the northern boundary, the lagg is the Burns Bog Ditch. A 30 m riparian buffer, consistent with land development guidelines is required to ensure the integrity of the ditch as a natural water course and foster its development into a true lagg. Along the south-west margin the lagg is in the outside ditch along the City of Vancouver landfill. Here too a buffer is highly desirable on the outside of the ditch. A portion of natural lagg zone remains along Crescent Slough at the western margin of the Bog. On the north-west periphery, the position of the lagg zone is not well defined, because the ecological boundary of the bog and the hydrological boundary, which includes cranberry fields, do not coincide. Along this part of the Bog’s periphery the water mound extends to the ecological boundary hence the zone required for viability extends to the Bog’s ecological

224
boundary. The lagg zone must be at this boundary or outside of it. A buffer zone in support of the lagg and water mound, estimated at 50 m wide, is highly desirable adjacent to the required area. East of the water mound, the lagg zone for the main water mound is poorly understood, partly because of lack of data, but also because Highway 91 has altered local drainage patterns. It is important to recognize in the analysis that water has always been supplied from the height of peat east of Highway 91 to the area west of it. Consequently, lagg functions must occur to the north and south of this hydrologic connection. Along the south-eastern perimeter, the lagg function is taken up by drainage ditches adjacent to agricultural lands. There are few data concerning how those ditches function. The location of the ditches is more or less where a lagg should be, although a more rounded overall outline (fewer sharp corners) is preferable. There is one hydrological requirement for ecological viability that is not directly related to spatial considerations; that is the need to immediately block ditches draining the interior of the bog. Water lost through ditches is in excess to normal water flow (Figure 6.2). Blocking the ditches should reduce overall drainage and sustain a higher water table into the late summer. Each major ditch will likely need to be blocked in several places to maintain water levels at the same position as they are in the adjacent water mound. The Bog has no viable future without its undisturbed plant communities (Figure 6.7). These harbour the distinct biota at the core of the ecosystem complex. Most of the area of undisturbed vegetation occurs within the zone included in the water mound. The undisturbed areas outside the water mound have less value to ecological viability because they are no longer supported by the hydrologic processes of the mound. They may, however, support red- or blue-listed species and must be assessed for this ecological value. Figure 6.7 also shows the location of areas with relatively high Sphagnum cover, an indication, in part, of sites of rapid acrotelm development. Maintaining a large extent of regenerating Sphagnum is vital to fostering an adequate cover of functioning acrotelm. Most of the inferred active growth zone occurs within the water mound. Some of it occurs within the area of typical bog water chemistry and shallow seasonal pools in the east-central portion of the Bog west of Highway 91 and is coincident with a zone of hydrological connection to the lands east of the Highway. Keeping this actively growing axis is vital to the long-term integrity of the water mound and an ecological connections to the lands east of Highway 91. Biodiversity ecosystem attributes are essential to the ecological integrity of the Bog. Figure 6.8 and Figure 6.9 show wildlife attributes from two different perspectives: rare mammal and bird habitat suitability, and habitat suitable for a high diversity of wildlife. Figure 6.8 illustrates that habitat for rare species occurs in the central wet areas as well as in peripheral lands. Important wet habitat areas are mostly coincident with the essential water-mound zone. The Greater Sandhill Crane’s habitat needs are covered in this manner. However, peripheral areas, some of which support or potentially support animals of great management concern such as the Southern Red-backed Vole are inadequately covered. The largest extent of moderately high-rated rare bird and mammal habitat occurs east of Highway 91, and north of 72nd Avenue. This area also

225
figures prominently when rated for overall wildlife habitat suitability (Figure 6.9). Furthermore, it supports remnant old-growth trees (Section 5.2.4) representing red-listed plant communities (Section 4.3.1.3). Undoubtedly the area provides habitat for wildlife, such as raptors, that play an essential role in the food web and dynamics of the main part of the Bog to the west. For all of the reasons just mentioned, the land east of Highway 91, and north of 72nd Avenue, is vital to the future of Burns Bog. The reasons for including it in the area required for ecological viability are partly different than for the water mound zone. The area is accordingly distinguished as Zone 1B in Figure 6.10. Including the land east of Highway 91 in the area required for ecological viability strongly supports the fisheries values in Cougar (Canyon) and Blake Creeks and the Northeast Interceptor Canal. The lands south of 72nd Avenue are not as important for ecological viability because they include more highly disturbed ecosystems, less extensive areas of moderately high-rated habitat for wildlife diversity and are somewhat disconnected from the zone of high Sphagnum cover. Connection to adjacent natural areas is the last main consideration in defining the area required for ecological integrity and viability. The need for connection to upland habitats is met by including a stretch of land from the water mound to the area east of Highway 91 and north of 72nd Avenue. The connection is interrupted by the Highway 91 corridor and ways of reducing the role of this barrier would improve the viability and integrity of the Bog. The connection to the Fraser River foreshore and water is also vital. Little is known about how this connection works today, but it was extensive and doubtless important before disturbance and alienation of bog habitat. The connection is needed to maintain the hydrological influence of the Fraser River on the north portion of the Bog, maintain access for fish and provide a corridor for other animals. The 96th Street ditch to the Gravel Ridge Pump Station is the shortest and most direct connection. The corridor should consist of the waterway plus at least the width of riparian zone required for fisheries purposes. A 50 m riparian buffer on either side of the ditch would be highly desirable for wildlife purposes. Other connections to the Fraser River also merit consideration.

226
Figure 6.6 Water mound and water chemistry attributes of Burns Bog.

227
Figure 6.7 Undisturbed vegetation and Sphagnum cover in Burns Bog.

228
Figure 6.8 Habitat suitability for rare small mammals and birds in Burns Bog.

229
Figure 6.9 Habitat suitability for wildlife diversity in Burns Bog.

230
A connection to Boundary Bog is desirable but not likely crucial to the Bog's viability, consequently the area of the Bog where that connection could be established is not ranked as highly as the previous two corridors. The proceeding analysis using hydrologic, biodiversity and connectivity criteria leads to the construction of a summary map of ecological viability (Figure 6.10). Each of the criteria defines specific spatial requirements, many of which overlap. A basic question arises - whether all of these areas together are large enough for the ecosystem complex as a whole. From the perspective of conservation biology analysis for wildlife and wildlife habitat, the area covered by the combination of criteria meets the needs of most species except perhaps large mammals. With respect to disturbance, especially by fire, an area of 2,610 ha appears to be adequate under the current fire regime for long-term viability (Section 6.5.1). An area of 1, 980 ha is not likely adequate. Taking a cautious approach, the total viable area must be in the upper part of the 1,980-2,610 ha range. When all the preceding criteria are taken into account, the required area for ecological viability has the form as depicted in Figure 6.10. Outside this area are zones where there are important values related to the Bog's ecological viability but not essential, based on the information available to the EAO at this time. Much of the study area falls within the area required for ecological viability. Three areas, one in the north-east, one in the south-east and one in the south exhibit combinations of important values with respect to the Bog’s viability but are not considered essential at this time. They, however, require further study to verify wildlife and hydrology functions. The part of the study area south of 72nd Avenue and east of Highway 91 is mostly disconnected from the water mound and has a substantial portion of highly disturbed ecosystem in the area of the former peat-processing plant. This disturbed area has little to contribute as far as the viability of the Bog is concerned. Some of the adjacent ecosystems have important wildlife values, but overall, the area is smaller and less well connected than the area north of 72nd Avenue. Hence, the Bog’s viability requirements are best met by the larger area north of 72nd Avenue. Several scattered parcels of public land included in the Ecosystem Review but peripheral to or outside the water dome and core areas exhibit various values, but most of them are not considered essential to the Bog (see Appendix I). The nature of the boundaries between the essential area and adjacent areas is important. Where the boundary of the essential area is a well-defined ditch functioning as a lagg, the boundary must be outside the lagg. The width of the zone outside the lagg must be at least the 30 m riparian guideline used when considering extensive development proposals. For an adequate buffer, a 50 m zone is highly desirable to screen the lagg, its functions and biota from outside disturbance. The buffer does not have to be within the ecologically viable area, but the boundary of the required area must be outside the lagg ditch by at least 30 m.

231
In the area east of the water mound and west of Highway 91, the boundary of the ecologically viable zone is indicated as a 50 m wide strip because the data are not comprehensive and detailed enough for a more precise demarcation. The limit of the ecologically essential Bog is more or less within this zone. Its precise location depends on comprehensive site-specific study of biota and hydrology and considerations of an adequate buffer as appropriate. The summary analysis results in an area of about 2,440 ha required for the ecological viability of the Bog. The area with important supporting, but not essential, attributes is approximately 360 ha, primarily in the eastern and southern parts of the study area. Only 14 ha provide little or no contribution to viability within the ecologically available bog.

232
Figure 6.10 Summary map of ecological viabilty of Burns Bog.

233

233
7.0 Key Findings and Conclusions
This section summarizes the key characteristics of the Burns Bog by principal category. Features critical to the ecological function of the Bog are emphasized. The section concludes with a summary of the findings of the Burns Bog Ecosystem Review with respect to the areas of the Bog required for ecological integrity and viability.
7.1 Physical Characteristics
Burns Bog exhibits the typical characteristics of a raised bog including a two-layered peat mound located above the regional water table, an internal water mound, acidic nutrient-poor water and widespread peatland plant communities dominated by members of the Heather family and Sphagnum mosses. The Bog once covered about 4,800 ha and was connected ecologically to upland and lowland ecosystems. Today, the remaining Bog is largely isolated from other natural areas, being surrounded by agricultural, residential and industrial development. About 40% of the remaining Bog has been excavated by peat mining which has now ceased. The peat deposit, 2.1 m thick on average, rests upon organic silts which inhibit drainage. The Bog developed over the past 5,000 years so that Sphagnum mosses and associated bog species were established by 3,500 years ago. Much of the central zone of the Bog is covered by deep fibrous or moderately decomposed organic soils that are nutrient-poor and acidic. Well-decomposed organic soils and small patches of transitional peaty mineral soils occur at the margins of the study area. Contaminated and potentially contaminated sites are mostly confined to the margins of Burns Bog and consist mainly of landfills. Generally, the risk of contamination in the Bog is low because water flows out of the Bog. Contamination from leachate is the most likely threat, although several sites of potential local contamination occur within the Bog. Transportation and utility corridors pose the potential for contamination from spills. The Bog's hydrology is largely determined by the water mound, fluctuating water levels in the porous upper acrotelm layer (top 50 cm) and an extensive system of ditches. Before widespread disturbance, the Bog had a north-east south-west drainage divide and associated water mound that shed water southward to Boundary Bay (30%) and northward to the Fraser River (70%). There were few internal drainage channels, but a well-developed lagg occurred. The water table was high year-round and several zones of small pools occurred within the Bog. Historically, water from the Fraser River flooded the northern edges of the Bog. Today the water mound occupies most of the western and central portion of the study area, but is separated from the height of land in the east by large shallow ponds left by peat workings, and by Highway 91 and its ditches. Water drains radially from the height of the water mound but in many places it is collected by ditches before it reaches the Bog's margins. Deep ponds left over
234
from peat mining occur in much of the Bog. The City of Vancouver landfill constitutes a new upland zone on the south-west margin. None of the original natural drainage channels persists in the Bog. Instead, many ditches radiate out from the centre. The most important system of ditches, renovated and extended in 1999, now nearly surrounds and drains the highest part of the water mound. In 1930, only 43 km of ditches drained 17% of the Bog area, whereas today, 110-115 km of ditches drain about 39% of the remaining Bog. Drainage ditches are a serious threat to the Bog's viability. During heavy precipitation and months of high water table, water flows under Highway 91 westward toward the water mound. Generally, the water table is closer to the surface in the middle of the Bog than at the edges. Much of the change in water-table position occurs within the first kilometre from the Bog margin. In the late summer and early fall, the water table is low but rises gradually and sometimes sharply with autumn and winter rains and reduced evapotranspiration. The average position of the water table is lower than it was in the 1930s, prior to major drainage and disturbance. The overall water storage has declined by about 84 million cubic metres or about 60%. The critical dynamic storage in the acrotelm has been altered by the increase of rapid discharge by ditches and the loss of natural shallow pools. Only 29% of the Bog’s original acrotelm or dynamic storage zone remains intact. The water-balance equation helps explain the role of the different components of the Bog’s hydrology and assists in modelling the risks posed by drought. At any point, the Bog receives on average 1,100 mm of precipitation a year of which 638 mm is lost to evapotranspiration, mostly in the summer. Another 44 mm flows out through the bottom of the underlying silt and an estimated 220 mm is intercepted and then evaporated into the air from vegetation. In an average year, this leaves an excess of about 200 mm which is available to drain from the Bog by lateral flow. Monthly water-balance analysis for an average year shows that there is a moisture deficit from April to September during which time the water table declines to its lowest point. Water storage has declined over the past few decades. These losses are most likely because of ditch drainage. Water chemistry strongly influences the plant species that grow in wetlands. Typical acidic, nutrient-poor bog water occurs in much of the main part of the Bog. It has low pH (3.5-5.5) and relatively low calcium ion concentrations (<3 mg/l). A zone of transitional water separates bog water from surrounding mineral-rich waters. The transitional water zone is widest in the eastern part of the Bog. Transitional water has pH from 4.5-6.0 and calcium ion concentrations from 3-10 mg/l. Non-bog water exhibits acidic to alkaline pH (5.0-8.0) and relatively high calcium ion concentrations (>10 mg/l) and is rich in dissolved cations and anions. It occurs outside the zone of transitional water and appears to be constrained outside the peat mass except in the area of cranberry fields. Typical bog ecosystems are directly associated with the true bog water zone and some of the transitional water zone.

235
7.2 Biological Characteristics
Originally, the Bog was covered in open heath and Sphagnum vegetation with scattered scrub pines. Today, twenty-four different ecosystems are recognized. Seven of these are forested, nine are dominated by shrubs and herbs, and six are sparsely vegetated and are the result of human disturbance. The unforested phases of the Lodgepole pine–Sphagnum ecosystem likely are responsible for peat formation. Herbaceous white beak-rush ecosystems occur widely on abandoned peat workings and in some natural areas. Lodgepole pine and birch-dominated forests encircle the peat-forming central zone. Other types of forests, mostly dominated by western redcedar, occur mainly east of Highway 91 and contain scattered old-growth trees. Hardhack communities occur at the Bog margins under influence of mineral-rich groundwater. Several of the Bog’s forested plant communities are considered rare within the Chilliwack Forest District because much of the land in the district has been cleared. The Pine-Sphagnum community, although not a typical forest type, is also considered rare. At least 257 plant species live in the Bog. Several plant species, including cloudberry, bog-rosemary, crowberry and velvet-leaf blueberry, occur at the limits of their geographic range in Burns Bog and are recognized as genetically and ecologically important. The Bog supports at least 12 species of Sphagnum, which constitutes 86% of the regional, and 31% of the provincial Sphagnum flora. About 100 species of fungi were found in the Bog during a limited survey. One species of fungus, has only been collected once before in British Columbia and another is uncommon. One hundred and seventy-five bird species have been observed in the main part of Burns Bog representing 68% of all the bird species known to occur regularly in the Vancouver area. The Bog supports a large part of the Lower Mainland population of the blue-listed Greater Sandhill Crane. Many Lower Mainland cranes gather in the Bog before flying south. The large breeding and refuge habitat, and its association with agricultural fields, likely attract Greater Sandhill Cranes to the Bog. Twenty-nine species of waterbirds occur in the study area with mallard ducks and geese being most abundant. At least 16 species of waterbirds breed in the Bog, the major species being Canada Goose, Mallard and Green-winged Teal. The estimated number of ducks daily using the Bog varies from as little as 700 to as many 10,000, especially in the winter. This number represents a significant proportion of the wintering Fraser River delta population. Much more work is needed to determine population numbers and the importance of the Bog to breeding of waterbirds. Two owl species (Great Horned Owl, and Northern Saw-whet Owl) and eight diurnal raptors (Northern Harrier, Red-tailed Hawk, Sharp-shinned Hawk, Cooper’s Hawk, American Kestrel, Merlin, Peregrine Falcon [red-listed], and Osprey) occur within the central part of the Bog. Many of these use the perimeter forests as well as the central parts of the Bog. Overall, the Burns Bog study area hosts 13 of the 22 hawks and eagles known to occur in the lower Fraser Valley. In addition to the Peregrine Falcon, the other red-listed bird known to occur in the Bog is the Purple Martin.

236
The mammal fauna of Burns Bog has been reported to contain 41 species, ranging from small shrews and voles to Black Bears. Of the small mammals, Deer Mice appear to the most abundant. The discovery of the Southern Red-backed Vole, thought to have been extirpated in BC, is an important outcome of the Ecosystem Review. Moist forested habitats with a dense shrubby understorey are important habitats in the Bog for this vole. The red-listed Pacific Water Shrew occurs in the study area, as does the blue-listed Trowbridge's Shrew. A few Black Bears still inhabit the Bog, although the number is of bears is unknown. The Burns Bog area provides limited denning habitat for them and their persistence likely depends on occasional contact with bears from outside populations. A limited survey of invertebrates focused on aquatic bog habitats. At least 400 species were identified, among them nine rare or potentially rare species. These species include two ground beetles, two water boatmen, three butterflies and two dragonflies. The invertebrate fauna of acidic aquatic habitats in the centre of the Bog is likely to be the most distinctive and to contain the highest proportion of rare species or species new to Science. Their continued survival depends on the persistence of these habitats. Five native and two introduced amphibians occur in the Bog and two more live in the forests immediately adjacent. The introduced American Bullfrog and Green Frog are most abundant. The COSEWIC-listed Northern Red-legged Frog lives in central heathland habitats and in the north-eastern mixed forest. No Oregon Spotted Frogs were seen during the survey, though they have been reported in the past. Other amphibians include the Northwestern Salamander, Red-backed Salamander, Long-toed Salamander and Pacific Tree Frog. Commonly observed reptiles include the Common Garter Snake and Northwestern Garter Snake. A limited study detected no fish in the ponds and ditches in the centre of the Bog because the sites are not connected to fish-bearing waters and the water quality is inadequate for most fish. Threespine stickleback has been recorded from the central area in the past. Peripheral waters support a fish fauna similar to that of other Fraser Lowland waterways and includes carp, threespine stickleback, northern squawfish, prickly sculpin, brown catfish, pumpkinseed, and goldfish. Coho salmon, chum salmon, cutthroat trout, and rainbow trout live in the Northeast Interceptor Canal. Previous work noted the occurrence of the provincially blue-listed brassy minnow in sites on the west and east side of the Bog. The question of whether fish enter waters of the central Bog, during winter and spring floods when water quality is best, has not been answered.
7.3 Disturbance
Burns Bog has been subject to many types of disturbance from widespread peat excavation to minor trampling. Furthermore, the Bog is surrounded by a highly disturbed landscape. In the 40% of the Bog affected by peat extraction, the vegetation and acrotelm have been destroyed and hydrology and soils altered. These disturbances stopped the peat formation process until Sphagnum-dominated ecosystems could become re-established. The re-forming of the acrotelm layer has just begun at many of these sites. The disturbed areas are largely being re-colonized by native bog species, however, several exotic invaders occur. Different successional communities

237
have developed in sites mined by different techniques. The White beak-rush-Sphagnum and White beak-rush-Three-way sedge ecosystems occur widely in vacuum-harvested fields. The digging of ditches has caused local disturbance as well as the widespread lowering of the average annual water table and the summer water table. This change in water table has contributed to the expansion of forested plant communities at the expense of peat-forming associations. The lower water table also leads to increased aeration, decomposition and settling of the ground surface, and increased nutrient availability. Fires have been a factor in the Bog for millennia, but in the past few decades, their frequency has likely increased. Fires destroy plant cover, especially Sphagnum, and part, or much of the acrotelm, resulting in reduced peat accumulation. Burned sites become wetter, richer in nutrients and support a distinctly different vertebrate community. Burned areas may also provide opportunities for the invasion of exotic plant species such as European birch. Landfills have alienated bog habitat permanently, changed hydrology and affected water chemistry. Landfills also provide sites for the establishment of non-native and potentially invasive species. Other disturbances with varying impacts include clearing, especially in the forests east of Highway 91 and under power lines, and cultivation of agricultural fields, such as the extensive bare area created south of 80th Street. Twelve exotic plant species pose varying degrees of threat to the bog ecosystem. European birch invaded disturbed peat surfaces mostly since the 1970s and changed the structure of the pine-Sphagnum ecosystem at many sites, possibly leading to the decline of peat-forming vegetation. The scrambling branches of evergreen blackberry overwhelm native species mainly in the peripheral zone, but not in typical bog vegetation. Highbush blueberry has invaded several ecosystems and has the potential to displace and even hybridize with native species. The recent rapid spread of tawny cotton-grass suggests the potential for serious impact. Large cranberry is becoming well established in some wet sites and has the potential to displace the native bog cranberry. Of the five exotic animal invaders, Green Frogs and the highly predacious American Bullfrogs are most abundant and may lead to the decline of native amphibians and even fish and some mammals.
7.4 Ecosystem Dynamics
Most peat excavations are recovering naturally. Six species, Sphagnum fuscum, S.pacificum,
S.papillosum, S.rubellum, S.capillifolium and S.tenellum, colonize all types of disturbed surfaces. The cover of regenerating Sphagnum averages 27% but varies from 1%-97% according to the peat harvesting method. Sites harvested by vacuum and Western hydropeat methods exhibit low cover, hand cut sites have intermediate cover, and sites mined by the Atkins-Durbrow method exhibit high cover. The average annual accumulation rate is 0.13 t/ha of dry Sphagnum biomass. This biomass accumulation rate is lower than in natural peatlands and in bogs in the central part of the continent. Selected indicator species of drying and of nutrient status suggest that the major change from non-functioning to functioning bog vegetation takes place in the tall shrub stage of the pine-

238
Sphagnum ecosystem. The occurrence of pine-Sphagnum communities, interpreted to represent the transition to drying ecosystems and occurrence of birch, pine and mixed conifer stands suggests that 27.5% of original heathland is drying or has dried out recently. A study of tree-ring patterns showed that the Bog has been undergoing a trend to a lower water table and that peat mining and associated drainage have fostered the expansion of pine-dominated woody ecosystems. The tree-ring study also showed that old growth trees persist in the forests east of Highway 91 and north of 72nd Avenue. A review of the literature on restoration suggests there is extensive general information that can be used to reduce the impact of peat mining and to speed recovery in Burns Bog. The conditions for restoration in Burns Bog are favourable because there are many patches of bog vegetation in the disturbed area and a large natural zone surrounding the disturbed core. The Bog’s size provides more internal diversity and a large buffer from outside impacts. A preliminary ecosystem integrity/health analysis of essential ecosystem characteristics indicated that few characteristics were in an unimpaired state. Many, such as primary production of Sphagnum and vegetation structure were in a moderate state of integrity whereas others rated low. These include spatial extent, community composition, role of non-native species, several aspects of hydrology related to ditches and ponds, native soils and disturbance by humans. Overall, the ratings indicate that most ecosystem characteristics persist and function, but that some important ones such as hydrology differ from the normal functioning condition.
7.5 Global and Regional Significance
On a global scale, Burns Bog is distinct and unique because of its morphology, chemistry, flora and large size. Relative to European bogs it has a much lower dome considering the high precipitation. Burns Bog is chemically distinct from continental bogs because of the relatively high concentrations of sodium related to oceanic influence. The vegetation is distinct from continental and east coast raised bogs. In western North America, it is one of the southern-most raised bogs. Burns Bog undoubtedly contributes to ecosystem diversity in the Fraser Lowland where bogs are uncommon. Burns Bog, at about 2,800 ha, is 35 times larger than any other bog in the region. None of the remaining bogs is considered pristine. Burns Bog contains several plant species which do not occur in other bogs in the region or occur in only one other bog. With respect to relevant policy and legislative obligations, Burns Bog is not covered by any international conventions, or specific national and provincial legislation and policy. Hence, no specific conservation tools apply to the Bog. International and federal wetland initiatives that may be relevant include the United Nations Framework Convention on Climate Change (Kyoto Protocol), the Global Peatland Action Plan, the United Nations Convention on Biological Diversity, the Convention on Wetlands of International Importance (Ramsar Convention), the North American Wildlife Management Plan, the Federal Policy on Wetland Conservation. Several Provincial initiatives such as the Protected Areas Strategy may apply too.
239
Estimating the Bog’s role in regional atmospheric processes is complex. The annual amount of methane emission from the Bog can range from 10-510 tonnes per year or even more. The annual methane emission from BC wetlands is estimated to be 1.3x10⁵ tonnes, which suggests Burns Bog likely emits much less than 1% of the annual provincial total. With respect to CO2, the estimated total carbon stored in Burns Bog is about 1-2 million tonnes. If all the carbon were to be oxidized, it would represent 6%-12% of one year’s greenhouse gas emission for British Columbia.
7.6 Ecological Viability
The analysis of ecological viability and integrity focused on the essential ecosystem characteristics of hydrology, biodiversity, disturbance and connectivity. The Bog's east-west elliptical configuration and landscape position are strictly linked to the geologic and topographic peat-forming template. The north-east south-west axis has shaped the Bog’s hydrologic fabric and is important to its viability. The water mound is a dominant feature of bogs. Considering the major reduction in the water mound of the Bog and its sensitivity to further disturbance, all the area encompassed by the water mound is considered to be essential for ecological viability. The water mound must also be connected to lagg zones, consequently, the ecologically required area extends to the margins of the remaining bog on the west, south and much of the north side where lagg zones occur or have been replaced by ditches. The lagg must be on the inside margin of any buffer zone. Specifically, the connection to the lagg of Crescent Slough is required. A more natural lagg must be established along the perimeter of the City of Vancouver landfill, and a less irregular lagg zone must be established in the north-west sector adjacent to cranberry fields. The Burns Bog Ditch functions as a lagg along the northern margin and should continue to do so. On the east side of the Bog, water moving from the east side of Highway 91 north of 72nd Avenue should continue to flow westward to add to the zone of regenerating Sphagnum west of the highway, and to support the main water mound. To ensure adequate water storage, especially to foster peat-forming communities and their unique plant and animal communities, the Bog area cannot be reduced substantially beyond what it is today. To further enhance storage, the drainage effect of ditches must be reduced markedly. The new ditch system associated with the recent 80th Street extension must be blocked immediately and all other ditches should also be considered for damming to avoid shrinking of peat-forming ecosystems in the short term. The Bog is not likely viable if the ditches are not blocked. Bog ecosystems require specific nutrient poor, acidic waters and these should grade gradually to the water of surrounding non-bog landscape. For these reasons, much of the area covered by bog water (Type I) and parts covered by transitional water, especially where the Type II zone is narrow and connects to the lagg zone, are required for ecological viability. With respect to biodiversity, the first consideration is to maintain most of the relatively undisturbed bog vegetation so that it can sustain the unique bog biota and serve to naturally

240
recolonize adjacent disturbed sites within and adjacent to the water mound zone. All of the undisturbed areas except those too fragmented, narrow or distant from the water mound are required for the Bog’s ecological integrity. Concerning wildlife, the needs of red- and blue-listed species have high priority. All known sites of red-listed species, such as the Southern Red-backed Vole, and much of the moderately-high and moderately rated habitat are required for ecological viability. The main breeding and foraging areas plus a buffer are required for the viability of the Greater Sandhill Cranes in the Bog. In addition, zones of moderately high habitat suitability for the diversity of different wildlife types are vital to the Bog’s integrity and viability, not only for maintaining biodiversity but also for the ecological functions the species provide, and to increase the likelihood of maintaining undetected species. The area north of 72nd Avenue and east of Highway 91 constitutes the largest contiguous zone of moderately high and moderate habitat suitability for rare species and wildlife diversity. This area is required for the viability of the Bog. Other areas with moderately high wildlife habitat values, but which do not exhibit several other bog requirements, are considered important in support of the bog ecosystem, but are not required for its viability. The Bog is now largely isolated as natural area on the landscape. Consideration of conservation biology principles requires that it must remain as connected as possible with adjacent ecosystems to sustain the species diversity and ecosystem functions in the Bog. The most important connections include riparian corridors to the Fraser River, and a connection to the upland slopes of Panorama Ridge. An option should be maintained to re-establish a connection to Boundary Bay as well. Burns Bog is at risk to fire and drought. For these reasons, much of the current area of 2,800 must be retained as bog for the ecosystem complex to remain viable in the long term. Under the current fire frequency and size regime, the area of fully functional peat-forming vegetation in the Bog will be reduced to about two-thirds of what it is today before it begins to increase. If the area of bog was reduced to less than 2,000 ha the peat-forming zone would be too small to recover substantially under the current fire regime. In addition to defining an adequate area for ecological viability, a monitoring program of critical indicators is needed. These indicators should indicate whether important attributes of viability such as high water table and key species are in-line with measures of ecological integrity.
241
7.7 Conclusions
General x Burns Bog is a raised bog and has the typical characteristics of peat and water mound, radial
drainage, acidic and nutrient-poor water and soil, and Sphagnum – heath-dominated plant communities.
x Burns Bog is globally unique on the basis of its chemistry, form, flora and large size. x Today the Bog is isolated from adjacent natural ecosystems by urban, industrial and
agricultural development. x Forty percent of the original bog area has been alienated by development. x Peat mining and other activities have disturbed the hydrology and ecosystems of more than
half of the remaining bog. These disturbances continue to affect the Bog today.
Hydrology x Precipitation is, and must continue to be the dominant source of water and nutrients in the
bog ecosystem. x The Bog’s water balance suggests a surplus of only 200 mm of precipitation over
evapotranspiration for an average year. x The Bog’s ecological viability is directly dependent on the extent and integrity of the water
mound and the peat that encloses it. x Further disruption of the water mound poses high risk to the integrity and viability of Burns
Bog. x The upper porous layer or acrotelm is vital to the persistence of the water mound and peat-
forming communities. The existing area of acrotelm must be maintained and a fully functional acrotelm must re-develop over the area of the water mound.
x Little of the essential lagg zone remains in an undisturbed state. A fully functioning lagg must occur at the margins of the water mound.
x Ditches drain water in excess of normal discharge leading to a decrease in water storage and in the critical summer water-table position threatening the Bog's viability.
x The water-chemistry of the majority of the Bog is acidic and nutrient-poor, typical for a raised bog. It provides a useful guide for identifying areas required for viability.
x Transitional waters are required to separate typical bog water from adjacent mineral water. x Water from the east side of Highway 91 may play an important role in sustaining shallow
pools that support the main water mound.
Biota x The undisturbed plant communities that occur in the southern third and in the north-west
sector of the bog are vital to its survival. x The Burns Bog area includes several nationally and provincially listed animals such as the
Pacific Water Shrew and plant communities in both the core central area and at the margins. x Burns Bog harbours the only known habitat for Southern Red-backed Vole in the province,
and critical habitat for the regional Greater Sandhill Crane population.

242
x Rare insects occur in the distinct wet habitats of the Bog. x The Bog plays an important regional role in ecological and wildlife diversity by providing
habitat for Fraser River estuary waterfowl, maintaining the largest extent of bog ecosystems in the Fraser Lowland, and harbouring several species at their southern limits of geographic range.
Processes x The expansion of forest communities indicates that the bog has been and is drying because of
drainage by ditches. x Widespread Sphagnum regeneration is occurring in the abandoned peat workings of the
central bog. x The Bog area is highly sensitive to fire and must remain large to be viable under the current
fire regime. x Three drought years could markedly lower the position of the late summer water table to a
point where it may not support typical bog communities. x Connectivity is limited, but must be maintained for the long-term viability of the Bog,
especially its wildlife. x Exotic species occur on disturbed peat but do not occur in undisturbed vegetation to any
extent.
Viable Area x The water mound zone and its peripheral lagg are required for ecological viability. x The area east of Highway 91 and north of 72nd Avenue is required to support high
biodiversity attributes, to provide water to the main part of the Bog west of Highway 91, and to connect the Bog to upland habitats.
x The water mound zone must be connected to the area east of Highway 91 via a broad zone of Sphagnum regeneration and typical bog water. Water in the shallow ponds within this zone supports the water mound.
x Ditches that drain the water mound zone must be blocked as soon as possible to support the water mound and peat-forming processes or the Bog will continue to shrink and will not be viable.
x A program of ongoing monitoring of key indicators of ecosystem integrity is essential to determine whether required ecosystem characteristics, such as the hydrologic regime, remain intact.
Considering the preceding conclusions, approximately 2,450 ha of the 2,800 ha of ecologically available area are required to preserve the ecological integrity and viability of Burns Bog and sustain its distinct processes and lifeforms. By maintaining an area of this size, monitoring key indicators, and adjusting management action, this globally unique ecosystem has a reasonable likelihood of persisting long into the future.

243
8.0 References Cited
AGRA Earth & Environmental Limited, 1999a. Burns Bog Ecosystem Review. Geology. Report prepared for Delta Fraser Properties Partnership and the Environmental Assessment Office in support of the Burns Bog Ecosystem Review, with additional work on publicly owned lands conducted for the Environmental Assessment Office in association with the Corporation of Delta. AGRA Earth & Environmental Limited, Burnaby, BC.
AGRA Earth & Environmental Limited, 1999b. Native Soil Conditions. Burns Bog and
Surrounding Lands. Burns Bog Ecosystem Review. Report prepared for Delta Fraser Properties Partnership and the Environmental Assessment Office in support of the Burns Bog Ecosystem Review, with additional work on publicly owned lands conducted for the Environmental Assessment Office in association with the Corporation of Delta. AGRA Earth & Environmental Limited, Burnaby, BC.
AGRA Earth & Environmental Limited, 1999c. Burns Bog Ecosystem Review. Contaminated
Soils/Water. Delta, British Columbia. Report prepared for Delta Fraser Properties Partnership and the Environmental Assessment Office in support of the Burns Bog Ecosystem Review. AGRA Earth & Environmental Limited, Burnaby, BC.
Amstrup, S.C. and J. Beecham, 1976. Activity patterns of radio-collared black bears in Idaho. Journal of Wildlife Management 40: 340-348.
Andrus, R.E., E.F. Karlin, and S.S. Talbot, 1992. Rare and endangered Sphagnum species in North America. Biological Conservation 59: 247-254.
Andrusiak, L., 1992. Barn owls in the Fraser Valley. Discovery 21: 99-102.
Anonymous, 1983. Fisheries Studies in Crescent Slough, January to April, 1983. Prepared for BC Ministry of Environment, Lands and Parks, Lower Mainland Regional Office, Surrey, BC.
Anonymous, 1999. Delta Drainage. Unpublished map 1:30,000, Corporation of Delta.
Anrep, A., 1928. Peat bogs for the manufacture of peat litter and peat mull in southwest British Columbia. In: W.H. Collins (director), Geological Survey. Summary Report, 1927, Part
A. Department of Mines, Canada, Geological Survey, Ottawa, Ontario.
Armentano, T.V. and E.S. Menges, 1986. Patterns of change in the carbon balance of organic soil-wetlands of the temperate zone. Journal of Ecology 74: 755-774.
Armstrong, J.E. and S.R. Hicock, 1980. Surficial Geology maps of New Westminister and Vancouver Maps Sheets 1484A and 1486A (1:50,000 scale incorporates all or parts of NTS map sheets 92G/2, 92G/3, and 92G/6 and 92G/7), Geological Survey of Canada, Ottawa.

244
Armstrong, J.E., C. Roots, and C. Staargaard, (eds.), 1990. Vancouver Geology, Geological Association of Canada, Cordilleran Section, Vancouver.
Aselmann, I. and P.J. Crutzen, 1990. A global inventory of wetland distribution and seasonality, net primary productivity, and estimated methane emissions. In: A.F. Bouwman (ed.), Soils and the Greenhouse Effect. John Wiley and Sons Ltd. Chichester. pp.441-449.
Atmospheric Environment Service, 1993. Canadian Climate Normals 1961-1990 British Columbia, Environment Canada, Ottawa.
Balfour, J. and Banack, 2000. Burns Bog Ecosystem Review. Water Chemistry. Report prepared for Delta Fraser Properties Partnership and the Environmental Assessment Office in support of the Burns Bog Ecosystem Review, with additional data collected on publicly owned lands conducted for the Environmental Assessment Office in association with the Corporation of Delta. EBA Engineering Consultants Ltd., Vancouver, BC.
Banner, A., R.J. Hebda, E.T. Oswald, J. Pojar, and R. Trowbridge, 1988. Wetlands of Pacific Canada. In: National Wetlands Working Group Canada Committee on Ecological Land Classification. Wetlands of Canada. Ecological Land Classification Series, No. 24. Polyscience Publications Inc., Montreal, Quebec.
Barendregt, A., M.J. Wassen, and P.P. Schot, 1995. Hydrological systems beyond a nature reserve, the major problem in wetland conservation of Naardermerr (The Netherlands). Biological Conservation 72: 393-405.
Barnard, A., 1988. Status of Wildlife in Burns Bog Area – A Preliminary Review. April 1988. Unpublished report prepared for the Burns Bog Conservation Society, Delta, BC.
Barnard, A., 1992. Review of the TERA Planning Ltd. (July 1992) report on wildlife use of Burns
Bog. Unpublished note. BC Ministry of Environment, Lands and Parks, Lower Mainland Regional Office, Surrey, BC.
Bartlett, K.B. and R.C. Harris, 1993. Review and assessment of methane emissions from wetlands. Chemosphere 26: 261-320.
Bauer, H.H. and M.C. Mastin. 1996. Recharge from precipitation in three small glacial-till-
mantled catchments in the Puget Sound Lowland, Washington. Water-Resources Investigations Report 96-4219. U.S. Geological Survey: Washington, D.C. 119 p.
Bavina, L.G., 1967. Refinement of parameters for calculating evaporation from bogs on the basis of observations at bog stations. Soviet Hydrology 1967: 348-370.
Bay, R.R., 1967. Ground water and vegetation in two peat bogs in northern Minnesota. Ecology 48: 308-310.
Bay, R.R., 1968. The hydrology of several peat deposits in northern Minnesota, U.S.A. Proceedings of the Third Annual Peat Congress, Quebec. p. 212-218.
245
Beak Consultants Limited, 1982. Annacis Highway Impact Assessment. Report prepared for the BC Ministry of Transportation and Highways, Richmond, BC.
Bedford, B.L., M.R. Walbridge, and A. Aldous, 1999. Patterns in nutrient availability and plant diversity of temperate North American wetlands. Ecology 80: 2151-2169.
Beets, C.P. 1992. The relationship between the area of open water in bog remnants and storage capacity with resulting guidelines for bog restoration. In: O.M. Bragg, P.D. Hulme, H.A.P. Ingram and R.A. Robertson (eds.). Peatland Ecosystems and Man: an Impact
Assessment. Department of Biological Sciences, University of Dundee, UK.
Belotserkovskaya, O.A., I.F. Largin, and V.V Romanov, 1969. Investigation of surface and internal evaporation on high-moor bogs. Soviet Hydrology. 1969: 540-554.
Biggs, W.G., 1976. An Ecological and Land Use Study of Burns Bog, Delta, British Columbia. M.Sc. Thesis, Plant Sciences Department, University of British Columbia, Vancouver, BC.
Biggs, W.G. and R.J. Hebda, 1976. Discover Burns Bog, Delta, British Columbia. Discovery 5: 2-8.
Boelter, D.H., 1969. Physical properties of peats as related to degree of decomposition. Soil
Science Society of America Proceedings 33: 606-609.
Boelter, D.H., 1972. Water table drawdown around an open ditch in organic soils. Journal of
Hydrology 15: 329-340.
Botch, M.S. and V.V. Masing, 1983. Mire ecosystems in the USSR. In: A.J.P Gore (ed.), Mires: Swamp, Bog, Fen, and Moor. Regional Studies. Ecosystems of the World 4B. Elsevier Publishing Company, New York. pp. 95-152.
Bradof, K.L., 1992. Impact of ditching and road construction on Red Lake Peatland. In: H.E. Wright, B.A. Coffin and N.E. Aaseng (eds.). The Patterned Peatlands of Minnesota. University of Minnesota Press, Minneapolis, Minnesota.
Braekke, F.H., 1981. Hydrochemistry of low pH soils of South Norway. II. Seasonal variation in some peatland sites. Meddelelser Norsk Institut for Skogforskning 36: 1-22.
Breault, A.M. and R.W. Butler, 1992. Abundance, distribution and habitat requirements of American Wigeons, Northern Pintails and Mallards in farmlands. In: Butler, R.W. (ed.), Abundance, Distribution and Conservation of Birds in the Vicinity of Boundary Bay,
British Columbia. Technical Report Series No. 155. Canadian Wildlife Service, Pacific and Yukon Region.
British Columbia Round Table on the Environment and the Economy, 1992. Towards a Strategy
for Sustainability. British Columbia Round Table on the Environment and the Economy, Victoria, BC.

246
Brooks, S. and R. Stoneman, 1997a. Conserving Bogs: The Management Handbook. The Stationery Office Ltd. Edinburgh.
Brooks, S. and R. Stoneman, 1997b. Tree removal at Langlands Moss. In: L. Parkyn, R.E. Stoneman, and H.A.P. Ingram (eds.). Conserving Peatlands. CAB International, New York.
Brown, A., S.P. Mathur, and D.J. Kushner, 1989. An ombrotrophic bog as a methane reservoir. Global Biogeochemical Cycles 3: 205-213.
Brown, D. A., 1998. Gas production from an ombrotrophic bog –effect of climate change on microbial activity. Climatic Change 40: 277-284.
Brown, D. A., and R.P. Overend, 1993. Methane metabolism in raised bogs of northern wetlands. Geomicrobiology Journal 11: 35-48.
Burns, B. 1997. Discover Burns Bog. Hurricane Press, Vancouver, BC.
Bury, R.B. and P.S. Corn, 1987. Evaluation of pitfall trapping in northwestern forests: trap arrays with drift fences. Journal of Wildlife Management 51:112-119.
Butler, R.W. and M.J. Foottit, 1974. Preliminary survey of Burns Bog, June 25 to August 7, 1974. Fish and Wildlife Branch, BC Ministry of Environment, Lands and Parks, Lower Mainland Region, Surrey, BC.
Butler, R.W. and R.W. Campbell, 1987. The Birds of the Fraser River Delta: Populations,
Ecology and International Significance. Environment Canada, Canadian Wildlife Service, Ottawa, Ontario.
Butler, R.W. and R.J. Cannings, 1989. Distribution of birds in the intertidal portion of the
Fraser River delta, British Columbia. Technical Report Series No. 93. Canadian Wildlife Service, Pacific and Yukon Region.
Cairns, J.Jr., and P.V. McCormack, 1992. Developing an ecosystem based capability for ecological risk assessment. Environmental Professional 14: 186-196.
Cajander, A.K., 1913. Studien über die Moore Finnlands. Acta Forestalia Fennica 2: 1-208.
Campbell, R.W., N.K. Dawe, I. McTaggart-Cowan, J.M. Cooper, G.W. Kaiser, and M.C.E. McNall, 1990. The Birds of British Columbia, Volume 2: Nonpasserines – Diurnal Birds
of Prey through Woodpeckers. Royal British Columbia Museum, Victoria, BC, Environment Canada, and Canadian Wildlife Service, Delta, BC. 636 p.
Canadian Council of Ministers for the Environment (CCME), 1996. Freshwater Aquatic Life. Chapter 3 in Canadian Water Quality Guidelines, April 1996. Canadian Council of Ministers for the Environment.

247
Cannings, S.G., L.R. Ramsay, D.F. Fraser, and M.A. Fraker, 1999. Rare amphibians, reptiles,
and mammals of British Columbia. Wildlife Branch and Resources Inventory Branch, BC Ministry of Environment, Lands and Parks, Victoria, BC 198 p.
Carter, V., 1986. An overview of the hydrological concerns related to wetlands in the United States. Canadian Journal of Botany 64: 364-374.
Catherine Berris and Associates Inc., 1993. Boundary Bay Area Studies: Burns Bog Analysis. Report prepared for the BC Ministry of Environment, Lands and Parks. Victoria, BC. 60 p.
Caughley, G. and A. Gunn, 1996. Conservation Biology in Theory and Practice. Blackwell Science, Oxford. 459 p.
Caughley, G., 1994. Directions in conservation biology. Journal of Animal Ecology 63: 215-244.
Clague, J.J., 1989. Introduction (Quaternary stratigraphy and history, Cordilleran Ice Sheet). In: R.J. Fulton (ed.), Quaternary Geology of Canada and Greenland, Geological Survey of Canada, No. 1 (Also Geological Society of America, The Geology of North America, v K-1).
Clague, J.J., J.L. Luternauer, P.A. Monahan, K.A. Edwardson, S.R. Dallimore, and J.A. Hunter, 1998. Quaternary stratigraphy and evolution. In: J.J. Clague, J.L. Luternauer, and D.C. Mosher (eds.). Geology and Natural Hazards of the Fraser River Delta, British
Columbia. Geological Survey of Canada, Bulletin 525: 57-90.
Clymo, R.S., 1963. Ion exchange in Sphagnum and its relation to bog ecology. Annals of Botany,
New Series 27: 309-324.
Clymo, R.S. and P.M. Hayward, 1982. The ecology of Sphagnum. In: A.J.E. Smith (ed.). Bryophyte Ecology, Chapman & Hall, London.
Clymo, R.S., 1983. Peat. In: A.J.P Gore (ed.), Ecosystems of the World 4A: Mires: Swamp, Bog,
Fen and Moor, Elsevier, Amsterdam, pp. 159-224.
Clymo, R.S., 1984. The limits to peat bog growth. Philosophical Transactions of the Royal
Society of London, B (Biological Sciences) 303: 605-654.
Clymo, R.S., 1991. Peat growth. In: L.C.K. Shane and E.J. Cushing (eds.). Quarternary
Landscapes, Belhaven Press, London.
Clymo, R.S., 1992. Productivity and decomposition of peatland ecosystems. In: O.M. Bragg, P.D. Hulme, H.A.P. Ingram and R.A. Robertson (eds.). Peatland Ecosystems and Man:
an Impact Assessment. Department of Biological Sciences, University of Dundee, UK.
Collier, R., 1999. Restoration Possibilities Study. Report prepared for Delta Fraser Properties Partnership and the Environmental Assessment Office in support of the Burns Bog Ecosystem Review. Richard Collier, Restoration Consultant, Victoria, BC.
248
Commission on Resources and Environment (CORE), 1994a. Finding Common Ground: A
Shared Vision for Land Use in British Columbia. CORE, Victoria, BC.
Commission on Resources and Environment (CORE), 1994b. Finding Common Ground: A
Shared Vision for Land Use in British Columbia, Appendices. CORE, Victoria, BC.
Commission on Resources and Environment (CORE), 1994c. The Provincial Land Use Strategy,
Volume I: A Sustainability Act for British Columbia. CORE, Victoria, BC.
Cook, E.R., 1990. A conceptual linear aggregate model for tree rings. Methods of
Dendrochronology: Applications in the Environmental Sciences. In: E.R. Cook and L.A. Kairiukstis (eds.). Kluwer Academic Publishers, Dordrecht, Netherlands, pp. 98-104.
Cooper, J.M., 1996. Status of the Sandhill Crane in British Columbia. Wildlife Bulletin No. B-83. Wildlife Branch, BC Ministry of Environment, Lands and Parks, Victoria, BC.
Corporation of Delta, 1990. Surface drainage data on file at the Land Use Coordination Office, Victoria, BC.
Cranston, R., D. Ralph, and B. Wikeem, 1996. Field Guide to Noxious and Other Selected
Weeds of British Columbia. BC Ministry of Agriculture, Fisheries and Food and BC Ministry of Forests, BC.
Crowell, K.L., 1973. Experimental zoogeography: introduction of mice to small islands. The
American Naturalist 107: 535-558.
Crum, H. 1988. A Focus on Peatlands and Peat Mosses. University of Michigan, Ann Arbor, U.S.A.
Damman, A.W.H., 1977. Geographical changes in the vegetation pattern of raised bogs in the Bay of Fundy region of Maine and New Brunswick. Vegetatio 35: 137-151.
Damman, A.W.H., 1979a. Geographical patterns in peatland development in eastern North America. In: E. Kivenin, L. Heikurainen, and P. Pakarinen (eds.). Proceedings of the
International Symposium on Classification of Peat and Peatlands. International Peat Society. pp. 42-57.
Damman, A.W.H., 1979b. Amphi-Atlantic correlations in the Oxycocco-Sphagnetea: a critical evaluation. Documents Phytosociologiques (Lille) 6: 187-195.
Damman, A.W.H. and J.J. Dowhan, 1981. Vegetation and habitat conditions in Western Head Bog, a southern Nova Scotian plateau bog. Canadian Journal of Botany. 59:1343-1359.
Damman, A.W.H. and T.W. French, 1987. The Ecology of Peat Bogs of the Glaciated
Northwestern United States: a Community Profile. U.S. Fish and Wildlife Service Biological Report 85

249
Damman, A.W.H., 1987. Variation in ombrotrophy: chemical differences among and within ombrotrophic bogs. In: C.D.A. Rubec and R.P. Overend. Proceedings: Symposium 1987
Wetlands/Peatlands. pp. 85-93.
Dang, Q.L. and V.J. Lieffers, 1989. Assessment of patterns of response of tree ring growth of black spruce following peatland drainage. Canadian Journal of Forest Research 19: 924-929.
Davis, R.B. and D.D. Anderson, 1991. The Eccentric Bogs of Maine: a rare wetlands type in the
United States. Maine Agricultural Experiment Station Technical Bulletin 146, 168 p.
DeAngelis, D.L., 1980. Energy flow, nutrient cycling, and ecosystem resilience. Ecology 61: 764-771.
DeMill, D., 1994. Delta Ditches and Sloughs. Unpublished report.
DeMill, D., 1999a. Culverts under Hwy 91 in the portion of Burns Bog between 64th and the Alex Fraser Cloverleaf. Unpublished notes with map. Environmental Assessment Office, Victoria, BC.
DeMill, D., 1999b. Comments on Plant Report by Madrone on Burns Bog. Submission to the Environmental Assessment Office, Victoria, BC.
DeMill, D., 1999c. Peat Harvesting in Burns Bog. Unpublished report.
DeMill, D. and W. Paulik, 1997. Interim Report – Selected Waterways of Delta, Surrey,
Vancouver and Richmond. Unpublished report. Prepared for Heritage Forest Society.
Department of Lands and Forests, 1958a. Crescent Beach, British Columbia. Map 92G/2d. Province of British Columbia, Victoria. BC.
Department of Lands and Forests, 1958b. New Westminster, British Columbia. Map 92G/2e. 1:25,000, Province of British Columbia, Victoria. BC
Department of Energy, Mines and Resources, 1961a. Ladner, British Columbia. Map 92G/3a. 1:25,000, Ottawa.
Department of Energy, Mines and Resources, 1961b. Mitchell Island, British Columbia. Map 92G/3h. 1:25,000, Ottawa.
Dierssen, B. and K. Dierssen, 1984. Vegetation und flora der Schwarzwaldmoore. Beihefte zu
den üreröffent lichungengen für Naturschutz und Landschaftsflege in Baden-
Württemberg 39.
Doak, D.F. and L.S. Mills, 1994. A useful role for theory in conservation. Ecology 75: 615-626.
Douglas, L., 1995. Derby Reach Regional Park, Biophysical Description. Report prepared for the Greater Vancouver Regional District Parks Department, Burnaby, BC.

250
Douglas, L. and C. Chapman, 1998. Derby Reach Biophysical Report, Addendum 1995: Langley
Peat Lands and Western Parcels. Report prepared for the Regional Parks Department, Greater Vancouver Regional District, Burnaby, BC.
Douglas, G., G.B. Straley, D. Meidinger, and J. Pojar., 1998. Illustrated Flora of British
Columbia. Volumes 1 & 2. BC Ministry of Environment, Lands and Parks and BC Ministry of Forests, Victoria, BC.
Dunbar, D., 1999. Burns Bog critical wildlife habitat assessment. December 5, 1999. Unpublished notes. On file at Environmental Assessment Office, Victoria, BC.
Dunbar, D., 2000. Review of Section 4.0 biophysical characteristics of Burns Bog, unpublished notes, On file at Environmental Assessment Office, Victoria, BC.
Egglesmann, R., 1990. Moor und wasser. In: Kh. Göttlich (ed.). Moor und Torfekunde. E. Schweizerbart’sche Verlagsbuchhandlung, Stuttgart.
Egglesmann, R., A.L. Heathwaite, G. Grosse-Brauckmann, E. Küster, W. Naucke, M. Schuch, and V. Schweickle, 1993. Physical processes and properties of mires. In: A.L. Heathwaite and Kh. Göttlich (eds.). Mires: Process, Exploitation and Conservation, John Wiley & Sons Ltd., Chichester, pp. 171-262.
Elling, A.E. and M.D. Knighton, 1984. Sphagnum moss recovery after harvest in a Minnesota bog. Journal of Soil and Water Conservation 39: 209-211.
ENKON Environmental Limited, 1999. Environmental Inventory and Issue Identification of
Burns Bog Delta, BC. Prepared for Delta Fraser Properties Partnership, June 1999.
Environmental Assessment Office (EAO), 1999. Burns Bog Ecosystem Review Study
Framework. British Columbia Environmental Assessment Office, Victoria, BC. http://www.eao.gov.bc.ca/special/burnsbog.htm.
Environmental Assessment Office (EAO), 2000. Unpublished field notes. On file at the Environmental Assessment Office, Victoria, BC.
Enviro-Pacific Consulting, 1999. Status of the Greater Sandhill Crane (Grus canadensis tabida)
in Burns Bog, Delta-1999. Report prepared for ENKON Environmental Ltd.
Equihua, M. and M.B. Usher, 1993. Impact of carpets of the invasive moss Campylopus
introflexus on Calluna vulgaris regeneration. Journal of Ecology 81:359.
Eurola, S., 1962. Über die regional Einteilung der südfinnishcen Moore. Annales Botanica Soc., “Vanamo” 33: 1-243.
Eurola, S., S. Hicks, and E. Kaakinen, 1984. Key to Finnish mire types. In: P.D. Moore (ed.). European Mires. Academic Press, London.
Flatberg, K.I., 1987. Sphagnum (Cuspidata) pacificum, sp. nov. The Bryologist 92: 116-119.

251
Flynn, S., 2000. “Special Feature: Rare Plant Associations.” BC Conservation Data Centre. http://www.elp.gov.bc.ca/rib/wis/cdc/special.htm
Foster, J.B., J. Pojar, L.K. Wade, A. Burbidge, K.I. Beamish, and M. North, 1976. International Biological Program Application for Ecological Reserve, No. 270, Surrey Bend. BC Ministry of Environment, Lands and Parks, Victoria, BC.
Fraker, M., C. Bianchini, and I. Robertson, 1999. Burns Bog Ecosystem Review. Small
Mammals. Report prepared for Delta Fraser Properties Partnership and the Environmental Assessment Office in support of the Burns Bog Ecosystem Review. Robertson Environmental Services Ltd., Langley, BC, and TerraMar Environmental Research Ltd., Sidney, BC.
Fraser, D.F., W.L. Harper, S.G. Cannings, and J.M. Cooper, 1999. Rare Birds of British
Columbia. Resources Inventory Branch, BC Ministry of Environment, Lands and Parks, Victoria, BC. 236 p.
Friends of the Earth, 1992. The Global Status of Peatlands and their Role in Carbon Cycling. A report for Friends of the Earth prepared by The Wetlands Ecosystem Research Group, Department of Geography, University of Exeter.
Frilander, P.A., Leinonen, and E. Alakangas., 1996. Peat production technology. In: H. Vansander (ed.). Peatlands in Finland. Finnish Peat Society, Helsinki, Finland. pp. 99-106.
Fritts, H.C., 1976. Tree Rings and Climate. Academic Press, London.
Gebauer, M., and T. Bekhuys, 1994. Status and habitat use of birds at Burns Bog, Delta, BC. Discovery 23: 51-60.
Gebauer, M.B., 1995. Status, Reproductive Success and Habitat Requirements of Greater
Sandhill Cranes (Grus canadensis tabida) in the Lower Fraser River Delta in 1993 and
1994. Report prepared for the BC Ministry of Environment, Lands and Parks, Surrey, BC. 70 p.
Gebauer, M.B., 1999a. Status of Wildlife in Burns Bog, Delta 1999. Late Summer/Early Fall
1999 Survey Results and Review of Existing Information. Report prepared for Delta Fraser Properties Partnership and the Environmental Assessment Office in support of the Burns Bog Ecosystem Review, with additional work on publicly owned lands conducted for the Environmental Assessment Office in association with the Corporation of Delta. Enviro-Pacific Consulting, Surrey, BC.
Gebauer, M.B., 1999b. Burns Bog Greater Sandhill Crane (Grus canadensis tabida) Study. Late
Summer/Early Fall 1999 Survey Results and Review of Existing Information. Report prepared for Delta Fraser Properties Partnership and the Environmental Assessment Office in support of the Burns Bog Ecosystem Review, with additional work on publicly owned lands conducted for the Environmental Assessment Office in association with the Corporation of Delta. Enviro-Pacific Consulting, Surrey, BC.

252
Gebauer, M.B., 2000. Burns Bog Terrestrial Ecosystem Mapping. Wildlife Interpretations. Report prepared for Delta Fraser Properties Partnership and the Environmental Assessment Office in support of the Burns Bog Ecosystem Review. Enviro-Pacific Consulting, Surrey, BC.
Gedalof, Z., 1999. Burns Bog and Adjacent Areas. Dendroecology. Report prepared for Delta Fraser Properties Partnership and the Environmental Assessment Office in support of the Burns Bog Ecosystem Review. Flat Earth Neogeographics in cooperation with the University of Victoria Tree-Ring Laboratory, Victoria, BC.
Giller, K.E. and B.D. Wheeler, 1986. Peat and water chemistry of a flood-plain fen in Broadland, Norfolk, UK. Freshwater Biology 16: 99-114.
Glaser, D. H., G.A. Wheeler, E. Gorham, and H.E. Wright Jr., 1981. The patterned mires of the Red Lake Peatland, northern Minnesota: vegetation, water chemistry and landforms. Journal of Ecology 69: 575-599.
Glaser, P.H. and J. A. Janssens, 1986. Raised bogs in easter North America: transitions in landforms and gross stratigraphy. Canadian Journal of Botany 64: 395-415.
Glaser, P.H., 1992. Raised bogs in eastern North America – regional controls for species richness and floristic assembloges. Journal of Ecology 80: 535-554.
Glaser, P.H., D.I. Siegel, E.A. Romanowicz, and Y.P. Shen, 1997. Regional linkages between raised bogs and the climate, groundwater and landscape of north-western Minnesota. Journal of Ecology 85: 3-16.
Golinski, G.K., 1999. Unpublished notes submitted to the Environmental Assessment Office, Victoria, BC.
Golinski, G.K., 2000. Bogs of the Fraser Lowland. Report prepared for the Environmental Assessment Office, Province of British Columbia, in support of the Burns Bog Ecosystem Review. Environmental Assessment Office, Victoria, BC.
Goode, D.A., A.A. Marsan, and J.R. Michaud, 1977. Water resources. In: N.W. Radforth and C.O. Brawner (eds.). Muskeg and the Northern Environment in Canada. University of Toronto Press, Toronto. pp. 299-331.
Gorham, E., 1956. The ionic composition of some bog and fen waters in the English Lake District. Journal of Ecology 44: 142-152.
Gorham, E., 1990. Biotic impoverishment in northern peatlands. Chapter 5. In: G. M. Woodwell (ed.). The Earth in Transition: Patterns and Processes of Biotic Impoverishment. Cambridge University Press, Cambridge, pp. 65-98.
Gorham, E., S.J. Eisenreich, J. Ford, and M.V. Santelmann, 1985. The chemistry of bog waters. In: W. Stumm (ed.). Chemical Processes in Lakes, J. Wiley & Sons, New York.

253
Gorham, E., J.A. Janssens, B.D. Wheeler and P.H. Glaser. 1987. The natural and anthropogenic acidification of wetlands. In: T.C. Hutchinson and K.M.Keema (eds.). Effects of
Atmospheric Pollutants on Forests, Wetlands and Agricultural Ecosystems. Springer-Verlag, Berlin.
Gorham, E. and J.A. Janssens, 1992. Concepts of fen and bog re-examined in relation to bryophyte cover and the acidity of surface waters. Acta Societatis Botanicorum Poloniae
61: 7-20.
Göttlich, Kh., K.H. Richard, H. Kuntze, R. Egglesmann, J. Günther, D. Eichelsdörfer, and G. Briemle, 1993. Mire utilization. In: A.L. Heathwaite and Kh. Göttlich (eds.). Mires:
Process, Exploitation and Conservation. John Wiley & Sons Ltd., Chichester. Pp. 325-416.
Government of Canada, 1991. The Federal Policy on Wetland Conservation. Ministry of Supply and Services, Canadian Wildlife Service, Ottawa.
Goward, T. and W.B. Schofield, 1983. The lichens and bryophytes of Burns Bog, Fraser Delta, southwestern British Columbia. Syesis 16: 53-69.
Goward, T., B. McCune and D. Meidinger., 1994. The Lichens of British Columbia: Illustrated
Keys. Part 1 – Foliose and Squamulose Species. BC Ministry of Forests Research Program, Victoria, BC.
Goward, T., 1999. The Lichens of British Columbia: Illustrated Keys. Part 2 – Fruticose Species. BC Ministry of Forests, Research Program, Victoria, BC.
Granlund, E., 1932. De svenska högmossarnas geologi. Sveriges Geologiska Undersökning, Series C, No. 373: 1-193.
Green, B.H., and M.C. Pearson, 1968. The ecology of Wybunbury Moss, Cheshire. 1. The present vegetation and some physical, chemical and historical factors controlling its nature and distribution. Journal of Ecology 56: 245-267.
Grimm, V. and C. Wissel, 1997. Babel, or the ecological stability discussions: an inventory and analysis of terminology and a guide for avoiding confusion. Oecologia 109: 323-334.
Gustavson, K.R., S.C. Lonergan, and H.J. Ruitnebeek, 1999. Selection and modelling of sustainable development indicators: a case study of the Fraser River Basin, British Columbia. Ecological Economics 28: 117-132.
Halsey, L., D. Vitt, and S. Zoltai, 1997. Climatic and physiographic controls on wetland type and distribution in Manitoba, Canada. Wetlands 17: 243-262.
Halsey, L.A., D.H. Vitt, and L.D. Gignac, 2000. The distribution of Sphagnum-dominated peatlands in North America since the Last Glacial Maximum. The Bryologist (in review).
Hammond, R.F., 1979. The peatlands of Ireland, An Foras Taluntais, Dublin, Soil Survey Bulletin No. 35, 58 p.

254
Hanski, I. and M. Gilpin, 1991. Metapopulation dynamics: brief history and conceptual domain. Biological Journal of the Linnean Society 42: 3-16.
Hansson, L., L. Söderström, and C. Solbreck, 1992. The ecology of dispersal in relation to conservation. In: L. Hansson (ed.), Ecological Principles of Nature Conservation. The Netherlands, Elsevier. pp.162-200.
Hare, F.K. and M.K. Thomas, 1979. Climate Canada 2nd Edition. John Wiley & Sons Canada Ltd., Toronto 230p.
Harrison, S., 1994. Metapopulations and conservation. In: P.J. Edwards, R.M. May, and N.R. Webb (eds.), Large-Scale Ecology and Conservation Biology. Blackwell Scientific Publications, Oxford. pp.111-128.
Harwell, M.A., 1997. Ecosystem Management of South Florida. Bioscience 47: 499-512.
Harwell, M.A., V. Myers, T. Young, A. Bartuska, N. Gassman, J.H. Gentile, C.C. Harwell, A. Appelbaum, J. Barko, B. Causey, C. Johnson, A. McLean, R. Smola, P. Templet, and S. Tosini, 1999. A framework for an ecosystem integrity report card. Bioscience 49: 543-556.
Haycock, R.D., 1999. Status Report on the Oregon Spotted Frog, Rana pretiosa in Canada. Preliminary Report prepared for the committee on the Status of Endangered Wildlife in Canada, Ottawa 21pp
Hayward, P.M. and R.S. Clymo, 1982. Profiles of water content and pore size in Sphagnum and peat, and their relation to peat bog ecology. Proceedings of the Royal Society of London
(Biology) 215: 299-325.
Healey, M.C., 1997. Fraser Basin Ecosystem Study. Final report on the Tri-Council funded eco-research project at the University of British Columbia, Vancouver, BC.
Heathwaite, A.L., 1995. The impact of disturbance on mire hydrology. In: J. Hughes and L. Heathwaite (eds.). Hydrology and Hydrochemistry of British Wetlands. John Wiley & Sons Ltd., Chichester.
Heathwaite, A.L., Kh. Göttlich, E.G. Burmeister, G. Kaule, and T.H. Grospietsch, 1993. Mires: Definitions and Form. In: A.L. Heathwaite and Kh. Göttlich (eds.). Mires: Process,
Exploitation and Conservation. John Wiley & Sons Ltd., Chichester. pp. 1-76.
Hebda, R.J., 1977. The Paleoecology of a Raised Bog and Associated Deltaic Sediments of the
Fraser River Delta. Ph.D. dissertation. University of British Columbia, Vancouver, BC.
Hebda, R.J., 1990. Burns Bog: its origins and development. Discovery 19: 119.
Hebda, R.J., 1999. Restoration and climate change. In: B. Egan (ed.) Helping the Land Heal:
Ecological Restoration in British Columbia. Conference Proceedings Nov.5-8, 1998,

255
Victoria British Columbia, BC. Environmental Network Foundation, Vancouver. pp. 125-128.
Hebda, R.J. and W.G. Biggs, 1981. The vegetation of Burns Bog, Fraser Delta, southwestern British Columbia. Syesis 14: 1-20.
Hebda, R.J. and C. Whitlock, 1997. “Environmental history.” In: P.L. Schoonmaker, B. von Hagen, and E.C. Wolf (eds.). The Rain Forests of Home: Profile of a North American
Bioregion, Island Press, Covelo, CA. pp. 227-254.
Heikurainen, L., 1963. On using ground water table fluctuations for measuring evapotranspiration. Acta Forestalia Fennica 75: 1-15.
Heikurainen, L. and J. Päivänen, 1970. The effect of thinning, clear cutting and fertilization on the hydrology of peatland drained for forestry. Acta Forestalia Fennica 104:1.
Helbert, S. and J. Balfour, 2000. Burns Bog Ecosystem Review. Hydrology. Report prepared for Delta Fraser Properties Partnership and the Environmental Assessment Office in support of the Burns Bog Ecosystem Review, with additional data collected on publicly owned lands conducted for the Environmental Assessment Office in association with the Corporation of Delta. EBA Engineering Consultants Ltd., Vancouver, BC.
Hemond, H.F., 1980. Biogeochemistry of Thoreau’s Bog, Concord, Massachusetts. Ecological
Monographs 50: 507-526.
Hobbs, N.B., 1986. Mire morphology and the properties and behaviour of some British and foreign peats. Quarterly Journal of Engineering Geology 19: 7-80.
Hodge, T., and R. Prescott-Allen, 1997. Report on British Columbia’s Progress Toward
Sustainability. BC Ministry of Environment, Lands and Parks, Victoria: BC.
Holland, S. S., 1976. Landforms and British Columbia: A Physiographic Outline, 2nd
Edition. Bulletin 48, British Columbia Department of Mines and Petroleum Resources, Victoria, British Columbia.
Holling, C.S., 1973. Resilience and stability of ecological systems. Annual Review of Ecology
and Systematics 4: 1-23.
Holling, C.S., 1992. Cross-scale morphology: geometry and dynamics of ecosystems. Ecological
Monographs 62: 447-502.
Holling, C.S., D.W. Schindler, B.W. Walker, and J. Roughgarden, 1995. Biodiversity in the functioning of ecosystems: an ecological synthesis. In: C. Perrings, K.G. Maler, C. Folke, C.S. Holling, and B.O. Jansson (eds.), Biodiversity Loss: Economic and Ecological
Issues. Cambridge, UK, Cambridge University Press. pp. 44-83.
256
Hoos, L.M. and G.A. Packman, 1974. The Fraser River Estuary Status of Environmental
Knowledge to 1974. Canada Department of the Environment Regional Board Pacific Region. Special Estuary Series No. 1: Vancouver 516 p.
Humphries, R.G. and T.R. Oke, 1999. Burns Bog Ecosystem Review. Regional Atmospheric
Processes. Report prepared for Delta Fraser Properties Partnership and the Environmental Assessment Office in support of the Burns Bog Ecosystem Review. Levelton Engineering Ltd., Richmond, BC.
Ingram, H.A.P. 1992. Introduction to the ecohydrology of mires in the context of cultural perturbation. In: O.M. Bragg, P.D. Hulme, H.A.P. Ingram and R.A. Robertson (eds.). Peatland Ecosystems and Man: an Impact Assessment. Department of Biological Sciences, University of Dundee, UK.
Ingram, H.A.P., 1978. Soil layers in mires: Function and terminology. Journal of Soil Science 29: 224-227.
Ingram, H.A.P., 1982. Size and shape in raised mire ecosystems: a geophysical model. Nature 297: 300-303.
Ingram, H.A.P., 1983. Hydrology. In: A.J.P. Gore (ed.), Ecosystems of the World 4A: Mires:
Swamp, Bog, Fen and Moor, Elsevier, Amsterdam, pp. 67-158.
Ingram, H.A.P., 1992. Introduction to the ecohydrology of mires in the context of cultural perturbation. In: O.M. Bragg, P.D. Hulme, H.A.P. Ingram and R.A. Robertson (eds.). Peatland Ecosystems and Man: an Impact Assessment. Department of Biological Sciences, University of Dundee, UK.
Ivanov, K.E., 1981. Water Movement in Mirelands. Academic Press, London.
Ives, A.R., 1995. Measuring resilience in stochastic systems. Ecological Monographs 65: 217-233.
Jansson, A., 1972. Systematic notes and new synonymy in the genus Cenocorixa (Hemiptera: Corixidae). Canadian Entomologist 104: 449-459.
Johnson, L.C. and A.W.H. Damman, 1993. Decay and its regulation in Sphagnum peatlands. Advances in Bryology 5: 249-296.
Jury, C.N., 1981. The Health Status and Waterfowl Populations in a Designated Agricultural
Area of the Fraser Delta 1980. Report prepared for the BC Ministry of Environment, BC Ministry of Agriculture and Food, and Canadian Wildlife Service.
Karr, J.R. and D.R. Dudley, 1981. Ecological perspective on water quality goals. Environmental
Management 5: 55-68.
Karr, J.R., 1993. Defining and assessing ecological integrity: beyond water quality. Environmental Toxicology and Chemistry 12: 1521-1531.

257
Kartesz, J.T., 1998. A Synonymized Checklist of the Vascular Flora of the United States, Puerto Rico, and the Virgin Islands. Full Text Index - July,1998. Internet programming by Hugh Wilson and Erich Schneider. Internet: http://www.csdl.tamu.edu/FLORA/b98/check98.htm.
Kay, J., H. Regier, M. Boyle, and G. Francis, 1999. An ecosystem approach for sustainability: addressing the challenge of complexity. Futures 31: 721-742.
Kay, J.J. and E. Schneider, 1994. Embracing complexity: the challenge of the ecosystem approach. Alternatives 20: 32-39.
Keisecker, J. M. and A. R. Blaustein, 1998. Effects of introduced bullfrogs and smallmouth bass on microhabitat use, growth, and survival of native Red-legged Frogs (Rana aurora). Conservation Biology 12: 776-787.
Kenner, R.D. and K. Needham, 1999. Burns Bog Ecosystem Review. Invertebrate Component
Final Report. Report prepared for Delta Fraser Properties Partnership and the Environmental Assessment Office in support of the Burns Bog Ecosystem Review, with additional work on publicly owned lands conducted for the Environmental Assessment Office in association with the Corporation of Delta. Spencer Entomological Museum, University of British Columbia, Vancouver, BC.
Keystone Wildlife Research, 1999. Wildlife capability/suitability ratings for the Weldwood Gerimi/Nyland Study Area. Consultants Report 98 p.
Kistritz, R., G. Porter, and K. Summers, 1992. Environmental Overview of the North Delta Area. Report prepared for Planning Department, Corporation of Delta 138p.
Kistritz, R.U., G.L. Porter, G. Radcliffe, and P.R.B. Ward, 1992. An Ecological Study of Surrey
Bend. Report prepared for the Fraser River Estuary Management Program and the District of Surrey.
Knopp, D.H. and L.K. Larkin, 1999. Burns Bog and Adjacent Areas. Amphibian and Reptile
Study. Report prepared for Delta Fraser Properties Partnership and the Environmental Assessment Office in support of the Burns Bog Ecosystem Review. BC’s Wild Heritage Consultants, Sardis, BC.
Knopp, D.H., 1996. Fraser Valley Amphibian Survey. Report prepared for the BC Ministry of Environment, Lands and Parks, Victoria, BC.
Komulainen, V., H. Nykänen, P.J. Martikainen, and Jukka Laine, 1998. Short-term effects of restoration on vegetation change and emissions from peatlands drained for forestry in southern Finland. Canadian Journal of Forest Research 28: 402-411.
Lamers, L.P.M., C. Faroush, J.M. van Gronendael, and J.G.M.Roelofs, 1999. Calcareous ground water raises bogs; the concept of ombrotrophy revisited. Journal of Ecology 87: 639-648.
Lande, R., 1988. Genetics and demography in biological conservation.

258
Lawler, S., D. Dritz, T. Strange, M. Holyoak, 1998. Effects of introduced Mosquitofish and bullfrogs on the threatened california Red-legged Frog. Conservation Biology 13: 631-622.
Lawton, J.H., and V.K. Brown, 1993. Functional redundancy. In: E.D. Schulze and H.A. Mooney (eds.), Biodiversity and Ecosystem Function. Berlin, Springer-Verlag. pp. 255-270.
Levelton, B.H. & Associates, 1991. Global Warming: and Inventory and Analyses of Control
Measures for Methane for British Columbia. Prepared for the BC Ministry of Environment, Air Policy Section, Air Management Branch, September 1991.
Lomer, F., 1995. Introduced Bog Plants Around Vancouver, British Columbia. Botanical
Electronic News No. 104.
Ludwig, D., B. Walker, and C.S. Holling, 1997. Sustainability, stability, and resilience. Conservation Ecology 1, Article 7. http://www.consecol.org/vol1/iss1/art7.
Luttmerding, H.A., 1980. Soils of the Langley-Vancouver Map Area. Volume 1: Soil Mosaics and Legend, Lower Fraser Valley (Scale 1:25,000). RAB Bulletin 18. Report No. 15, British Columbia Soil Survey. BC Ministry of Environment, Assessment and Planning Division, Kelowna, BC.
Lynch-Stewart, P., I. Kessel-Taylor, and C. Rubec, 1999. Wetlands and Government: Policy and
Legislation for Wetland Conservation in Canada. Sustaining Wetlands Issues Paper No. 1999-1. North American Wetlands Conservation Council (Canada).
Lynch-Stewart, P., P. Neice, C. Rubec, and I. Kessel-Taylor, 1996. The Federal Policy on
Wetland Conservation: Implementation Guide for Federal Land Managers. Habitat Conservation Division, Canadian Wildlife Service, Ottawa.
M.A. Whelen and Associates Ltd., 1999. Burns Bog Baseline Fisheries Overview, September
1999. Report prepared for Delta Fraser Properties Partnership and the Environmental Assessment Office in support of the Burns Bog Ecosystem Review. M.A. Whelen and Associates Ltd., Langley, BC.
MacAlister, C., 1997. Hydrological Monitoring of Burns Bog, British Columbia. Student report (University of Newcastle), U.K. 25p.
MacAlister, C., 2000. BBHydroHebda6_2.xls. Unpublished notes submitted to the Environmental Assessment Office, Victoria, BC.
MacArthur, R.H. and E.O. Wilson, 1967. The Theory of Island Biogeography. Princeton University Press, Princeton, NJ.
Madrone Consultants Ltd., 1999. Burns Bog Ecosystem Review. Plants and Plant Communities. Report prepared for Delta Fraser Properties Partnership and the Environmental Assessment Office in support of the Burns Bog Ecosystem Review, with additional work

259
on publicly owned lands conducted for the Environmental Assessment Office in association with the Corporation of Delta. Madrone Consultants Ltd., Duncan, BC.
Madrone Consultants Ltd., 2000. Burns Bog Ecosystem Review. Past and Current Ecosystem
Dynamics. Report prepared for Delta Fraser Properties Partnership and the Environmental Assessment Office in support of the Burns Bog Ecosystem Review, with additional work on publicly owned lands conducted for the Environmental Assessment Office in association with the Corporation of Delta. Madrone Consultants Ltd., Duncan, BC.
Malmer, N., B.M. Svensson, and B. Wallen, 1994. Interactions between Sphagnum mosses and Field layer vascular plants in the development of peat-forming systems. Folia
Geobotanica Phytotaxonomica Praha 29: 483-496.
Malmer, N., D.G. Horton, and D.H. Vitt, 1992. Element concentrations in mosses and surface waters of Western Canadian mines relative to precipitation chemistry and hydrology. Ecography 15:144-128.
Maltby, E. and P. Immirzi, 1993. Carbon dynamics in peatlands and other wetland soils, regional and global perspectives. Chemosphere 27: 999-1023.
Malterer, T., K. Johnson and J. Stewart (eds.), 1998. Peatland Restoration and Reclamation:
Techniques and Regulatory Considerations. Proceedings of the International Peat Symposium, 14-18 July, 1998, Duluth, Minnesota.
Malterer, T.J. and K.W. Johnson, 1998. Perspectives on peatland restoration and reclamation in the United States. In: T. Malterer, K. Johnson and J. Stewart (eds.). Peatland Restoration
and Reclamation: Techniques and Regulatory Considerations. Proceedings of the International Peat Symposium, 14-18 July, 1998, Duluth, Minnesota. pp. 9-12.
Mapping and Charting Establishment, 1970. New Westminster, British Columbia. Map 92G/2e Edition 3 1:25,000. Department of National Defence, Ottawa.
Martell, A.M., 1981. Food habitats of Southern Red-backed Voles (Clethriomomys gapperi) in Northern Ontario. Canadian Field Naturalist 95: 325-328.
Martell, A.M., 1983. Changes in small mammal communities after logging in north-central Ontario. Canadian Journal of Zoology 61: 970-980.
Martin, A.P., 1999. Effects of Wildfire on Avian and Plant Communities of a Raised Peat Bog. B.Sc. thesis (Conservation Biology). University of British Columbia, Vancouver, BC.
Martinez, N.D., 1996. Defining and measuring functional aspects of biodiversity. In: K.J. Gaston (ed.), Biodiversity: A Biology of Numbers and Difference. Oxford, UK, Blackwell Science. pp. 114-148.
Mathews, W.H. (compiler), 1986. Physiography of the Canadian Cordillera; Geological Survey of Canada. Map 1701 A. Scale 1:5,000,000, Ottawa.

260
Mathews, W.H., J.G. Fyles, and H.W. Nasmith, 1970. Postglacial crustal movements in southwestern British Columbia and adjacent Washington State. Canadian Journal of
Earth Sciences 7: 690-702.
McElhanney, 1999. Digital colour aerial photograph and digital elevation model for Burns Bog and surrounding area. Prepared for Delta Fraser Properties Partnership in support of the Burns Bog Ecosystem Review. McElhanney Consulting Services Ltd., Vancouver, BC.
McIntosh, K.A. and I. Robertson, 1999. Burns Bog Ecosystem Review. Status of Black Bears. Report prepared for Delta Fraser Properties Partnership and the Environmental Assessment Office in support of the Burns Bog Ecosystem Review. Robertson Environmental Services Ltd., Langley, BC.
Meffe, G.K., C.R. Carroll and contributors, 1997. Principles of Conservation Biology. Sinauer Associates Inc. Sunderland, Mass.
Meidinger, D. and J. Pojar, 1991. Ecosystems of British Columbia. BC Ministry of Forests: British Columbia, Research Branch, Victoria 330 p.
Meidinger, Del; Lee, Tina; Douglas, George W.; Britton, Greg; MacKenzie, Will; Qian, Hong; 1998. British Columbia plant species codes and selected attributes. Database SppMaster.mdb. Research Branch.
Mills, L.S., M.E. Soule, and D.F. Doak, 1993. The keystone – species concept in ecology and conservation. Bioscience 43: 219-224.
Mitsch, W.J. and J.G. Gosselink, 1993. Wetlands. 2nd Edition. Van Nostrand Reinhold, New York.
Monahan, P.A., 1999. The Application of Core Penetration Test Data to Facies Analysis of the
Fraser River Delta, British Columbia. Ph.D. Thesis. School of Earth and Ocean Sciences, University of Victoria. 392p.
Monahan, P.A., J.L. Luternauer, and J.V. Barrie, 1993. A delta plain sheet sand in the Fraser River Delta, British Columbia, Canada. Quaternary International 20: 27-38.
Money, R.P., 1995. Re-establishment of a Sphagnum-dominated flora on cut-over lowland raised bogs. In: B.D. Wheeler, S.C. Shaw, W.J. Fojt, and R.A. Robertson (eds.). Restoration of
Temperate Wetlands. John Wiley & Sons Ltd., Chichester. pp. 405-422
Moore, P.D, 1997. Bog standards in Minnesota. Nature 386: 655-657.
Moore, P.D. and D.J. Bellamy, 1974. Peatlands. Springer-Verlag, New York. 214p.
Mustonen, S. and P. Suena, 1971. Metsaojituksen vaikutukesesta suon hydrologiaan (Influence
of forest draining on the hydrology of peatland). (In Finnish with English summary.) Publication of the Water Research Institute, No. 2, National Board of Waters, Helsinki, Finland. 63 p.

261
Nagorsen, D.W., 1996. Opossums, shrews and moles of British Columbia. Volume 2, The
Mammals of British Columbia. Royal British Columbia Museum Handbook, Victoria, BC.
Nagorsen, D.W., 2000. Southern Red-Backed Vole. Unpublished notes, Royal British Columbia Museum.
Naucke, W., A.L. Heathwaite, R. Egglesmann, and M. Schuch, 1993. Mire chemistry. In: A.L. Heathwaite and Kh. Göttlich (eds.). Mires: Process, Exploitation and Conservation. John Wiley & Sons Ltd., Chichester. pp. 263-310.
Neubert, M.G., and H. Caswell, 1997. Alternatives to resilience for measuring the responses of ecological systems to perturbations. Ecology 78: 653-665.
Niederhof, C.H. and Wilm, H.G., 1943. Effect of cutting mature lodgepole pine stands on rainfall interception. Journal of Forestry 41: 57-61.
North, M.E.A. and J.M. Teversham, 1976. The Pre-white Settlement Vegetation of the Lower
Fraser Valley Flood Plain. Report submitted to the Department of Environment, Pacific Biological Station, Nanaimo, BC.
North, M.E.A. and J.M. Teversham, 1984. The vegetation of the floodplains of the Lower Fraser, Serpentine and Nicomekl Rivers, 1859 to 1890. Syesis 17: 47-66.
Noss, R.F., 1990. Indicators for monitoring biodiversity: a hierarchical approach. Conservation
Biology 4: 355-364.
Nuszdorfer, F. and R. Boettger, 1994. Biogeoclimatic Units of the Vancouver Forest Region, Map Sheet 6 of 6. Revised 1994. BC Ministry of Forests, Research Branch, Victoria, BC.
Oke, T. and J. Hay, 1998. The Climate of Vancouver: 2nd
Edition. BC Geographical Series No. 50. Dept. of Geography, University of British Columbia 84 p.
Osvald, H., 1933. Vegetation of the Pacific Coast bogs of North America. Acta
Phytogeographica Suecica 5: 1-32.
Osvald, H., 1970. Vegetation and Stratigraphy of Peatlands in North America. Royal Society of Sciences of Uppsala, Uppsala, Sweden.
Pakarinen, P. and K. Tolonen, 1977. Nutrient concentrations of Sphagnum mosses in relation to bog water chemistry in northern Finland. Lindbergia 4: 27-33.
Parish, R., Antos, J.A. and R.J. Hebda, 1999. Tree ring patterns in an old-growth subalpine forest in the southern interior, British Columbia. In: R. Wimmer and R. Vetter (ed.). New
Challenges in Tree Ring Analysis. CAB International, Wallingford, UK. (in press).
Parminter, J., 1998. “Natural disturbance ecology.” In: J. Voller, and S. Harrison (ed.). Conservation Biology Principles for Forested Landscapes. Vancouver, BC, University of British Columbia Press. pp. 3-41.
262
Paulik. W., 1999. Submission to Burns Bog Ecosystem Review. Partial chart of British Columbia and Burns Bog area dated 1898. On file at the Environmental Assessment Office, Victoria, BC.
Pearson, A.F., 1985. Ecology of Camosun Bog and Recommendations for Restoration. Technical Paper #3, U.B.C. Technical Committee on the Endowment Lands. Prepared for Parks Department, Greater Vancouver Regional District, Burnaby, BC.
Pearson, D.L., 1994. Selecting indicator taxa for the quantitative assessment of biodiversity. Philosophical Transactions of the Royal Society of London B 345: 75-79.
Penman, H.L., 1948. Natural evaporation from open water, bare soil and grass. Procedings of the
Royal Society, London, A193: 120-145.
Penman, H.L., 1963. Vegetation and Hydrology. Commonwealth Agricultural Bureau, Farnham Royal, 124 pp.
Perdichuk, P.W., 1999. A Wildlife Survey of Burns Bog. Report prepared for the Burns Bog Conservation Society, Delta, BC.
Pfadenhauer, J. and F. Klötzli, 1996. Restoration experiments in middle European wet terrestrial ecosystems: an overview. Vegetatio 126: 101-115.
Pickett, S.T.A. and P.S. White, 1985. The Ecology of Natural Patch Dynamics. Academic Press San Diego. 472p.
Pimm, S.L. and M.E. Gilpin, 1989. Theoretical issues in conservation biology. In: J. Roughgarden, R.M. May, and S.A. Levin (eds.), Perspectives in Ecological Theory. Princeton University Press, Princeton. pp. 287-305.
Piteau Associates, 1983. Hydrogeological Assessments for Proposed Burns Bog Regional
Landfill. Delta, BC Report to Greater Vancouver Sewerage and Drainage District, Burnaby, BC 184p.
Piteau Associates, 1994. Hydrological Assessment of Burns Bog, Delta, British Columbia. Report prepared for the BC Ministry of Environment, Lands and Parks, North Vancouver, BC. October 1994. 54p.
Pogson, W.F. and S.M. Lindstedt, 1991. Distribution and abundance of large Sandhill Cranes, Grus canadensis, wintering in California’s Central Valley. Condor 93: 266-278.
Pojar, J., J.B. Foster, A. Burbidge, L.K. Wade, and K.I. Beamish, 1976. International Biological
Program Application for Ecological Reserve, No. 269, Pitt Polder Bog. BC Ministry of Environment, Lands and Parks, Victoria, BC.
Pojar, J. and A. MacKinnon., 1994. Plants of Coastal British Columbia. BC Ministry of Forests and Lone Pine Publishing, Canada.
263
Poschlod, P., 1995. Diaspore rain and diaspore bank in raised bogs and implications for the restoration of peat-mined sites. In: B.D. Wheeler, S.C. Shaw, W.J. Fojt, and R.A. Robertson (eds.). Restoration of Temperate Wetlands. John Wiley & Sons Ltd., Chichester. pp. 471-494.
Prévost, M., P. Belleau, and A.P. Plamondon, 1997. Substrate conditions in a treed peatland: responses to drainage. Ecoscience 4: 543-554.
Price, J.S., 1998. Methods for restoration of a cutover peatland, Quebec, Canada. In: T. Malterer, K. Johnson, and J. Stewart (eds.). Peatland Restoration and Reclamation: Techniques
and Regulatory Considerations. Proceedings of the International Peat Symposium, 14-18 July, 1998, Duluth. pp. 149-154.
Primack, R.B., 1998. Essentials of Conservation Biology 2nd
Edition. Sinauer Associates Sunderland, Mass. 659p.
Proctor, M.C, 1995. The ombrogenous bog environment. In: B.D. Wheeler, S.C. Shaw, W.J. Fojt, and R.A. Robertson (eds.). Restoration of Temperate Wetlands, John Wiley & Sons Ltd., Chichester. pp. 287-304.
Province of British Columbia, 1993. Boundary Bay Area Studies: Wildlife Management Area
Plan. Quadra Planning Consultants Ltd. Submitted to BC Ministry of Environment, Lands and Parks, Lower Mainland Regional Office, Surrey, BC.
Quinty, F. and L. Rochefort, 1997. Peatland Restoration Guide. Université Laval, Montreal.
R&D Biomass Group Ltd., 2000. Methane Emissions at Burns Bog, 8 Tonnes versus 2701 Tonnes. Submission to the Burns Bog Ecosystem Review, Environmental Assessment Office, Province of British Columbia, Victoria, BC.
Rapport, D.J., W.G. Whitford, K. Korporal, 1996. Evaluation Ecosystem Health: opportunities for GIS. Pp. 408-41413 In: M. Heit, H.D. Parker, and A. Shortreid (eds.), GIS
Applications in Natural Resources 2. GIS World, Inc., USA. 540 p.
Ratcliffe, D. (ed.), A Nature Conservation Review. Volume 1. Cambridge University Press, Cambridge, UK.
Regier, H.A., 1993. The notion of natural and cultural integrity. In: S. Woodley, J. Kay, and G. Francis (eds.), Ecological Integrity and the Management of Ecosystems. New York, St. Lucie Press. pp. 3-18.
Reimchen, T., 1992. Naikoon Provincial Park. Queen Charlotte Islands. Natural history and biophysical data for freshwater habitat. Prepared for the BC Ministry of Environment, Lands and Parks.
Resources Inventory Committee, 1998a. Standard for Terrestrial Ecosystem Mapping in British
Columbia. Ecosystems Working Group, Terrestrial Ecosystems Task Force, Resources Inventory Committee, Victoria, BC.
264
Resources Inventory Committee. 1998b. Field Manual for Describing Terrestrial Ecosystems:
Land Management Handbook Number 25. BC Ministry of Environment, Lands and Parks and BC Ministry of Forests, Victoria, BC.
Resources Inventory Committee, 1999. Provincial Site Series Mapping Codes and Typical
Environmental Conditions. Ecosystems Working Group, Terrestrial Ecosystems Task Force, Resources Inventory Committee, Victoria, BC.
Rigg, G.B. and C.T. Richardson, 1938. Profiles of some Sphagnum bogs on the Pacific coast of North America. Ecology 19: 408-434.
Rigg, G.B., 1925. Some Sphagnum bogs of the north Pacific coast of North America. Ecology 6: 260-279.
Rithaler, R., 2000. Amphibians in Delta. Unpublished notes. On file at the Environmental Assessment Office, Victoria, BC.
Rochefort, L., and S. Campeau, 1997. Rehabilitation work on post-harvested bogs in south eastern Canada. In: L. Parkyn, R.E. Stoneman, and H.A.P. Ingram (eds.). Conserving
Peatlands. CAB International, New York.
Romanov, V.V., 1968. Evaporation from Bogs in the European Territory of the USSR. Israel Program for Scientific Translations. Jerusalem 183 pp.
Rosenzweig, M.L., 1995. Species Diversity in Space and Time. Science 241: 1455-1460.
Roy, V., J.K. Jeglum, and A.P. Plamondon, 1997. Water table fluctuations following clearcutting and thinning on Wally Creek watersheds. In: C.C. Trettin, M.F. Jurgensen, D.F. Grigal, M.R. Gale, and J. Jeglum (eds.). Northern Forested Wetlands: Ecology and Management. CRC Press, Boca Raton, Florida, pp. 239-251.
Rubec, C.D.A., 1994. Canada’s federal policy on wetland conservation: global model. In: W.J. Mitsch (eds.). Global Wetlands: Old World and New. Elsevier Science B.V., Amsterdam, pp. 909-917.
Ryan, M.W., 1996. Bryophytes of British Columbia: Rare Species and Priorities for Inventory. Working Paper 12, BC Ministry of Forests and BC Ministry of Environment, Lands and Parks, Wildlife Branch, Victoria, BC.
Schofield, W.B., 1997. Bryophytes Unintentionally Introduced to British Columbia. Botanical
Electronic News No. 162.
Schonewald-Cox, C., S.M. Chambers, B. MacBryde, and L. Thomas, 1983. Genetics and
Conservation : A Reference for Managing Wild Animal and Plant Populations. Benjamin Cummings, Menlo Park, CA.

265
Schouten, M.G.C., J.G. Streefkerk, and P.C. van der Molen, 1992. Impact of climate change on bog ecosystems, with special reference to sub-oceanic raised bogs. Wetlands Ecology and
Management 2: 55-61.
Schouwenaars, J.M., 1990. A study of the evapotranspiration of Molinia caerulea and Sphagnum
papillosum using small weighable lysimeters. In: Problem-oriented Studies on Plant-
water Relations. Ph.D. Thesis, Agricultural University, Wageningen.
Schouwenaars, J.M., 1995. The selection of internal and external water management options for bog restoration. In: B.D. Wheeler, S.C. Shaw, W.J. Fojt, and R.A. Robertson (eds.). Restoration of Temperate Wetlands, John Wiley & Sons Ltd., Chichester. pp. 331-346.
Schouwenaars, J.M. and J.P.M. Vink, 1992. Hydrophysical properties of peat relicts in a former bog and perspectives for Sphagnum regrowth. International Peat Journal 4: 15-28.
Schulthess, J. 1990. Der Einfluss von Entwässerung auf die Bewaldung eines Hochmoors. Diplomarbeit, Geographisches Institut Universität Zürich. 190 pp.
Schweingruber, F.H., 1996. Tree Rings and Environment: Dendroecology. Swiss Federal Institute for Forest, Snow and Landscape Research. Brimensdorf. Paul Haupt Verlag, Berne. 609p.
Scientific Panel for Sustainable Forest Practices in Clayoquot Sound, 1995. A Vision and Its
Context: Global Context for Forest Practices in Clayoquot Sound. Report 4. Scientific Panel for Sustainable Forest Practices in Clayoquot Sound, Victoria, BC.
Scudder, G.G.E., 1994. An Annotated Systematic List of the Potentially Rare and Endangered
Freshwater and Terrestrial Invertebrates in British Columbia. Entomological Society of British Columbia, Occasional Paper 2.
Shafer, C.L., 1990. Nature Reserves Island Theory and Conservation Practice. Smithsonian Institution Press, Washington. 189 p.
Sigma Environmental Consultants Ltd., 1983. Summary of Water Quality Criteria for Salmonid
Hatcheries. Report prepared for Fisheries and Oceans Canada 161 p.
Sims, R., J. Matheson, and S. Yazvenko, 1999. Consideration of “Global and Regional
Significance in Terms of Obligations” to Assist the Burns Bog Ecosystem Review. Report prepared for the Environmental Assessment Office. EBA Engineering Consultants Ltd., Vancouver, BC, and LGL Ltd., Sidney, BC.
Sims, R., J. Matheson, and S. Yazvenko, 2000a. Summary Report: Technical Review Meetings in
Support of the Burns Bog Ecosystem Review. Report prepared for the Environmental Assessment Office. EBA Engineering Consultants Ltd., Vancouver, BC, and LGL Ltd., Sidney, BC.

266
Sims, R., J. Matheson, and S. Yazvenko, 2000b. Ecosystem Integrity in Relation to the Burns
Bog Ecosystem Review. Report prepared for the Environmental Assessment Office. EBA Engineering Consultants Ltd., Vancouver, BC, and LGL Ltd., Sidney, BC.
Sjörs, H., 1983. Mires of Sweden. In: A.J.P. Gore (ed.), Ecosystems of the World 4A: Mires:
Swamp, Bog, Fen and Moor, Elsevier Publishing Company, New York. pp. 69-64.
Sliva, J., D. Maas, and J. Pfadenhauer, 1997. Rehabilitation of Milled Fields. In: L. Parkin, R.E. Stoneman, and H.A.P. Ingram (eds.) Conserving Peatlands. CAB International, New York.
Sliva, J. and J. Pfadenhauer, 1999. Restoration of cut-over raised bogs in southern Germany - a comparison of methods. Applied Vegetation Science 2: 137-148.
Smart, P.J., B.D., Wheeler and A.J. Willis. 1989. Revegetation of peat excavations in a derelict raised bog. New Phytologist 111: 733-748.

267
Summers, K.R. and M.B. Gebauer, 1999a. Burns Bog Waterbird Study. Late Summer/Early Fall
1999 Survey Results and Review of Existing Information. Report prepared for Delta Fraser Properties Partnership and the Environmental Assessment Office in support of the Burns Bog Ecosystem Review, with additional work on publicly owned lands conducted for the Environmental Assessment Office in association with the Corporation of Delta. Enviro-Pacific Consulting, Surrey, BC.
Summers, K.R. and M.B. Gebauer, 1999b. Burns Bog Raptor Study. Late Summer/Early Fall
1999 Survey Results and Review of Existing Information. Report prepared for Delta Fraser Properties Partnership and the Environmental Assessment Office in support of the Burns Bog Ecosystem Review, with additional work on publicly owned lands conducted for the Environmental Assessment Office in association with the Corporation of Delta. Enviro-Pacific Consulting, Surrey, BC.
Surveys and Mapping Branch, 1970. Crescent Beach: British Columbia – Washington. Map 92G/2d Edition 3, 1:25,000. Department of Energy, Mines and Resources. Ottawa.
Swetnam, T.W., M.A. Thompson, and E.K. Sutherland, 1985. Using Dendrochronology to
Measure Radial Growth of Defoliated Trees. Agricultural Handbook No. 639, US Department of Agriculture, Washington, DC. 39p.
Takagi, K., T. Tsuboya, H. Takahashi, and T. Inoue, 1999. Effect of the Invasion of Vascular Plants on Heat and Water Balance in the Sarobetsu Mire, Northern Japan. Wetlands 19: 246-254.
Talisman Land Resource Consultants, 1991. Methane Inventory for Landforms in British Columbia. Prepared for B.H. Levelton & Associates Ltd., June 1991.
Tallis, J.H., 1983. Changes in Wetland Communities. In: A.J.P. Gore (ed.), Ecosystems of the
World 4A: Mires: Swamp, Bog, Fen and Moor, Elsevier, Amsterdam, pp. 311-347.
Tarnocai, C., I.M. Kettles, and B. Lacelle, 1999. Peatlands of Canada. Geological Survey of Canada, Open File 3834.
Taylor, T., 1973. The Flora of the Richmond Nature Park. Report prepared for the Richmond Nature Park Committee, Richmond, BC.
Taylor, T., 1994. Eriophorum virginicum (Cyperaceae) in British Columbia. Botanical
Electronic News No. 82.
Taylor, T., 1997. Campylopus introflexus – moss introduced in British Columbia. Botanical
Electronic News No. 162.
TERA Planning Ltd., 1991. Waterfowl, Shorebirds and Raptors within the Property Owned by
Western Delta Lands Inc., Burns Bog, 1989-1990. Unpublished report prepared for Western Delta Lands Inc., Vancouver, BC.

268
TERA Planning Ltd., 1992. Abundance and Distribution of Waterfowl, Songbirds and Other
Birds in Burns Bog. Unpublished report prepared for Western Delta Lands Inc., Vancouver, BC.
TERA Planning Ltd., 1993. Cougar Creek: A Western Delta Property Corporation
Development. Unpublished report prepared for Western Delta Lands Inc., Vancouver, BC.
Toochin, R., 1998. Seasonal status of the birds of the Vancouver, BC checklist area. October 1998 edition. Vancouver Natural History Society, Vancouver.
Triathlon Mapping Corporation and Selkirk Remote Sensign Ltd., 1995. Vancouver and Fraser Valley Orthophotos on CD-ROM.
Tsawwassen First Nation, 2000. Traditional Use Activities of the Tsawwassen First Nation, in
the Vicinity of Burns Bog – an Overview. Tsawwassen First Nation: Delta, British Columbia.
Turner, N.J., 1975. Food Plants of British Columbia Indians. Part 1 – Coastal Peoples. B.C. Prov. Mus Handbook No. 34. 264 p.
Valgma, U., 1998. Impact of precipitation on the water table of different ombrotrophic raised bog complexes, central Estonia. Suo 49: 13-21.
van Breeman, N., 1995. How Sphagnum bogs down other plants. Trends in Ecology and
Evolution 10: 270-275.
Verry, E.S., 1984. Microtopography and water table fluctuation in a Sphagnum mire. In:
Proceedings: 7th
International Peat Congress. The Irish National Peat Committee, 18-23 June, 1984, Dublin, Ireland.
Verry, E.S., 1997. Hydrological processes of natural, northern forested wetlands. In: C.C. Trettin, M.F. Jurgensen, D.F. Grigal, M.R. Gale, and J. Jeglum (eds.). Northern Forested
Wetlands: Ecology and Management. CRC Press, Boca Raton, Florida. p. 163-188.
Verry, E.S. and D.H. Boelter, 1978. Peatland hydrology. In: P.E. Greeson, J.R. Clark, and J.E. Clark (eds.). Wetlands Functions and Values: the State of Our Understanding. Proceedings of the National Symposium on Wetlands, November 7-20, 1978, Disneyworld Village, Lake Buena Vista, Florida. American Water Resources, Minneapolis, Minnesota.
Verry, E.S. and Timmons, D.R., 1982. Waterborne nutrient flow through an upland-peatland watershed in Minnesota. Ecology 63: 1456.
Virta, J., 1966. Measurement of evapotranspiration and computation of water budget in treeless peatlands in the natural state. Comment. Phys.-Math. Soc. Sci. Fenn., 32: 1-70.
269
Vitt, D.H., 1994. An overview of factors that influence the development of Canadian peatlands. Memoirs of the Entomological Society of Canada 169: 7-20.
Vitt, D.H., L.A. Halsey, and J. Doubt, 1999. Global and Regional Distinctness of Burns Bog. Report prepared for Delta Fraser Properties Partnership and the Environmental Assessment Office in support of the Burns Bog Ecosystem Review. Department of Biological Sciences, University of Alberta, Edmonton, AB.
Vitt, D.H., L.A. Halsey, M.N. Thormann, T. Martin, 1996. Peatland inventory of Alberta Phase 1: Overview of peatland resources in the natural regions and subregions of the province. Peatland Resource Centre, Devonian Botanic Garden, University of Alberta, Edmonton, 117 p.
Vitt, D.H., S.E. Bayley, and T. Jin, 1995. Seasonal variation in water chemistry over a bog-rich fen gradient in continental western Canada. Canadian Journal of Fisheries and Aquatic
Science 52: 587-606.
Vompersky, S.E., A.A. Sirin, and A.I. Glukhov, 1988. Runoff Formation and Regime in a
Process of Forest Drainage (In Russian). Nauka Publishers, Moscow. 168 p.
Walker, E.M., 1958. The Odonata of Canada and Alaska. Volume 2. University of Toronto Press, Toronto,.
Walkinshaw, L.H., 1949. The Sandhill Cranes. Cranbrook Institute Science Bulletin 29. Cranbrook Institute, Bloomfield Hills, Michigan.
Ward, P., K. Moore, and R.U. Kistritz, 1992. Wetlands of the Fraser Lowland, 1989: an
Inventory. Technical Report Series No. 154. Canadian Wildlife Service, Pacific and Yukon Region, Delta, BC.
Warner, B.G., 1996. Vertical gradients in peatlands. In: G. Mulamoottil, B.G. Warner, and E.A. McBean (eds.) “Wetlands: Environmental Gradients, Boundaries, and Buffers”, Lewis Publ., Boca Raton. pp. 45-65.
Weber, M.G. and B.J. Stocks. 1998. Forest fires and sustainability in the Boreal Forests of Canada. Ambio 27: 545-550.
Whalen, S.C. and W.S. Reeburgh, 1992. Interannual variations in tundra methane emissions: a 4-year series at fixed sites. Global Biogeochemical Cycles 6: 139-159.
Wheeler, B.D. and S. C. Shaw, 1995. Restoration of Damaged Peatlands (with Particular
Reference to Lowland Raised Bogs Affected by Peat Exraction). Department of Environment. HMSO (Her Majesty’s Stationary Office), London.

270
Wheeler, B.D., S.C. Shaw, R.P. Money, and R. Meade, 1998. Assessing priorities and approaches to the restoration of damaged lowland bogs in northwest Europe. In: T. Malterer, K. Johnson, and J. Stewart (eds.). Peatland Restoration and Reclamation:
Techniques and Regulatory Considerations. Proceedings of the International Peat Symposium, 14-18 July, 1998, Duluth, Minnesota. pp. 23-31.
Whyte, I.W., and M.A. Adams, 1998. A Hydrological and Biological Assessment of two
Wetlands on the North Shore, Port Moody, BC. Unpublished manuscript prepared by ECL Envirowest Consultants Ltd. for the City of Port Moody, Planning and Development Services Department.
Williams, H.R.L. and R.J. Hebda, 1991. Palynology of Holocene top-set, aggradational sediments of the Fraser River Delta, British Columbia. Palaeogeography, Palaeoclimatology and Palaeoecology 86: 287-311.
Yavitt, J.B., 1997. Methane and carbon dioxide dynamics in Typha latifolia (L.) wetlands in central New York State. Journal of the Society of Wetland Scientists 17: 394-406.
Zhang, Q.B., 1996. A 2122 Year Tree-Ring chronology of Douglas-fir and Spring Precipitation
Reconstruction at Heal Lake, Southern Vancouver Island, British Columbia. M.Sc. thesis. School of Earth and Ocean Science, University of Victoria, Victoria 88 p.
Zinke, P.J., 1967. Forest interception studies in the United States. In: W.E. Sopper and H. Hull. International Symp. on Forest Hydrology, Pergamon Press. pp. 137-161.
Zoltai, S.C. and F.C. Pollet, 1983. Wetlands in Canada. In: A.J.P. Gore (ed.), Ecosystems of the
World 4B: Mires: Swamp, Bog, Fen, and Moor, Elsevier Publishing Company, New York. pp. 245-268.
Zoltai, S.C., L.A. Morrissey, G. P. Livingston and W.J. deGroot. 1998. Effect of fires on carbon cycling in North American peatlands. Environmental Reviews 6: 13-24.
Zuleta, G.A. and C. Galindo-Leal., 1994. Distribution and abundance of four species of small
mammals at risk in a fragmented landscape. Wildlife Working Report WR-64, BC Ministry of Environment, Lands and Parks, Victoria 34 p.

271
9.0 Appendices
Appendix A Burns Bog Ecosystem Review Process Appendix B Public Involvement in the Burns Bog Ecosystem Review Appendix C Outline of Technical Review Meetings Appendix D Technical Reports and Working Documents Prepared in Support of the Burns
Bog Ecosystem Review Appendix E Botanical Names and Authorities Appendix F Common and Botanical Plant and Lichen Names Appendix G Ecosystem Classification and Mapping: Explanation of Coding in Table 4.11 Appendix H Peat Harvesting Methods Appendix I Burns Bog Ecosystem Review Spatial Summary Analysis as it Pertains to
Municipally Owned Lands Adjacent to Burns Bog.

Appendix A Burns Bog Ecosystem Review Process

Appendix B Public Involvement in the Burns Bog Ecosystem Review

Appendix C Outline of Technical Review Meetings

Appendix D Technical Reports and Working Documents Prepared in Support of the Burns Bog Ecosystem Review

Appendix E Botanical Names and Authorities

Appendix F Common and Botanical Plant and Lichen Names

Appendix G Ecosystem Classification and Mapping: Explanation of Coding in Table 4.11

Appendix H Peat Harvesting Methods

Appendix I Burns Bog Ecosystem Review Spatial Summary Analysis as it Pertains to Municipally Owned Lands Adjacent
to Burns Bog.