burmese refugees inside the u.s., indiana, and indianapolis presenters: demerry thein, cung mawi,...
TRANSCRIPT

Burmese Refugees inside the U.S., Indiana, and Indianapolis
Presenters: Demerry Thein, Cung Mawi, Priscilla Sui, VanBik Thawng
Moderator:Lian Sang

Refugees Population And Secondary Migration
The background and Purpose:
● Definition of Secondary Migration – “Refugees relocating from their arrival state to another state or country.”
● Our research focuses
1) Reasons why they relocate and the impact they have on the community.
2) The numbers of Burmese secondary migrants moving in Indiana from other states.
Research Questions
Number- What percentage of refugees population in Central Indiana are secondary migrants?
Reasons- Why do Burmese refugees relocate to Central Indiana?
Impact- What impact does secondary migrants have in the community and service providers in Central Indiana?

Methodology ● Participatory Action Research
○ Quantitative & Qualitative● Generated surveys and randomly selected participants and distribution● Interviewed local community and church leaders over our research topic ● Main objectives
a) To find the total population of Refugees inside the U.S & the secondary migrants in Indiana and Indianapolisb) To find out the reason for relocationc) To investigate the impact that they have on the primary refugees and the service providers

Methodology ● Survey (155 in total)
o To investigate the reason for relocation and the impact 121 Primary Migrants 34 Secondary Migrants
● Interviewed 4 people○ To investigate the impact of secondary migration on service providers perspectives
■ (Director of Operations in Exodus)■ (Perry Township Schools Superintendent)■ (Catholic Charities Director )■ (Director International and Cultural Affair for the Mayor's Office)
● Refugee Processing Center (RPC)o To calculate the secondary migrant populationo Primary Arrivals
Based on location, nationality, and ethnicity● Contacted Churches and Community leaders
o To calculate total refugee population in Indianapolis and to calculate secondary Migrant population Made phone calls to 49 churches and other community leaders sent requests on facebook and “indychin” and to other community leaders

Refugees PopulationFrom January 1st, 2002- June 30th, 2015 inside the U.S.
(Primary Arrivals)Total Refugee - 759,637Total Burmese Refugees - 146,037
Total Chin Refugee - 50,173
Total Karen Refugee - 64,551
Total Karenni Refugee - 11,619
All other Burmese ethnic groups - 18,623
From January 1st, 2000- June 30th, 2015 inside the U.S.(Primary Arrivals)
All Burmese Refugee in Indianapolis -10,954Chin -6,130Karen -1,029Karenni -296Kachin -104Arakanese -85Burmese -81Mon -77Shan -23
Chin Refugee Population in Indiana - 6,458 (Primary)
Chin Refugee Population in Indianapolis - 6,130 (Primary)
Chin Refugee Population in Indianapolis -11,761(Total)
Non-Chin Refugee Population in Indianapolis -2135(Total)
All Burmese Refugees population in Indianapolis-13,896 (Total)
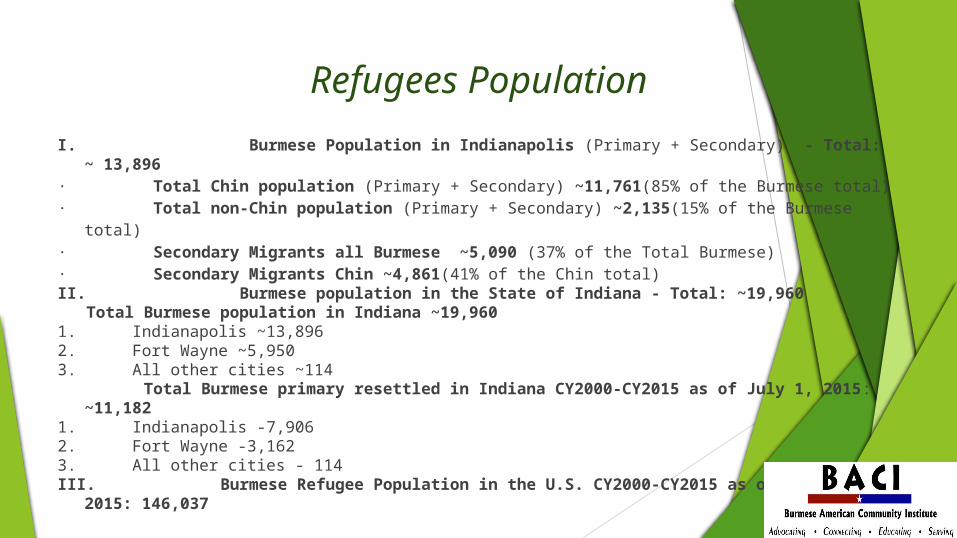
Refugees Population
I. Burmese Population in Indianapolis (Primary + Secondary) - Total: ~ 13,896 · Total Chin population (Primary + Secondary) ~11,761(85% of the Burmese total)· Total non-Chin population (Primary + Secondary) ~2,135(15% of the Burmese total)· Secondary Migrants all Burmese ~5,090 (37% of the Total Burmese)· Secondary Migrants Chin ~4,861(41% of the Chin total)II. Burmese population in the State of Indiana - Total: ~19,960 Total Burmese population in Indiana ~19,9601. Indianapolis ~13,8962. Fort Wayne ~5,9503. All other cities ~114 Total Burmese primary resettled in Indiana CY2000-CY2015 as of July 1, 2015: ~11,1821. Indianapolis -7,9062. Fort Wayne -3,1623. All other cities - 114III. Burmese Refugee Population in the U.S. CY2000-CY2015 as of July 1, 2015: 146,037

Responses from Primary Migrants

Responses from Secondary Migrant
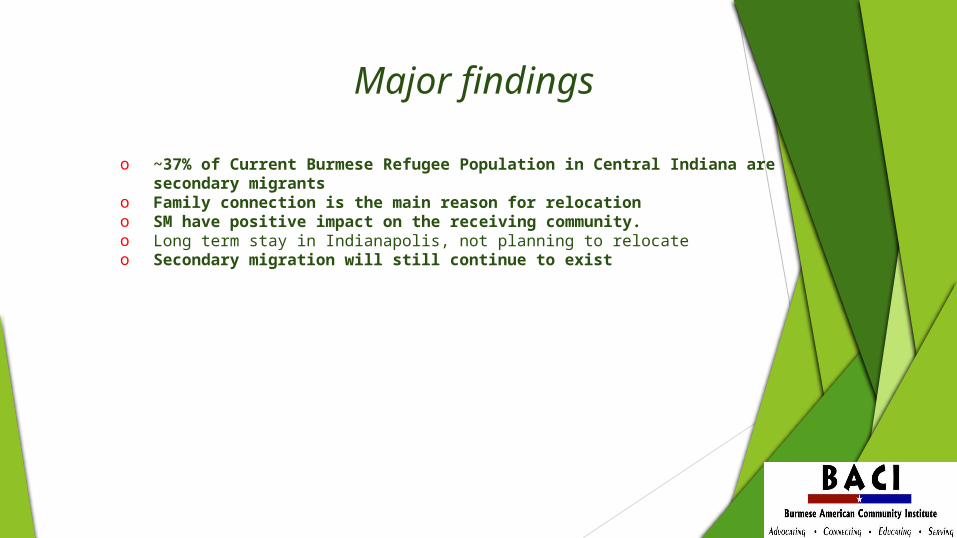
Major findings
o ~37% of Current Burmese Refugee Population in Central Indiana are secondary migrantso Family connection is the main reason for relocation o SM have positive impact on the receiving community.o Long term stay in Indianapolis, not planning to relocateo Secondary migration will still continue to exist

Higher Education among Burmese Community of Indianapolis
★ Purpose of the research★ Research Questions
➢ What percentage of the 2015 Burmese graduates are going to a higher education?
➢ What is their motivation for a higher education?
➢ Who is more motivated to pursue a higher education gender-wise?
➢ What are some of the barriers to higher education?
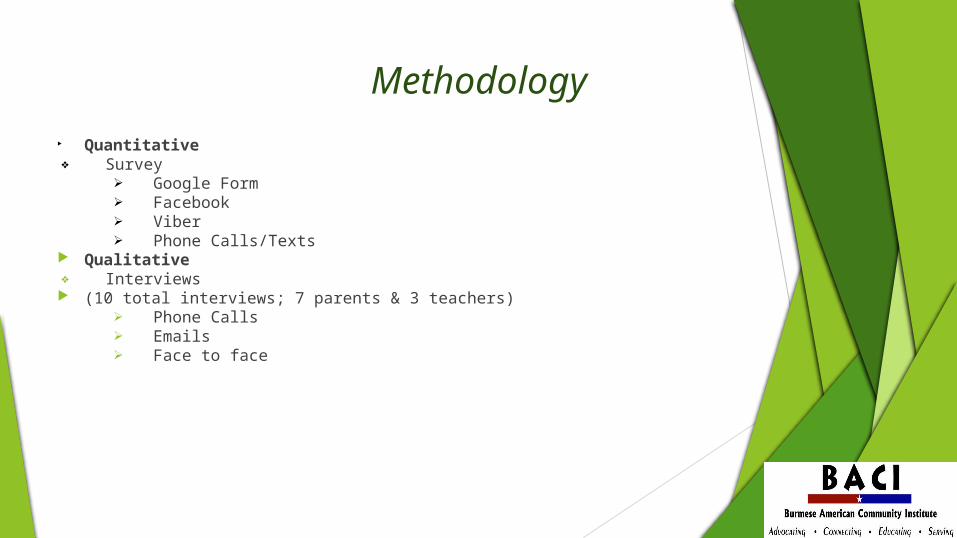
Methodology Quantitative❖ Survey
➢ Google Form➢ Facebook➢ Viber➢ Phone Calls/Texts
Qualitative❖ Interviews (10 total interviews; 7 parents & 3 teachers)
➢ Phone Calls➢ Emails➢ Face to face

Data Results & Findings
❏ Total Burmese high school graduates by year ❏ 2015 158❏ 2014 138❏ 2013 98
❏ Total college attendance rate among Burmese graduates❏ 2015 83% (121 respondant out of 158)❏ 2014 72% (75 respondant out of 138)❏ 2013 57.1% (98 respondant out of 98)

Data Results & Findings 83% will be going to college out of the 2015 Burmese high school graduates

Data Results & Findings Motivation to Attend College

Data Results & Findings Barriers to Pursuing Higher Education

College Persistence among the students from Burmese Community of Indianapolis
This research investigate (Burmese Community)• Rate of College Persistency • Main motivation factors of staying in College• Reasons of college dropping out
Important:• Increasing population/ college going rate• Find out if there are issues or not• Can take necessary steps to resolve/ help policy maker in their decision making
Research Questions: 1. Is parent motivation the main reason most Burmese students are still attending college? 2. Is lack of time management the main reason why Burmese students drop out of college? 3. Is the college persistency rate of the Burmese students staying in central Indiana higher than the general population?

Methodology Participatory Action Research (PAR) Mixed Method: Quantitative and Qualitative
Surveying• Survey Monkey• Facebook• Text message
Interview • Face-to-Face• Phone calls
Persistence Rate: Individual Phone Call Who are the Participants? And How?
Burmese College Students Receive Students’ Name/contact Lists –Data Previous research by UCSP Focus Only on 2012-2014
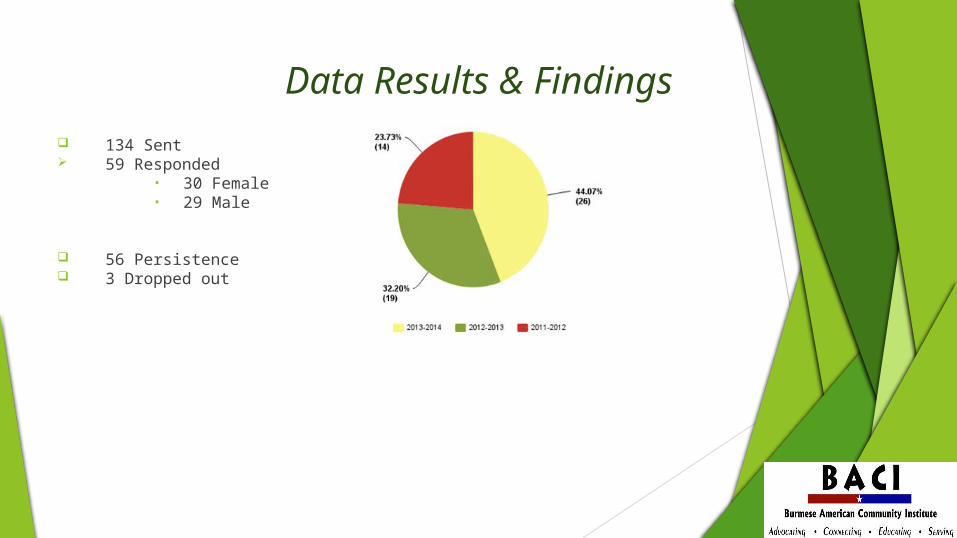
Data Results & Findings 134 Sent 59 Responded
• 30 Female• 29 Male
56 Persistence 3 Dropped out

Data Results & Findings Main reason for motivation to continue education

Data Results & Findings Types of Financial Aid and Scholarship that the students received

Data Results & Findings Family supports

Data Results & Findings Table A: Combined Data from Previous Years research of College Going Rate
Table B: College Persistency Rate (CPR)
Overall CPR= (86%+84%+100%)/3= 90%
Year Students Going to College College Going Rate
Junior(2012) 25/58 43%Sophomore(2013) 56/98 57%Freshman (2014) 54/73 73%
College Persistence
Total survey students
Still in College Unable to contact
86% 21/25 18/21= 86% 484% 44/56 37/44= 84% 12100% 40/54 40/40= 100% 14

Major Findings
• Main reason to stay in college: Personal Commitment to better themselves and career choice
• Main Reason dropping out of College: Lack of Financial Support
• College Persistency Rate among the Burmese Students continue to increase.

References: Secondary Migration 1. Catholic Charities of Louisville. (2012). Secondary Migration. 2. Gehlhausen, Jane. Director International and Cultural Affairs for Mayor Ballard. Mayor Office. 3. Haines,David (1982).Southeast Asian Refugees in the United States: The Interaction of Kinship and Public Policy.
The George Washington University Institute for Ethnographic Research , Vol.55, No.3 (Southeast Asian Refugees in the U.S.A.: Case Studies of Adjustment and Policy Implications) pp. 170-181. (Academic)
4. Julie, DaVanzo (1976). Why Families Move: A Model of the Geographic Mobility of Married Couples. Publications, Rand Corporation, 1700 Main Street, Santa Monica, California 90406: Employment and Training Administration (DOL), Washington, DC.
5. KN,Yadava (1989).Rural-urban migration in India: determinants, patterns and consequence.(Academic)6. Little, Thomas. The Superintendent of Perry Township. Perry Township Schools. 7. Mortland C. and Ledgerwood J. (1987). Secondary Migration among Southeast Asian Refugee in the United States. Urban Anthropology
and Studies of Cultural Systems and World Economic Development. Vol. 16, No. 3/4, FALL-WINTER, 1987. 8. Neal, Gabriella. Program Director of the Refugee. Catholic Charities 9. Rood, Lee (2015, June 10). Part 1 in a five-part series on Burmese refugees' struggles in Iowa. The Des Moines Register. 10. RPC Refugee Processing Center. (2015). Indiana Refugee Cases and Individuals.11. Takenaka, Ayumi. (2007). Secondary Migration: Who Re-Migrates and Why These Migrants -`1 Matter. The online journal of the
Migration Policy Institute.12. Washington, Township. (2013). A Word about Burmese Refugees in Indianapolis13. Weine, S. M., Hoffman, Y. Ware. N., Tugenberg. T. Hakizimana. L., Dahnweigh. G., Currie. M., Wagner. M. (2011). Secondary migration
and relocation among African refugee families in the United States. 50(1):27-46.14. Varga, Cole. Director of Operation in Exodus. Exodus.

References: Higher Education1. Goodman, E. A. (2013). Investing in the Future: Rebuilding Higher Education in Myanmar. Institute of International Education, Retrived from
http://www.iie.org/Research-and-Publications/Publications-and-Reports/IIE-Bookstore/Rebuilding-Higher-Education-in-Myanmar2. Selingo, J. J. (2015,June 16). Higher ed as a commodity? Colleges have only themselves to blame. Washington Post. Retrieved from
http://www.washingtonpost.com/news/grade-point/wp/2015/06/16/higher-ed-as-a-commodity-colleges-have-only-themselves-to-blame/
3. Keen, J. (2011, February 2). Burmese try to adapt to America's bigger 'village'. USA Today. Retrieved from http://usatoday30.usatoday.com/news/nation/2011-02-21-burmese21_ST_N.htm
4. Hakuta, K., Butler, Y.G., & Witt, D. (2000). How long does it take English learners to attain proficiency? University of California Linguistic Minority Research Institute Policy Report 2000-1. Santa Barbara, CA: University of California-Santa Barbara. www.lmri.ucsb.edu
5. Oxford Burma Alliance. (2015). Education in Burma. Retrieved from http://www.oxfordburmaalliance.org/education-in-burma.html6. Quinzo, D. (2011). Liberal Arts Colleges Attracts Burmese Students. USA Today. Retrieved from
http://usatoday30.usatoday.com/news/education/2011-07-25-burma-us-liberal-arts-colleges_n.htm7. Drews, F. (2014). Why You Should Go To College. Brookings. Retrieved from http://www.brookings.edu/blogs/brookings-now/posts/2014/10/why-you-should-go-to-college8. Indiana Department of Education. (2015). Indiana Department of Education Releases 2014 Graduation Rate. Retrieved from
http://www.doe.in.gov/news/indiana-department-education-releases-2014-graduation-rate9. Indystar. (2013). 2013 High School Graduation Rates. Retrieved from
http://www.indystar.com/story/news/education/2014/04/16/ips-graduation-rate-rises-state-rate-remains-steady/7773773/
10. Haskins, R. (2011). The Future of Immigrant Children. Brookings. Retrieved from http://www.brookings.edu/research/papers/2011/04/20-immigrant-children-haskins11. Burmese American Community Institute. (2014,2013). Burmese Refugee Population in the US. Retrieved from http://www.baci-indy.org/resources/burmese-refugee-population-in-the-
us

References: College Persistence Leonhardt, D. (2015, June 3). The New York Times. Bill Gates, College Dropout: Don’t Be Like Me. Retrieved from http://www.nytimes.com. Price, T. (2003, December 5). Rising college costs. CQ Researcher, 13, 1013-1044. Retrieved from http://library.cqpress.com/
Swail, W. S. (December 14, 2010). Postsecondary Persistence and Graduating Rates: A Little Insanity Can Go a Long, Long Way. Retrieved from https://etwus.wordpress.com
Murray, C. (2015, March 24). American Enterprise Institute. Why the SAT isn’t a ‘student affluence test’. Retrieved from http://www.aei.org/publication/why-the-sat-isnt-a-student-affluence-test/
Looney, A., & Greenstone, M. (2015 The Brookings Institution). Regardless of the Cost, College Still Matters. Retrieved from http://www.brookings.edu
Frew, D. (2015 The Brookings Institution). CHART: Today's College-Educated Parents Spend a Lot More Time with Their Kids than Any Parents Did in the 1970s. Retrieved from http://www.brookings.edu
Niu, S., & Tienda, M. (2013). High School Economic Composition and College Persistence. Research in Higher Education, 54 (1), P 30-62.
Adams, C. (2015, February 19). Education Week. Think Tank Propose ‘College For All’ Plan. Retrieved from http://blogs.edweek.org
Almon, C. (2015). College Persistence and Engagement in Light of a Mature English Language
Learner (ELL) Student’s Voice. Community College Journal Of Research & Practice, 39(5), 461-472. Lum, L. (2015 Diverse). ‘Invisible’ Burmese, Bhutanese Americans Face ‘Alarming’ Dropout Rates. Retrieved from http://diverseeducation.com
Wei, M. Ku, T. Liao, K. (2011, April). Cultural Diversity and Ethnic Minority Psychology. Minority Stress and College Persistence Attitudes Among African American, Asian American, and Latino Students: Perception of University Environment as a Mediator, 17(2), 195-203.