burbank sustainable water master plan - bren school of ......burbank sustainable water master plan...
TRANSCRIPT

SUSTAINABLE WATER MASTER PLAN FOR BURBANK WATER AND POWER
MAY 11, 2015
A Group Project submitted in partial satisfaction of the requirements for the degree of
Master of Environmental Science and Management
for the Bren School of Environmental Science & Management
by Daniel Gold, Christopher Heckman, Christopher Hewes, Alyssa Krag-Arnold, and Lila Spring
Advisor: Robert Wilkinson

SUSTAINABLE WATER MASTER PLAN FOR BURBANK WATER AND POWER
As authors of this Group Project report, we are proud to archive this report on the Bren School's website such that
the results of our research are available for all to read. Our signatures on the document signify our joint
responsibility to fulfill the archiving standards set by the Bren School of Environmental Science & Management.
Daniel Gold
Christopher Heckman
The of the Bren Environmental Science & Management is to produce professionals with
unrivaled training in environmental science and management who will devote their unique skills to the diagnosis,
assessment, mitigation, prevention, and remedy of the environmental problems of today and the future. A guiding
principal of the School is that the analysis of environmental problems requires quantitative training in more than
one discipline and an awareness of the physical, biological, social, political, and economic consequences that arise
from scientific or technological decisions.
The Group Project is required of all students in the Master of Environmental Science and Management (MESM)
Program. The project is a year-long activity in which small groups of students conduct focused, interdisciplinary
research on the scientific, management, and poli dimensions of a specific environ
Project Final Report is authored
Robert Wilkinson
Dat., ~).~S-
Burbank Sustainable Water Master Plan Page | iii
ACKNOWLEDGEMENTS
We would like to thank the following people who supported us by generously sharing their knowledge,
time, and energy:
Faculty Adviser: Bob Wilkinson, Bren School
Client: Kapil Kulkarni, Burbank Water and Power
External Advisers:
Noah Garrison, UCLA Chris Costello, Bren School
Funding Support: Professional Environmental Management Association (PEMA)
Outside Assistance/Research:
Mary Ann Dickinson, Alliance for Water Efficiency
Amy Vickers, Amy Vickers and Associates, Inc.
Allison Horst, Bren School
Darcy Bradley, Bren School
Teresa Gudino, City of Santa Rosa
Amanda Dougherty, San Francisco Public Utilities Commission
Virginia O’Rourke, Santa Clara Valley Water District
Neal Christen, City of Santa Cruz
Laura Allen, Greywater Action
Sherry Lee Bryan, Ecology Action & Central Coast Greywater Alliance
Scott Mathers, Hey!TanksLA
Dan Drugan, Foothill MWD
Lois Yum, San Diego Public Utilities Department
Luke Sires & Briana Seapy, CA Urban Water Conservation Council
Thomas Chesnutt, A&N Technical Services
Heather Cooley, Pacific Institute
Joe Berg, MWDOC
Kim O’Cain & Neal Shapiro, City of Santa Monica
Bill Christiansen, Alliance for Water Efficiency
Larry Rich, City of Long Beach
Bill DeOreo, Aquacraft, Inc.
Glen Wimberley, United Water
Dan Rynn, City of Burbank
Peter Mayer, Water Demand Management
Burbank Sustainable Water Master Plan Page | iv
EXECUTIVE SUMMARY
Taking steps to diminish reliance on imports, increase the utilization of local sources of supply, and
reduce customer demand will enhance water sustainability in the City of Burbank. While the Burbank
Department of Water and Power (BWP) has consistently supported innovative water efficiency
programs, used cutting-edge technology, and proactively adapted its supply portfolio as necessary,
significant opportunities remain to increase the sustainability of BWP’s operations. The objective of this
report is to provide BWP with a portfolio of tools and analytically justified strategies whose collective or
individual implementation will enhance urban water sustainability in the City of Burbank by:
• Decreasing consumer demand by identifying efficiency initiatives with the greatest potential for
reducing per capita consumption and implementing these initiatives with focused marketing
strategies that will maximize returns for both customers and BWP.
• Increasing supply quantity and reliability by identifying opportunities to develop local sources
(recycled water, groundwater, rainwater, and greywater) and diminish reliance on imported water.
ENHANCED DEMAND ASSESSMENT
An enhanced water demand assessment was completed to (1) analyze the distribution of water demand
among single-family accounts and (2) develop opportunities to target different customer groups based
on their consumption patterns.
This analysis found that residential water use in Burbank is unevenly distributed, with the top 50% of
water users accounting for 70% of total use. Therefore, the highest residential water users have an
opportunity to save significantly more water than the lowest residential water users. In addition, these
top water users were also found to account for a disproportionately high quantity of outdoor water use;
the top 50% of overall residential water users consume about 72% of water with outdoor end uses.
These results reveal that water savings can be maximized by focusing efficiency programs on the
outdoor water use of the top 50% of residential customers in Burbank.
STATISTICAL ANALYSIS OF OUTDOOR WATER EFFICIENCY AND THE
IMPACT OF EFFICIENCY PROGRAMS
Statistical analysis of the water savings attributable to Burbank’s turf replacement program, high-
efficiency toilet (HET) rebates, high-efficiency clothes washer (HECW) rebates, and Green Home House
Call (GHHC) home efficiency audit program were conducted in order to (1) improve the accuracy of
water-savings projections and (2) provide insight into potential program improvements.

Burbank Sustainable Water Master Plan Page | v
Replacing one square foot of turf was found to yield 35.0 gallons of water savings each year, which
differs from BWP’s current estimate of 43.8 gallons per year. The type of irrigation installed post-
replacement and whether a household adjusts its irrigation system over time to meet the changing
water needs of their landscapes are both significant predictors of post-conversion water consumption.
These factors may play a bigger role in reducing water consumption than the quantity of turf replaced.
These results underscore the importance of focusing on irrigation requirements within BWP’s turf
replacement program. In addition, participation in both the HET rebate program and the GHHC program
were found to significantly reduce water consumption.
COST-BENEFIT ANALYSIS
A cost-benefit analysis of both current and proposed water efficiency programs was conducted in order
to determine the long-term financial costs of implementation relative to total water savings potential.
The industry-standard Alliance for Water Efficiency Water Conservation Tracking Tool was used to
construct a unit cost curve that compares programs based on their water savings potential, cost to BWP,
and the long-term financial savings accrued to BWP.
26 out of the 30 efficiency programs included in this analysis were found to be cost-effective; it costs
BWP less to “acquire” a given quantity of water through efficiency savings than to purchase that same
quantity of imported water. In particular, in-home information tools similar to WaterSmart software
represent a significant opportunity to achieve demand reductions at a low cost to BWP. By choosing
programs that achieve the highest water savings at the lowest cost, BWP can maximize the quantity of
water saved given a fixed budget. These results justify BWP’s continued funding of water efficiency
programs going forward. In addition, the results demonstrate that additional water savings can be
realized through increased funding of water efficiency programs. Finally, the water savings and
associated revenue reductions that are estimated as part of this model can be used to plan for potential
revenue shortfalls associated with the success of efficiency programs.
ASSESSMENT OF LOCAL WATER SUPPLY AVAILABILITY AND
ENHANCEMENT OPPORTUNITIES
A quantitative analysis of BWP’s current and potential water sources concluded that BWP has the
physical and technical capability to meet all demand using locally available supplies. From 2004-2014,
83% of the Burbank Water Reclamation Plant’s tertiary-treated recycled water was discharged into the
Burbank Channel. In addition, BWP’s groundwater pumping facility was operated at 66% of its maximum
capacity. The total quantity of identified unutilized local supply exceeds the quantity of imported water
that was consumed in Burbank during that same time period.
Engaging in indirect potable reuse (IPR) would allow BWP to convert 100% of recycled water into
potable supplies. IPR has the additional benefit of assisting with aquifer replenishment: an essential
component to mitigating legal and physical constraints on BWP’s access to San Fernando Basin

Burbank Sustainable Water Master Plan Page | vi
groundwater. Reducing the amount of imported water that is blended with locally produced
groundwater will further decrease BWP’s reliance on imported supplies. Despite the historical presence
of nitrate and chromium VI in unblended groundwater, water quality testing has demonstrated that
concentrations are currently below all applicable drinking water limits, satisfying the California
Department of Public Health’s blending requirement.
OPPORTUNITIES TO ENHANCE WATER SUSTAINABILITY IN THE CITY OF
BURBANK
The follow recommendations are based on the results of both the primary analyses detailed above as
well as additional analysis described in the full report. Recommended opportunities to reduce water
demand and improve local supply utilization have been classified into three categories: (1) Regulations:
which incorporate enforceable policies and codes to drive customer engagement and compliance; (2)
Incentivizing Demand Reduction: which is driven by BWP policies and programs that promote outreach
and/or education and financial incentives; (3) Increasing the Use of Local Supplies: which focuses on
supply enhancement programs that are independent of municipal water end-uses.
CATEGORY 1: REGULATIONS
1. Implement efficiency-oriented rate structures
2. Modify turf removal requirements to maximize water savings
CATEGORY 2: INCENTIVIZING DEMAND REDUCTIONS
1. Increase BWP commitment to water efficiency programs
2. Improve customer outreach through data-driven analysis of customer demand and engagement in
efficiency programs
3. Enable improve water use efficiency from Commercial, Industrial, and Institutional water users
4. Provide customers with resources to minimize water waste associated with landscaping.
5. Build on Green Home House Call Services and customer engagement
CATEGORY 3: INCREASING THE USE OF LOCAL WATER SUPPLIES
1. Increase the percentage of produced recycled water that is put to beneficial use
2. Increase the ratio of local groundwater to pre-treated imports in the potable supply
3. Take action to replenish groundwater levels in the San Fernando Basin aquifer in order to unlock its
potential use as a long-term storage reservoir
4. Provide financial support and education outreach to develop a residential greywater program
5. Maximize rain barrel effectiveness by focusing on high-volume rain barrels and customer education

Burbank Sustainable Water Master Plan Page | vii
TABLE OF CONTENTS
PART 1: INTRODUCTION _______________________________________________________________ 1
PART 2: OBJECTIVES AND DELIVERABLES __________________________________________________ 2
PART 3: CITY AND UTILITY OVERVIEW ____________________________________________________ 4
PART 4: CUSTOMER DEMAND ASSESSMENT _______________________________________________ 5
PART 5: STATISTICAL ANALYSIS OF OUTDOOR WATER EFFICIENCY _____________________________ 15
PART 6: COST-BENEFIT ANALYSIS _______________________________________________________ 20
PART 7: ADDITIONAL DEMAND REDUCTION OPPORTUNITIES _________________________________ 29
SMART METERS ______________________________________________________________________ 29 VISUALIZATION OF DATA: ARC-GIS _________________________________________________________ 31 INDOOR WATER SAVINGS ________________________________________________________________ 34 OUTDOOR WATER SAVINGS ______________________________________________________________ 38 COMMERCIAL, INDUSTRIAL, AND INSTITUTIONAL (CII) WATER EFFICIENCY _______________________________ 40 RATE STRUCTURES _____________________________________________________________________ 42
PART 8: WATER SUPPLY ______________________________________________________________ 45
PART 9: ADDITIONAL SUPPLY ENHANCEMENT OPPORTUNITIES _______________________________ 55
STORMWATER CAPTURE/LOW IMPACT DEVELOPMENT ____________________________________________ 55 GRAYWATER _________________________________________________________________________ 57 RAINWATER HARVESTING ________________________________________________________________ 59 DIRECT POTABLE REUSE _________________________________________________________________ 62
PART 10: CONCLUSIONS ______________________________________________________________ 63
PART 11: OPPORTUNITIES _____________________________________________________________ 65
APPENDICES _______________________________________________________________________ 69
Burbank Sustainable Water Master Plan Page | 1
PART 1: INTRODUCTION
Providing customers with municipal water service that is reliable, affordable, and sustainable is a top
priority of the City of Burbank’s Department of Water and Power (BWP). Implementing water
management strategies that satisfy immediate demands without diminishing the future availability of
critical sources of supply is essential to the long-term success of this objective. The difficulty of
predicting how varying environmental, economic, and demographic pressures will impact supply and
demand poses a substantial challenge to achieving this goal. BWP’s consistent support of innovative
water efficiency programs, use of cutting edge technology, and willingness to adapt its supply portfolio
has enabled the agency to successfully address this challenge. This report highlights additional
opportunities to strengthen these efforts and increase the sustainability of BWP’s operations.
BWP offers a wide variety of incentives, programs, and services that help customers reduce their water
consumption. Estimates of the water savings associated with these initiatives are primarily derived from
studies conducted by other southwestern water management agencies. While these case studies
provide BWP with valuable guidance, they do not provide exact values that are specific to Burbank.
Although BWP has been able to demonstrate overall reductions in water consumption concurrent with
their sustainability efforts, these conclusions fall short of determining the relative benefits of individual
initiatives. This report’s analysis uses BWP-specific data to develop a quantitative understanding of how
various water efficiency initiatives impact demand and translate into operational and economic
benefits.
The smart meter grid that came online in 2011 has equipped BWP with high resolution data collection
abilities. The use of this technology thus far has focused on a leak detection system that, while highly
successful, only capitalizes on a small fraction of the smart meter grid’s potential. Expanded use of this
technology will allow BWP to identify areas of operational strength and opportunities for improvement.
This report contains specific suggestions as to how additional value can be captured using smart meter
technology.
Burbank Sustainable Water Master Plan Page | 2
PART 2: OBJECTIVES AND DELIVERABLES
The objective of this report is to provide BWP with a portfolio of tools and analytically justified strategies
whose collective or individual implementation will enhance urban water sustainability in the City of
Burbank by:
• Decreasing consumer demand by identifying efficiency initiatives with the greatest potential for
reducing per capita consumption and implementing these initiatives with focused marketing
strategies that will maximize returns for both customers and BWP.
• Increasing supply quantity and reliability by identifying opportunities to develop local sources
(recycled water, groundwater, rainwater, and graywater) and diminish reliance on imported water.
The deliverables of this report and the analytical approaches behind them are summarized as follows:
• Customer Demand Assessment
A statistical analysis of the distribution of single-family home water demand used to identify
efficiency initiatives with the greatest potential for reducing per capita consumption and focus these
initiatives to target different customer groups based on their consumption patterns.
• Statistical Analysis of Turf Removal
The application of Difference in Difference analysis to quantify the savings from Go Native! Lawn
Replacement program participation relative to non-participants.
• Statistical Analysis to Estimate the Effect of Multiple Efficiency Programs and Confounding
Variables on Daily Water Use.
The application of a multiple regression to predict water use based on factors including the Go
Native! program, Green Home House Call, High Efficiency Toilets and High Efficiency Clothes
Washers.
• Cost-Benefit Analysis (CBA) Tool and Analysis
A quantitative comparison of the long-term costs of implementing water efficiency devices relative
to the value of their total water savings potential. The costs of conserved water is compared to the
cost of imported water to determine cost-effectiveness.
• Opportunities to Enhance Local Sources of Supply
Burbank Sustainable Water Master Plan Page | 3
A detailed breakdown of BWP’s current sources of supply, recent historical trends, and a quantitative
analysis of currently unutilized local sources.
• Alternative Options For Demand Reduction and Supply Enhancement
A qualitative assessment of how other water agencies are approaching water supply challenges and
what features contribute to program success. Case studies focus on these areas: (1) Smart Meters,
(2) Visualization of Data in ARC-GIS, (3) Indoor Water Savings, (4) Outdoor Water Savings, (5)
Commercial, Industrial, and Institutional Water Efficiency, (6) Rate Structures, (7) Stormwater/Low
Impact Development, (8) Graywater, (9) Rainwater Harvesting, and (10) Direct Potable Reuse.

Burbank Sustainable Water Master Plan Page | 4
PART 3: CITY AND UTILITY OVERVIEW
The City of Burbank was officially incorporated in 1911.1 It consists of 17.4 square miles2 of land located
at the eastern end of L.A. County’s San Fernando Valley. BWP began operations in 19143 and provides
municipal water and electricity to approximately 105,000 residents4 in addition to the city’s commercial
and industrial sectors. A defining moment in the city’s history came in 1928 when Lockheed Martin
opened its headquarters,5 causing Burbank to become a major hub for aviation manufacturing. The
strong industrial sector fostered rapid growth during WWII and maintained a dominant presence in the
local economy until Lockheed discontinued operations at its Burbank facilities in 1992.6 Since that time,
expansion of the media and entertainment industry has revitalized the downtown area and emerged as
a significant economic driver. Major studios currently located in Burbank include the Walt Disney
Company, Warner Bros. Entertainment, and NBC.
BWP first distinguished itself as a regional leader in water management in 1928 when it became a
founding member of the Metropolitan Water District of Southern California (MWD). Since that time, the
BWP’s sustainability efforts have yielded considerable recognition and several awards. In 1967, BWP
was one of the first agencies in the region to utilize recycled water to increase its non-potable supplies.7
When BWP’s plan to satisfy 33% of customer’s energy demands with renewables sources was approved
in 2007, it was the most ambitious energy portfolio in the nation.8 A 2009 city council decision to
allocate 2% of all water sales revenue towards water efficiency programs9 further solidified BWP’s
commitment to resource sustainability.

Burbank Sustainable Water Master Plan Page | 5
PART 4: CUSTOMER DEMAND ASSESSMENT
• Single family home water use is unevenly distributed, with the top 50% of users accounting for
70% of total single family home water use.
• High water use accounts consume a disproportionately high quantity of water for outdoor use.
• Water efficiency strategies will be more successful if they acknowledge that customers will
respond to strategies differently.
Burbank’s water demand is composed of three main sectors: single family (SF) homes, multi-family
homes, and commercial, institutional, and industrial water uses. Breaking down water demand by both
the number of accounts (Figure 1(a)) and the percentage of total water use (Figure 2(b)) shows that SF
homes have the largest water demand as well as the greatest number of accounts. For this reason, the
following analysis focuses on SF home water use efficiency.
Figure 1. Burbank’s water demand broken down by (a) number of accounts and (b) volume.
Burbank’s overall water use, in gallons per capita per day (gpcd), falls within the range of the other
MWD member agencies. (Figure 2). However, Burbank’s average SF home water use has been higher
than the regional average, which creates an incentive for BWP to focus on lowering their use. The
average Californian SF home water use from 2005-2007 was 144 gpcd,10 after being adjusted for
Burbank’s average occupancy of 2.5 people per household.11 During the same time period, Burbank’s
average SF home water consumption was 189 gpcd, and now in 2014, it is 174 gpcd. Therefore, while
(a) (b)

Burbank Sustainable Water Master Plan Page | 6
Burbank’s SF homes have decreased their water use, their 2014 average water use is still higher than the
state’s average water use seven years earlier.
Figure 2. Metropolitan Water District of Southern California’s Member Agency Gallons Per Capita Per Day for
2013-2014. Burbank is just below the median of 187.5 gpcd (black line)
The future goal for indoor water efficiency in California has been set at 55 gpcd by SBX7-7 (colloquially
known as the 20x2020 law). This may seem to be an improbably low number, but the EPA Smart Sense
program has shown this to be possible in any household.12 In the early 2000s, 96 randomly selected
homes were retrofitted with EPA WaterSense devices. When comparing pre-retrofit to post-retrofit,
average total home water use dropped 39% from 175 to 107 gallons per household per day.13 In
Burbank, the equivalent change would be from 70 to 43 gpcd. Together, the 2005-2007 state average
and EPA WaterSense program highlight that there is a significant opportunity for Burbank to reduce
their overall water demand by focusing on SF home water use efficiency.
While gpcd is the industry’s standard metric for comparing water use between municipalities, it is a poor
metric for identifying strategic opportunities to increase the efficiency of water usage within the
municipal district. Water use typically has a strong right-hand skew to the data, where the top water
users, compared with users around the median, have a disproportionately large influence on gpcd. In
general, a higher water user is likely to have a greater opportunity to save water in comparison to the
lowest water users. Therefore, identifying the distribution of water use by categorizing customers as
Burbank Sustainable Water Master Plan Page | 7
low, medium, or high users is important because it reveals the greatest opportunities to decrease
demand. Disaggregating gpcd into the full range of users highlights disparate water consumption
behaviors in Burbank and supports the idea that water efficiency programs will have the greatest
positive impact when they are tailored to BWP customers’ needs. Focused programs also benefit from
low, medium, and high water users responding to water efficiency programs and policies differently.
Identification of these different water use groups provides agencies with the information to create a
more successful portfolio of water efficiency programs.
The following analysis shows the distribution of Burbank’s SF home water use, identifies significant
opportunities and strategies to lower gpcd, and concludes with a description of how a water efficiency
program can be designed around customers’ needs.
SINGLE FAMILY HOME WATER USE STATISTICAL ANALYSIS
RESULTS
To disaggregate SF home water use, individual addresses were classified by their mean water use over
the 2013-2014 calendar years. Each individual address was then sorted into ascending order by gpcd and
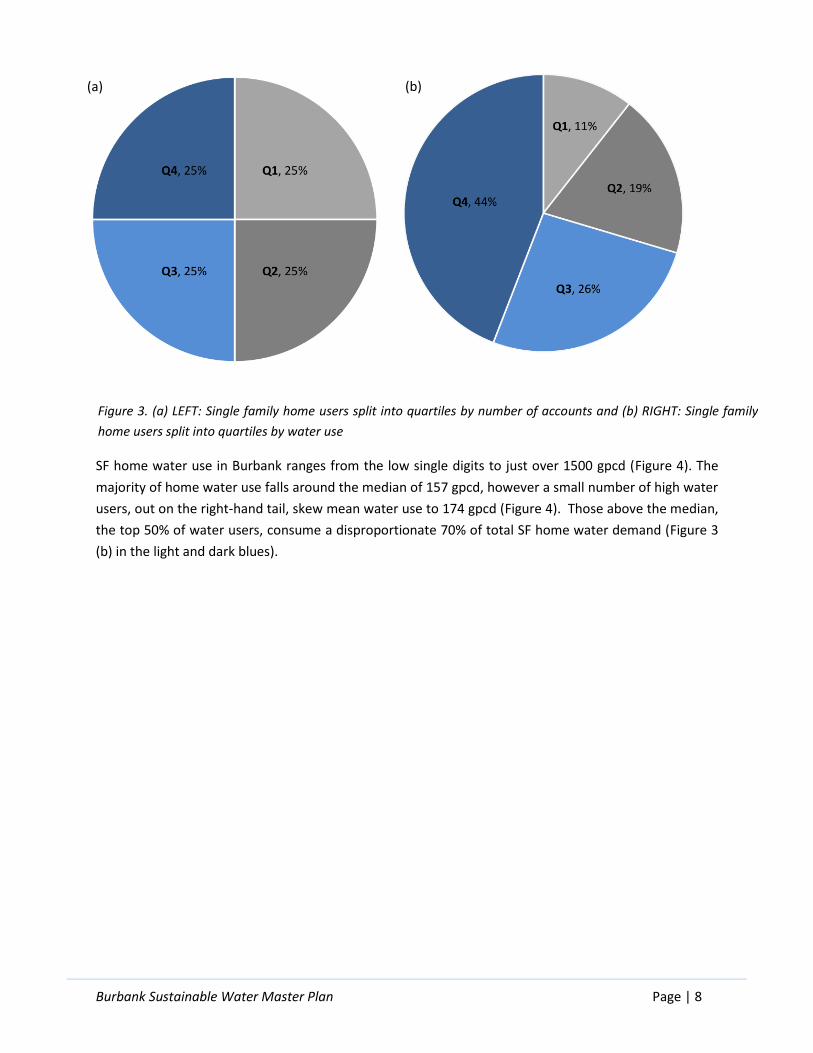
split into quartiles, each of which includes the same number of accounts (Figure 3(a)). In addition, Table
15 in Appendix I includes a further breakdown of the top 1%, top 10%, top 25%, top 50%, and bottom
50% of accounts by use.
Burbank Sustainable Water Master Plan Page | 8
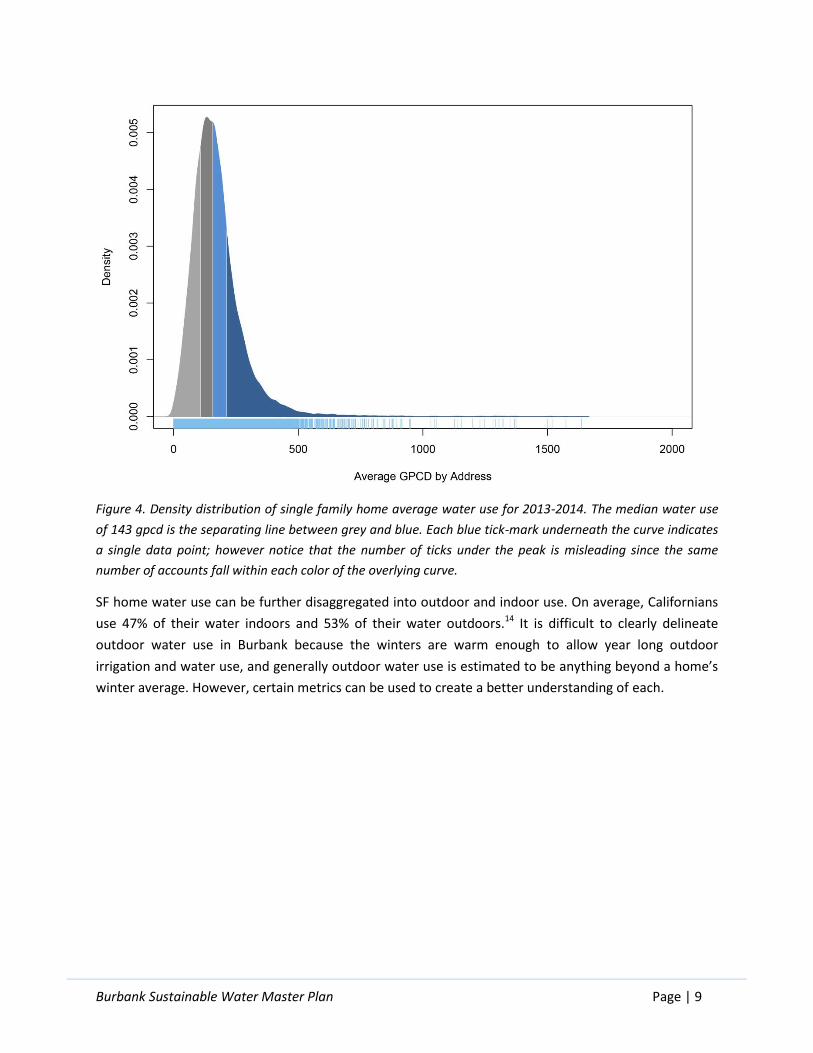
SF home water use in Burbank ranges from the low single digits to just over 1500 gpcd (Figure 4). The
majority of home water use falls around the median of 157 gpcd, however a small number of high water
users, out on the right-hand tail, skew mean water use to 174 gpcd (Figure 4). Those above the median,
the top 50% of water users, consume a disproportionate 70% of total SF home water demand (Figure 3
(b) in the light and dark blues).
Figure 3. (a) LEFT: Single family home users split into quartiles by number of accounts and (b) RIGHT: Single family
home users split into quartiles by water use
(a) (b)
Burbank Sustainable Water Master Plan Page | 9
Figure 4. Density distribution of single family home average water use for 2013-2014. The median water use
of 143 gpcd is the separating line between grey and blue. Each blue tick-mark underneath the curve indicates
a single data point; however notice that the number of ticks under the peak is misleading since the same
number of accounts fall within each color of the overlying curve.
SF home water use can be further disaggregated into outdoor and indoor use. On average, Californians
use 47% of their water indoors and 53% of their water outdoors.14 It is difficult to clearly delineate
outdoor water use in Burbank because the winters are warm enough to allow year long outdoor
irrigation and water use, and generally outdoor water use is estimated to be anything beyond a home’s
winter average. However, certain metrics can be used to create a better understanding of each.

Burbank Sustainable Water Master Plan Page | 10
Figure 5. Single family home outdoor water use estimate. Again, each color represents the same quartiles
shown earlier, with equal numbers of accounts represented by each quartile. Outdoor water use was
estimated by the difference between summer and winter use. This is a conservative number due to the
likelihood that irrigation occurs all year long.
Two different methods were used to examine outdoor water use in Burbank. First, the quantity of water
used outdoors was estimated by taking the difference between summer and winter water consumption,
which was June to September and December to March, respectively (Figure 5). Second, we made the
assumption that any use over 100 gpcd would be considered outdoor water use because it is otherwise
difficult to show just how much water each SF home uses outdoors. This is a safe assumption to make
because indoor water use has an upper limit based upon everyday human needs, which has been shown
to be consistent across the country.15 Additionally, the same report shows that only 19% of homes in
California use more than 100 gpcd indoors, and the top 1% show the maximum use of just over 200
gpcd.16 Either method of examining outdoor water use in Burbank shows that the top 50% of water
users also use a disproportionately high amount of the total outdoor water use (Figure 5).
DISCUSSION
The analysis shows that the best opportunities to decrease water demand in Burbank can be realized by
focusing efficiency programs towards the top 50% of users and emphasising programs that reduce
outdoor water use. Given an across-the-board percentage cut in water use, the highest water users have
an opportunity to save more water than the lowest water users. For example, if all single family home
users reduced their use by 20%, overall water use would decrease by 20%, but the bottom 50% would
only account for 6% of the savings whereas the top 50% would account for 14% of the total savings;
essentially the top 50% would save almost 2.5 times more water than the bottom 50%.
Another example to further accentuate the opportunity associated with the top water users is: if the
bottom 50% and the top 10% of SF water users both conserved the same percentage of water, then the
top 10% would decrease total SF water use by 5% whereas the bottom 50% would only decrease it by
6%. This shows that a focused water efficiency program could save nearly the same amount of water
with 1,978 homes (the top 10%) as it could with 9,130 homes (the bottom 50%).
Burbank Sustainable Water Master Plan Page | 11
The major contributing factor to high water users’ total consumption is their outdoor water use. This is
supported by the fact that on average, 53% of home water use in California is used outdoors,17 and this
analysis shows that high water users are using more water outdoors than the low water users (Figure 5).
By using 100 gpcd as an indoor water use estimate, it is apparent that outdoor water use is the major
contributing factor to high water use. With indoor use held constant at 100 gpcd, as overall water use
increases, the ratio of outdoor to indoor water use must increase. Figure 5 shows that our analysis
supports this trend, however the estimate makes it apparent just how much water the highest water
users use outdoors. Accepting that outdoor water use will vary depending on the size of the home’s
landscape and type of vegetation, the greatest opportunities lie with those who have immensely high
uses when compared to other users with similar sized landscapes. The reason for this may be over-
irrigation or having vegetation that requires more water; whichever the reason, focusing on extreme
water users will make it possible to identify outdoor water use efficiency opportunities. Additional
opportunities for identifying outliers are described in the next section.
This analysis shows that (1) relative to other California SF households, Burbank’s SF homes have a higher
than average water use and (2) there is significant variability in the amount of water that homes use.
Overall high average water use indicates that there are opportunities in all homes to save water,
however the greatest opportunities lie in the top 50% of users. Using a density distribution of
customers’ water use (Figure 4) provides the information which is necessary for BWP to better focus
their water efficiency outreach programs and provide a more personalized customer experience.
IDENTIFYING ADDITIONAL OPPORTUNITIES
SF homes have varying water consumption depending on a myriad of factors; additional opportunities
can be highlighted by identifying reasons for why homes have different water consumptions. For
example, one indicator is if a group has similar sized homes and landscapes, and one household has
drastically higher water use. Essentially, it is difficult to compare homes and find those that are outliers
in water consumption without some normalization, or a similar attribute between them to explain the
water use.
Smart meters, ArcGIS, and customer surveys can be used to identify these attributes for home water use
comparison. Using these tools would allow BWP’s water efficiency programs to have a greater impact
while providing a more personalized customer experience. This section briefly describes the possibilities
for each of the three tools.
The primary opportunity associated with smart meters is in the uniform format of data that can be
recorded at different time intervals. This produces relatively accessible data that can be used to examine
metrics such as overall trends in customer water use, how customers’ water uses compare, and where
leaks may be occurring. In addition, it allows BWP to look at a an individual home’s water use to
determine the effectiveness of a program for a specific customer. More information on this can be
found in Section 7: Smart Meters.

Burbank Sustainable Water Master Plan Page | 12
Integrating this information into ArcGIS creates a number of opportunities to visualize data and
determine where specific efficiency opportunities lie. On a city-wide scale, water use trends by
neighborhood could show which neighborhoods have significant opportunities for savings. On a finer
scale, it is relatively simple to join user data with demographic data sets to compare homes with similar
attributes. Then, an average water use for a group can be identified, and those homes with much higher
water use can be highlighted for efficiency opportunities. Some attributes by which to compare homes
include the number of people in the home, size of irrigable area combined with an evaporation
estimate, income, and age of home, and past participation on efficiency programs. An example of using
theses attributes would be to compare homes’ water use divided by the amount of irrigable area or
home square footage, or comparing homes by multiple attributes and estimations of water use. More
information on this can be found in Section 7: Visualization of Data: ARC-GIS.
Finally, surveys can be used to find additional data to better inform the estimated water budget for each
home. Useful information would include: household occupancy, type of irrigation system, and opinions
about water efficiency. In addition, this would help engage customers by making them aware of the
effort BWP is putting forward.
This section suggests many uses for smart meter data, ArcGIS, and surveys while highlighting the
opportunity to identify those who have very high water use when compared to similar homes. Together,
this data provides quantitative justification for focusing different efficiency programs on different
customers based on their individual needs.
CONSIDERATIONS FOR DESIGNING A WATER EFFICIENCY OUTREACH
PORTFOLIO
Not all water efficiency plans are created equal: municipalities and individual customer all have
disparate water needs. Research indicates that the effectiveness of water efficiency programs varies
between low and high water users, as well as between different socioeconomic levels.18 In general, the
water efficiency programs that are more publicly accepted tend to be the least effective.19 A possible
explanation for this is that realizing bigger opportunities requires bigger changes, and it is our natural
tendency to stick with the status quo.20 Therefore, the success of a water efficiency portfolio depends in
part on how well the programs compliment each other to meet customers’ different needs.
This section includes an overview of four main efficiency approaches, which are explained in more detail
throughout this report. The approaches are composed of: (1) information policies, (2) incentive policies,
(3) rate policies, and (4) regulation policies.
INFORMATION POLICIES
Information policies typically involve reaching out to customers to explain the importance of decreasing
water use as well as the available resources that allow customers to do so. Although these programs are
generally the most widely accepted by the public and are relatively inexpensive for the municipality to
implement, they are among the least effective approaches to improving water use efficienc.21 However,

Burbank Sustainable Water Master Plan Page | 13
information policies do compliment the other policies well, and they play a crucial role by informing
customers of the importance of being more water efficient.
INCENTIVE POLICIES
Incentive policies include rebate programs and tax incentives for complying with water efficiency
programs. Incentive programs have been broadly accepted by customers, are relatively expensive
because to fund the rebates, and have an average effectiveness.22 However, rebates provide a way for
all customers to comply with other policies independent of their financial situation.
RATE STRUCTURES
Changing rate structures to have steep tier increases has been shown to be one of the most effective
programs, with a low cost, and has a moderate level of customer acceptance.23 Price elasticity, or how
much a customer reduces their water demand in response to increases in price, decreases with the
highest water users. On the whole, rate structures can be an effective strategy, especially when
augmented with other programs. More information on rate structures can be found in Section 7: Rate
Structures.
REGULATORY POLICIES
Regulatory policies have the lowest public acceptance but are the most effective at increasing water use
efficiency, and they bring equity to the demand reduction goals.24 Information, rebates, and rates all
provide a signal for customers to respond to; if customers choose to disregard these signals, regulatory
policies serve as a backstop to achieve the intended result. Regulatory policies also bring equity to the
portfolio by ensuring that all customers make the same behavioral changes regardless of their water
needs and/or socioeconomic status.
The effectiveness of regulatory policies is demonstrated by the large drop in water use among Burbank
residents following mandatory drought restrictions for 2007-2009. While there are other factors that
contributed to this decline in water use, drought restrictions have largely been responsible for many of
the largest decreases in water use throughout the state. Therefore, a suggestion for keeping water use
low would be to keep some of the drought restriction in place permanently.
Informational campaigns, rebate programs, rate structures, and regulatory policies can be used to signal
the importance of increasing the efficiency of water usage in Burbank. Because customers respond to
signals differently based on their water use and socioeconomic status, choosing the right portfolio of
water efficiency policies will engage the greatest amount of customers. Furthermore, this approach
ensures that BWP can achieve the desired results in a way that is acceptable and equitable to its
customers.
OPPORTUNITIES
• Focus efficiency opportunities on the top 50% of water users who consume a disproportionate
amount of water, especially outdoor water use
Burbank Sustainable Water Master Plan Page | 14
• Identify specific opportunities by estimating which accounts are significantly overusing water
(through smart meters, ArcGIS, and customer surveys)
• Institute a portfolio approach for water efficiency programs to ensure that the wide variety of
Burbank customers will respond to efficiency goals in an equitable way, creating a better overall
response to water efficiency goals

Burbank Sustainable Water Master Plan Page | 15
PART 5: STATISTICAL ANALYSIS OF OUTDOOR WATER EFFICIENCY
WATER SAVINGS ATTRIBUTABLE TO GO NATIVE! TURF REPLACEMENT
PROGRAM
• BWP currently estimates 43.8 gallons per square foot of water savings annually for turf
replacement. A more accurate estimate is 35.0 gallons per square foot.
• Individual choices concerning irrigation technology and scheduling post-conversion may be the
most important factors in determining whether or not a program participant succeeds in reducing
their water consumption.
BWP offers a $3 per square foot rebate to residential customers who remove high water-consuming
lawns and replace them with relatively low water demand California Friendly landscapes or synthetic
turf. To date, the savings attributable to this Go Native! Turf Replacement program (turf replacement)
have been projected using water savings estimates developed from data from other agencies.
Specifically, BWP relies on MWD’s estimate of 43.8 gallons per square foot (gpsf) converted annually.
Although this estimate may be a valid representation of actual water savings, studies conducted
elsewhere have found that average savings vary between 34 and 60+ gpsf.25 Additionally, not all
customers who participate in turf replacement have seen water savings; in some cases water use has
actually increased after turf replacement.26 An in-depth analysis of the water-savings attributable to
BWP’s program in particular helps to improve the accuracy of associated water savings projections and
could provide insight into potential program improvements.
To complete this analysis, consumption data for turf replacement customers and a control group were
collected and statistically analysed using t-test’s, Mann-Whitney U test’s, a difference in difference
regression, and a multiple regression. For details of the turf replacement program and the methods for
calculating the results see Appendix B: Statistical Analysis Appendix.
The turf replacement program in Burbank is relatively new, the first rebates were given out in 2013.
Because of this, only one year of post conversion data was available at the time of this analysis.
Replacing lawns with a new landscape may lead to higher water use in the year immediately following
replacement compared to subsequent years. This is due to newly planted landscapes requiring greater
and more frequent quantities of water than those that have become established.27 However, a study
that analyzed water use over five years after turf replacement found that savings observed in the first
Burbank Sustainable Water Master Plan Page | 16
year neither increased nor degraded over the next four years.28 This indicates that the savings seen in
Burbank in the first year following conversion will likely be maintained at least in the medium term. It
also indicates that there may be additional opportunity to capture savings from turf replacement if
water use were reduced in the second and third years following conversion to more closely align with
the water needs of established plants.
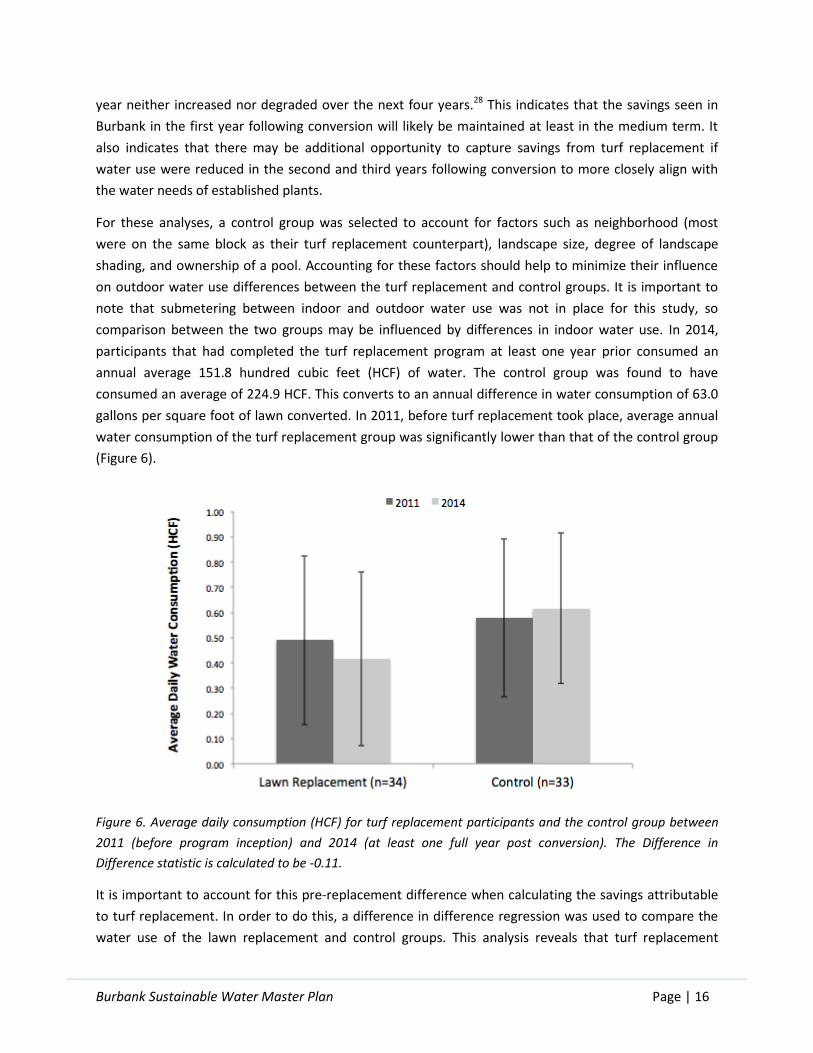
For these analyses, a control group was selected to account for factors such as neighborhood (most
were on the same block as their turf replacement counterpart), landscape size, degree of landscape
shading, and ownership of a pool. Accounting for these factors should help to minimize their influence
on outdoor water use differences between the turf replacement and control groups. It is important to
note that submetering between indoor and outdoor water use was not in place for this study, so
comparison between the two groups may be influenced by differences in indoor water use. In 2014,
participants that had completed the turf replacement program at least one year prior consumed an
annual average 151.8 hundred cubic feet (HCF) of water. The control group was found to have
consumed an average of 224.9 HCF. This converts to an annual difference in water consumption of 63.0
gallons per square foot of lawn converted. In 2011, before turf replacement took place, average annual
water consumption of the turf replacement group was significantly lower than that of the control group
(Figure 6).
Figure 6. Average daily consumption (HCF) for turf replacement participants and the control group between
2011 (before program inception) and 2014 (at least one full year post conversion). The Difference in
Difference statistic is calculated to be -0.11.
It is important to account for this pre-replacement difference when calculating the savings attributable
to turf replacement. In order to do this, a difference in difference regression was used to compare the
water use of the lawn replacement and control groups. This analysis reveals that turf replacement

Burbank Sustainable Water Master Plan Page | 17
program participation yields 35.0 gallons per square foot of water savings each year, or about 20
percent less than MWD’s estimate. A monthly comparison of average water consumption indicates that
most of those savings occur in summer months (Figure 7), indicating that outdoor water use drives these
divergent patterns. For more details on this analysis, see Appendix B: Statistical Analysis Appendix.
Figure 7. Change in average change in average daily water use by month (HCF) between 2011 and 2014 for
turf replacement and control group households. Months with statistical difference are indicated with *.
Further analysis employed the use of a multiple regression to isolate the effect of lawn conversion on
average daily water use. This regression included the month, size of turf replacement, irrigation system
type post conversion, participation in three other water efficiency programs (Green Home House Call,
high efficiency toilet rebates, and high efficiency clothes washer rebates), number of bedrooms on the
property, number of bathrooms on the property, value of the property, presence of a pool, a
standardized water bill to account for rate changes, and the level of drought restrictions in place. A full
summary of the findings can be found in Appendix B: Statistical Analysis Appendix.
The regression indicated that both the size of the turf replacement and the type of irrigation system
installed after turf replacement were significant factors in daily water use. However, the magnitude of
Burbank Sustainable Water Master Plan Page | 18
the effect of irrigation type was much larger than the magnitude of the effect of project size. This
indicates that the post-replacement irrigation type may be the more important of the two in
determining program success.
It is important to note that irrigation type was only known for turf replacement sites post-replacement,
therefore this variable only accounts for variation within that subgroup (n=41). Additionally, the
irrigation control system was unknown in all cases (hand watering is an exception). Previous studies
have demonstrated that timer based systems result in higher water use than either hand watering or
smart controller based systems.29 Inclusion of the irrigation controller system in place may have helped
to refine this analysis and account for water savings not captured by the size of the turf replacement or
the post-replacement irrigation type. Better tracking of irrigation systems and irrigation controllers in
the future would allowed for greater understanding of how these factors influence turf replacement
success.
It may be possible for Burbank to increase the water savings from turf replacement by encouraging
program participants to further decrease water in the second and third years after the plants have
become established. Although not enough time has passed to determine whether water use in Burbank
continues to decrease as plants adapt to their surrounds, studies conducted elsewhere have found
water use to remain relatively constant throughout the following five years. BWP could send reminders
to program participants encouraging further reductions in watering one, two, and three years after turf
replacement.
OPPORTUNITIES TO INCREASE WATER SAVINGS FROM TURF REPLACEMENT
• Increase the focus on irrigation within the Go Native! Turf Replacement program
• Track irrigation types pre- and post-replacement for program participants
• Track irrigation controller types pre- and post-replacement for program participants
• Encourage decreased irrigation after the new landscape has become established
STATISTICAL ANALYSIS TO ESTIMATE THE EFFECT OF MULTIPLE
EFFICIENCY PROGRAMS AND CONFOUNDING VARIABLES ON DAILY
WATER USE
• Participation in Green Home House Call and High Efficiency Toilet rebate programs both
demonstrated a significant correlation to reduction in daily water use.
• Participation in the High efficiency Clothes washer rebate program did not demonstrate a
significant correlation to reduction in daily water use.
Burbank Sustainable Water Master Plan Page | 19
A multiple regression was used to predict the effect of participation in three of BWP’s most prominent
water efficiency programs on water consumption. High efficiency toilet (HET) and high efficiency clothes
washer (HECW) rebate programs, and Green Home House Call (GHHC), a home efficiency audit program,
all have significant potential to increase water efficiency. Replacing toilets and high water use washing
machines with their high efficiency counterparts represent the two largest opportunities for water
savings from fixture retrofit.30 The two fixture retrofits with the next greatest potential for water
savings, faucets and showerheads, are both offered under the GHHC umbrella. In addition, BWP
estimates that landscape audits, offered as part of GHHC, save 27,729 gallons of water per audit per
year, further increasing the savings potential of this program. There is a great deal of variability in the
type and quantity of services provided by GHHC between individual homes. The regression employed
here did not account for variability between program participation, but instead considered whether
participation itself had a significant effect on water use.
Appendix B: Statistical Analysis Appendix details the results from this regression. It was found that both
participation in the HET rebate program and participation in the GHHC program had a significantly
reductive effect on water consumption when controlling for all other factors, including the level of
drought restrictions in place, value of the property, and water service bills (for a complete list, see
Appendix B). However, participation in the HECW rebate program did not demonstrate a significant
effect. Currently, participation in GHHC is limited to once per residence. It is possible that increasing the
allowed number of GHHC visits could increase total water savings by replacing fixtures as they age and
begin to leak, and by checking and adjusting irrigation systems.
OPPORTUNITIES
• Expand the Green Home House Call (GHHC) program through:
• Increased marketing and participation
• Increasd number of allowed GHHC audits
• Maintain High Efficiency Toilet program
• Reevaluate the High Efficiency Clothes Washer program through expanded data analysis
Burbank Sustainable Water Master Plan Page | 20
PART 6: COST-BENEFIT ANALYSIS
• The unit cost of water saved through efficiency devices and programs is, with few exceptions, less
than that of imported water.
• Software that utilizes the concept of social norms (e.g. WaterSmart) produces large quantities of
water savings at a relatively low cost, while the water savings generated from turf replacement
and toilets distributed through Green Home House Call is not cost-effective.
Maximizing the cost effectiveness of water efficiency programs is essential to capturing the full water
saving potential of BWP’s water conservation budget. This analysis evaluates the costs and benefits of
implementing and maintaining an efficiency program and identifies how these costs and benefits accrue
to BWP. Each efficiency program is fixed in size and is constructed based on historic program
participation, previous quantity and size of rebates offered, and remaining potential for the program
based on saturation level and public interest. Different efficiency measures can then be compared on
the basis of water savings potential, costs to BWP, and financial savings that accrue to BWP. These
results are intended to aid BWP’s construction of a water efficiency program portfolio that maximizes
the quantity of water saved while minimizing customer costs and staying within BWP’s given budget.
The metrics of this analysis are intended to be easily communicated to stakeholders, including
community members and planners.
This analysis relies on the Alliance for Water Efficiency’s Water Conservation Tracking Tool, an industry-
standard Excel-based spreadsheet tool. The tool identifies the costs and benefits of efficiency programs
from the perspective of the water utility. Other municipal water agencies that have used this tool to
develop water use efficiency plans include: Municipal Water District of Orange County (MWDOC), Upper
San Gabriel Valley Municipal Water District, Central Basin Municipal Water District, West Basin
Municipal Water District, Mesa Water District, and many more around California and the US.
Most efficiency programs modeled using this tool were indoor or outdoor devices, but a few non-device
programs, such as landscape audits and WaterSmart software were included as well. Also included were
graywater systems and rain barrels which are supply-side measures that offset potable water demand
and are explained further in the supply-side sections of this report. Detailed methods, inputs,
assumptions, and further results in addition to the section below can be found in Appendix C.
Burbank Sustainable Water Master Plan Page | 21
RESULTS FROM COST-BENEFIT ANALYSIS
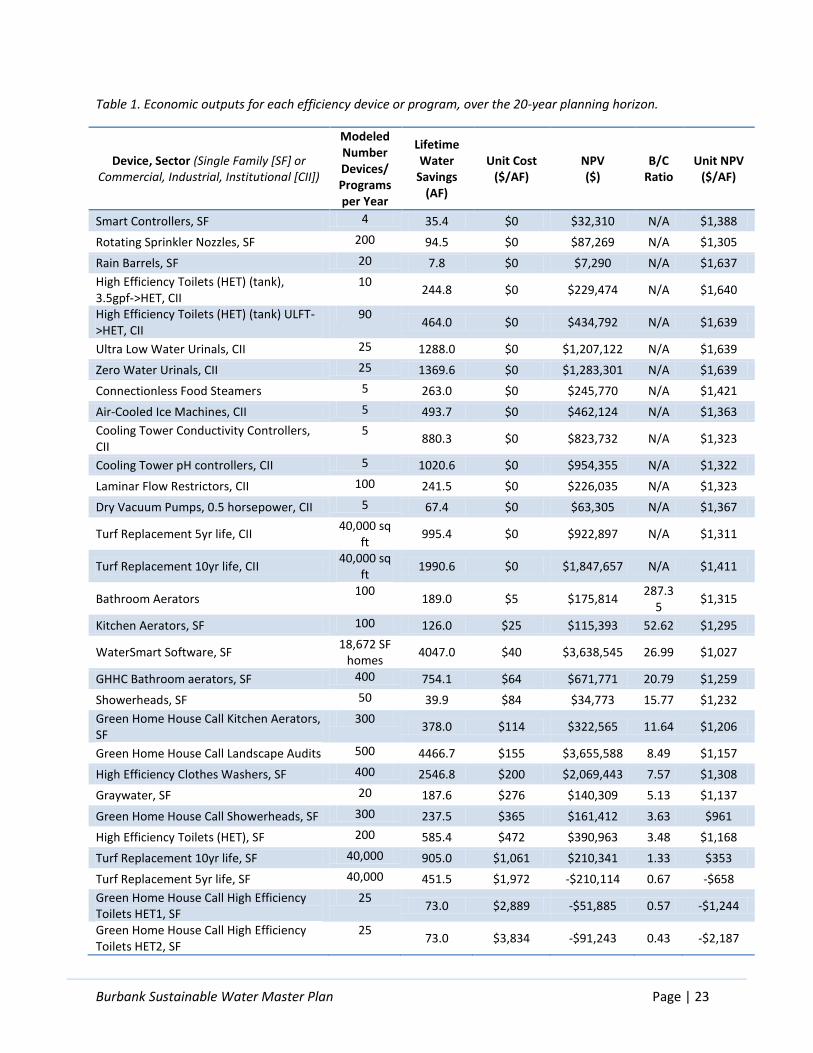
1. UNIT COST CURVE AND TABLE
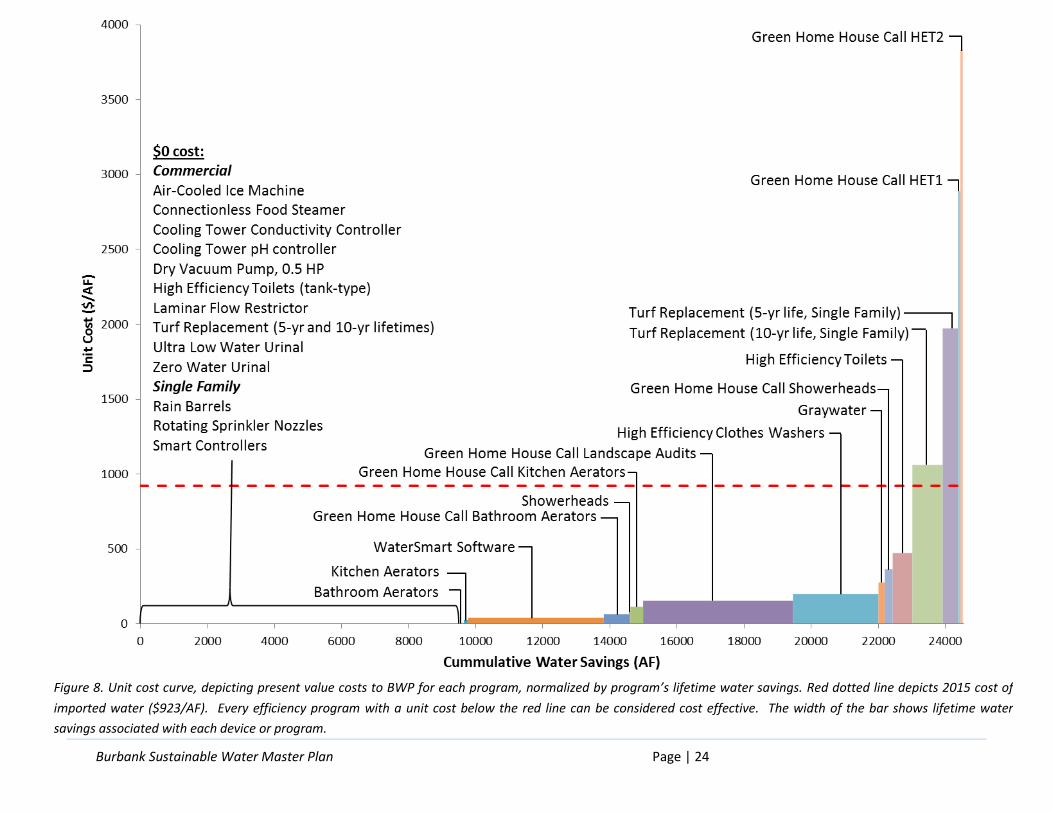
Figure 8 (pg 24) is a unit cost curve, which depicts the present value costs to BWP for each program,
normalized by the program’s lifetime water savings. Every efficiency program that is less expensive than
imported water ($923 in 2015, or the dashed line) can be considered cost effective: it costs BWP less to
acquire a given quantity of water through efficiency savings than to purchase that same quantity of
imported water. The lower the levelized cost, the less money BWP can spend on acquiring a unit of
water. Programs with the lowest levelized costs can be considered the most cost effective.
All programs except (1) toilets installed through Green Home House Call and (2) single-family turf
replacement can therefore be considered cost effective. In fact, nearly half of the efficiency programs
included in this analysis impose no costs on BWP, since many rebates are paid by MWD.
The lifetime water savings associated with each device is represented by the width of each column. This
is an important consideration when choosing efficiency measures. Although several devices have
extremely low (or no) unit costs, they are associated with relatively low water savings. The programs
with the greatest opportunity for water savings are those that have low costs but have the potential to
save large quantities of water.
2. NET PRESENT VALUE
See Table 1 (pg 23) for the Net Present Value of each efficiency program, or the differences between the
discounted costs and the discounted benefits over the 20 year planning horizon. Again, the toilets
installed as part of GHHC and single-family turf replacement are the only efficiency programs with a
negative value.
3. UNIT NET PRESENT VALUE (NPV) CURVE
The unit NPV curve (Figure 9, pg 25) depicts the net present value to BWP of each program, normalized
by the program’s lifetime water savings. This result differs from unit cost curve in that it accounts for the
present value of both costs and benefits. A positive unit NPV value indicates an efficiency program that,
over the 20 year planning horizon, provides BWP with benefits that outweigh the costs.
Table 1 (pg 23) shows that all efficiency programs except toilets installed as part of Green Home House
Call and single-family turf replacement have a positive NPV.
4. LIFETIME WATER SAVINGS
Table 1 (pg 23) shows the lifetime water savings for each efficiency device. This value helps provide
context for overall program potential. For example, while the showerhead program has a very high
Benefit/Cost ratio, the program saves a relative small quantity of water over 20 years. (Annual program
water savings can be calculated based on model input values found in Table 9 in Appendix C or from the
model Excel file itself.)
Burbank Sustainable Water Master Plan Page | 22
5. BENEFIT COST RATIO
See Table 1 (pg 23) for the benefit-cost ratio of each efficiency device from the perspective of BWP. A
Benefit Cost ratio of greater than 1.0 indicates a efficiency device that will have positive net revenue
effects for BWP; a Benefit Cost ratio of less than 1.0 indicates a revenue-negative device. The programs
without Benefit Cost ratios have no marginal costs to BWP.
6. LOST REVENUE
In response to reduced water consumption, BWP can expect to see reduced customer revenue due to
lower customer bills. In response to these efficiency savings, BWP will likely need to raise rates to
maintain revenue neutrality, which is discussed later in this section. As discussed throughout this
section, in response to these efficiency savings BWP will likely need to raise rates to maintain revenue
neutrality. Results for expected lost revenue from the cost-benefit analysis can help BWP anticipate
revenue shortfalls associated with the implementation of a efficiency program, and allow BWP to raise
rates appropriately to offset this demand reduction. The model Excel file can provide annual
undiscounted lost revenue for each efficiency measure over the 20 year planning horizon.
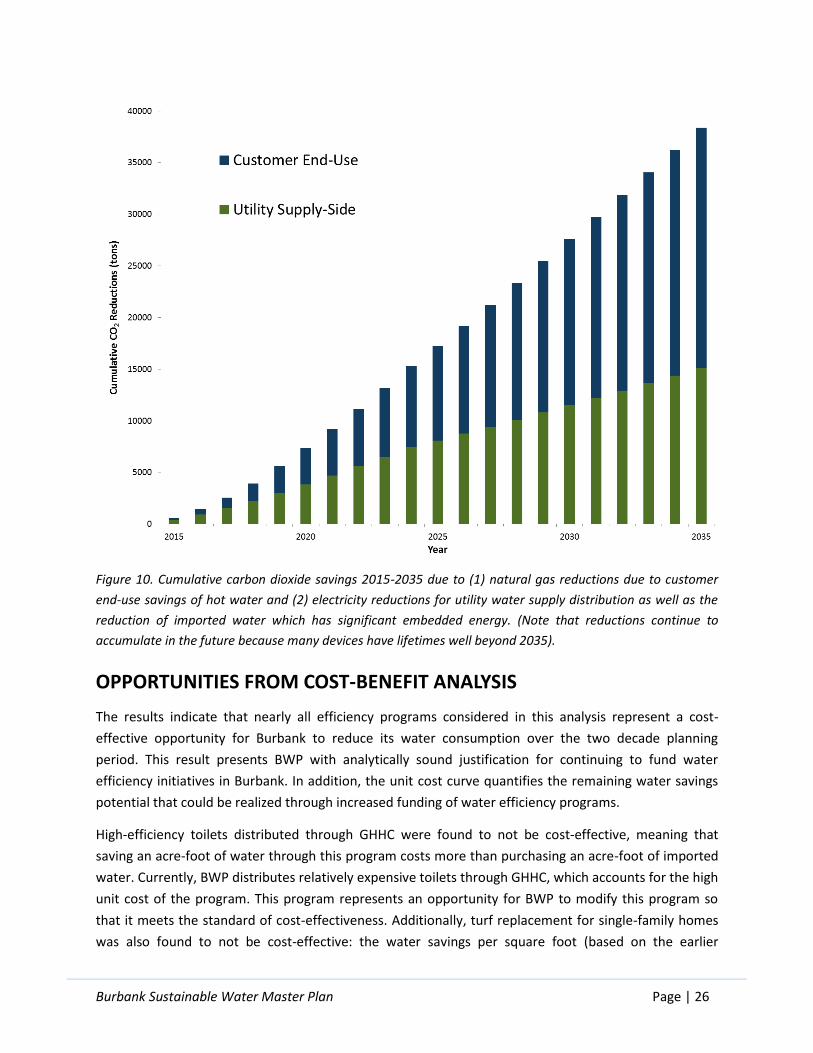
7. ESTIMATIONS OF GREENHOUSE GAS REDUCTIONS DUE TO WATER EFFICIENCY
The Tracking Tool also includes a Greenhouse Gas (GHG) Module which estimates the reductions in
greenhouse gas emissions due to plumbing/energy codes and active efficiency programs (see Figure 10
on pg 26). We made use of the model’s integration with EPA eGrid subregions which provides average
generation emission factors for different GHGs across the USA. Emissions reductions come from
reductions in production of local water, the large magnitude of embedded energy in imported water,
and water distribution as well as end-uses for hot water heating. We did not include energy savings for
wastewater since sources in the City reported not being able to scale back operations due to sewage
inflow reductions from efficiency.
California’s water infrastructure as well as consumer end-uses account for roughly 20% of the state’s
electricity consumption and one third of non-power plant natural gas consumption.31 Thus, any
reductions in water end-use translate into multiple energy-related savings along the potable water
supply chain because of the strong “energy-water” nexus in California. Energy savings can be translated
into emissions reductions which support climate change mitigation measures.
Burbank Sustainable Water Master Plan Page | 23
Table 1. Economic outputs for each efficiency device or program, over the 20-year planning horizon.
Device, Sector (Single Family [SF] or Commercial, Industrial, Institutional [CII])
Modeled Number Devices/ Programs per Year
Lifetime Water
Savings (AF)
Unit Cost ($/AF)
NPV ($)
B/C Ratio
Unit NPV ($/AF)
Smart Controllers, SF 4 35.4 $0 $32,310 N/A $1,388
Rotating Sprinkler Nozzles, SF 200 94.5 $0 $87,269 N/A $1,305
Rain Barrels, SF 20 7.8 $0 $7,290 N/A $1,637
High Efficiency Toilets (HET) (tank), 3.5gpf->HET, CII
10 244.8 $0 $229,474 N/A $1,640
High Efficiency Toilets (HET) (tank) ULFT->HET, CII
90 464.0 $0 $434,792 N/A $1,639
Ultra Low Water Urinals, CII 25 1288.0 $0 $1,207,122 N/A $1,639
Zero Water Urinals, CII 25 1369.6 $0 $1,283,301 N/A $1,639
Connectionless Food Steamers 5 263.0 $0 $245,770 N/A $1,421
Air-Cooled Ice Machines, CII 5 493.7 $0 $462,124 N/A $1,363
Cooling Tower Conductivity Controllers, CII
5 880.3 $0 $823,732 N/A $1,323
Cooling Tower pH controllers, CII 5 1020.6 $0 $954,355 N/A $1,322
Laminar Flow Restrictors, CII 100 241.5 $0 $226,035 N/A $1,323
Dry Vacuum Pumps, 0.5 horsepower, CII 5 67.4 $0 $63,305 N/A $1,367
Turf Replacement 5yr life, CII 40,000 sq
ft 995.4 $0 $922,897 N/A $1,311
Turf Replacement 10yr life, CII 40,000 sq
ft 1990.6 $0 $1,847,657 N/A $1,411
Bathroom Aerators 100
189.0 $5 $175,814 287.3
5 $1,315
Kitchen Aerators, SF 100 126.0 $25 $115,393 52.62 $1,295
WaterSmart Software, SF 18,672 SF
homes 4047.0 $40 $3,638,545 26.99 $1,027
GHHC Bathroom aerators, SF 400 754.1 $64 $671,771 20.79 $1,259
Showerheads, SF 50 39.9 $84 $34,773 15.77 $1,232
Green Home House Call Kitchen Aerators, SF
300 378.0 $114 $322,565 11.64 $1,206
Green Home House Call Landscape Audits 500 4466.7 $155 $3,655,588 8.49 $1,157
High Efficiency Clothes Washers, SF 400 2546.8 $200 $2,069,443 7.57 $1,308
Graywater, SF 20 187.6 $276 $140,309 5.13 $1,137
Green Home House Call Showerheads, SF 300 237.5 $365 $161,412 3.63 $961
High Efficiency Toilets (HET), SF 200 585.4 $472 $390,963 3.48 $1,168
Turf Replacement 10yr life, SF 40,000 905.0 $1,061 $210,341 1.33 $353
Turf Replacement 5yr life, SF 40,000 451.5 $1,972 -$210,114 0.67 -$658
Green Home House Call High Efficiency Toilets HET1, SF
25 73.0 $2,889 -$51,885 0.57 -$1,244
Green Home House Call High Efficiency Toilets HET2, SF
25 73.0 $3,834 -$91,243 0.43 -$2,187
Burbank Sustainable Water Master Plan Page | 24
Figure 8. Unit cost curve, depicting present value costs to BWP for each program, normalized by program’s lifetime water savings. Red dotted line depicts 2015 cost of
imported water ($923/AF). Every efficiency program with a unit cost below the red line can be considered cost effective. The width of the bar shows lifetime water
savings associated with each device or program.

Burbank Sustainable Water Master Plan Page | 25
Figure 9. Unit Net Present Value curve depicts the Net Benefits minus Net Costs to BWP of each program, normalized by the program’s lifetime water savings. A
positive unit NPV value indicates an efficiency program that, over the 20 year planning horizon, provides BWP with benefits that outweigh the costs. Shown in
the graph are both (1) single family programs and (2) Commercial, Industrial, and Institutional programs, labeled SF and CII, respectively.
Burbank Sustainable Water Master Plan Page | 26
Figure 10. Cumulative carbon dioxide savings 2015-2035 due to (1) natural gas reductions due to customer
end-use savings of hot water and (2) electricity reductions for utility water supply distribution as well as the
reduction of imported water which has significant embedded energy. (Note that reductions continue to
accumulate in the future because many devices have lifetimes well beyond 2035).
OPPORTUNITIES FROM COST-BENEFIT ANALYSIS
The results indicate that nearly all efficiency programs considered in this analysis represent a cost-
effective opportunity for Burbank to reduce its water consumption over the two decade planning
period. This result presents BWP with analytically sound justification for continuing to fund water
efficiency initiatives in Burbank. In addition, the unit cost curve quantifies the remaining water savings
potential that could be realized through increased funding of water efficiency programs.
High-efficiency toilets distributed through GHHC were found to not be cost-effective, meaning that
saving an acre-foot of water through this program costs more than purchasing an acre-foot of imported
water. Currently, BWP distributes relatively expensive toilets through GHHC, which accounts for the high
unit cost of the program. This program represents an opportunity for BWP to modify this program so
that it meets the standard of cost-effectiveness. Additionally, turf replacement for single-family homes
was also found to not be cost-effective: the water savings per square foot (based on the earlier

Burbank Sustainable Water Master Plan Page | 27
statistical analysis) do not outweigh the $1/square foot price that BWP pays to provide customers with a
rebate (not including the additional outside rebate from MWD). Greater water savings from residential
turf replacement would result in a more cost-effective program. Improving the water savings achieved
from turf replacement can be achieved by improving irrigation efficiency via methods such as tracking
irrigation type and irrigation controller type and encouraging irrigation schedule resets when needed.
Refer to Part 5: Statistical Analysis of Outdoor Water Efficiency for further discussion and analysis about
enhancing the water saving-potential of Burbank’s turf replacement program.
The results highlight significant tradeoffs between cost-effectiveness and potential for water savings:
the most cost-effective programs do not save large quantities of water. While these highly cost-effective
programs can certainly be included as part of a portfolio of water efficiency programs, they must be
accompanied by programs that save higher quantities of water at higher costs to BWP. The specific mix
of programs that BWP selects depends on BWP’s water savings goals, water efficiency budget, and other
priorities and considerations such as ease of implementation or building customer relationships. The
results of this analysis provide BWP with the information necessary to construct a long-term water
efficiency program portfolio based on budget limitations and desired quantity of water savings. Based
on the unit cost curve, BWP can choose a combination of programs to fulfill a certain quantity of water
savings or to maximize the total water saved given a fixed budget. In order to achieve the highest
quantity of water savings at the least cost, BWP should prioritize programs with the lowest unit cost.
In particular, the unit cost curve indicates that the WaterSmart software program presents an
opportunity for significant water savings (~4,000 AF) at a relatively low cost to Burbank ($40/AF).
Although WaterSmart is not the most cost-effective program considered, the quantity of water that the
program saves over 20 years is sufficiently high as to represent a reasonable tradeoff.
This Cost Benefit Analysis tool also provides BWP with the opportunity to continue assessing potential
efficiency programs in the future. Burbank-specific inputs and assumptions are entered into the model,
which allows BWP to change the features of a given efficiency program to assess the impacts of altering
the program. Continuing to assess water efficiency programs on the basis of cost effectiveness can
provide BWP with the opportunity to modify programs in order to maximize the water savings potential
of its water efficiency budget. Refer to Appendix C for a description of the inputs and assumptions that
can be modified within the model.
RATES AND REVENUE STABILITY IMPLICATIONS
Increasing the effectiveness of Burbank’s water efficiency programs has both short and long term
impacts on revenue and water rates. In the short term, unexpected water conservation can result in
revenue shortfalls and thus require compensatory rate increases.32 Planning for expected reductions in
water use due to efficiency measures can enable BWP to predict these potential revenue changes, and
modify rates accordingly.33 The results of this cost benefit analysis provide BWP with the information
about water savings and subsequent revenue changes that are necessary for making anticipatory rate
adjustments.

Burbank Sustainable Water Master Plan Page | 28
In the long run, reducing BWP’s reliance on imported water can result in lower, more stable rates.34 The
cummulative water savings produced by efficiency programs and devices ultimately lowers variable
water supply costs significantly.35 By relying less on imported water which is relatively expensive and
volatile in price, BWP can ensure that utility costs and associated revenue requirements are more stable
and predictable, which minimizes unanticipated rate changes.36 For further discussion on the revenue
impacts of water efficiency, refer to Appendix C.
Additionally, the water savings associated with efficiency measures can allow BWP to delay expensive
capacity improvement projects. The savings in infrastructure costs are passed to customers, resulting in
in water rates that are lower than they would have been without demand reductions from water
efficiency.37
Burbank Sustainable Water Master Plan Page | 29
PART 7: ADDITIONAL DEMAND REDUCTION OPPORTUNITIES
SMART METERS
• Smart meter data can be used (1) to improve leak detection and (2) to engage and educate
customers about their individual water use when used in conjunction with customer outreach
software such as WaterSmart.
Smart meter technology opens up new possibilities for water efficiency; the finer temporal resolution
data allows for in-home leak detection, helps utilities understand how to better serve their customers,
and can allow customers to be more aware of their real time use data.
Smart meter technology can help both customers and utilities identify leaking pipes, which can be a
great source of inefficient water use. Since June 2012, BWP has utilized its smart meters to save
residential users 25,400,000 gallons. Currently, leaks are detected through a labor-intensive manual
process. Due the significant water savings associated with successful leak detection, BWP could
consider the following opportunities:
• Use outside software to more efficiently detect leaks
• Develop an in-house algorithm to streamline leak detection
• Make real-time use data available to customers and encourage them to check for leaks
Smart meters, through software such as WaterSmart, can give customers information to better
understand their history of water use and engage in water efficiency on their own. WaterSmart features
such as showing users real time use data, their history of water use, and water usage comparisons to
similar neighbors has all shown to increase customers’ water use efficiencies.38 The same ideas could be
developed into an in-house software. Effective information to share with customers is:
• Comparing customer water use to the average use of those who have similar homes
• Show a goal of an efficient water use for a similar type home
Burbank Sustainable Water Master Plan Page | 30
• Historical use patterns
• Drought information
WaterSmart defines the following strategies as ways to help customers become more efficient:39
• Enrolling customers in new programs with giving them the option to opt out
• Giving frequent feedback to customers
• Allow customers to make goals that they will be reminded of
• Make commitments public
• Don’t overload customers with water efficiency options; give them a few of the most beneficial
options for them
Smart meter data gives BWP the opportunity to learn more about their customers to provide a more
personal experience as well as re-evaluate the effectiveness of their water efficiency outreach. Having
use data coming into the system in a regular format greatly expands the ease of data analysis. BWP
should continue to use the different demand and conservation analysis, as defined in this report, to
structure water efficiency programs to be most beneficial to both the utility and individual customer
groups.

Burbank Sustainable Water Master Plan Page | 31
VISUALIZATION OF DATA: ARC-GIS
• GIS can be used to visualize customer water-use data and identify spatial, temporal, and
demographic patterns in water consumption.
Understanding spatial, temporal, and demographic patterns can help BWP better understand their
customer base and create a more beneficial water efficiency outreach program. This can all be
accomplished in ArcGIS through data visualization as well as linking the data to other demographic data
sets.
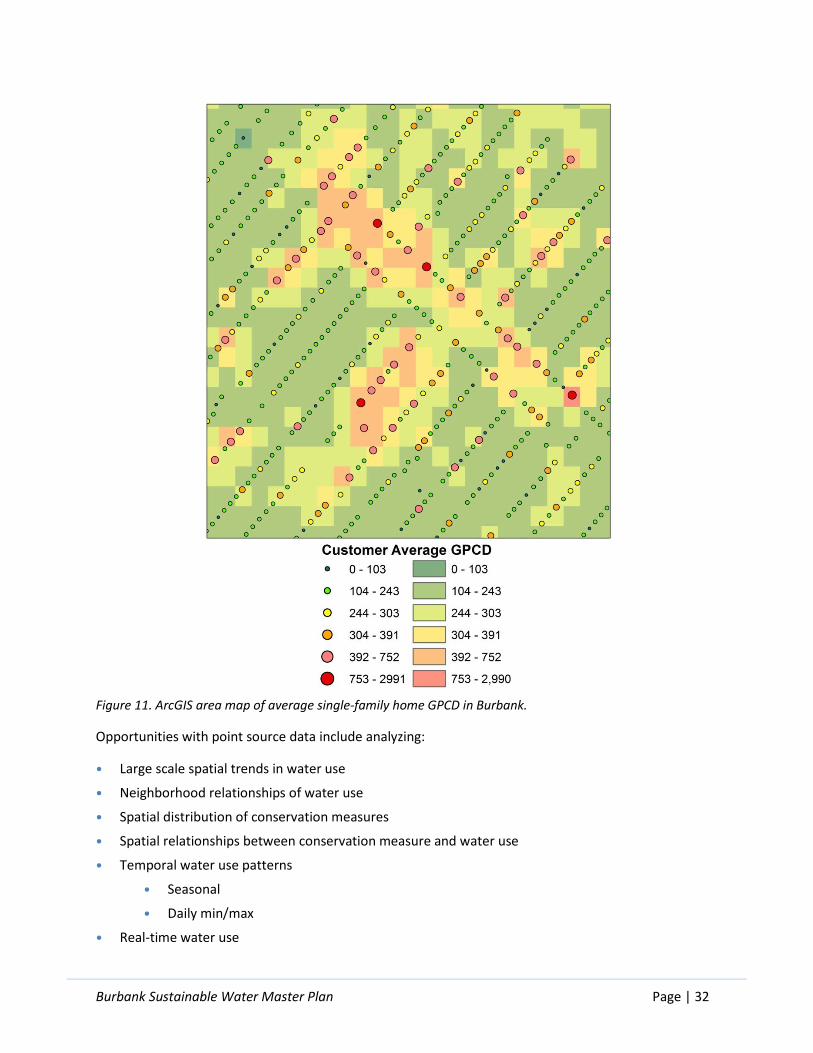
Visualizing the data with point sources shows the greatest amount of detail for BWP to explore spatial
water use patterns (Figure 11). The points were created by taking the mean gallons per capita per day
(gpcd) by address for 2013-2014, then geocoding the addresses in Google Fusion Tables, and uploading
the addresses, with their corresponding latitude and longitude, into ArcGIS. Point symbology was then
changed to represent the gpcd quantiles by color and size of the points.
Burbank Sustainable Water Master Plan Page | 32
Figure 11. ArcGIS area map of average single-family home GPCD in Burbank.
Opportunities with point source data include analyzing:
• Large scale spatial trends in water use
• Neighborhood relationships of water use
• Spatial distribution of conservation measures
• Spatial relationships between conservation measure and water use
• Temporal water use patterns
• Seasonal
• Daily min/max
• Real-time water use

Burbank Sustainable Water Master Plan Page | 33
Interpolating point data can depict the average water use for an area as a continuous color map;
however, this method does not represent the data well. The interpolation, using the inverse distance
weighted method, produces a continuous color map of water use from the point source data, as seen by
the color below the points in Figure 11. While this method can create a general overview of water use in
Burbank, it decreases the resolution of the data and shows data where there is none. For these reasons
the point data is preferred over interpolation.
Another opportunity with this data is to link it with outside data sources to analyze relationships with
population demographics. Point source data can be linked to individual property parcel maps by joining
the parcels and the point data through a variety of methods. Once they are linked, population
demographics, realtor characteristics of homes, participation in efficiency programs, and a multitude of
other data sets can be joined to the parcels to perform different statistical tests. These tests can be
used to create relationships between water use, population demographics, and housing characteristics
to help BWP understand how to further personalize its customer experience.
Finally, ArcGIS can be used to determine which users are grossly over irrigating. A reasonable outdoor
water budget can be made from combining an assumed conservative indoor water use with an
estimated outdoor water use. Outdoor water budgets can be made from using ArcGIS to define the
amount of landscape surface on each plot and then multiplying the area by conservative estimate of the
water use per unit area. Users who are identified as being greatly over their budget therefore represent
candidates for targeted water efficiency programs.
Burbank Sustainable Water Master Plan Page | 34
INDOOR WATER SAVINGS
• Although customer participation is a challenge, significant potential remains for adoption of
indoor water efficiency devices. These devices represent an opportunity to decrease residential
water use without requiring substantial behavioral changes.
Replacing traditional water-using fixtures with their more efficient counterparts saves significant
quantities of water. For instance, if every person in Burbank used a 1.28 gallon per flush (gpf) high-
efficiency toilet instead of the current estimated average of 1.79 gpf (average of 10% 3.5gpf toilets and
90% 1.6 gpf ultra low-flow toilets), it would result in annual savings of 129 AF (*see calculation at end of
section). Technological advancements have allowed for the availability of increasingly efficient fixtures
on the market. Based on a June 2014 report by the Pacific Institute, the use of currently available
technology could cut indoor water use in California to 32 gpcd.40 Projected average water use in
Burbank in 2015 is 164 (gpcd). Based on the assumption that 47% of that water consumption occurs
indoors, the average Burbank resident uses 77 gpcd indoors.41 This means that the average resident in
Burbank could decrease their indoor water use by 58% without changing their current behavior. This
reduction includes the complete elimination of leaks and does not consider variable water use such as a
home business or medical devices.42
The technology exists to achieve significant indoor water savings, but consumer participation remains a
challenge. Burbank Water and Power offers a variety of rebates and direct installation of water saving
fixtures (Table 2). Notably, Burbank recently began offering free direct installation of high-efficiency
toilets through their Green Home House Call program.
Table 3 shows a basic saturation analysis of efficiency devices rebated or given away for free in Burbank
from 2005-2014, with projections into 2016. The analysis takes into account the lifetime of devices. For
instance, according to the device lifetimes established in the cost-benefit analysis section, showerheads
and aerators have a conservative lifetime of 5 years. Devices that were rebated in 2005-06 therefore
require replacement after 2011. While our estimate of kitchen aerators shows 100% saturation in 2013-
14, the large number of rebates given out in prior years (e.g. a big giveaway in 2009-2010) begin to need
replacement in 2014-15. Note that Burbank has replaced ~90% of city toilets with Ultra Low-Flow toilets
(1.6 gpf) and this analysis only considered High Efficiency Toilets. Overall, significant opportunity
remains to replace high efficiency toilets, followed by high efficiency clothes washers. The relatively
short lifetime of aerators and showerheads, as well as their high cost efficiency, means that replacement
of these devices can still be very effective.

Burbank Sustainable Water Master Plan Page | 35
Table 2. Total number of devices in Burbank SF Homes in FY12-13, based on number of homes as well as full
and half bathrooms (from AWE model inputs).
Single Family Homes in Burbank 18,500
Full bathrooms per household 1.91
Half bathrooms per household 0.4
Average
#/household Total # Devices
Toilets 2.31 42,735
Clothes Washers 1 18,500
Kitchen Aerators 1 18,500
Bathroom Aerators 2.31 42,735
Showerheads 1.91 35,335

Burbank Sustainable Water Master Plan Page | 36
Table 3. Basic saturation analysis. Incorporates the number of efficiency devices replaced every year from
FY05-06 through FY13-14 (with projections for FY14-15 and FY15-16) as well as the lifetime of those devices.
Lifetime
of Device
(yrs)
FY 13-14
#
Replaced
# at end of
lifetime
# still not replaced
% Saturation
High Efficiency Toilets (combined)
20 201 0 40,914 4%
Low Flow Showerheads
(combined) 5 361 1,118 8,288 77%
GHHC Bath Aerators (plus 1/2 of "Residential Aerators"
category) 5 511 2,035 16,645 61%
GHHC Kitchen Aerators (plus 1/2 of "Residential Aerators"
category) 5 413 2,035 0 100%
Clothes Washers (combined) 11 365 0 12,785 31%
FY 14-15 (projected) FY 15-16 (projected)
#
Replaced
# at end of
lifetime
# still not replaced
% Saturation
# Replaced
# at end of
lifetime
# still not replaced
% Saturation
High Efficiency Toilets (combined)
201 0 40,713 5% 201 0 40,512 5%
Low Flow Showerheads (combined)
361 18,357 26,284 26% 361 267 26,190 26%
GHHC Bath Aerators (plus 1/2 of "Residential Aerators"
category) 511 15,671 31,806 26% 511 137 31,432 26%
GHHC Kitchen Aerators (plus 1/2 of "Residential Aerators"
category) 413 15,212 8,278 55% 413 137 8,002 57%
Clothes Washers (combined) 365 0 12,420 33% 365 0 12,055 35%
Significant opportunities remain to increase participation in these programs and to increase water
savings by focusing consumer and agency attention on the devices with the greatest water savings
potential for a given investment.

Burbank Sustainable Water Master Plan Page | 37
OPPORTUNITIES
• Devices with the best ROI/cost-effectiveness (Figure 8)
• Neighborhoods with low adoption rates that could be reached through targeted messaging (see
Visualization of Data: ARC-GIS on page 31)
• Work with local device retailers to educate customers about high efficiency devices and available
rebates.
• Increase accessibility of rebate information on website.
• Advertise Dual rebate eligibility for HECW with a water factor <= 4.
*Calculation for total toilet conversion
(18,500 SF households) * (2.4 people per household) * (5.1 flushes per day) * (0.51 gallons saved
per flush) * (365 days/year) = 42,151,806 gallons = 129 AF

Burbank Sustainable Water Master Plan Page | 38
OUTDOOR WATER SAVINGS
• Lawn conversion, irrigation efficiency improvements, and adjusting irrigation schedules to match
landscape needs and weather conditions all represent opportunities for outdoor water savings.
Outdoor irrigation is the end use of approximately 60% of the water consumed by BWP’s single-family
residential customers. While this is partially linked to the water-intensive nature of traditional turf
landscape maintenance, behavioral factors can significantly increase outdoor demand. Over-irrigation is
widespread and can persist regardless of whether a customer maintains a traditional green lawn or has
chosen to convert to a drought tolerant landscape.43 Thus, an opportunity exists for many of BWP’s
customers to reduce their water bills while maintaining the health of their chosen landscape.
Updates to irrigation system operation offer an opportunity for increasing the efficiency of outdoor
water use. Researchers at the University of California, Riverside, Turfgrass Research Facility, estimated
that up to 66% of water savings from conversion of lawns to xeriscape are attributable to changes in
irrigation alone.44 In addition to wasting water resources, inefficient irrigation systems contribute to
pollution as excess water runs off the landscape.45
Poorly timed and excess irrigation can be corrected using weather and soil moisture-based irrigation
systems. These systems help to reduce overwatering by more closely matching water delivery to need.
Studies have found that the reduction in irrigation due to conversion to soil moisture sensor can have
significant benefits. One study found the reduction in use to be between 28%-92%,46 while another
found a 65% reduction compared to timer-based systems.47 Importantly, these savings did not
compromise the quality of lawns.
Further study of excess irrigation indicated that the most time- and cost-effective way to attain water
savings is through correcting watering schedules.48 Irrigation controllers should be adjusted based on
the water requirements of the landscape, which varies by season. Burbank has an estimated monthly
summer water requirement for turf grass of between 3.7-4.2 gallons per sqft.49 In winter, when
evapotranspiration rates are lower, watering requirements are significantly decreased. Because of this
seasonal variation, time-based irrigation controllers must be reset throughout the year to prevent
overwatering. Conversion to weather or soil moisture-based irrigation systems would eliminate the
need to reset, but for those customers who do not adopt these technologies manual reset is required.
Studies have shown that irrigation reset is not conducted frequently enough to match irrigation delivery
to landscape demand.50 An irrigation reset or reset reminder service could help increase the frequency
with which irrigation meets landscape demand.

Burbank Sustainable Water Master Plan Page | 39
MWD currently offers:
• Rebates for Weather-Based Irrigation Controllers and Soil Moisture Sensor Systems at:
• $80 per controller for less than 1 acre
• $25 per station for more than 1 acre
BWP advertises: • Only the Weather- Based Irrigation Controller rebate.
OPPORTUNITIES:
• Advertise Soil Moisture Sensor Rebates.
• Increase outreach efforts to encourage adoption of weather and soil based irrigation controllers.
• Consider increasing the rebate to support this behavior.
• Encourage irrigation reset through free reset service.
• Encourage irrigation reset through timely reset reminders with bills.
• Remove the one time participation allowance for Green Home House Call outdoor audit service.
• Establish Stage II Water Limits of the Burbank Sustainable Water Use Ordinance as the permanent
baseline to foster long-term water-use efficiency.

Burbank Sustainable Water Master Plan Page | 40
COMMERCIAL, INDUSTRIAL, AND INSTITUTIONAL (CII) WATER EFFICIENCY
• Opportunities remain to expand implementation of established best management practices
among CII water users by improving the visibility of existing programs.
• CII customers use more water per account than other sectors: an inventory and demand
assessment can identify opportunities for significant water savings.
Commercial, industrial, and institutional (CII) water use accounts for approximately 25% of water use in
Burbank.51 Generally, CII encompasses all water users who are not single or multi-family homes. These
range from small businesses, hotels, restaurants, and schools to industrial operations and large
complexes, such as Burbank’s movie studios. In California as a whole, the CII sectors use approximately
2.5 million AF, which accounts for roughly one-third of urban water use.52 Research by the Pacific
Institute estimates that total CII water use in California could be reduced by 40% (about 975,000 AF)
through investments in CII water efficiency measures and use of reclaimed water.53
CII water efficiency improvements can be classified into three broad categories. First, most facilities
contain toilets, urinals, faucets, cooling systems, and sometimes showers and landscaping. Each of
these devices has the potential to save water for local businesses and Burbank as a community. Second,
there are several devices that apply to subset of facilities. These devices include dishwashers and pre-
rinse spray valves for restaurants or clothes washers for hotels and other businesses. Third, efficiency
improvements can be made with process water, which is all water uses that are unique to a particular
industry for producing a service or product. This includes water used for rinse cycles, disinfection,
chemical dilution, heater boilers, and more.
Numerous resources exist to identify specific products and best management practices for all types of
businesses. The California Department of Water Resources (DWR) California Urban Water Conservation
Council (CUWCC) released a CII Task Force Report54 in 2013 which outlines hundreds of pages of best
management practices for specific industries. While the research is well-established and the methods
for saving water are clear, there is significant remaining opportunity to expand implementation of these
practices.
BARRIERS
The Natural Resources Defense Council (NRDC)55 identifies a number of barriers to wider
implementation of CII water efficiency:

Burbank Sustainable Water Master Plan Page | 41
• Lack of data for water use
• CII sectors lack the technical assistance and shortage of trained staff to implement water efficient
upgrades
• Water is priced low and doesn’t incentivize investment in water efficient upgrades.
• Businesses have very short expectations for a return on investment, while utilities usually plan in the
longer term.
City West Water (Melbourne, Australia)56 dealt with many of the above challenges to target CII
customers and save over a billion gallons:
• Provide high-level advice by expert staff and working with plumbers who are likely to be trusted by
business owners
• Since water is relatively cheap, tailor rebates and grants with ease of access in mind
• “Pick winners”, work with targeted customers rather than open application
• Key to success: develop relationships with CII customers
OPPORTUNITIES FOR CII
• Revise Burbank’s “Save Water, Save a Buck” website to (1) feature rebates offered by SoCal
Water$mart’s commercial program in addition to toilets, (2) mention the water-saving aspects of
Business Bucks inspections, and (3) make the page more accessible from the homepage and other
rebate or program pages.
• Provide CII customers information about MWD’s SoCal Water$mart for Commercial Customers
Program (which has standard rebates for general and specific businesses) and Be Water Wise Water
Savings Incentive Program (where MWD will rebate $0.60/1000 gal ($195/AF) for customized
efficiency improvements).
• Conduct a CII customer inventory and demand assessment to identify and assist water wasters,
see Appendix E for information on the MWD and Tampa Bay Water studies which provide methods
and strategies for CII water use analysis.
Burbank Sustainable Water Master Plan Page | 42
RATE STRUCTURES
• Efficiency-oriented rate structures reinforce the message sent by water efficiency programs and
communicate the true cost of water to customers.
• Water budgets and steep pricing tiers are both widely-implemented and effective among
California water agencies.
Water rate structures play an important role in communicating the value of water to ratepayers and
incentivizing efficient water use. When implemented in conjunction with other water efficiency
programs, efficiency-oriented rate structures reinforce a utility’s commitment to water efficiency and
maximize the savings realized by these programs. Efficiency-oriented rate structures are vital to
maximizing the total quantity of water conserved: without them, it may be difficult for Burbank to
achieve its water efficiency potential.
Water rate structures are critical to communicating the true cost of water to customers. Due to climate
change, population growth, and groundwater overdraft Burbank’s water supply is likely to grow
increasingly expensive and uncertain over the coming decades. Conservation rate structures would
allow BWP to eliminate ambiguity in how different levels of residential water consumption are tied to
the costs of acquiring this water. A well-designed conservation rate structure sends a clear signal to
customers that it is costly to support high levels of residential water use.57
Water conservation is Burbank’s cheapest, most reliable source of water.58 Although traditional
efficiency programs provide considerable water savings, efficiency-oriented rates represent a significant
opportunity for additional water savings. Rate structures provide a strong financial incentive for
customers to make behavioral changes and implement the efficiency strategies that BWP supports.59
With these rate structures in place the costs of high water use and the benefits of efficient water use are
translated more directly to customers, which magnifies the benefits of water efficiency programs.60
Conventional wisdom in municipal water management suggests that residential water demand does not
respond to price signals.61 That is, residential water demand is relatively inelastic and customers do not
reduce their water use in response to rate increases. Recent research and case studies suggest
otherwise. Although residential water price sensitivity varies by income -- high-income households are
not as price-sensitive as low-income households62 -- consumers still respond to price signals.63 In fact,
there is strong evidence that reducing water demand through pricing is more cost-effective than
through traditional conservation programs,64 and customers respond much more to water price signals
than to rebate or education programs.65 Empirical evidence supports the position that customers do
Burbank Sustainable Water Master Plan Page | 43
indeed respond to conservation-oriented water pricing -- for further information, refer to the case
studies at the end of this section.
Water utilities throughout the United States are increasingly recognizing the benefits of implementing
conservation-oriented rate structures. Since effective efficiency-oriented rate structures vary widely
based on local conditions and requirements, this section will focus on reviewing and providing case
studies for several basic options that are commonly implemented in Southern California.
RATE STRUCTURE TYPES
INCREASING BLOCK RATE/TIERED RATE
Under Increasing Block Rates (IBR), also called Tiered Rates, the price of water depends on how much
water a customer consumes: customers are charged higher marginal rates for higher quantities of water
consumption. The quantity of water use associated with each tier as well as the difference in price
(“steepness”) between each tier can vary. In this way, the price reflects the demands that customers
place on the water supply system. Well-designed tiered systems have several features in common:66
6. They provide water for essential needs at low prices. This allows all customers to afford basic water
use, and rewards customers that conserve water.
7. They have large price differences between tiers. Steep tiers send a strong conservation price signal
to customers.
8. They have low fixed costs. High fixed costs effectively reduce the relative difference between tiers,
dampening the conservation signal. Customers response to the price signal associated with their
overall water bill. With high fixed costs, individual customers that change their water use don’t see
their overall bill change much in response. With low fixed costs, changes in water consumption
translate to relatively larger changes to a customer’s total water bill. Although fixed costs are
certainly necessary to maintain revenue stability and neutrality, they should be minimized in order
to allow for a stronger conservation pricing signal.
WATER BUDGETS-BASED RATES
Water budget-based rates systems create rate tiers based on individual householder characteristics such
as number of residents in the household, parcel size, house size, irrigable area, and landscape type. If
customers use more water than allocated in their budget, or first tier, their rate increases. With water
budget-based rates, the focus is on designing effective budget sizes rather than designing effective rate
tiers. The design of water budgets vary widely depending on local constraints and water efficiency
priorities. While successful water budget-based rate structures have less in common than do other types
of rate structures, there are several features that successful water budget-based rate systems share:67
1. Clearly communicated water budgets and associated pricing.
2. Budgets that are perceived as fair, well-justified, and equitable.

Burbank Sustainable Water Master Plan Page | 44
3. Pricing between tiers must reflect the cost of service and not be set a level just to send a price signal
to customers.
4. Covering O&M costs in lower tiers in order to ensure revenue stability and fixed cost recovery.
In the past, utilities have been hesitant to implement water budgets due to concerns about whether
water budgets meet cost of service requirements of these rates.68 However, AB 2882 (2009) has cleared
the way for legal water budget implementation as long as the rates charged for each tier are aligned
with the costs associated with that level of water usage. There has been rapidly increasing interest in
water budgets in California over the last several years and at least 25 utilities in California now use a
budget-based rate system.69 Water budgets have the additional benefit of being perceived as the most
fair water rate system.70
SEASONAL
Seasonal water rates vary based on time of year, typically with higher rates during the high-demand
summer months and lower rates during the relatively low-demand shoulder seasons and winter months.
Additional seasonal differentiations are also possible, and seasonal adjustments can be added to most
existing rate structures. Seasonal rates clearly communicate the costs of purchasing additional water on
the margin during high water demand months. Seasonal rates are most effective under the following
conditions:71
1. When water demand varies significantly by season.
2. When seasonal water demand imposes additional costs on the utility. For example, most additional
summer water demand in Burbank is met by purchasing expensive imported water.
3. When major supply sources are only available seasonally.
RATE STRUCTURES CONCLUSION
Under its current rate structure, BWP faces the challenges of declining water consumption and revenue
gaps, revenue instability, limited customer incentive to conserve water, and a disconnect between
actual water cost and water bills. Alternative rate structures have the potential to magnify the benefits
of existing water efficiency programs, and enhance customer understanding of the true cost of water.
The AWE Sales Forecasting and Rate Model can help BWP make an informed decision by enabling
quantitative evaluation of water rate alternatives on the basis of variables such as water demand
effects, water revenue effects, and impacts on customer bills.
Burbank Sustainable Water Master Plan Page | 45
PART 8: WATER SUPPLY
OVERVIEW OF CURRENT SOURCES OF SUPPLY
• BWP has the physical and technical capability to meet all demand with locally sourced water.
• Increasing the amount of recycled water that is put to beneficial use and increasing the
groundwater pumping rate at the Burbank Operable Unit (BOU) yield the greatest opportunities
for BWP to enhance the utilization of local supplies.
• Low concentrations of nitrate and chromium in BOU groundwater (with respect to historical
values) satisfy the regulatory requirement to blend local water with pre-treated imports.
Municipal water provided by BWP has three sources: imported supplies, locally produced recycled
water, and groundwater. The past decade has seen a general trend of increased usage of groundwater
and recycled water and decreased use of imported supplies (Figure 12). BWP plans to continue this
trend by increasing recycled usage to 13% of total water deliveries in the 2014/2015 fiscal year.72
IMPORTED WATER
The Metropolitan Water District (MWD) provides BWP with both potable and nonpotable imported
supplies via the State Water Project (SWP) and Colorado River Aqueduct (CRA).73 In addition to water
that has been pre-treated to meet potable standards, BWP has the option to purchase untreated “raw”
water that is delivered approximately nine miles northwest of the city center to the Pacoima spreading
grounds where it is used for aquifer recharge.74
RECYCLED WATER
Recycled water produced at the Burbank Water Reclamation Plant (BWRP) undergoes tertiary treatment
and is designated exclusively for non-potable use. It is distributed through separate non-potable
infrastructure known as the purple pipe system,75 and sold at a reduced flat rate per HCF.76 Recycled
water is exclusively available for commercial and industrial customers located adjacent to the purple
pipes.77 Although 100% of the water that discharges from the BWRP meets recycled quality standards,78
consumer demand over the past decade has been satisfied by approximately 19% of the available
supplies.

Burbank Sustainable Water Master Plan Page | 46
Figure 12. BWP total quantity of water supplies from 2004-2014 (black dashed line) as well as individual
sources that make up the total (groundwater, recycled water, and imported supplies). Note that total
production includes potable and non-potable supplies. Recycled water and groundwater are considered local
sources of supply.
GROUNDWATER
BWP’s groundwater is extracted from the underlying San Fernando Basin (SFB) by the pump and treat
system located at the Burbank Operable Unit (BOU). The BOU is capable of treating water at a rate of
9,000 GPM and has operated at an average of 66% of its maximum capacity over the past decade. BWP
also owns a second groundwater pumping facility known as the Lake Street GAC Treatment Plant (GAC)
that has not been used to produce potable supplies since 2001. The GAC was taken offline due to its lack
of ability to blend groundwater with imported supplies to reduce Chromium VI concentrations below
the city council imposed MCL of 5 ppb.79 Since that time, Burbank has chosen to adhere to the newly
instated California EPA MCL of 10 ppb for drinking water.
Water pumped at the BOU undergoes a multi-step treatment process prior to being distributed for
potable use. In accordance with a 1991 EPA consent decree,80 groundwater is first sent through air
stripping towers in order to remove volatile organic compounds (VOCs). Next, the water undergoes
additional filtration for organic material and then disinfection before being blended with pre-treated
MWD water.81

Burbank Sustainable Water Master Plan Page | 47
When the SFB was adjudicated in 1979, the City of Los Angeles was granted exclusive ownership of its groundwater. However, the same decision guarantees BWP the right to extract SFB groundwater under the following guidelines:82
• Physical Solution
BWP is guaranteed the right to purchase up to 4,200 acre-feet per year of SFB water from the City of
Los Angeles. The fee for this extraction right is the “physical solution” price that varies over time
based on rules set within the adjudication.
• Import Return Credits
In a given year, BWP is entitled to extract an amount equal to 20% of the quantity of total water
deliveries in the previous water year. In addition, BWP is entitled to extract an amount equal to
100% of the raw MET water that is sent to the Pacoima spreading grounds.
• Stored Water Credits
Import return credits that are not used within the water year are allowed to accrue without
expiration as “stored water credits”. If these credits were extracted in full by all entitled parties, the
SFB would be placed in a state of severe overdraft . In order to prevent this, a 10-year stipulated
agreement between all parties was devised in 2007 to further subdivide stored credits into the
following:83
• Available Credits: can be extracted at any time without restriction. As of October 2012, BWP
owned 4,442 acre-feet of available credits.
• Reserved Credits: are not supported by existing water and thus cannot be extracted until
SFB health is restored to a 1968 threshold set by the Water Master. As of October 2012,
BWP owned 7,863 acre-feet of reserved credits.
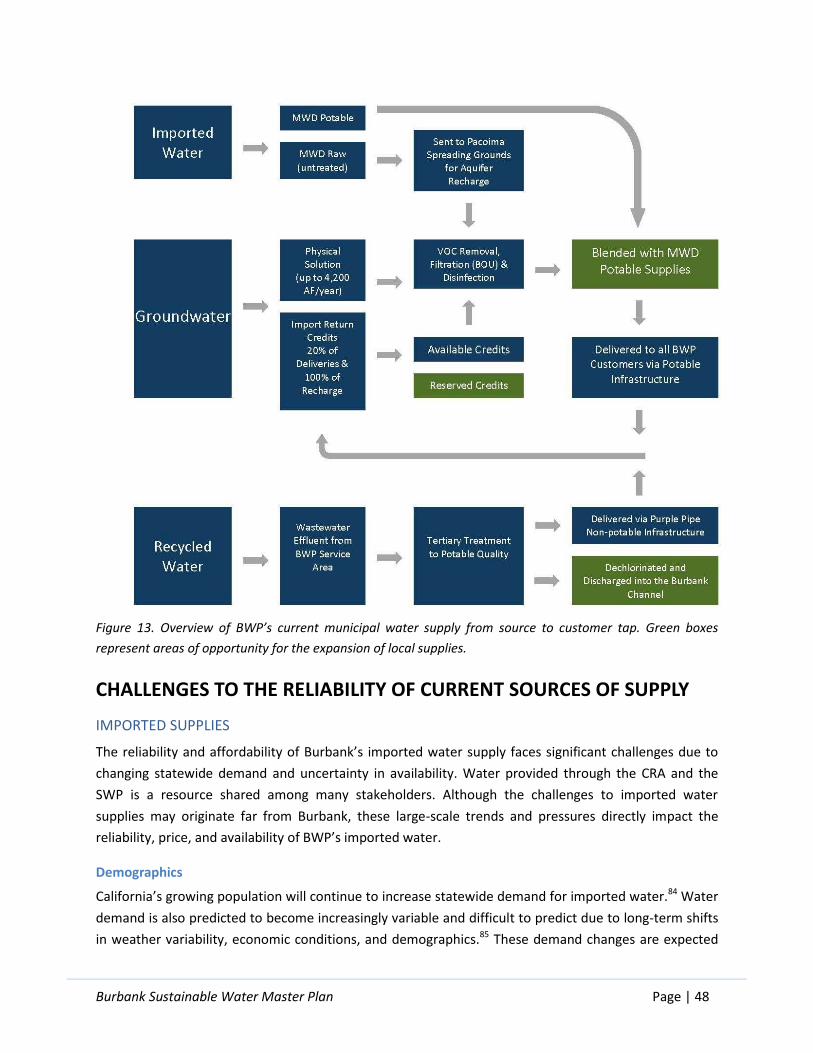
Burbank Sustainable Water Master Plan Page | 48
Figure 13. Overview of BWP’s current municipal water supply from source to customer tap. Green boxes
represent areas of opportunity for the expansion of local supplies.
CHALLENGES TO THE RELIABILITY OF CURRENT SOURCES OF SUPPLY
IMPORTED SUPPLIES
The reliability and affordability of Burbank’s imported water supply faces significant challenges due to
changing statewide demand and uncertainty in availability. Water provided through the CRA and the
SWP is a resource shared among many stakeholders. Although the challenges to imported water
supplies may originate far from Burbank, these large-scale trends and pressures directly impact the
reliability, price, and availability of BWP’s imported water.
Demographics
California’s growing population will continue to increase statewide demand for imported water.84 Water
demand is also predicted to become increasingly variable and difficult to predict due to long-term shifts
in weather variability, economic conditions, and demographics.85 These demand changes are expected
Burbank Sustainable Water Master Plan Page | 49
to increase prices for imported water86 and make it increasingly difficult to project water pricing and
availability.87
Colorado River Aqueduct
Recent reductions in the availability of CRA imports have led to significant price spikes88 which have led
to concerns about its future affordability and reliability. Due to ongoing drought in recent years, very
little to no surplus above California's basic 4.4 million acre-feet (AF) per year allotment has been
available from the CRA.89 Increased claims on the Colorado River mean that even during wet years BWP
should not rely on accessing surplus water.90
State Water Project
The Bay Delta which is the source of SWP supplies also faces a number of challenges that may limit the
quantity of water that flows to Southern California. Diminished Sierra Nevada snowpack, increased
pumping restrictions, increased salinity due to sea level rise and increased environmental flows all stand
to reduce the quantity of SWP water available to Southern California residents.91
These large-scale challenges to BWP’s imported water sources jeopardize supply reliability and price
stability. By replacing imports with more reliable local sources, imported water can improve the
reliability of Burbank’s water supply and enhance Burbank’s ability to meet future water demand.
LOCAL SUPPLIES
BWP has responded to the recent scarcity and associated rising prices for imported water by expanding
the utilization of local sources (Figure 12). While following this strategy is BWP’s greatest opportunity to
increase supply reliability, several challenges must be mitigated in order to ensure its long-term viability.
Groundwater
Historical overdraft of the SFB has diminished groundwater levels (Figure 22 in Appendix F) to the point
where 64% of BWP’s stored water credits have been designated as “reserve credits”. This means that
they exist in title only, and cannot be accessed until aquifer levels are restored to the safe yield bounds
set by the water master. The SFB level is currently below this benchmark and has been there for the
majority of time since pumping restrictions were first implemented in 1968.92
BWP’s 7,863 AF of reserved credits are equivalent to approximately 4 months of total demand, and thus
do not have a significant impact on considerations of long-term sustainability. However, the reserved
credit system does prevent BWP from accessing 64% of all future import return credits that are not
utilized during their water-year of issue. Addressing the diminished groundwater levels of the SFB is an
essential first step towards increasing its utilization as a source of supply and as a long-term storage
reservoir.
Recycled Water
Due to its non-potable designation, recycled water must be distributed via infrastructure (purple pipes)
that is isolated from the further-reaching potable supply infrastructure. The production rate of recycled

Burbank Sustainable Water Master Plan Page | 50
water is determined by the amount of wastewater that enters the BWRP. This rate is not impacted by
distribution limitations and regulatory use restrictions. As a result, BWP’s recycled water supply greatly
exceeds demand (Figure 16). With no way to sell or store excess supplies, BWP currently discharges the
majority of its recycled supplies into the Burbank Channel.
While taking steps to increase local non-potable demand would directly mitigate the issue of excess
supply, certain aspects of this strategy are problematic. Encouraging current and potential recycled
water users to increase their consumptive practices sends a confusing message in a time when the
majority of outreach messaging is focused on the importance of efficiency. In addition, further
expanding the purple pipe system to increase demand by giving access to more customers would be
costly; in order to fully utilize the available quantity of non-potable supplies, an infeasible degree of
expansion would have to be carried out .
Water Quality
BWP takes several steps to ensure that potable supplies meet or exceed all state and federal drinking
water quality standards. However, elevated levels of VOCs and the historical presence of nitrate and
chromium in concentrations above MCLs complicate BWP’s groundwater access. Following contaminant
removal and disinfection, extracted groundwater is blended with pre-treated MWD water. This step is
carried out in order to reduce nitrate and chromium (total and VI) concentrations and comply with a
CDPH operating permit.93 Over the past decade BWP has used an average blend of 48% BOU water and
52% imports for its potable supply (see Appendix F for tables of values). As displayed in Figure 14 and
Figure 15, nitrate and chromium VI levels in pre-blended BOU water have consistently been below the
current applicable maximum contaminant levels (MCL) for the past decade.

Burbank Sustainable Water Master Plan Page | 51
Figure 14. Concentrations of nitrate in groundwater and imported water pre-blending, and levels in potable
supplies post-blending. All water quality data sourced from BWP annual water quality reports. The most
restrictive MCL is imposed by the state of California at 10 parts per million.
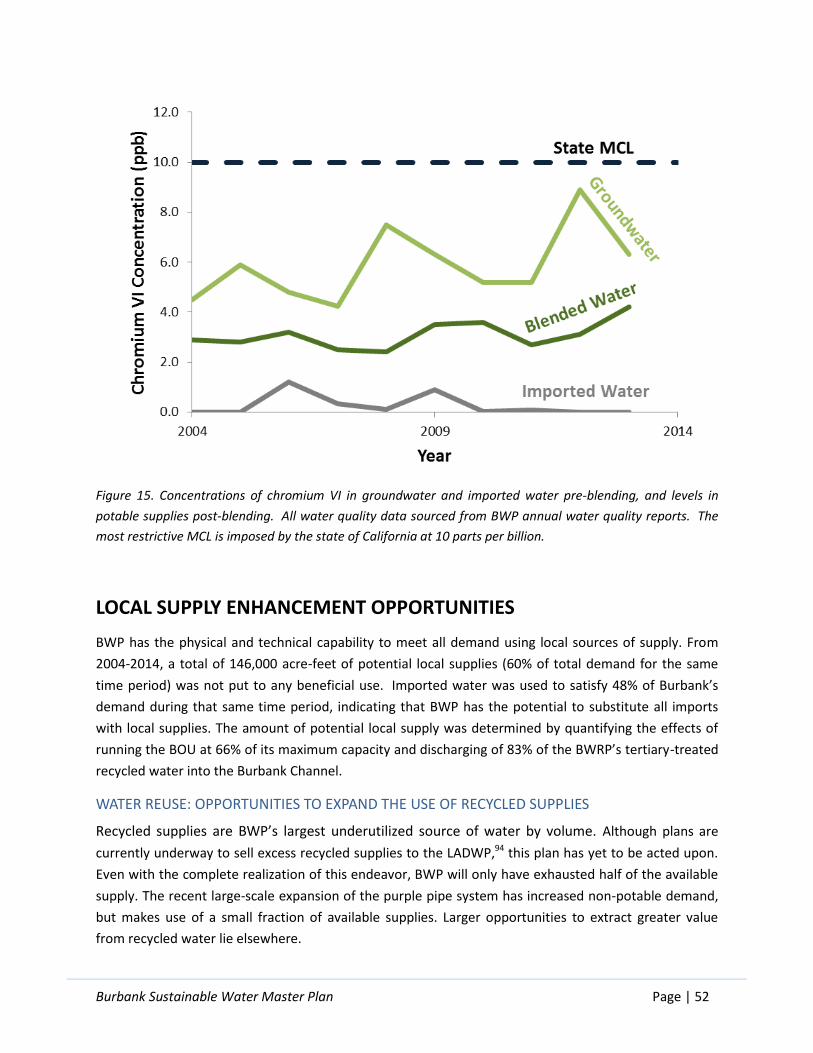
Burbank Sustainable Water Master Plan Page | 52
Figure 15. Concentrations of chromium VI in groundwater and imported water pre-blending, and levels in
potable supplies post-blending. All water quality data sourced from BWP annual water quality reports. The
most restrictive MCL is imposed by the state of California at 10 parts per billion.
LOCAL SUPPLY ENHANCEMENT OPPORTUNITIES
BWP has the physical and technical capability to meet all demand using local sources of supply. From
2004-2014, a total of 146,000 acre-feet of potential local supplies (60% of total demand for the same
time period) was not put to any beneficial use. Imported water was used to satisfy 48% of Burbank’s
demand during that same time period, indicating that BWP has the potential to substitute all imports
with local supplies. The amount of potential local supply was determined by quantifying the effects of
running the BOU at 66% of its maximum capacity and discharging of 83% of the BWRP’s tertiary-treated
recycled water into the Burbank Channel.
WATER REUSE: OPPORTUNITIES TO EXPAND THE USE OF RECYCLED SUPPLIES
Recycled supplies are BWP’s largest underutilized source of water by volume. Although plans are
currently underway to sell excess recycled supplies to the LADWP,94 this plan has yet to be acted upon.
Even with the complete realization of this endeavor, BWP will only have exhausted half of the available
supply. The recent large-scale expansion of the purple pipe system has increased non-potable demand,
but makes use of a small fraction of available supplies. Larger opportunities to extract greater value
from recycled water lie elsewhere.
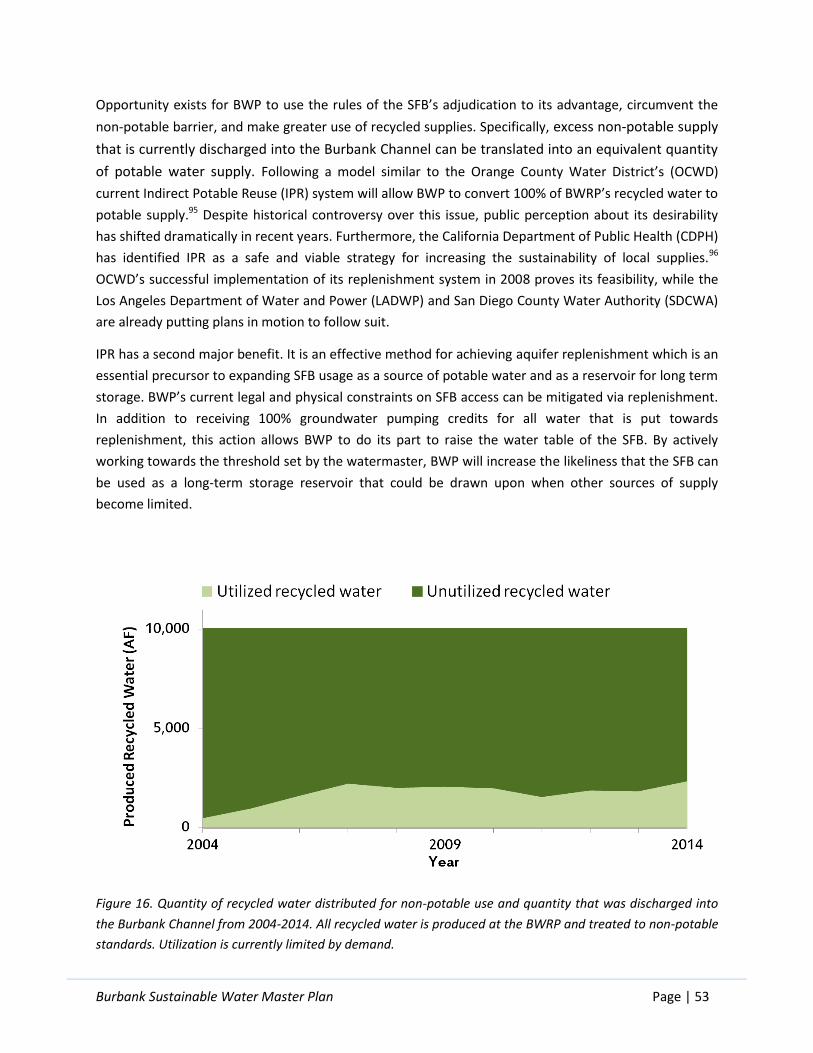
Burbank Sustainable Water Master Plan Page | 53
Opportunity exists for BWP to use the rules of the SFB’s adjudication to its advantage, circumvent the
non-potable barrier, and make greater use of recycled supplies. Specifically, excess non-potable supply
that is currently discharged into the Burbank Channel can be translated into an equivalent quantity
of potable water supply. Following a model similar to the Orange County Water District’s (OCWD)
current Indirect Potable Reuse (IPR) system will allow BWP to convert 100% of BWRP’s recycled water to
potable supply.95 Despite historical controversy over this issue, public perception about its desirability
has shifted dramatically in recent years. Furthermore, the California Department of Public Health (CDPH)
has identified IPR as a safe and viable strategy for increasing the sustainability of local supplies.96
OCWD’s successful implementation of its replenishment system in 2008 proves its feasibility, while the
Los Angeles Department of Water and Power (LADWP) and San Diego County Water Authority (SDCWA)
are already putting plans in motion to follow suit.
IPR has a second major benefit. It is an effective method for achieving aquifer replenishment which is an
essential precursor to expanding SFB usage as a source of potable water and as a reservoir for long term
storage. BWP’s current legal and physical constraints on SFB access can be mitigated via replenishment.
In addition to receiving 100% groundwater pumping credits for all water that is put towards
replenishment, this action allows BWP to do its part to raise the water table of the SFB. By actively
working towards the threshold set by the watermaster, BWP will increase the likeliness that the SFB can
be used as a long-term storage reservoir that could be drawn upon when other sources of supply
become limited.
Figure 16. Quantity of recycled water distributed for non-potable use and quantity that was discharged into
the Burbank Channel from 2004-2014. All recycled water is produced at the BWRP and treated to non-potable
standards. Utilization is currently limited by demand.
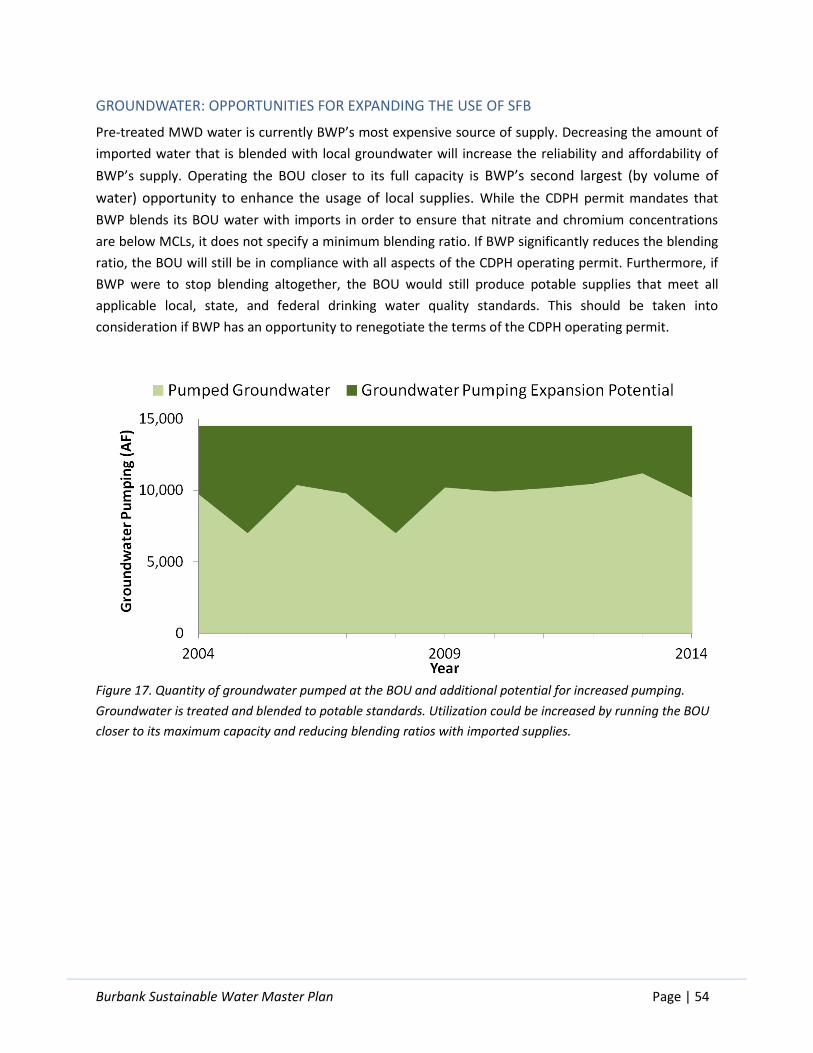
Burbank Sustainable Water Master Plan Page | 54
GROUNDWATER: OPPORTUNITIES FOR EXPANDING THE USE OF SFB
Pre-treated MWD water is currently BWP’s most expensive source of supply. Decreasing the amount of
imported water that is blended with local groundwater will increase the reliability and affordability of
BWP’s supply. Operating the BOU closer to its full capacity is BWP’s second largest (by volume of
water) opportunity to enhance the usage of local supplies. While the CDPH permit mandates that
BWP blends its BOU water with imports in order to ensure that nitrate and chromium concentrations
are below MCLs, it does not specify a minimum blending ratio. If BWP significantly reduces the blending
ratio, the BOU will still be in compliance with all aspects of the CDPH operating permit. Furthermore, if
BWP were to stop blending altogether, the BOU would still produce potable supplies that meet all
applicable local, state, and federal drinking water quality standards. This should be taken into
consideration if BWP has an opportunity to renegotiate the terms of the CDPH operating permit.
Figure 17. Quantity of groundwater pumped at the BOU and additional potential for increased pumping.
Groundwater is treated and blended to potable standards. Utilization could be increased by running the BOU
closer to its maximum capacity and reducing blending ratios with imported supplies.
Burbank Sustainable Water Master Plan Page | 55
PART 9: ADDITIONAL SUPPLY ENHANCEMENT OPPORTUNITIES
STORMWATER CAPTURE/LOW IMPACT DEVELOPMENT
• Small-scale stormwater capture and Low Impact Development projects can improve local
groundwater health, improve local water supply reliability, and reduce pollutant loads to local
waterways.
• Capturing ¾” of each storm event could nearly triple annual infiltration into the San Fernando
Aquifer.
The potential to use rainwater that falls on cities as a local source of supply has often been overlooked.
In the past, stormwater management efforts were focused on moving water out of urban areas as a
flood control measure. However, mounting pressure to diversify sources of urban water supplies has
shifted the ideal methods of stormwater management to those that reduce flooding via increased
infiltration and local aquifer replenishment. Capturing rainwater in this way yields the additional benefit
of alleviating reliance on increasingly expensive imported water by increasing local supplies and
decreasing pollutant loads to the Los Angeles River. Increasing storm water capture can be
accomplished through large-scale infiltration projects, but significant gains can also be made by
installing many smaller-scale rainwater capture systems.
Low Impact Development (LID) describes an approach to land use planning that prioritizes local capture
and storage of stormwater. BWP has implemented a demonstration of the three main LID approaches
throughout their Eco-Campus including bioretention structures, green roofs, and permeable pavements.
Studies have show that in the United States, LID has led to greater local infiltration rates of storm water
as well as decreasing the transport of pollutants such as Lead, Zinc, Copper, and with slightly more
complication, nitrogen and phosphorus.97 While it is hard for BWP to justify the spending on LID due to

Burbank Sustainable Water Master Plan Page | 56
their lack of groundwater rights, capturing rainfall will help increase regional aquifer health as well as
increase local water supply reliability.
The Groundwater Augmentation Model, created by the U.S. Department of the Interior, Bureau of
Reclamation, and the Los Angeles and San Gabriel Rivers Watershed Council, clearly shows that
rainwater capture is an underutilized resource that could increase recharge into the aquifer by well over
100%. Every year around 15” of rain falls on the Greater Los Angeles area, which equates to 1,214,025
acre-feet of water,98 that generally flows to the ocean every year. It has been modeled that 16% of this
water currently percolates past the zone where plants can evaporate it and 48% of this water becomes
runoff.99 If the Standard Urban Stormwater Management Plan (SUSMP) requirement of capturing ¾” of
every rainfall event was applied to every parcel and every land type in the Greater Los Angeles area,
there is a modeled maximum gain of 578,000 acre feet per year.100 In the San Fernando Basin the
current infiltration is 45,500 acre-feet per year and it could be increased, under the same conditions, to
123,000 acre-feet per year.101
The Greater Los Angeles area has recognized the need for and the multi-benefits of capturing rainfall.
Los Angeles Water and Power is starting to lead this development with developing a Stormwater
Capture Master Plan with the goal of increasing stormwater capture to 170,000-280,000 acre feet by the
end of the century. Capturing rainfall can help alleviate the reliance on expensive imported water,
increase compliance with pollutant loads for the Los Angeles River, and it helps fit the mission of
restoring some of the Los Angeles River’s natural attributes.102
OPPORTUNITIES FOR STORMWATER CAPTURE/LOW IMPACT
DEVELOPMENT
• Update the Stormwater Management Plan to increase the amount of properties that are required to
infiltrate the first ¾” of a rainstorm.
• Expand upon BWP’s pilot project and institute stormwater capture around the city
Burbank Sustainable Water Master Plan Page | 57
GRAYWATER
• Residential “laundry to landscape” graywater programs are relatively simple to install, require no
permit, and result in significant water savings if installed and operated properly.
• Graywater programs are rapidly growing in popularity throughout the west, and customers are
interested in learning about graywater opportunities.
Graywater (also spelled “greywater”) is untreated wastewater that can include but is not limited to
water coming from clothes washing machines, bathtubs, showers, and bathroom sinks. It does not
include any toilet wastewater and usually does not include kitchen sinks or dishwashers.103 A graywater
system takes water from one or more of these sources for a variety of possible uses, primarily diversion
outdoors for irrigation. Graywater reuse can reduce the need for use of potable water in nonpotable
applications such as outdoor watering or landscaping. In doing so, it also reduces the stream of
wastewater going into private and public sewage systems. Reduction of potable water demand and
sewage outflow saves money, energy, and greenhouse gas emissions.104
In 2010, the California Department of Housing and Community Development (HCD) added a chapter to
the 2007 California Plumbing Code about Nonpotable Water Reuse Systems that simplified the process
of legally installing residential graywater systems in California.105 The most notable update to the code
was an exemption of permitting for a graywater system that utilizes water from clothes washers only.
No permit is required for this type of system as long as no existing plumbing is cut, graywater is
discharged immediately outdoors under 2 inches of mulch, rock, or soil cover, and a few other
requirements.106 The plumbing code allows local governments to set stricter requirements for
graywater systems if they choose to do so.
“Laundry to landscape” rebate programs for simple permitless graywater systems have become popular
in Northern California. Greywater Action, a Bay Area nonprofit, conducted a study107 of 83 graywater
systems (65% were laundry-to-landscape) for water savings, water quality, and soil and plant tests. The
study found an average 17 GPCD savings or 14,565 gallons/yr, with higher savings in the spring/summer
than fall/winter. Laundry-to-landscape systems were found to cost an average $750 (ranging $350-
$2000) with paid labor installation or $250 for do-it-yourself (ranging $100-$500).
Typical programs offer workshops about how to install a simple graywater system and then provide
either a subsidized installation kit or a flat rate rebate. We interviewed representatives from San
Francisco Public Utilities Commission, Santa Clara Valley Water District, City of Santa Rosa, City of Santa
Cruz, City of Long Beach, City of Santa Monica, Central Coast Greywater Alliance, and Greywater Action

Burbank Sustainable Water Master Plan Page | 58
(a graywater education group). Key highlights from the interviews are summarized here, with full
information on program rebates, workshop offerings, participation, effectiveness, and other notes for
success in Appendix G.
• Californians are interested in graywater and want to learn how to install simple systems. Offering
a rebate program with associated workshops is an opportunity to engage customers to educate
them about graywater and other water efficiency programs.
• There is a lack of high resolution data on water savings for laundry-to-landscape systems that are
rebated by utilities/cities. While San Francisco does look at water usage after customers install
graywater systems, their meter data is in discrete units of HCF which makes detailed analysis
difficult. Some customers use graywater for new irrigated areas which ends up increasing water
use. Long Beach (which meters the same as San Francisco) found variation in water savings/water
use increases. (See Appendix G for more information)
• None of the interviewed agencies have had any issues with health or building departments.
OPPORTUNITIES FOR GRAYWATER
As an already progressive water utility, BWP is poised to lead the way in developing successful
graywater programs for Southern California. These types of programs have already taken off in
Northern California, which would allow BWP to optimize its own program based on the experiences of
other utilities. However, there have been barriers to successful implementation for two cities in
Southern California in recent years (see details in Appendix G).
Opportunities:
• Survey Burbank single-family homes to gauge interest in education and rebates for do-it-yourself
(DIY) permitless, graywater systems
• Develop a pilot program to provide 30-50 laundry-to-landscape systems free to users in Burbank.
• Run workshops to assist users in installing their system.
• Use the smart-meter network to study water savings for a year following graywater installation.
• Work with local graywater experts (either individual contractors or nonprofit organizations) to
ensure customer education and system installation is optimal, using lessons learned from other pilot
projects or programs in California.
• At minimum, provide detailed information and resources on the BWP website about graywater and
the requirements for installation of permitless systems in Burbank homes. See LADWP Residential
Graywater webpage for an example of a utility that does not currently provide rebates (as of May
2015), but does provide information and resources.
Burbank Sustainable Water Master Plan Page | 59
RAINWATER HARVESTING
• Rain barrels in Burbank must be able to store a large volume of water in order to provide a
significant or consistent supply during the dry summer months.
• Rain barrel effectiveness increases with size, with the largest rain barrels (cisterns of 500+ gallons)
providing the greatest water saving benefits.
Rainwater harvesting is usually cited as a method for (1) supplying an alternative source of water and (2)
a low impact development option for reducing stormwater volume and pollutant loads.108 Burbank
currently offers rebates for rain barrels through MWD’s SoCal Water$mart program at $75 per barrel for
up to four rain barrels of minimum 50 gallons. Typical rain barrel guides, such as CUWCC’s h2ouse.org,
cite the potential for collecting about 934 gallons of water from a 1,500 square foot roof during a 1-inch
storm. Given an annual average rainfall of 17.5 inches in Burbank,109 this initially appears as an
opportunity to provide sizeable source of free, local water supply for homes and businesses (16,345
gallons/year supplied from a 1,500 sq ft roof).
However, rainwater harvesting systems in Southern California are storage-constrained: there are
practical limitations to rainwater reuse because the majority of rainfall occurs in the winter while the
majority of outdoor water demand is in the summer.110 Rain barrels need to be able to hold a large
volume of water during winter in order to provide a consistent supply through the dry summer. Rain
barrels are typically 50-100 gallons in size, while cisterns are usually categorized as 300+,111 500+,112 or
1000+113 gallons (although smaller rain barrels are occasionally referred to as “cisterns”).
We interviewed representatives from City of Santa Monica, Foothill Municipal Water District, City of San
Diego, and City of Santa Cruz about their rain barrel programs , as well as Hey!TanksLA (an LA County
rainwater harvesting contractor). Almost every city and the contractor pointed out that rain barrels are
not necessarily the most cost-efficient water-saving strategy, but they do have significant non-water
benefits such as providing an opportunity to interact with and connect homeowners with other
efficiency programs, as well as helping homeowners be more conscientious of water use and the value
of water. Full information from the case study interviews can be found in Appendix G.
RAIN BARREL/CISTERN MODEL
A common misunderstanding about rain barrels are how much water they can realistically capture and
provide for beneficial use (offsetting potable water demand). We constructed a simple spreadsheet-
based model that simulates a rain barrel or cistern filling and emptying over 64 years of historic daily
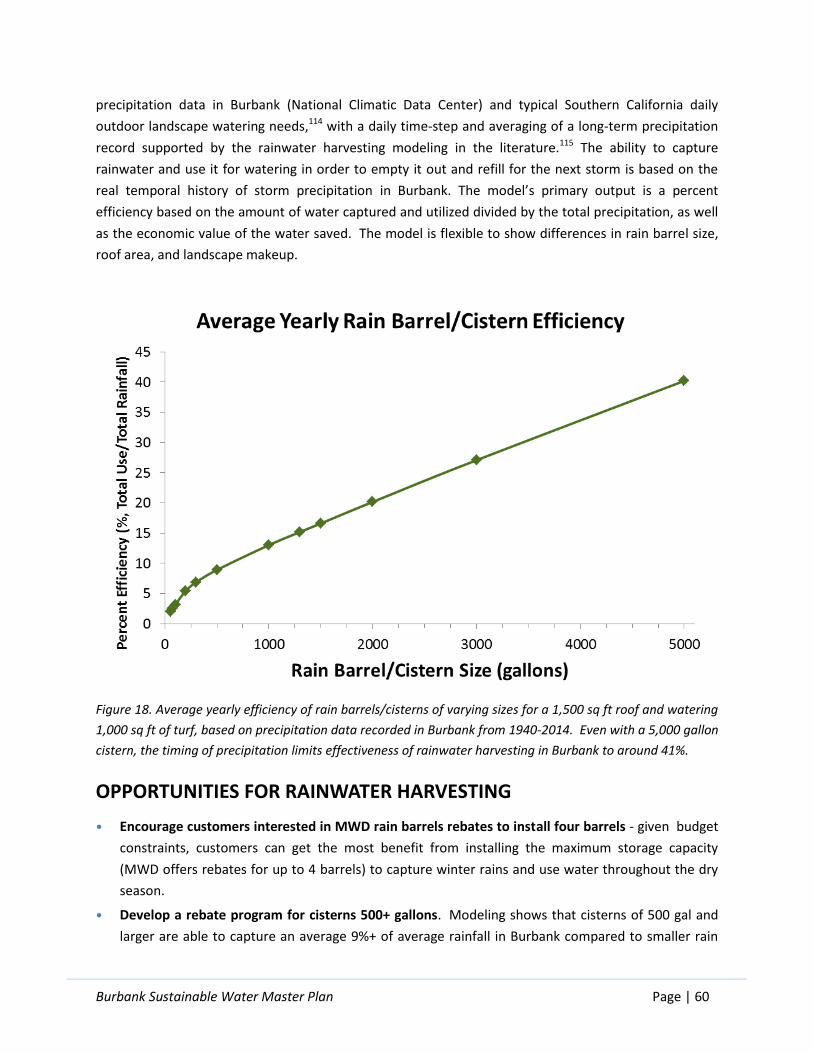
Burbank Sustainable Water Master Plan Page | 60
precipitation data in Burbank (National Climatic Data Center) and typical Southern California daily
outdoor landscape watering needs,114 with a daily time-step and averaging of a long-term precipitation
record supported by the rainwater harvesting modeling in the literature.115 The ability to capture
rainwater and use it for watering in order to empty it out and refill for the next storm is based on the
real temporal history of storm precipitation in Burbank. The model’s primary output is a percent
efficiency based on the amount of water captured and utilized divided by the total precipitation, as well
as the economic value of the water saved. The model is flexible to show differences in rain barrel size,
roof area, and landscape makeup.
Figure 18. Average yearly efficiency of rain barrels/cisterns of varying sizes for a 1,500 sq ft roof and watering
1,000 sq ft of turf, based on precipitation data recorded in Burbank from 1940-2014. Even with a 5,000 gallon
cistern, the timing of precipitation limits effectiveness of rainwater harvesting in Burbank to around 41%.
OPPORTUNITIES FOR RAINWATER HARVESTING
• Encourage customers interested in MWD rain barrels rebates to install four barrels - given budget
constraints, customers can get the most benefit from installing the maximum storage capacity
(MWD offers rebates for up to 4 barrels) to capture winter rains and use water throughout the dry
season.
• Develop a rebate program for cisterns 500+ gallons. Modeling shows that cisterns of 500 gal and
larger are able to capture an average 9%+ of average rainfall in Burbank compared to smaller rain
Burbank Sustainable Water Master Plan Page | 61
barrels (2% average efficiency). See Appendix G for additional information on the rain barrel/cistern
model and how other organizations have funded cistern rebate programs (cost-share with
stormwater, MWD Member Agency Administered Program, etc.)
• Provide customers with graphic rain barrel guides already developed by other organizations to
educate about best practices and installation; feature these on BWP’s rain barrel webpage (e.g. San
Diego Rainwater Harvesting Guide, City of Los Angeles How-To Guide, etc.)
Burbank Sustainable Water Master Plan Page | 62
DIRECT POTABLE REUSE
• Direct Potable Reuse, while currently not permitted in California, is a potential source of local
supply that may see wider acceptance in coming years.
• Engaging in direct potable reuse with BWRP produced recycled water would allow BWP to
increase local potable supplies by approximately 10,000 acre-feet per year.
Direct Potable Reuse (DPR) is defined as treating wastewater effluent to potable quality and then using
it for a source of potable supply. DPR is not currently permitted in the State of California. However, if
this technique is deemed as safe and begins to be permitted by the CDPH in the future, it will provide an
avenue through which BWP can directly distribute its approximately 10,000 acre-feet of annually
produced recycled water as potable supply. This quantity is sufficient to entirely replace imported
supplies.
A five million dollar research initiative into the feasibility of implementing DPR is currently supported by
the contributions from MWD and 44 additional companies/water agencies.116 In addition, the successful
implementation of a DPR system in Wichita Falls Texas117 has the potential to pave the way for other
water management agencies to follow. The CDPH’s impending study (expected in December 2016) of
DPR’s safety in terms of public health118 further hints at the future feasibility of using this technique to
enhance local potable supplies.

Burbank Sustainable Water Master Plan Page | 63
PART 10: CONCLUSIONS
The following results represent a synthesis of the significant findings from each of this report’s analyses.
STATISTICAL ANALYSIS OF TURF REMOVAL PROGRAM
• BWP’s Go Native! Turf Replacement Program saves an estimated 35 gallons of water annually per
square foot converted.
• Irrigation type post-conversion may be the most important aspect of program participation for
successfully reducing water use.
STATISTICAL ANALYSIS OF CURRENT WATER EFFICIENCY PROGRAMS
• Participation in Green Home House Call and High Efficiency Toilet rebate programs both
demonstrated a significant correlation to reduction in daily water use.
• Participation in the High efficiency Clothes washer rebate program did not demonstrate a significant
correlation to reduction in daily water use.
IRRIGATION EFFICIENCY
• Overwatering is a significant contributor to outdoor water consumption.
COST-BENEFIT ANALYSIS
• Over a 20 year planning horizon, saving water through efficiency programs is almost always less
expensive than purchasing imported water.
• Although most water efficiency programs are cost-effective, there is a tradeoff between their level
of cost-effectiveness and the quantity of water they save: the programs with the highest cost-
effectiveness (a low cost of the water saved through efficiency compared to the cost of purchasing
imported water) tend to save relatively less water.
• Significant potential remains to reduce water demand by continuing to fund water efficiency
programs in Burbank.
RATE STRUCTURES
• The shallow tiers of BWP’s current rate structure do not strongly incentivize increases in the
efficiency of residential water use.
Burbank Sustainable Water Master Plan Page | 64
• Budget based rate structures and steep rate tiers reinforce the water savings achieved by BWP’s
water efficiency programs, and send a strong conservation price signal by communicating the true
cost of water to customers.
COMMERCIAL, INDUSTRIAL, INSTITUTIONAL
• Commercial, industrial, and institutional water uses account for roughly a quarter of Burbank’s
water demand.
• Significant opportunities remain to realize cost-effective water savings through multiple MWD
programs.
ENHANCEMENT OF CURRENT LOCAL SUPPLY SOURCES
• BWP has the technical and physical capability to meet all of Burbank’s demand with local sources of
supply through the expanded use of recycled water and groundwater.
• Excess non-potable supply that is currently discharged into the Burbank channel can be translated
into an equivalent quantity of potable water supply.
• BWP can significantly reduce blending ratios while continuing to be in compliance with the BOU’s
CDPH permit as well as all other state, federal, and local water quality criteria and continuing to
deliver high quality potable supplies.
• Replenishment is an essential precursor to expanding SFB usage as a source of potable water and as
a reservoir for long term storage.
• Legal and physical constraints on SFB access can be mitigated via aquifer replenishment.
ENHANCEMENT OF ALTERNATIVE LOCAL SUPPLY SOURCES
• Rain barrels are not a water-efficient strategy for saving water but have valuable non-water
benefits.
• Californians are interested in graywater. If designed correctly, Laundry to Landscape programs offer
a cost-effective, permitless strategy for saving water, in addition to yielding benefits in terms of of
engaging with customers about water reuse and other efficiency strategies.

Burbank Sustainable Water Master Plan Page | 65
PART 11: OPPORTUNITIES
Climate change, ongoing drought, and population growth are increasing the pressure on California’s
urban water supply, leading to uncertainty about the future price and availability of imported water.
Water availability and affordability are two cornerstones of BWP’s commitment to providing reliable
service to customers. Maintaining low, stable rates and dependable water deliveries requires a secure,
sufficient source of water. Reducing dependence on external water sources therefore enables enhanced
water delivery reliability and resiliency in both the short and long term.
Burbank can increase its self-sufficiency by both developing local supplies and reducing total water
demand through regulations or elective behavioral changes. This report identifies a diverse set of
opportunities associated with both local supply development and mandatory or elective demand
reduction. These supply and demand-oriented strategies can be considered as two sides of the same
coin: they each enable reduced reliance on imported water, but achieve this objective through different
means. This diverse set of approaches, described below, provides BWP with a range of opportunities to
improve water sustainability through increased self-sufficiency.
1. Regulations. This approach incorporates enforceable policies and codes to drive customer
engagement and compliance.
2. Incentivizing demand reductions. This approach is driven by BWP policies and programs that
incentivize customers to reduce their water demand through either outreach and education, or
financial incentives. The flexibility of this approach empowers customers to reduce their water
demand in whichever ways are best for their own household.
3. Increasing the use of local water supplies. This approach focuses on supply enhancement programs
that are independent of water consumption.
Outlined below are opportunities that correspond with each of these three approaches. These
opportunities are intended to serve as suggestions to enable Burbank to increase its self-reliance and
water supply sustainability.
OPPORTUNITIES
CATEGORY I: REGULATIONS
I. Implement efficiency-oriented rate structures.
• Increase price differences between rate tiers to send a stronger conservation price signal.

Burbank Sustainable Water Master Plan Page | 66
• Reduce the size of the water cost adjustment charge relative to the total water rate to allow for
steeper tiers.
• Implement a well-designed water budget rate system to incentivize more efficient water use and
increase customer understanding of household water use.
II. Modify turf removal requirements to maximize water savings.
• Enforce requirements for landscape designs and irrigation delivery systems and controllers that
minimize water waste.
CATEGORY II: INCENTIVIZING DEMAND REDUCTIONS
I. Increase BWP’s commitment to water efficiency programs.
• Create a portfolio of long-term water efficiency programs that maximizes quantity of water saved
within the water efficiency program budget.
• Increase budget for water efficiency programs to capitalize on remaining cost-effective water
savings.
• Continue to assess the cost effectiveness and water savings potential of different efficiency
programs. By changing model parameters and inputs (e.g. number of rebates, size of BWP rebate,
size of MWD rebate, water price, device longevity, etc.), BWP can take into account changing
conditions and continue to assess efficiency programs into the future.
• Incorporate lost revenue results into rate planning in order to allow for greater revenue stability and
prevent revenue shortfalls that occur in conjunction with declines in water use.
• Improve visibility and accessibility of rebate information on BWP’s website.
II. Improve customer outreach through data-driven analysis of customer demand and engagement in
efficiency programs.
• Consistently incorporate rebate and customer interaction data into GIS, and overlay this data with
consumption data to allow for simplified spatial visualization of program effectiveness, saturation,
and remaining potential.
• Using GIS software, utilize Smart Meter data to make instantaneous “heat maps” of water usage.
• Focus customer outreach efforts on high water users: a single high-use customer cutting their water
use by 10% results in water savings equivalent to 100 average customers cutting their water use by
10%.
• Continue to analyze the distribution of household water demand in order to focus on customers
with the highest potential for water savings.
III. Enable improved water use efficiency from Commercial, Industrial, and Institutional water users.

Burbank Sustainable Water Master Plan Page | 67
• Revise Burbank’s “Save Water, Save a Buck” website to feature all rebates offered through SoCal
Water$smart’s commercial program, mention the water savings associated with Business Bucks
inspections, and make the website more visible from the homepage.
• Provide CII customers with information about MWD’s SoCal Water$mart for Commercial Customers
Program and Be Water Wise Savings Incentive Program.
• Improve CII customer outreach by conducting a CII customer inventory to identify and assist water
wasters.
IV. Provide customers with resources to minimize water waste associated with landscaping.
• Encourage efficient irrigation through smart controllers and by adjusting time-based controllers for
season and landscape type.
• Educate turf removal customers about adjusting controllers for both initial landscape needs and
seasonal changes.
• Provide turf removal customers with assistance in landscape design.
IV. Build on Green Home House Call services and customer engagement.
• Enable Burbank residents to utilize GHHC’s irrigation reset and outdoor water audit services multiple
times.
• Promote high-efficiency devices through partnerships with device retailers.
• Focus program outreach and education on neighborhoods with low GHHC participation rates.
CATEGORY III: INCREASING THE USE OF LOCAL WATER SUPPLIES
I. Increase the percentage of produced recycled water that is put to beneficial use.
• Explore opportunities to trade greater quantities of recycled water to the LADWP in exchange for
groundwater pumping credits.
• Look for opportunities to create a new stream of monetary revenue by selling excess recycled
supplies to meet the non-potable demands of other member agencies.
• Continue efforts to offset potable demand by reaching more customers with the existing non-
potable purple pipe infrastructure.
• Reevaluate policies that encourage increased consumption among customers who currently access
purple pipes or have the potential to do so.
• Discharge excess supplies to the Pacoima Spreading Fields instead of the Burbank Channel in order
to convert the current surplus of non-potable supplies into a locally controlled potable resource.
II. Increase the ratio of local groundwater to pre-treated imports in the potable supply
• Increase efforts to have the BOU produce treated water at a rate that is closer to its maximum
capacity of 9,000 GPM.

Burbank Sustainable Water Master Plan Page | 68
• Take advantage of reduced concentrations of nitrate and chromium (VI and total) in untreated BOU
water by significantly decreasing the percentage of imported water that is blended with
groundwater.
• Update the 15 year old CDPH permit to reflect regulatory changes that have occurred since it was
issued including: reduced MCL’s for nitrate and chromium, and the newly issued national MCL for
chromium VI.
• Reevaluate the technical feasibility and potential benefits of bringing the GAC back online in order
to increase local groundwater production for either potable supplies or limited non-potable
distribution.
III. Take action to replenish groundwater levels of the San Fernando Basin aquifer in order to unlock its
potential use as a long-term storage reservoir.
• Incentivize the incorporation of LID into all new land developments and the retrofitting of existing
structures.
• Invest in stormwater infrastructure that will accomplish both flood control and replenishment of the
SFB.
• Look for opportunities to meter groundwater recharge in order to receive groundwater pumping
credits for LID and stormwater infrastructure investments.
IV. Provide financial support and educational outreach to develop a residential greywater program.
• Develop a pilot program to provide 30-50 free greywater systems to BWP customers.
• Provide education and outreach to assist in implementing a residential greywater program through
workshops
• Utilize regional greywater experts to assist users in greywater installation and use.
IV. Maximize rain barrel effectiveness by focusing on high-volume rain barrels and customer education.
• Educate customers that they can receive the most water savings by installing four rain barrels, which
is the maximum number of rain barrels that MWD will currently rebate.
• Develop a rebate program for 500+ gallon cisterns in order to maximize the effectiveness of
rainwater harvesting.
Burbank Sustainable Water Master Plan Page | 69
APPENDICES
APPENDIX A – TURF REMOVAL PROGRAM COMPARISON 70
APPENDIX B – STATISTICAL ANALYSIS APPENDIX 71
APPENDIX C – COST-BENEFIT ANALYSIS APPENDIX 80
APPENDIX D – RATE STRUCTURES APPENDIX 95
APPENDIX E – COMMERCIAL, INDUSTRIAL, AND INSTITUTIONAL WATER EFFICIENCY APPENDIX 98
APPENDIX F – ADDITIONAL SUPPLY FIGURES AND TABLES 100
APPENDIX G – GRAYWATER APPENDIX 103
APPENDIX H – RAINWATER HARVESTING APPENDIX 108
APPENDIX I – ADDITIONAL DEMAND ASSESSMENT GRAPHS/TABLES 111
REFERENCES 112
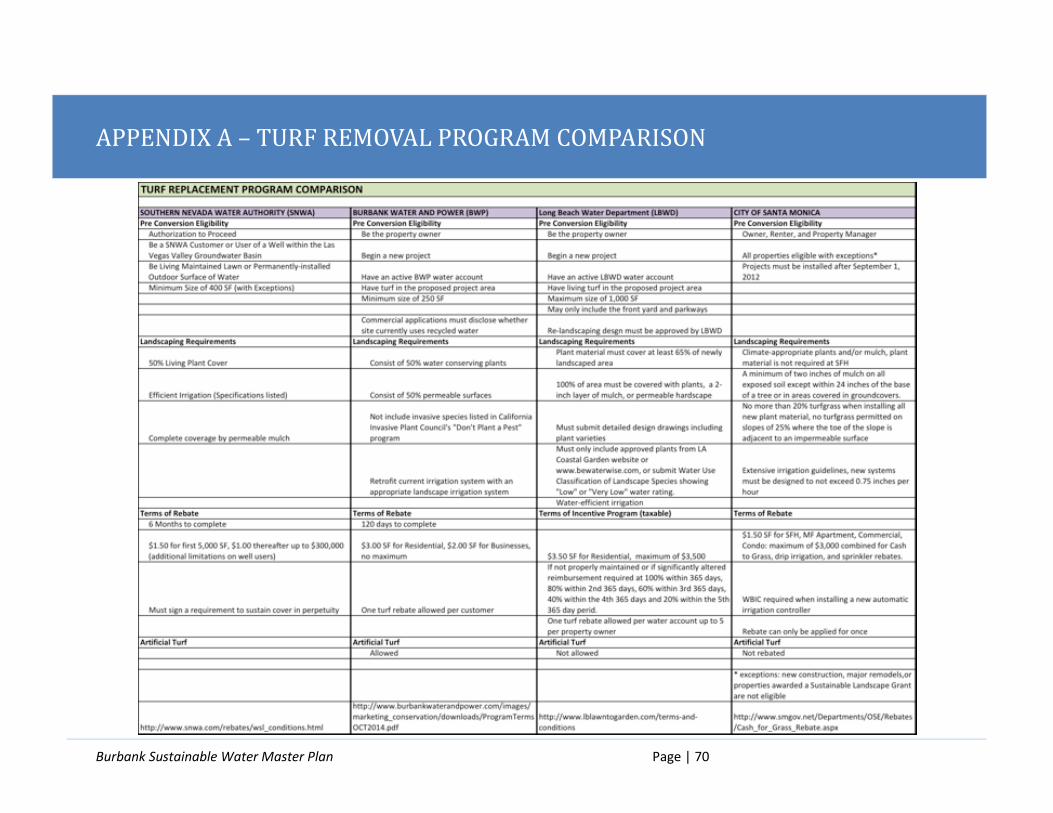
Burbank Sustainable Water Master Plan Page | 70
APPENDIX A – TURF REMOVAL PROGRAM COMPARISON
Burbank Sustainable Water Master Plan Page | 71
APPENDIX B – STATISTICAL ANALYSIS APPENDIX
INTRODUCTION
BWP offers rebates to customers who remove lawns, which have a relatively high water demand, and
replace them with lower water demand California Friendly Landscapes. To date the savings attributable
to the Go Native! Turf Replacement Program have been projected using water savings estimates
calculated by other agencies. Specifically, BWP relies on Metropolitan Water District estimates of 43.8
gallons per square foot (gpsf) annually. An in-depth analysis of the water-savings attributable to this
program has not been conducted for Burbank’s program. It is the goal of this analysis to provide water-
savings estimates determined using BWP’s actual water consumption data to improve the accuracy of
savings projections and to provide insight into opportunities for program improvement. For details on
the program and how it compares to others in the region see Appendix A.
A recent report by the Alliance for Water Efficiency (AWE) noted that methods between outdoor water
savings studies varied and that no consistent ‘baseline’ to calculate savings has been established (Mayer
et.al). The frequently cited Southern Nevada Water Authority (SNWA) study compared the average
annual per square foot water application to Xeriscapes to that of turf landscapes and found a difference
of 55.8 gallons.119 The diversity of studies included in the AWE report found that conversion from a turf
lawn to water efficient landscape saves in the range of 34 to 60+ gpsf over the course of a year.120 It is
assumed that calculated water savings in Burbank will fall within this range.
During summer months, when temperatures are at a maximum and precipitation is at a minimum,
traditional turf lawns require large quantities of water. For this reason it is during summer months that
the more water efficient California Friendly landscapes should demonstrate the greatest efficiency
compared to their turf counterparts. Other studies have found this to be true, with water savings for
conversion landscapes to be most pronounced in summer months.121
The SNWA study benefited from the use of submetering, which allowed for the isolation of outdoor
water use from indoor water use. Submetering was not in place in Burbank and therefore differences in
total water use may result from changes in indoor use as well. Despite this limitation, as similar type of
calculation was carried out based on the assumption that the majority of the difference in water use
could be attributed to the difference in outdoor landscape type. The total (indoor and outdoor
combined) water consumption for homes with California Friendly landscapes was compared to the total
water use for a control group of similar homes with turf lawns and an average annual difference of 73.1
(HCF). When normalized by the average size of landscape conversion, this translates to 63.0 gallons per
square foot. To refine this analysis a difference in difference regression was used to help control for
baseline differences between the two groups. Doing so resulted in an estimated 35.07gallons per
square foot of landscape converted. Additionally, to control for a greater number of factors, a multiple
Burbank Sustainable Water Master Plan Page | 72
regression was carried out. This regression included the irrigation type used post landscape conversion.
Doing so indicated that the water savings seen post lawn conversion may be attributable to the
irrigation system installed rather than to the actual square footage of landscape conversion.
METHODS
DATA SELECTION
TR target participants were identified as all those whose project was completed on or before May 31,
2014, allowing for at least one summer’s worth of post-removal data (n=51). A more limited group of TR
participants were selected for having a full years worth of data after project completion (n=34). A TR
control group (n=34) was established by selecting sites with turf that were located near (generally on
the same block as) an analogous TR site. Control sites were selected based on property size,
presence/absence of a swimming pool, portion of lot with hardscape, visible shade cover, and
topography to as closely match the paired TR sites as possible.
The remainder of the target customers were selected using random number generation and a numbered
list of participants from the GHHC (n=30), HET (n=30), and HECW (n=30) master lists of all participants.
Prior to selection, these lists were narrowed down to customers that had engaged with the program of
focus on or prior to June, 2014. Although each of these 174 targets was selected based on their
participation in one specific program (in order to ensure representation of all programs of study), many
of the targets have engaged in two or three of the programs. Furthermore, several targets in the “TR
control” subset participated in no programs. All study participants were cross-checked with a list of
properties that had been identified to have leaks. Due to the significant water consumption attributable
to leaks, and the the presence of only three properties with identified leaks, these properties were
removed from the data set. A complete list of all target customers and the efficiency program(s) that
they have participated in can be found in Appendix B.
Once the list of targets was completed, 2014 monthly usage data for each customer was exported from
BWP’s Oracle Utilities Customer Care and Billing system (BWP’s current billing system). In addition,
historical monthly usage data from December 2010 through December 3013 was exported from Banner
CIS (BWP’s previous billing system). Consumption data was then paired with each customer’s
corresponding efficiency program participation data and formatted for analysis in excel spreadsheets. In
order to protect sensitive customer information, each target was assigned a number (1-173) which was
used thereafter as the exclusive unique identifier. Billing information was then combined with two
program participation variables for each program. The first is a yes/no variable for participation, a yes
value corresponding to the month in which a program participation first occurred and to all subsequent
months. The second is a count variable that increases by one for each month since program
participation first took place. All other months are assigned a zero value. Additional data were gathered
for each address contained in the study from information found on the Zillow website122 including the
presence of a pool (yes/no), the number of bedrooms and bathrooms, the market value of the property,
and the lot size (square feet). Irrigation type was known only for turf conversion customers and thus
Burbank Sustainable Water Master Plan Page | 73
could not be entirely controlled for in the analysis. This would have been valuable information because
increased automation of irrigation systems are associated with increased water use.123
Monthly climate data was gathered from the National Climate Data Center of the National Oceanic and
Atmospheric Administration for the Burbank Glendale Pasadena Airport, CA station. In addition to
climate data, current water bill for 12 HCF of consumption, and the presence and level of drought
restrictions were included for each month in the dataset.
The complete dataset includes the following variables.
• Average daily water use by month (Usage by month/days of service for that month)
• Participation in each of the four efficiency programs (yes/no)
• Conversion area of turf to California Friendly landscape (sqft)
• Month
• Irrigation type for the turf conversion group only (either spray, rotating nozzle, hand watering, or
drip, or some combination of two.)
• Total rebate given for turf conversion
• Pool (yes/no)
• Number of bedrooms
• Number of bathrooms
• Property value
• Lot size (sqft)
• Home size (sqft)
• Total monthly precipitation (in)
• Average monthly minimum temperature (Deg F)
• Water bill for 12 HCF of consumption
• Level of drought restriction in effect (1= drought declared, 2=three day a week watering, 3 = one day
a week watering)
ANALYSIS
Analysis was carried out using a combination of R Studio statistical modeling and Excel. Statistical
methods include multiple regression analysis, difference in differences (DID), Shapiro-Wilks test for
normality, t-tests, and Mann-Whitney U nonparametric tests.
The Go Native! turf conversion program began in 2012. In order to control for seasonal and annual
variations in evapotranspiration rates and other external factors, the before and after data sets for
participation in Go Native! were not tailored to each site. Instead, 2011 was chosen as the base year and
2014 was chosen as the post conversion year for comparison.
Average annual water consumption data in 2014 for the lawn conversion group was compared to the
same metric for the control group using a Mann-Whitney U test.
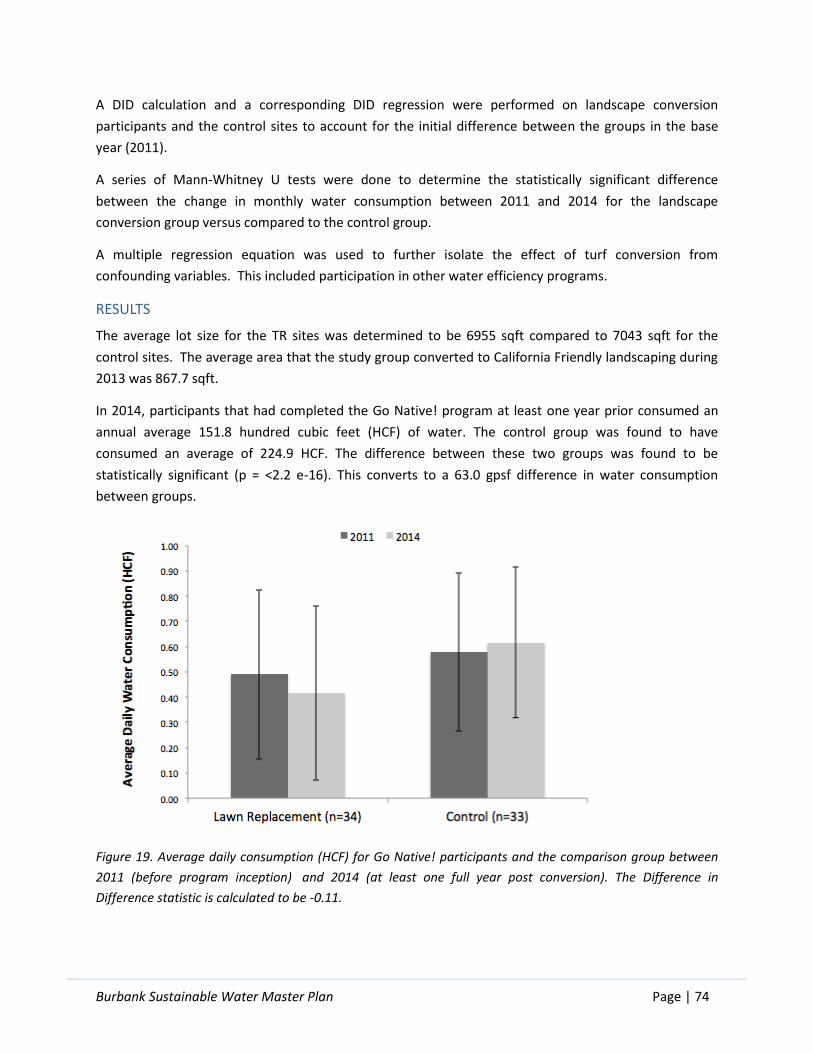
Burbank Sustainable Water Master Plan Page | 74
A DID calculation and a corresponding DID regression were performed on landscape conversion
participants and the control sites to account for the initial difference between the groups in the base
year (2011).
A series of Mann-Whitney U tests were done to determine the statistically significant difference
between the change in monthly water consumption between 2011 and 2014 for the landscape
conversion group versus compared to the control group.
A multiple regression equation was used to further isolate the effect of turf conversion from
confounding variables. This included participation in other water efficiency programs.
RESULTS
The average lot size for the TR sites was determined to be 6955 sqft compared to 7043 sqft for the
control sites. The average area that the study group converted to California Friendly landscaping during
2013 was 867.7 sqft.
In 2014, participants that had completed the Go Native! program at least one year prior consumed an
annual average 151.8 hundred cubic feet (HCF) of water. The control group was found to have
consumed an average of 224.9 HCF. The difference between these two groups was found to be
statistically significant (p = <2.2 e-16). This converts to a 63.0 gpsf difference in water consumption
between groups.
Figure 19. Average daily consumption (HCF) for Go Native! participants and the comparison group between
2011 (before program inception) and 2014 (at least one full year post conversion). The Difference in
Difference statistic is calculated to be -0.11.
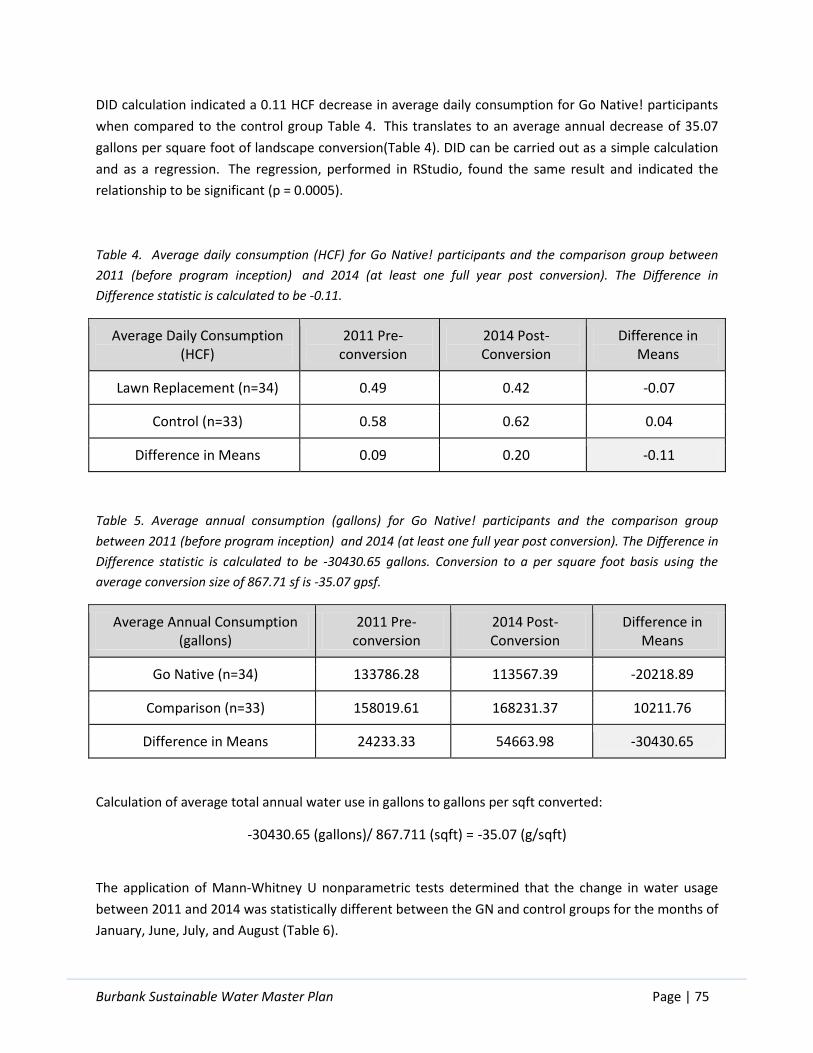
Burbank Sustainable Water Master Plan Page | 75
DID calculation indicated a 0.11 HCF decrease in average daily consumption for Go Native! participants
when compared to the control group Table 4. This translates to an average annual decrease of 35.07
gallons per square foot of landscape conversion(Table 4). DID can be carried out as a simple calculation
and as a regression. The regression, performed in RStudio, found the same result and indicated the
relationship to be significant (p = 0.0005).
Table 4. Average daily consumption (HCF) for Go Native! participants and the comparison group between
2011 (before program inception) and 2014 (at least one full year post conversion). The Difference in
Difference statistic is calculated to be -0.11.
Average Daily Consumption (HCF)
2011 Pre-conversion
2014 Post-Conversion
Difference in Means
Lawn Replacement (n=34) 0.49 0.42 -0.07
Control (n=33) 0.58 0.62 0.04
Difference in Means 0.09 0.20 -0.11
Table 5. Average annual consumption (gallons) for Go Native! participants and the comparison group
between 2011 (before program inception) and 2014 (at least one full year post conversion). The Difference in
Difference statistic is calculated to be -30430.65 gallons. Conversion to a per square foot basis using the
average conversion size of 867.71 sf is -35.07 gpsf.
Average Annual Consumption (gallons)
2011 Pre-conversion
2014 Post-Conversion
Difference in Means
Go Native (n=34) 133786.28 113567.39 -20218.89
Comparison (n=33) 158019.61 168231.37 10211.76
Difference in Means 24233.33 54663.98 -30430.65
Calculation of average total annual water use in gallons to gallons per sqft converted:
-30430.65 (gallons)/ 867.711 (sqft) = -35.07 (g/sqft)
The application of Mann-Whitney U nonparametric tests determined that the change in water usage
between 2011 and 2014 was statistically different between the GN and control groups for the months of
January, June, July, and August (Table 6).
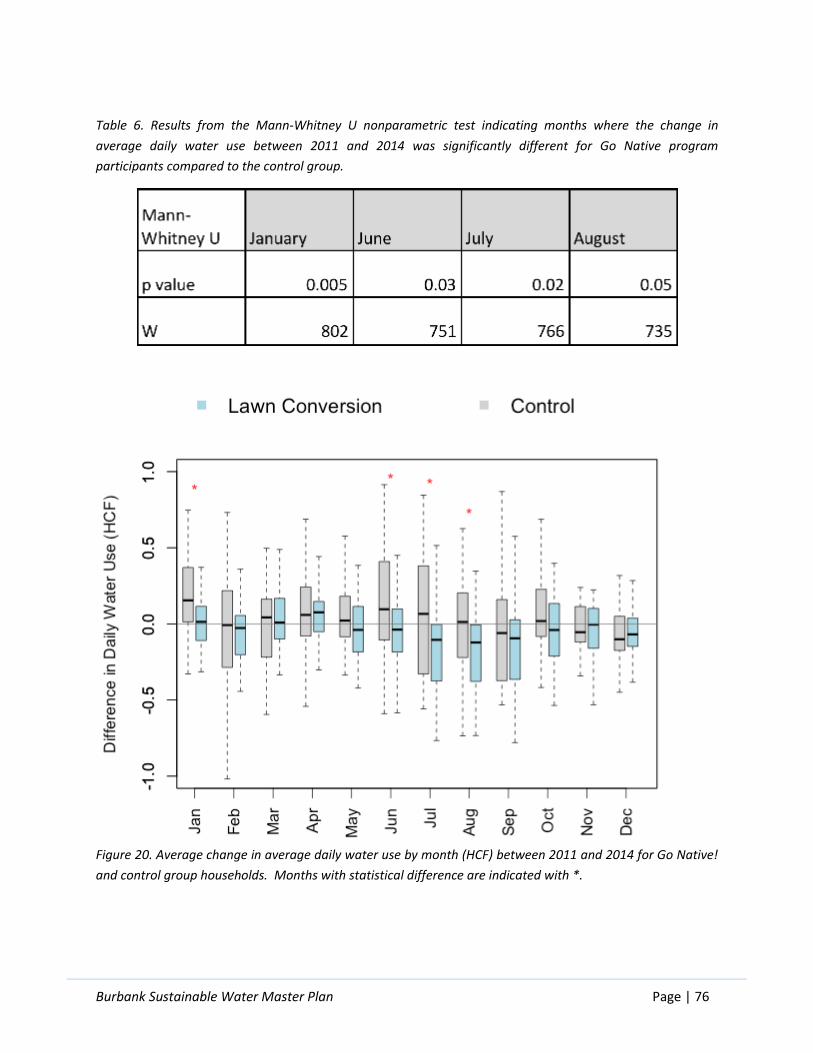
Burbank Sustainable Water Master Plan Page | 76
Table 6. Results from the Mann-Whitney U nonparametric test indicating months where the change in
average daily water use between 2011 and 2014 was significantly different for Go Native program
participants compared to the control group.
Figure 20. Average change in average daily water use by month (HCF) between 2011 and 2014 for Go Native!
and control group households. Months with statistical difference are indicated with *.
Burbank Sustainable Water Master Plan Page | 77
The multiple regression found that holding all listed factors constant both the square footage of the turf
replaced and the irrigation type post-replacement had significant effects on total daily water use (Table
7). Importantly, the magnitude of the effect associated with the size of the replacement was much
smaller than that of irrigation type, highlighting the importance of irrigation type for program success.
Participation in the Green Home House Call program and High Efficiency Toilet rebate program each
demonstrated significant negative correlations with water use, while participation in the High Efficiency
Clothes Washer program had no significant effect.
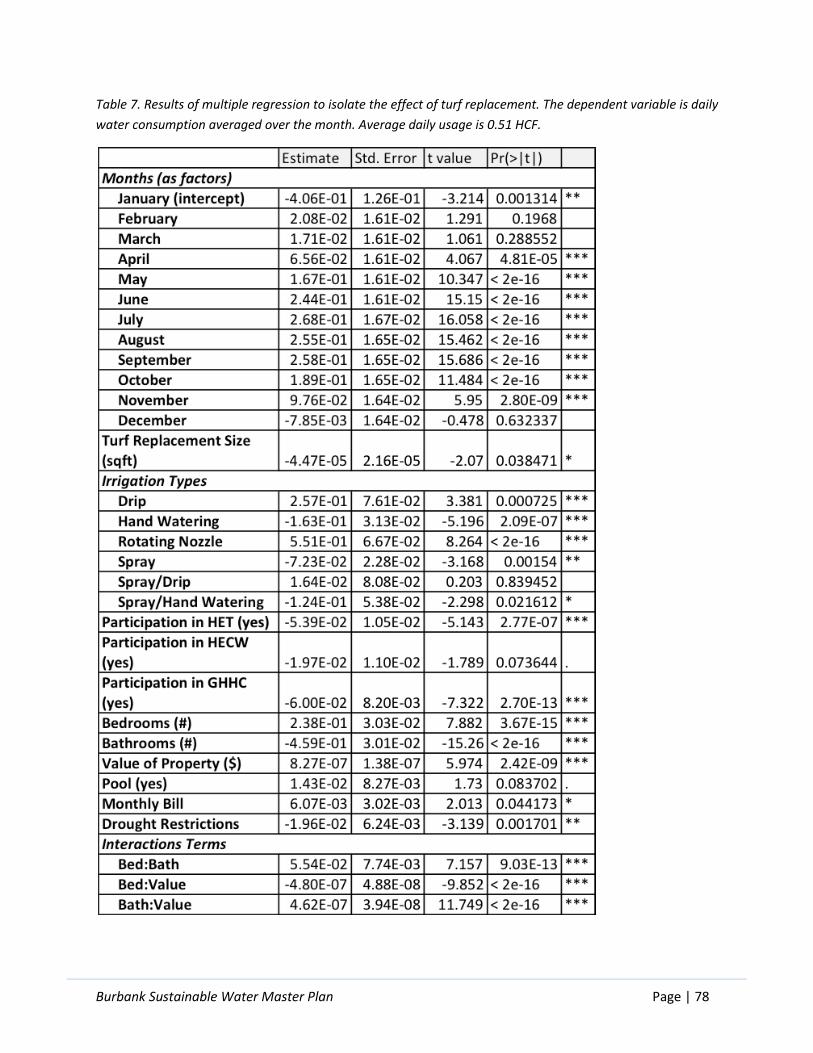
Burbank Sustainable Water Master Plan Page | 78
Table 7. Results of multiple regression to isolate the effect of turf replacement. The dependent variable is daily
water consumption averaged over the month. Average daily usage is 0.51 HCF.
Burbank Sustainable Water Master Plan Page | 79
CONCLUSIONS
Participation in the Go Native! Lawn Replacement program is, on average, associated with a water use
reduction of 35.07 gallons per square foot conversion. This volume may be more strongly associated
with changes in irrigation type than the actual conversion size. Given the limited number of known
irrigation types (41 total) the associated coefficients should not be used to inform program changes to
the allowed irrigation types, but should instead indicate the need for better tracking of irrigation types
and further investigation. If these preliminary findings are supported by further analysis, then there
may be great potential to refocus the Go Native! program to target irrigation conversion above
landscape conversion.
Burbank Sustainable Water Master Plan Page | 80
APPENDIX C – COST-BENEFIT ANALYSIS APPENDIX
BACKGROUND
BWP has a limited budget for water efficiency program. By maximizing the effectiveness of its portfolio
of water efficiency programs, BWP can achieve maximum water savings at the least cost to both BWP
and water ratepayers.124 Uncertainty and lack of information often prevent water utilities from
implementing only the most efficient water conservation programs.125 The results of this cost benefit
analysis give BWP the tools to overcome these information barriers, and give BWP the power to select
and justify an efficiency program portfolio based on quantitative metrics.
RATES AND REVENUE STABILITY
Effective water efficiency programs can decrease the quantity of revenue that BWP collects from
customers.126 If the water savings are unexpected and not planned for via rate adjustments,
improvements in water efficiency programs in Burbank can prevent BWP from meeting revenue
requirements in the short-term, meaning that rates must be adjusted to accommodate the impacts of
water efficiency.127 These efficiency-related revenue shortfalls may be mitigated by accounting for the
impacts of water efficiency when setting rates.128 These impacts are estimated using the results of the
cost benefit analysis: the “lost revenue” associated with water efficiency is equal to the projected
customer benefit, or the total amount that customers save on their bills when they implement efficiency
measures. Therefore, maintaining revenue neutrality requires that rates be adjusted to a level that
recovers any lost revenue associated with a given efficiency measure.129 The cost benefit analysis
therefore serves as a tool to improve demand projections, and adjust rates in anticipation of the impacts
of water conservation programs.
In the long run, increasing the effectiveness of water efficiency programs is likely to have two primary
impacts: (1) increased reliability of revenue requirements and therefore more stable rates, and (2) rates
that are lower than they would be without water efficiency.130 These results are accomplished via two
paths: reducing reliance on imported water and minimizing costly infrastructure improvements.
By reducing BWP’s reliance on its marginal water supply sources (imported water), BWP will be less
reliant on a water source that has an uncertain supply and price in the future. By relying more on local
sources of water with relatively stable prices and supply, BWP can ensure greater stability in revenue
requirements and therefore reduce the need for frequent and large rate adjustments associated with
demand reductions resulting from improve water efficiency.131
In reducing water consumption, BWP can also forestall costly capacity additions and therefore keep
water rates lower than they would be otherwise. For example, demand reductions from water efficiency
Burbank Sustainable Water Master Plan Page | 81
measures allowed Westminster, CO to delay almost $600 million of water delivery infrastructure,
allowing the city to keep water rates 80% lower than they would have been without these demand
reductions.132 Burbank’s water system is unique from Westminster’s, but in both locations the least
expensive water delivery infrastructure is the water delivery infrastructure that already exists, and
preventing the need for additional infrastructure is an effective way to keep rate increases lower than
they would be otherwise.133
METHODS
OVERVIEW
We chose an industry-standard water efficiency cost-benefit analysis models to look at the potential
economic impacts of implementing water efficiency devices in Burbank. The model operates by
calculating two outputs through time: the value of annual expected water savings for user-input water
efficiency devices and the costs of providing giveaways or rebates for such devices. Detailed
explanations of the various costs and benefits inputs to the model are listed below. The model produces
results from the perspective of both the utility as well customers as a whole. Potential programs must
be economically advantageous for both the utility and the customer in order to operate effectively. The
model also tracks a number of economic-related parameters, including discounting to account for the
time value of money, and incorporating the expected increase in costs above the rate of inflation for
water rates, imported supplies, etc.
Outputs from the model include several parameters that are valuable for comparison of programs
during water efficiency planning:
• Unit Cost: a ratio of the discounted present value of costs of a particular device divided by the total
discounted water savings, ending up in the form of $/AF. This is particularly useful because it can be
directly compared to the unit cost of imported water. If the levelized cost of a particular device is
less than the current unit cost of imported water, the device is considered to be cost-efficient and
will save money over the term of the planning horizon.
• Benefit-Cost Ratio: a simple ratio of the discounted present value of benefits provided by one device
category to the discounted present value of costs of implementation. A value above “1” means the
benefits outweigh the costs and the program is considered cost-effective.
• Net Present Value: the sum of discounted benefits minus the sum of discounted costs for a single
device category over the planning horizon. A positive value means the benefits outweigh the costs
and the program is considered cost-effective.
• Unit Net Present Value: a ratio of the discounted net present value of a particular device divided by
the total discounted water savings. We chose to use this as an economic measure because certain
devices didn’t have any costs directly accrued to Burbank, and thus had a unit cost of $0. Unit NPV
allows making a comparison of net benefits - costs, normalized by discounted water savings.

Burbank Sustainable Water Master Plan Page | 82
EXPLANATION OF INPUTS TO THE CBA MODEL
• Costs
• Burbank Water and Power
• Fixed Costs of Efficiency Program
• Administrative costs, startup costs, marketing
• Variable Costs
• Purchase price of efficiency device OR cost of rebate provided by BWP: Cost
of device when BWP gives away water-efficient devices OR the rebates that
BWP gives to customers after they purchase these devices. This can vary
each year depending on the number of rebates BWP offers, the size of these
rebates, and the number of device giveaways offered.
• Labor cost: The cost to BWP of sending an employee to install a water
efficiency device (if applicable), assist in initial device set-up, or provide
maintenance and repair services.
• Customers
• Initial installation costs: Price to consumer of purchasing and installing the device.
• Yearly maintenance cost: Price of maintaining device each year.
• Benefits
• Burbank Water and Power
• Avoided Costs:
• Avoided Operations and Maintenance (O&M): Every gallon of water
processed and delivered is associated with a certain variable O&M cost
(pumping, chemicals, etc). Therefore, every gallon of water saved via
efficiency measure eliminates this marginal cost.
• Avoided cost of water supply: Every gallon of water saved by customers is a
gallon of water that does not need to be purchased from MWD
• Considered but did not include:
• Deferred capital costs: Demand projections (which do NOT include any new
efficiency measures beyond programs that are already in place) indicate
that Burbank does not anticipate a sufficiently large increase in water
demand to necessitate any new water supply infrastructure. Therefore,
there are no capital costs that can be deferred or avoided within our
planning horizon, and this parameter was not incorporated into the cost
benefit analysis, although the models do allow for this calculation.
• Customers
• Rebates/incentives: Any rebates or other financial incentives from BWP (e.g.
installation, maintenance).

Burbank Sustainable Water Master Plan Page | 83
• Other Assumptions
• While conserving water has many environmental benefits (increased instream flows,
water quality protection, habitats, etc), these benefits do not accrue in economic
terms to the utility and are thus not incorporated into this analysis.
Table 8. Alliance for Water Efficiency Water Conservation Tracking Tool Inputs Overview
Benefits and Costs Inputs
Utility Benefits Avoided Cost of Water Supply (imported MWD Water assumed to be the marginal water supply that would be reduced with efficiency savings)
Variable Operations and Maintenance (O&M) - chemicals and energy for treatment and pumping within Burbank. We were not able to obtain this information from Burbank, and instead used a conservative estimate of $0. There are definitely O&M energy costs that are benefits we were unable to capture in this model.
Avoided Cost of Wastewater Treatment (we assumed this to be the avoided cost of dechlorination of excess recycled water. BWRP has no significant avoidable variable operating costs)
Avoidable System Expansion/Capital Costs (assumed to be $0 for Burbank which is “built out”)
Efficiency Device Data (yearly water savings, device lifetime, etc)
See Table 9 for modeled devices, yearly water savings, device lifetimes, and sources
Customer Benefits Calculates monetary savings by: (water savings) * (water rate) = (changes to customer bills) which may not be accurate because water rates are likely to change in response to efficiency savings (see discussions on rate impacts in main report and appendix) Also includes estimated gas bill savings.
Utility Costs User-input cost of rebate and/or installation per device Fixed administrative costs for implementing conservation program
(Assumed to be $0 for most measures (except WaterSmart) in this model since no radically different programs are proposed from what is currently managed administratively now)
Customer Costs Cost of purchase, installation, and upkeep of device (if any). For most devices, customer cost was assumed to be $0 because:

Burbank Sustainable Water Master Plan Page | 84
Rebate covers the cost of purchase Device is a giveaway Marginal cost for a device that will be replaced anyways is $0
(e.g. customer is going to buy a new water-related device anyways, choosing a modern efficient version does not involve significant additional costs)
If there was a customer cost, it was input after subtracting rebates from MWD or Burbank
Other Features or Inputs
Electricity/Gas Savings The model tracks electric OR natural gas savings for programs that reduce hot water usage. Since more than 50% of homes in Burbank use natural gas for heating water, we choose to model natural gas savings for end-use energy savings (showers, faucets, etc) (though it is likely some homes use electric heat, this is still a good estimate of energy reduction through end-use).
Peak Period Water Usage
Allows comparison of peak and off-peak water usage and savings. This is mostly useful for avoiding system expansion, so it was not utilized in this analysis.
Plumbing Code Incorporates calculations of passive water savings for toilets, showerheads, washing machines, and dishwashers according to plumbing code changes in 1994 (ULFT), 2011 (HECW), and 2014 (HET) in California. For simplicity, this was not included.
Planning Horizon Sums water savings for as long as devices are still active (i.e. we used a planning horizon for rebates of 20 yrs, so program costs end at 20 yrs, but benefits continue to accrue as long as devices still have useful lifetime remaining)
Population Inputs Drawback: population must be forecast to 2050 in order to fully fill out future demand projections and get final results, even though the model doesn’t utilize these values for the focus of this study. (Otherwise, it gives errors later on if full population inputs are not supplied).
Demand Inputs Requires demand inputs in the form of a flow rate: million gallons per day. Service area demands are primarily used for looking at the benefits of delayed/offset capital infrastructure expansion investment. This does not figure into benefits calculated for Burbank at this time. These inputs are still required for calculations.
Lost Revenue Not included as a cost to the utility -- utilities will necessarily adjust rates or use other financial instruments to make up for fixed costs and remain revenue-neutral if water usage drops due to efficiency.
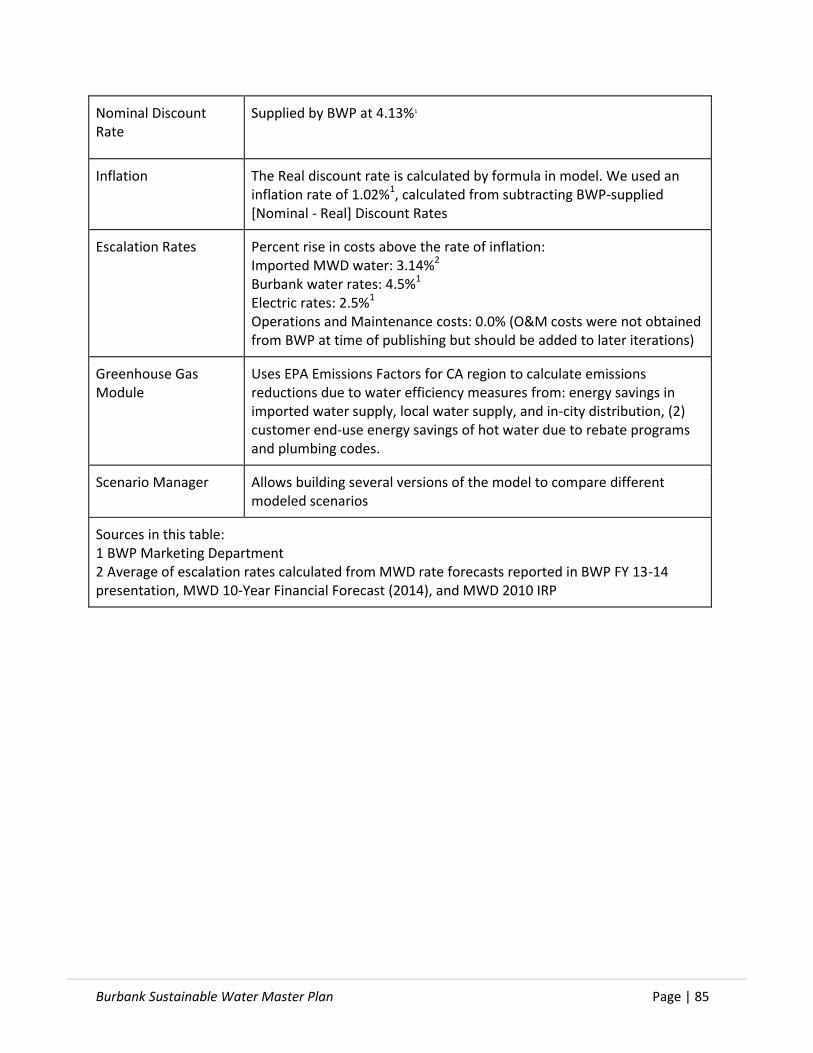
Burbank Sustainable Water Master Plan Page | 85
Nominal Discount Rate
Supplied by BWP at 4.13%1
Inflation The Real discount rate is calculated by formula in model. We used an inflation rate of 1.02%1, calculated from subtracting BWP-supplied [Nominal - Real] Discount Rates
Escalation Rates Percent rise in costs above the rate of inflation: Imported MWD water: 3.14%2
Burbank water rates: 4.5%1
Electric rates: 2.5%1
Operations and Maintenance costs: 0.0% (O&M costs were not obtained from BWP at time of publishing but should be added to later iterations)
Greenhouse Gas Module
Uses EPA Emissions Factors for CA region to calculate emissions reductions due to water efficiency measures from: energy savings in imported water supply, local water supply, and in-city distribution, (2) customer end-use energy savings of hot water due to rebate programs and plumbing codes.
Scenario Manager Allows building several versions of the model to compare different modeled scenarios
Sources in this table: 1 BWP Marketing Department 2 Average of escalation rates calculated from MWD rate forecasts reported in BWP FY 13-14 presentation, MWD 10-Year Financial Forecast (2014), and MWD 2010 IRP

Burbank Sustainable Water Master Plan Page | 86
Table 9. Efficiency device inputs into the Alliance for Water Efficiency Water Conservation Tracking Tool, Burbank-Specific.
Device Name
Reduction in water use per device (Gallons per device per year)
Water reduction source
MWD Rebate (does not figure directly into model)
BWP Rebate (Total Rebate paid by BWP) per device
Total Rebate to customer
BWP device costs per device
BWP service cost per device
Total BWP costs/unit
Customer Cost per device (Input to model was this cost minus rebates)
Historical Device Offerings per Year
Modeled Device Offerings
Life Expectancy (years) Life Expectancy Source Other notes
Energy Savings (Assumes gas heating, Therms/gal) Energy Savings Source
SINGLE FAMILY INDOOR
HET 2,270
Sylvir Consulting Technical Memo*
$100.00
$50.00
$150.00 $0.00 $0.00
$50.00 $0.00 181 200 20
Industry standard (see EPA WaterSense or MWD)
N/A
Showerheads 2,464
Sylvir Consulting Technical Memo*
$0.00 $0.00 $0.00 $2.99 $0.00 $2.99 $0.00 2916 50 5
Conservative estimate provided by Sylvir Consulting Technical Memo
0.0048
Provided by AWE model, citing DOE energy savings calculator and assumes 60% of shower water is hot (Aquacraft 2003)
Kitchen aerator 3,903
Sylvir Consulting Technical Memo**
$0.00 $0.00 $0.00 $1.42 $0.00 $1.42 $0.00
5638 (kitchen + bathroom) 100 5
Conservative estimate provided by Sylvir Consulting Technical Memo
0.00304
Calculated based on 0.000152 therms per gallon per degree F for natural gas heater, faucet water heated by raising temp from 60degF to 80degF (Pacific Institute 2010)
Bathroom aerator 5,854
Sylvir Consulting Technical Memo**
$0.00 $0.00 $0.00 $0.39 $0.00 $0.39 $0.00
5638 (kitchen + bathroom) 100 5
Conservative estimate provided by Sylvir Consulting Technical Memo
0.00304
Calculated based on 0.000152 therms per gallon per degree F for natural gas heater, faucet water heated by raising temp from 60degF to 80degF (Pacific Institute 2010)

Burbank Sustainable Water Master Plan Page | 87
Clothes Washers 7,056
BWP -- average for Energy Star clothes washers
$85.00
$50.00
$135.00 $0.00 $0.00
$50.00 $0.00 575 400 11
Energy Star, Clothes Washer Product Snapshot, May 2008
0.0035
Provided by AWE model, citing FEMP (2000)
GHHC Showerheads 2,464
Sylvir Consulting, Technical Memo*
$0.00 $0.00 $0.00 $2.99
$10.00
$12.99 $0.00 671 300 5
Conservative estimate provided by Sylvir Consulting Technical Memo
0.0048
Provided by AWE model, citing DOE energy savings calculator
GHHC Bath Aerators 5,854
Sylvir Consulting Technical Memo**
$0.00 $0.00 $0.00 $0.39 $5.00 $5.39 $0.00 693 400 5
Conservative estimate provided by Sylvir Consulting Technical Memo
0.00304
Calculated based on 0.000152 therms per gallon per degree F for natural gas heater, faucet water heated by raising temp from 60degF to 80degF (Pacific Institute 2010)
GHHC Kitchen Aerators 3,903
Sylvir Consulting Technical Memo**
$0.00 $0.00 $0.00 $1.42 $5.00 $6.42 $0.00 479 300 5
Conservative estimate provided by Sylvir Consulting Technical Memo
0.00304
Calculated based on 0.000152 therms per gallon per degree F for natural gas heater, faucet water heated by raising temp from 60degF to 80degF (Pacific Institute 2010)
GHHC HET1 2,270
Sylvir Consulting Technical Memo*
$100.00 $0.00
$100.00
$306.00
$100.00
$306.00 $0.00
181 (same as regular HET) 25 20
Industry standard (see EPA WaterSense or MWD)
N/A
GHHC HET2 2,270
Sylvir Consulting Technical Memo*
$0.00 $0.00 $0.00
$306.00
$100.00
$406.00 $0.00
181 (same as regular HET) 25 20
Industry standard (see EPA WaterSense or MWD)
N/A
WaterSmart Software 7,062
See calculation in notes***
$0.00 $0.00 $0.00 $0.00 $0.00 $0.00 $0.00 0
18,672 10 Conservative estimate
We included a $140,000 upfront cost to implement the program N/A
SINGLE FAMILY OUTDOOR

Burbank Sustainable Water Master Plan Page | 88
Smart Controllers 13,505
BWP (but similar to 13,500 gpy from MWD Board Letter 8-5, 2/20/2002) $80 $0.00
$80.00 $0.00 $0.00 $0.00
$100.00 4 4 10
MWD Board Letter 8-5, 2/20/2002
N/A
Rotating Sprinkler Nozzles 1,460
BWP (but similar to 1,320 GPY given by MWD Board Letter 7-5, 8/2006)
$4.00 $0.00 $4.00 $0.00 $0.00 $0.00 $0.00 195 200 5 MWD Board Letter 7-5, 8/2006
N/A
Rain barrels 304
Rain barrel model by Chris Hewes, 1000 sq ft of turf, 55 gal rain barrel, 1500 sq ft roof (see Rain Barrel/Cistern Model in Appendix H)
$75.00 $0.00
$75.00 $0.00 $0.00 $0.00
$100.00 24 20 20 Estimate.
N/A
Graywater 14,565
Graywater Action Study, September 2013
$0.00
$100.00
$100.00 $0.00 $0.00
$100.00
$250.00 0 20 10
Not thoroughly researched or known -- chose 10 years as an inbetween 5-15 yrs seen in a few sources.
We included a $10/yr customer maintenance cost for replacing mulch. $250/customer is average DIY cost, from Greywater Action study 2013. Also included arbitrary $2,500 for admin costs for running workshops and such. N/A
GHHC Landscape Audits 27,729
Sylvir Consulting Technical Memo****
$0.00 $0.00 $0.00 $0.00
$62.00
$62.00 $0.00 537 500 5
Provided by AWE Model, citing CUWCC, 2005, "BMP Costs and Savings Study: A Guide to the Data and Methods for Cost Effectiveness Analysis of Urban Water Conservation Best
Service cost $62 = $80 (BWP cost) - $18 (MWD funding) N/A
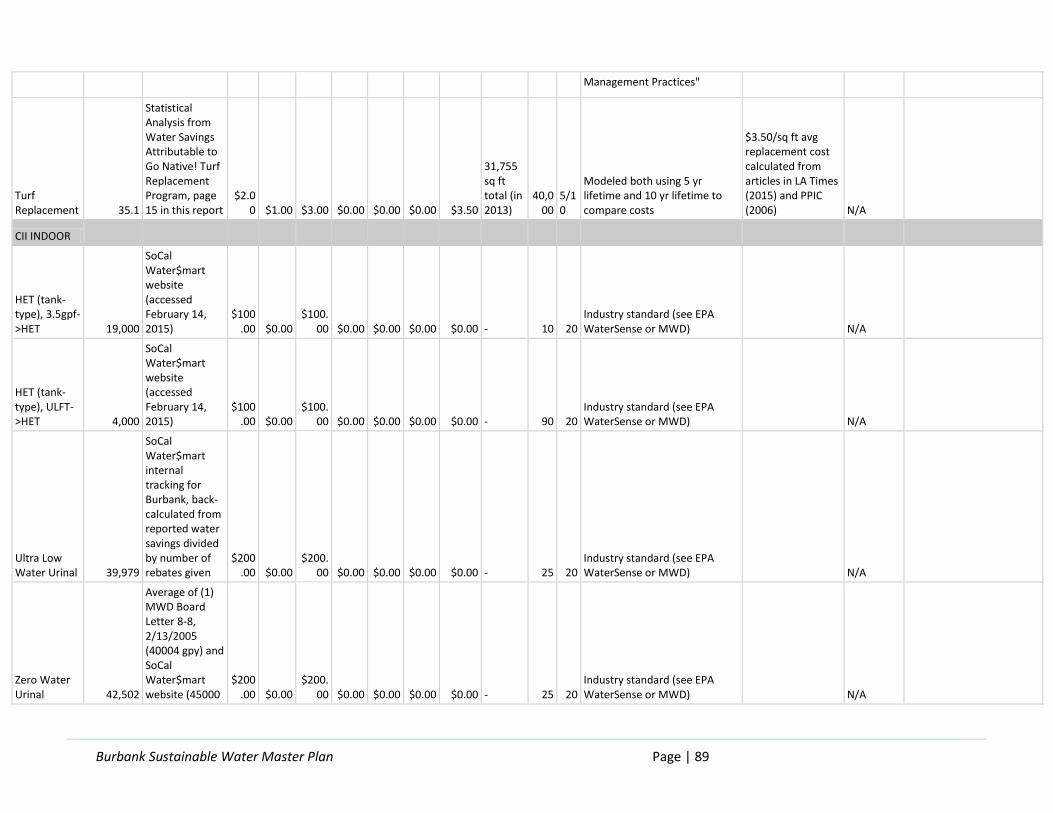
Burbank Sustainable Water Master Plan Page | 89
Management Practices"
Turf Replacement 35.1
Statistical Analysis from Water Savings Attributable to Go Native! Turf Replacement Program, page 15 in this report
$2.00 $1.00 $3.00 $0.00 $0.00 $0.00 $3.50
31,755 sq ft total (in 2013)
40,000
5/10
Modeled both using 5 yr lifetime and 10 yr lifetime to compare costs
$3.50/sq ft avg replacement cost calculated from articles in LA Times (2015) and PPIC (2006) N/A
CII INDOOR
HET (tank-type), 3.5gpf->HET 19,000
SoCal Water$mart website (accessed February 14, 2015)
$100.00 $0.00
$100.00 $0.00 $0.00 $0.00 $0.00 - 10 20
Industry standard (see EPA WaterSense or MWD)
N/A
HET (tank-type), ULFT->HET 4,000
SoCal Water$mart website (accessed February 14, 2015)
$100.00 $0.00
$100.00 $0.00 $0.00 $0.00 $0.00 - 90 20
Industry standard (see EPA WaterSense or MWD)
N/A
Ultra Low Water Urinal 39,979
SoCal Water$mart internal tracking for Burbank, back-calculated from reported water savings divided by number of rebates given
$200.00 $0.00
$200.00 $0.00 $0.00 $0.00 $0.00 - 25 20
Industry standard (see EPA WaterSense or MWD)
N/A
Zero Water Urinal 42,502
Average of (1) MWD Board Letter 8-8, 2/13/2005 (40004 gpy) and SoCal Water$mart website (45000
$200.00 $0.00
$200.00 $0.00 $0.00 $0.00 $0.00 - 25 20
Industry standard (see EPA WaterSense or MWD)
N/A

Burbank Sustainable Water Master Plan Page | 90
gpy) accessed 2/14/15
Connectionless Food Steamers 81,500
SoCal Water$mart website (accessed 3/5/15)
$485.00 $0.00
$485.00 $0.00 $0.00 $0.00 $0.00 - 5 10
SoCal Water$mart website (accessed 3/5/15)
0.00382
Provided by AWE model, citing MWDSC (2008) Save Water, Save a Buck Program
Air-cooled Ice Machine 219,000
SoCal Water$mart website (accessed 2/14/15), assuming replacement of machine using 150 gallons cooling water per 100 lbs ice, 400 lbs per day
$1,000.0
0 $0.00 $1,00
0.00 $0.00 $0.00 $0.00 $0.00 - 5 7
Federal Office of Energy Efficiency & Renewable Energy, Air-Cooled Ice Machines
N/A
Cooling Tower Conductivity Controller 546,639
Average of (1) MWD Board Letter 7-7, 8/1997 (Assumes office building, open 5days/week) and (2) 800,000GPY from SoCal Water$mart website (Accessed 2/14/15)
$625.00 $0.00
$625.00 $0.00 $0.00 $0.00 $0.00 - 5 5 MWD Board Letter 7-7, 8/1997
N/A
Cooling Tower ph Controller 633,323
MWD Board Letter 8-8, 12/13/2005 (Assumes office bldng, 5 days/week) 84,4430GPY*0.75 (to adjust for behavior)
$1,750.0
0 $0.00 $1,75
0.00 $0.00 $0.00 $0.00 $0.00 - 5 5 MWD Board Letter 8-8, 12/13/2005
N/A
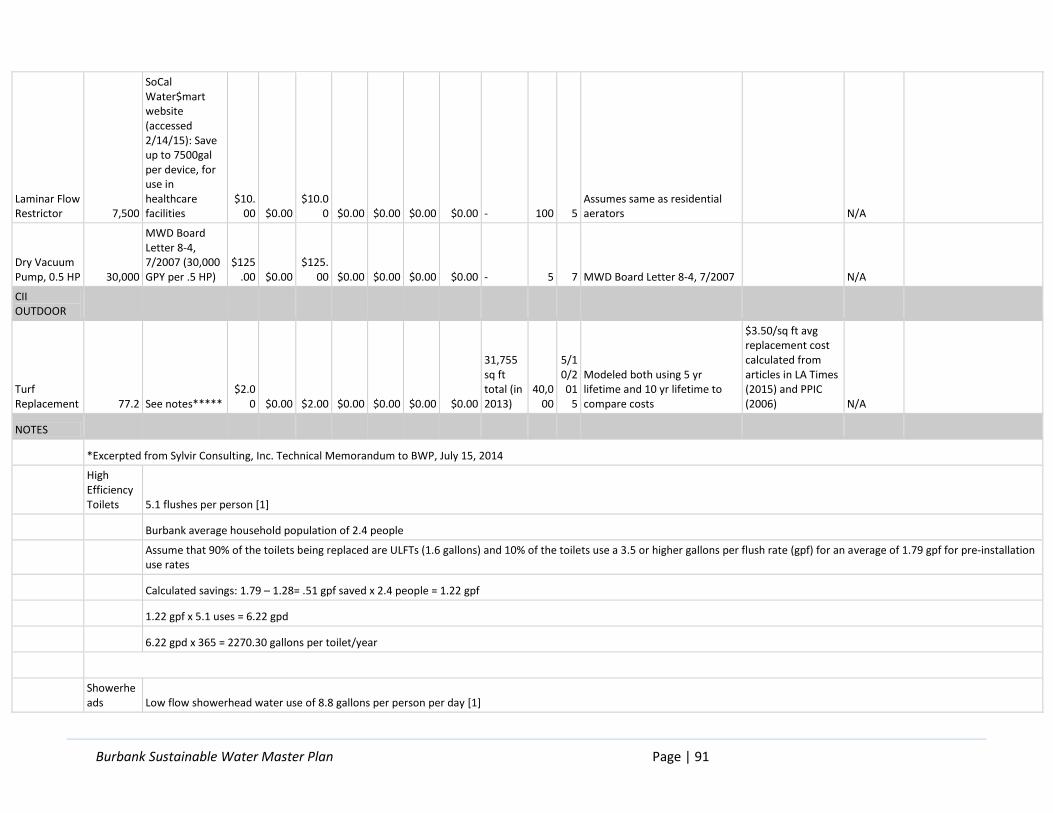
Burbank Sustainable Water Master Plan Page | 91
Laminar Flow Restrictor 7,500
SoCal Water$mart website (accessed 2/14/15): Save up to 7500gal per device, for use in healthcare facilities
$10.00 $0.00
$10.00 $0.00 $0.00 $0.00 $0.00 - 100 5
Assumes same as residential aerators
N/A
Dry Vacuum Pump, 0.5 HP 30,000
MWD Board Letter 8-4, 7/2007 (30,000 GPY per .5 HP)
$125.00 $0.00
$125.00 $0.00 $0.00 $0.00 $0.00 - 5 7 MWD Board Letter 8-4, 7/2007
N/A
CII OUTDOOR
Turf Replacement 77.2 See notes*****
$2.00 $0.00 $2.00 $0.00 $0.00 $0.00 $0.00
31,755 sq ft total (in 2013)
40,000
5/10/201
5
Modeled both using 5 yr lifetime and 10 yr lifetime to compare costs
$3.50/sq ft avg replacement cost calculated from articles in LA Times (2015) and PPIC (2006) N/A
NOTES
*Excerpted from Sylvir Consulting, Inc. Technical Memorandum to BWP, July 15, 2014
High Efficiency Toilets 5.1 flushes per person [1]
Burbank average household population of 2.4 people
Assume that 90% of the toilets being replaced are ULFTs (1.6 gallons) and 10% of the toilets use a 3.5 or higher gallons per flush rate (gpf) for an average of 1.79 gpf for pre-installation use rates
Calculated savings: 1.79 – 1.28= .51 gpf saved x 2.4 people = 1.22 gpf
1.22 gpf x 5.1 uses = 6.22 gpd
6.22 gpd x 365 = 2270.30 gallons per toilet/year
Showerheads Low flow showerhead water use of 8.8 gallons per person per day [1]
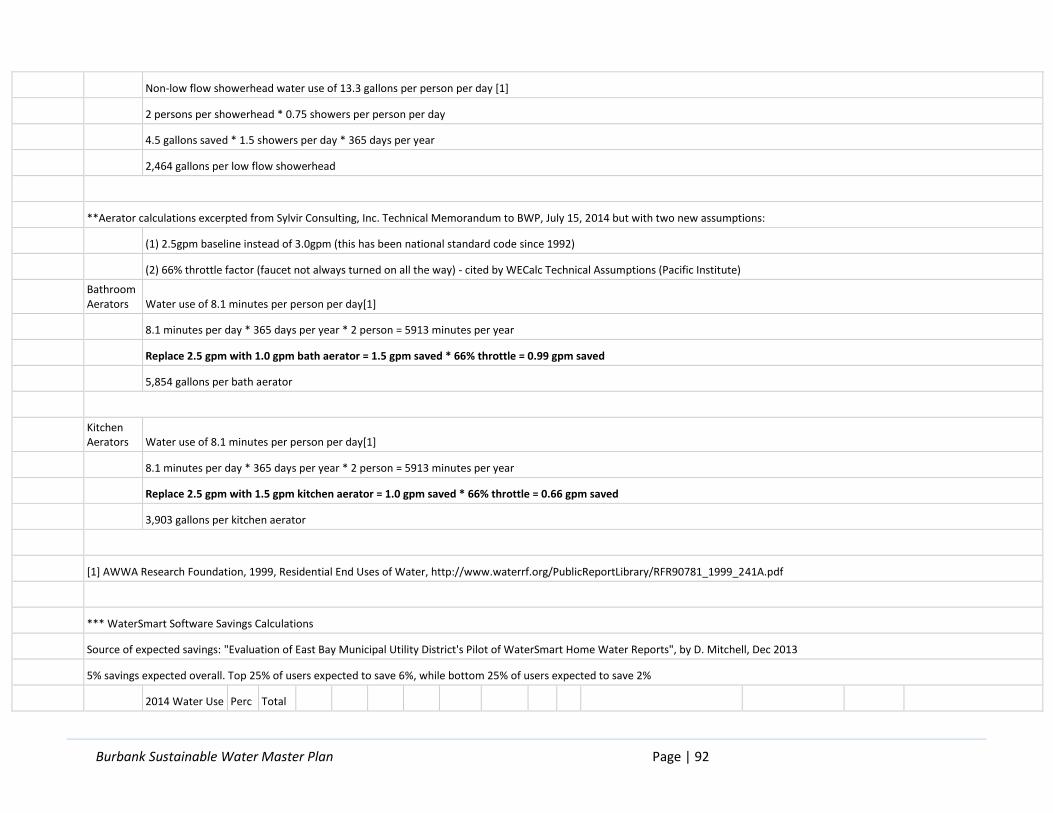
Burbank Sustainable Water Master Plan Page | 92
Non-low flow showerhead water use of 13.3 gallons per person per day [1]
2 persons per showerhead * 0.75 showers per person per day
4.5 gallons saved * 1.5 showers per day * 365 days per year
2,464 gallons per low flow showerhead
**Aerator calculations excerpted from Sylvir Consulting, Inc. Technical Memorandum to BWP, July 15, 2014 but with two new assumptions:
(1) 2.5gpm baseline instead of 3.0gpm (this has been national standard code since 1992)
(2) 66% throttle factor (faucet not always turned on all the way) - cited by WECalc Technical Assumptions (Pacific Institute)
Bathroom Aerators Water use of 8.1 minutes per person per day[1]
8.1 minutes per day * 365 days per year * 2 person = 5913 minutes per year
Replace 2.5 gpm with 1.0 gpm bath aerator = 1.5 gpm saved * 66% throttle = 0.99 gpm saved
5,854 gallons per bath aerator
Kitchen Aerators Water use of 8.1 minutes per person per day[1]
8.1 minutes per day * 365 days per year * 2 person = 5913 minutes per year
Replace 2.5 gpm with 1.5 gpm kitchen aerator = 1.0 gpm saved * 66% throttle = 0.66 gpm saved
3,903 gallons per kitchen aerator
[1] AWWA Research Foundation, 1999, Residential End Uses of Water, http://www.waterrf.org/PublicReportLibrary/RFR90781_1999_241A.pdf
*** WaterSmart Software Savings Calculations
Source of expected savings: "Evaluation of East Bay Municipal Utility District's Pilot of WaterSmart Home Water Reports", by D. Mitchell, Dec 2013
5% savings expected overall. Top 25% of users expected to save 6%, while bottom 25% of users expected to save 2%
2014 Water Use Perc Total
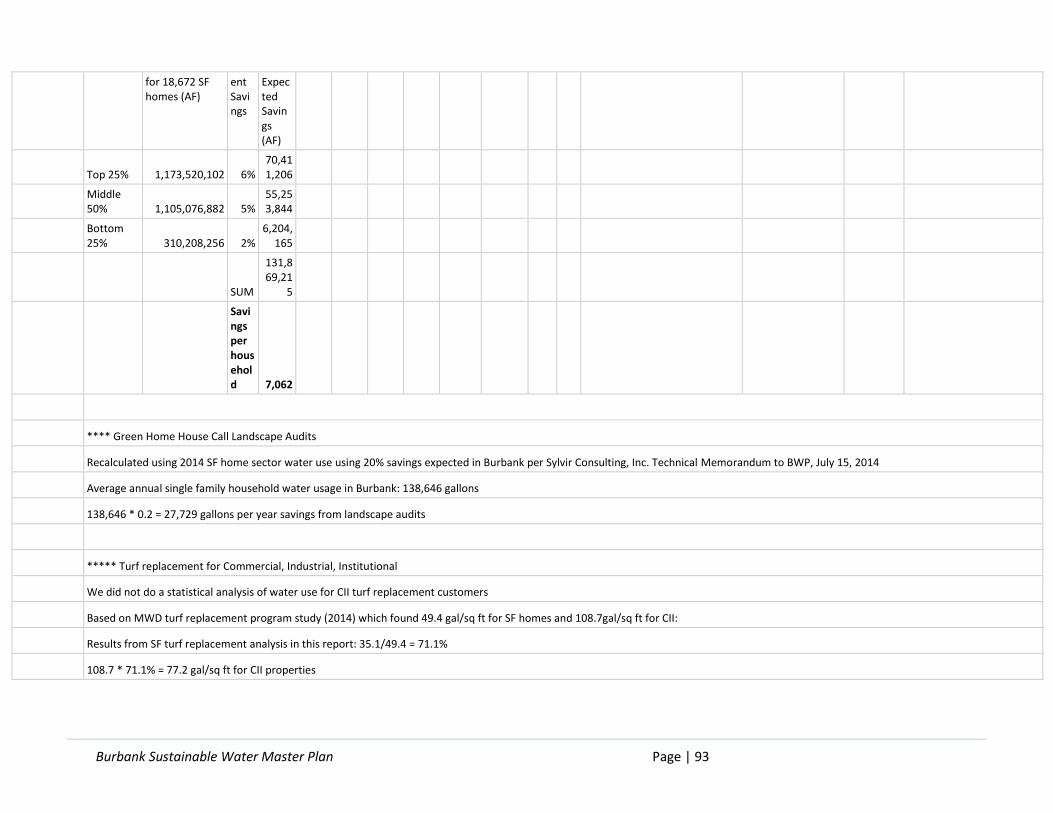
Burbank Sustainable Water Master Plan Page | 93
for 18,672 SF homes (AF)
ent Savings
Expected Savings (AF)
Top 25% 1,173,520,102 6%
70,411,206
Middle 50% 1,105,076,882 5%
55,253,844
Bottom 25% 310,208,256 2%
6,204,165
SUM
131,869,21
5
Savings per household 7,062
**** Green Home House Call Landscape Audits
Recalculated using 2014 SF home sector water use using 20% savings expected in Burbank per Sylvir Consulting, Inc. Technical Memorandum to BWP, July 15, 2014
Average annual single family household water usage in Burbank: 138,646 gallons
138,646 * 0.2 = 27,729 gallons per year savings from landscape audits
***** Turf replacement for Commercial, Industrial, Institutional
We did not do a statistical analysis of water use for CII turf replacement customers
Based on MWD turf replacement program study (2014) which found 49.4 gal/sq ft for SF homes and 108.7gal/sq ft for CII:
Results from SF turf replacement analysis in this report: 35.1/49.4 = 71.1%
108.7 * 71.1% = 77.2 gal/sq ft for CII properties
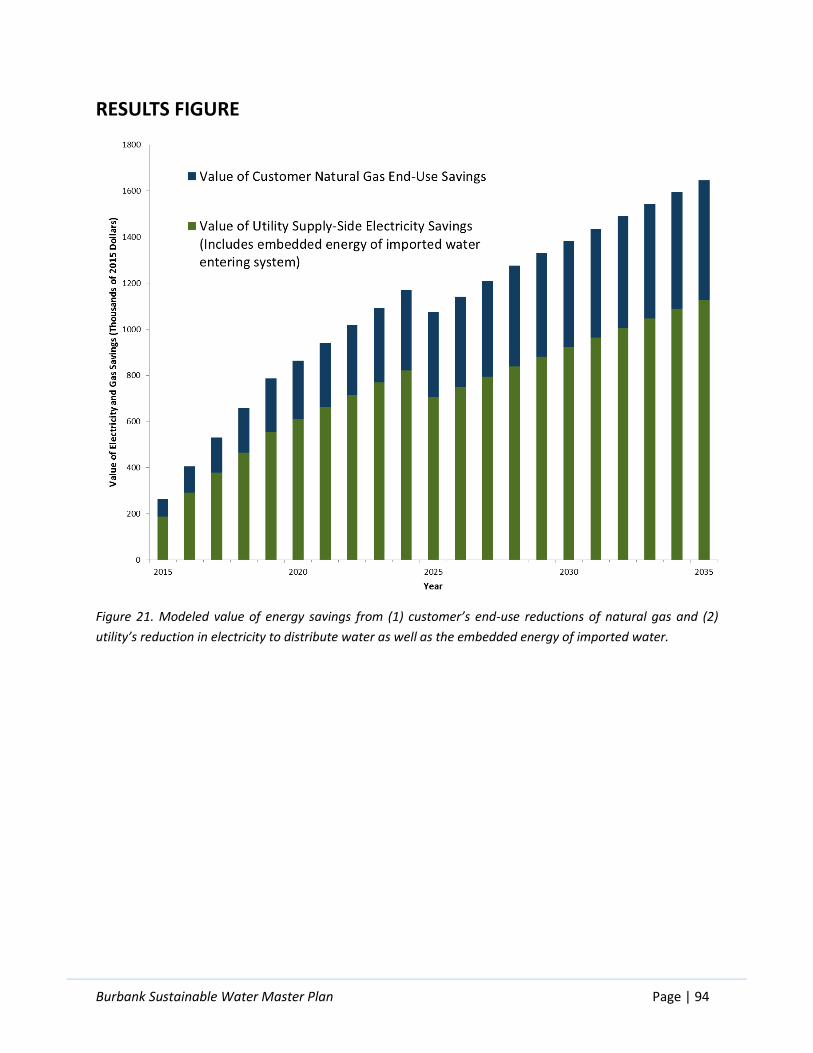
Burbank Sustainable Water Master Plan Page | 94
RESULTS FIGURE
Figure 21. Modeled value of energy savings from (1) customer’s end-use reductions of natural gas and (2)
utility’s reduction in electricity to distribute water as well as the embedded energy of imported water.
Burbank Sustainable Water Master Plan Page | 95
APPENDIX D – RATE STRUCTURES APPENDIX
CASE STUDY #1: LADWP134
Description of rate structure:
• Began in 1993 with a seasonal increasing block rate structure with no fixed charges and no rate
adjustment mechanisms.
• Budget-based rate system implemented in 1995. It’s increasing block rates based on lot size, climate
zone, and household size. There are two tiers, or blocks, for single-family residential customers.
Both of these tiers are seasonally adjusted. The seasons are determined based on customer class
and tier.
• During periods of limited water supply availability, shortage year rates are imposed. Under the
shortage year rate adjustment, customers’ Tier 1 allotment will be reduced by 15%, meaning that
customers begin paying the Tier 2 rate after they exceed the newly reduced Tier 1 allotment.
• The first tier rate includes a revenue adjustment factor to ensure fixed cost recovery. This revenue
adjustment factor can be adjusted based on changes in water availability and costs associated with
water quality improvements, security, and regulations.
• The second tier reflects the seasonally adjusted cost of marginal water supply.
• Reduced rates are available to low-income, disabled, and senior customers.
Successes:
• Incorporated strong customer participation and feedback during rate structure design phase. This
included public workshops, hearings, and comment cards. Program design was adjusted to
accommodate common concerns, including variability within weather zones, lot size, and household
size.
• Clearly communicated the rationale for the water budget system, including both the structure and
the rates. Once customers understood the reasons for the program, they evaluated it as fair.
• Has successfully maintained utility revenues and incentivized water use efficiency for 20 years.
• Water budget rate structure has improved revenue stability and stabilized demand as customers
have made long-term water efficiency adjustments and investments. 135 This has resulted in revenue
stability and ease in setting rates.
Challenges:
• Program is complex to administer, especially during initial start-up phase.
• Additional staff and staff training is needed to modify billing systems, obtain property and
household data, and interact with customers.
Burbank Sustainable Water Master Plan Page | 96
CASE STUDY #2: IRVINE RANCH WATER DISTRICT136
Description of rate structure:
• Adapted a budget-based water rate system in 1991.
• Water budget is based on household size, size of landscaped area, and season.
• Five tiers that are based on a household’s percent use of their allocated water budget: low volume
(0-40% use of allocation); base rate (41-100%); inefficient (101-130%); excessive (131-160%); and
wasteful (161+%).
• Rates for each tier increase sharply, with the price approximately doubling for each tier above the
base rate.
Successes:
• Focused on developed a pricing system with a very direct and defensible nexus between the cost of
water and the price that customers pay for it.
• In the first 13 years of the program, average outdoor water use decreased by 61% (IRWD 2013).
Average water use dropped from 4.4 AF/ac/yr to 1.9 AF/ac/yr.
• Rates are easy for customers to understand and include low fixed costs ($10/month) and no variable
surcharges added onto the published rates.
• Strong emphasis on public education about program, including its scientific basis.
• Proactive customer service: house calls and engaging with customer via surveys and in-person visits.
Challenges:
• Initial public reaction was mixed. The highest tier of water use was labelled “abusive water use,”
which many residents responded negatively to.
CASE STUDY #3: EASTERN MUNICIPAL WATER DISTRICT OF SOUTHERN CALIFORNIA137
Description:
• Adapted a budget-based water rate system in 2009.
• Rate structure has 4 blocks: efficient indoor use, efficient outdoor use, excessive use, and wasteful
use. The price per unit of water increases approximately 80% with each tier.
• Fixed rates are very low: less than $2/month for a single-family household.
Successes:
• Under budget-based rates, water demand was 18% lower than would have been expected under the
previous uniform rates. These changes were gradual as customers learned about the system, but the
reductions have now been sustained for three years.
Burbank Sustainable Water Master Plan Page | 97
• The largest water reductions have come from high/inefficient water users, who decreased their use
by an average of 25-30%.
• Without implementing the budget-based rate structure, average price for water would have
increased by 48% over the three year timeframe in order to meet demand, compared with the 3.7%
that it increased under the budget-based system.
Challenges:
• The local press has published a number of stories about very high water users expressing
displeasure with their correspondingly high water bills.
• Customers required some time to adapt to the new rate structure and to realize water savings. Only
after about two years did the water conservation level off.
CASE STUDY #4: MOULTON NIGUEL WATER DISTRICT138
Description:
• Initially implemented a five tier budget based rate system in 2011, which was received poorly due to
lack of outreach and communication.
• Tiers 1-5 are: conservation (indoor budget); efficient (outdoor water budget); inefficient (exceeding
total water budget by up to 25%); excessive (exceeding total water budget by up to 50%); and
wasteful (exceeding total water budget by more than 50%).
• Budget is calculated based on household size, size of irrigated land, evapotranspiration, and
landscape type.
Successes:
• Overcame initial public reluctance by launching an intensive public outreach and education
campaign, including public meetings, online material, and more accurate bill calculators.
Challenges:
• Implementation was rocky due to lack of communication to customers. Residents reacted negatively
to increased bills that were actually a result of a previously-scheduled rate increase rather than the
new rate structure. Online calculators provided before the roll-out of the new rate structure were
inaccurate, which added to the confusion.
• Due to lack of communication about the basis of the water budget calculations, many
residents accursed the water district of unfairly setting unrealistically low budgets.
Burbank Sustainable Water Master Plan Page | 98
APPENDIX E – COMMERCIAL, INDUSTRIAL, AND INSTITUTIONAL WATER EFFICIENCY APPENDIX
SUMMARIES OF CASE STUDY INTERVIEWS:
METROPOLITAN WATER DISTRICT: FINDING THE NEXT TIER OF CII WATER EFFICIENCY (PRESENTED AT WATERSMART INNOVATIONS 2013 CONFERENCE)139
• Used County Business Patterns (zip-code level data on businesses by NACIS business code), matched
identified businesses with sector-level water use from USBR study
• Identified business types within service region which had (1) significant water use, (2) significant
number of establishments, and (3) not already targeted by conservation programs
• Ended up piloting a targeted fitness center toilet and urinal rebate program (food stores were
another option)
• Advice:
• Analyze your customer base
• Narrow down the scope
• Go into the field to see real world processes
• Find target market you’re not reaching
• Design program for your needs around existing program or totally new program
TAMPA BAY WATER:
1) QUANTIFYING CII WATER USE EFFICIENCY AND MARKET POTENTIAL - PRESENTATION AT WATERSMART INNOVATIONS CONFERENCE 2014140
2) 2013 WATER DEMAND MANAGEMENT PLAN141
• Water Demand Management Plan constructed demand profile of SF, MF, and CII, then chose 10
efficiency programs/technologies to implement to decrease demand, 6 of which were
nonresidential (CII) → (CII is 24% of total usage, about same as Burbank)
• Cooling Towers IDed as most cost-efficient, with large water savings
• Used utility accounts data, Florida Department of Revenue property use code designations, and
Government datasets on school populations to disaggregate CII customer data by sector to:
• Develop water use metrics to benchmark and compare water use
• Estimate and measure intensity of water end use
• Used national benchmarks from American Water Works Association and Federal Energy
Management Program (e.g. gallons/meal served, gallons/school seat, etc) → compared this to actual
disaggregated sector data
Burbank Sustainable Water Master Plan Page | 99
• Contains a number of interesting methods and metrics for analyzing CII water use for efficiency
opportunities
• Disaggregation by sector, # of locations, distribution of total CII water use
• Concentration curve -- assesses # of customers occurring in distribution of water use within
a single industry (to ID large volumes water in low proportion of customers)
• Prioritization of targeting of sectors with relatively large number of users and high intensity
of water use per location
MUNICIPAL WATER DISTRICT OF ORANGE COUNTY - WATER SMART HOTEL PROGRAM142
• Has been running 2008-current, as a result of MWDOC BMP no.4 for CUWCC (Conservation
Programs for CII) → goal to save 7,070 AF over 10 yrs
• Offers free 2-4 hour indoor/outdoor water use surveys to Orange County hotels and motels
(performed by a consultant, including physical inspection and flow test of most plumbing fixtures
throughout facility)
• Followed by customized facility reports with specific recommendations and technical support
• Connects OC hotels/motels with MWD Save Water Save a Buck program, funding augmented by
MWDOC member agencies and with grant funds from CA Dep’t of Water Resources and US Bureau
of Reclamation
• Primary target: pre-1992 hotels
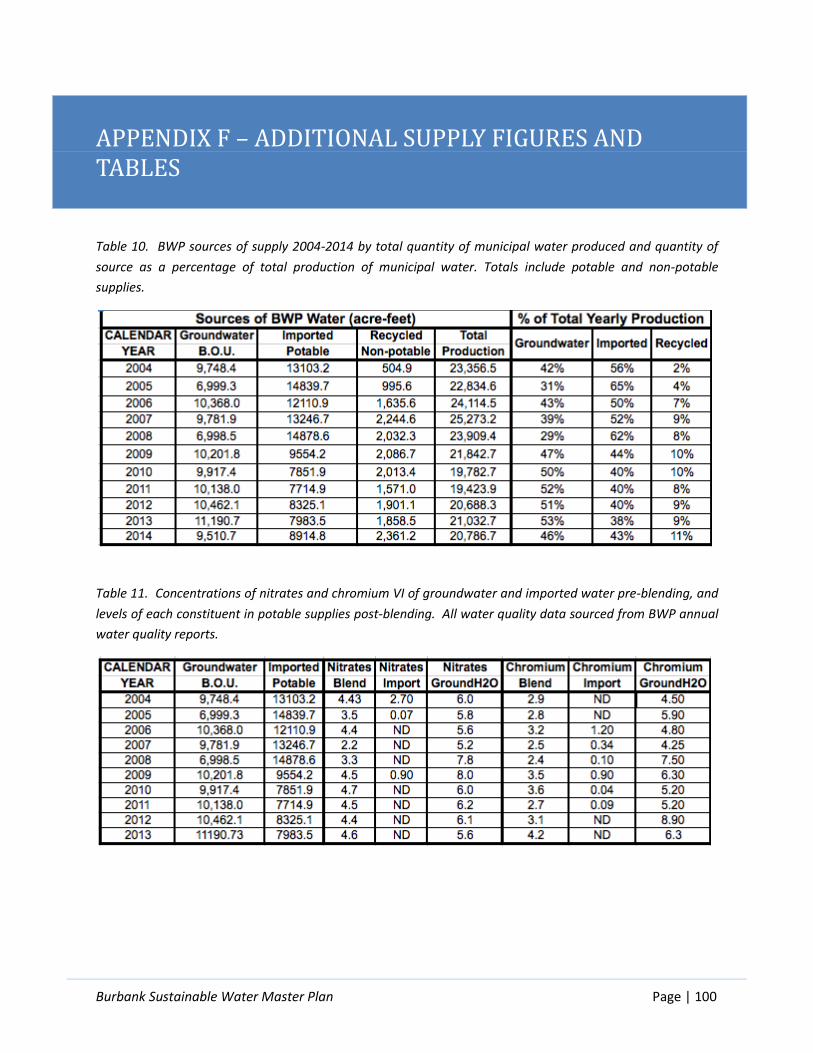
Burbank Sustainable Water Master Plan Page | 100
APPENDIX F – ADDITIONAL SUPPLY FIGURES AND TABLES
Table 10. BWP sources of supply 2004-2014 by total quantity of municipal water produced and quantity of
source as a percentage of total production of municipal water. Totals include potable and non-potable
supplies.
Table 11. Concentrations of nitrates and chromium VI of groundwater and imported water pre-blending, and
levels of each constituent in potable supplies post-blending. All water quality data sourced from BWP annual
water quality reports.
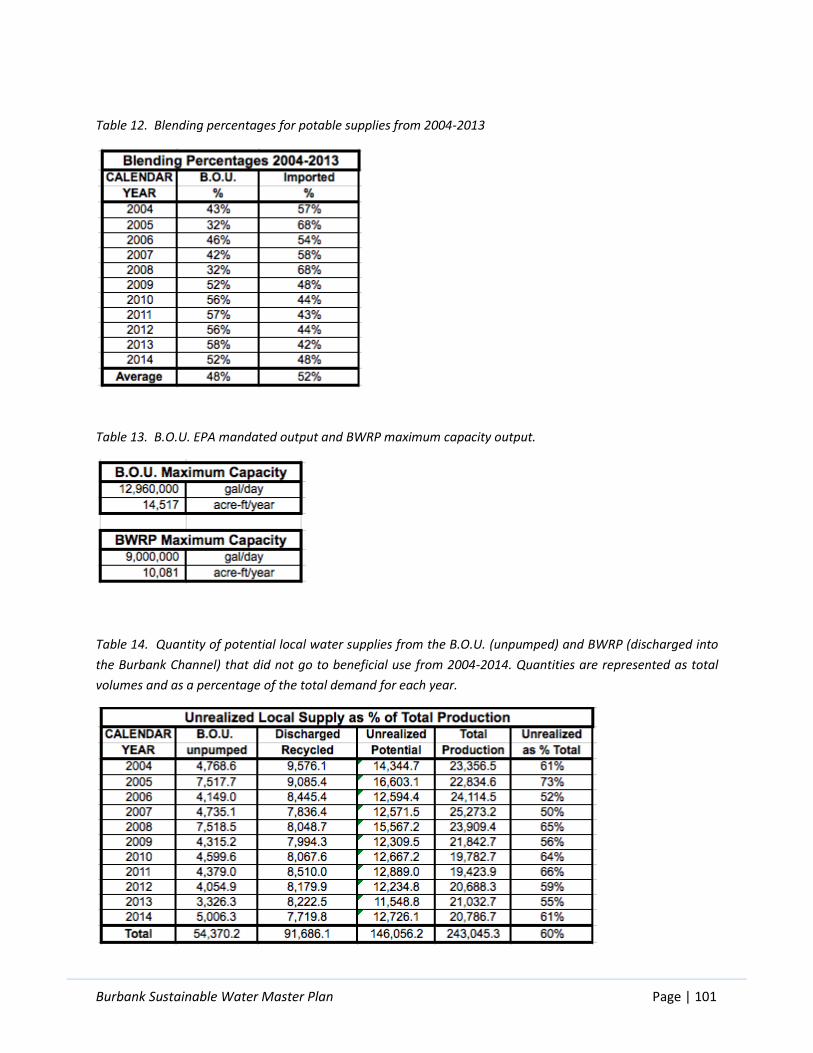
Burbank Sustainable Water Master Plan Page | 101
Table 12. Blending percentages for potable supplies from 2004-2013
Table 13. B.O.U. EPA mandated output and BWRP maximum capacity output.
Table 14. Quantity of potential local water supplies from the B.O.U. (unpumped) and BWRP (discharged into
the Burbank Channel) that did not go to beneficial use from 2004-2014. Quantities are represented as total
volumes and as a percentage of the total demand for each year.

Burbank Sustainable Water Master Plan Page | 102
Figure 22. The blue line shows the annual cumulative change in groundwater storage for the SFB from 1930-
2013. The dotted red lines are the upper and lower bounds of aquifer levels that the SFB must attain in order
to comply with the “safe yield” designation set be the Watermaster. Except for two brief anomalies, the SFB
has consistently been out of compliance. The dashed dark red line separates “available” stored water credits
from “reserved” stored water credits. The solid red line displays the additional reduction in stored
groundwater that would occur if entitled parties extracted their full allocation.143

Burbank Sustainable Water Master Plan Page | 103
APPENDIX G – GRAYWATER APPENDIX
SUMMARIES OF CASE STUDY INTERVIEWS:
SAN FRANCISCO PUBLIC UTILITIES COMMISSION (2.6 MILLION CUSTOMERS)
• Rebate: Offer a $112 subsidy towards the cost of a $117 laundry-to-landscape graywater kit with
nearly all of the necessary parts (brass 3-way valve, T’s, piping, sample soaps, etc). Funded through
operating revenue. Participants have to meet eligibility criteria (single family or 2-unit home, yard
at-grade or downslope, attend mandatory workshop, etc)
• Workshops: Workshop attendance is mandatory to get subsidized kit. Held 17 workshops (operated
by a vendor) from 2011-2014.
• Participation: 170 applications submitted with 117 kits sold (from program launch in 2011 through
contract end in 2014 -- currently working to reissue program in same form).
• Program Effectiveness: Twice per year evaluation of water use for homes that installed graywater
systems. Includes looking at water use data PLUS a survey sent after workshop attendance to
determine a system installation date and other data such as how much yard area is irrigated with
graywater.
• Other key notes:
• Water use measured in discrete units of CCF, so water savings information is not very
detailed. Thus, they’ve seen a somewhat even split between users that see an increase and
decrease in average water usage. This is often due to customers adding new plants (e.g. fruit
trees) when installing graywater.
• Post-workshop survey shows most customers are installing graywater systems because they
are interested in helping the environment and reducing their water bill.
• SFPUC developed a thorough and user-friendly design manual through collaboration with
the Departments of Public Health and Building Inspection as well as Laura Allen, a local
graywater expert.
• SFPUC started offering a free tool-kit for 3-5 day rental because many customers didn’t have
appropriate tools in their house for graywater installation.
• SFPUC started offering optional free onsite technical assistance -- hired local graywater
expert to visit homes by customer request for 0.5-1.0 hour consultation, but not manual
installation assistance.
Burbank Sustainable Water Master Plan Page | 104
SANTA CLARA VALLEY WATER DISTRICT (SANTA CLARA COUNTY 1.8 MILLION RESIDENTS)
• Rebate: $200 per laundry to landscape system (temporary rebate increase for first half of 2015,
previously $100). Pre-qualification question checklist (CA Building Code requirements) followed by a
required post-inspection to receive rebate.
• Workshops: They’ve held a series of how-to workshops with lots of attendance and multiple
speakers, but not a lot of follow-through even after hands-on workshops.
• Participation: 5-10 customers applied for rebates in the first year of the rebate program, but they
have many in-progress and expect to see more like 2-4 per month. However, SCVWD still sees this
as a success for building a solid community understanding of graywater and water reuse.
• Program Effectiveness: As a water wholesaler, participants sign an agreement form allowing release
of water usage from their individual municipal water supplier, but it takes a long time to receive
data, so they haven’t done a water savings study yet.
• Other key notes:
• SCVWD has received 100s of calls in the last year from interested customers, but deal with
common misconceptions such as graywater being stored with rainwater in barrels. Many
customers get discouraged when they hear the laundry-to-landscape plumbing code
requirements.
• Used to do both pre- and post-inspection, but now just as qualifying questions and ask for
landscape photos upfront and follow-up with actual post-inspection. On-site pre-inspection
still happens if customers need hand-holding.
• Having a pre-qualification phone call is still a very useful way to educate customers about
other water efficiency programs.
• Graywater program is funded by revenues. Some cost-sharing with other cities.
• Local and regional boards of health and building departments were mostly on board -- made
sure to broadcast intentions and program details well ahead of implementation.
CITY OF SANTA ROSA (50,000 WATER SERVICE CONNECTIONS)
• Rebate: $75 per qualifying fixture that reroutes graywater (typically laundry to landscape) OR $200
for every 1,000 gallons of sustained reduction in monthly water consumption (typically a more
complex permitted engineered system)
• Workshops: Offer about 4-5 graywater workshops per year with a good attendance rate, but lower
installation rate.
• Participation: About 45-50 customers have fully completed installations from 2010-2014
• Program Effectiveness: Haven’t done utility-scale study, but did participate in a non-profit study
(Greywater Action) of graywater system water savings and quality (which found 14,465
gal/system/yr water savings and no detrimental water quality issues)144

Burbank Sustainable Water Master Plan Page | 105
CITY OF LONG BEACH, OFFICE OF SUSTAINABILITY - GRAYWATER PILOT PROGRAM (POPULATION ~462,000)
• Rebate: Direct install pilot program in 2011-2012; cost about $1,500 per install to city (free for
homeowner) because of professional plumber, crew of young adult field team (from a job training
and readiness program), and materials (a relatively small cost, ~$200)
• Workshops: N/A
• Participation: Lots of interest (~180 people) but 33 homes selected based on feasibility criteria
(enough irrigable landscaping, landscaping close enough (<50ft) to clothes washer)
• Results:
• Long Beach Water Department tracked water usage and found small increase in water
usage, though it varied increase/decrease/no change across all homes.
• Many factors possible to explain lack of significant water savings, though not able to
statistically show significance:
• drought
• lack of feeling of “ownership” and vigilant maintenance by homeowner
• user error (turned on diverter valve to sewer, forgot to turn back)
• landscaper turns back on potable water irrigation system
• SOME customers (~15%) added new vegetation
• system owners may use more water indoors, thinking they’re being conservative
outdoors
• Able to dovetail with some homes which were concurrently participating in turf
replacement program -- but some landscapers who picked plant palette didn’t know
greywater was being installed. Some CA-Friendly plants are incompatible with larger water
streams coming from clothes washer, but most are doing fine. Compatible plant water use:
fruit trees that already exist.
CITY OF SANTA MONICA, OFFICE OF SUSTAINABILITY & THE ENVIRONMENT - GRAYWATER PILOT PROGRAM (POPULATION ~92,500)
• Rebate: $200 for parts + education through workshops + direct-install
• Workshops and Participation: Offered 2 full-day workshops (Saturday education, Sunday hands-on
installation), taught by Greywater Action expertise, but only had 1 Santa Monica resident sign up, so
workshops were cancelled
• Pilot program occurred right after California Building Code made laundry to landscape
systems legal without a permit
• Program was heavily advertised (even had 50-60 people outside of the city who were
interested), but still didn’t see lot of participation
Burbank Sustainable Water Master Plan Page | 106
• Reasons why customers might not have gotten involved: Santa Monica residents don’t want
DIY graywater; laundry to landscape (permitless) still seen as complicated
• Other key notes:
• Based their pilot program on a successful and robust graywater program in Santa Rosa, CA
(see notes above)
• Multi-family might be a significant future opportunity for graywater -- new, rapidly growing
mixed-use developments (housing units on floors 2+, commercial on floor 1) are currently
under study for potentially large water production for graywater toilet flushing and/or
landscape watering
• Water from office buildings is not significant enough for graywater
• Santa Monica sees investing in high-efficiency clothes washers, other plumbing fixtures, and
efficient irrigation systems as a more cost-effective way to reduce water usage
CITY OF SANTA CRUZ (POPULATION ~63,000)
• Rebate: $150 for Laundry to Landscape
• Workshops: Required for customer to get the rebate. Multiple workshops held in surrounding cities
thanks to a coalition effort, customers allowed to attend any of them. Some or all were held at a
volunteer’s house: very hands-on.
• Participation: Low, despite adequate marketing and strong public interest in the program (including
urging for support FROM the City Council). 3-4 systems installed in 2014. Reasons that customers
might have been dissuaded: big learning curve, limitations of L2L requirements, can’t store
graywater, and its typical water pulses from washing machine aren’t necessarily best for drought-
tolerant landscapes or effective for watering lawns since has to be in a mulch basin.
• Other key notes:
• Worked with Central Coast Greywater Alliance (run by Ecology Action) which acted as a
coalition for coordinating efforts of surrounding cities. The website maps out successful
greywater system installations in the Central Coast region.
• Education IDed as a major component; most people don’t know what graywater is, but are
interested.
• City residents who signed up were required to sign a Use Agreement for Public Works Office
(understanding of limitations, etc).
Burbank Sustainable Water Master Plan Page | 107
CENTRAL COAST GREYWATER ALLIANCE (WORKS WITH MONTEREY, SANTA CRUZ, AND SANTA CLARA COUNTIES REGION)
SHERI LEE BRYAN, PROGRAM DIRECTOR (EMPLOYEE OF ECOLOGY ACTION)
• “Mission is to facilitate the adoption of code-compliant graywater systems into the culture of
mainstream water conservation practices in Central Coast communities through information
exchange and public education initiatives”
• Has seen many people install graywater systems in Central Coast (incl. Santa Cruz) after attending
packed workshops, but who don’t utilize the utility rebates, possibly because they don’t want
inspection or have to bother with the rebate process when parts are relatively inexpensive (~$150)
→ 90% of surveyed participants installed or intend to install soon.
• Most important aspect of greywater programs is public education: people’s tendencies are to want
to store and filter graywater which are not allowed for L2L.
• Water savings vary across the board -- really requires careful planning that graywater is offsetting
potable water in order to provide savings (e.g. take an irrigation pipe off of potable, vs installing new
vegetation)
• However, there’s a huge customer awareness potential value, graywater provides a visceral
reminder of water usage and efficiency activities.
GREYWATER ALLIANCE
LAURA ALLEN, FOUNDING MEMBER AND CALIFORNIA GREYWATER EXPERT
• Key items for an effective graywater rebate program:
• Develop a program using the technical expertise or local experts
• Have all the “pieces” for success in place, e.g. local stores must carry right parts, local
irrigation stores trained for providing advice,
• Match program with type of resident in the city (e.g. Sonoma County residents are very DIY-
oriented, Santa Monica residents likely not!)
• Have good local-specific resources/manuals (be wary of poor resources on the Internet)
• Merge greywater with landscaping
• Train local landscapers. Often landscapers are more suited to install affordable systems than
plumbers
• Greywater Action study (2013) looked at home water use, but she expects to see greater water
savings through time 2-3 yrs down the road
• As far as she knows, nobody is using smart meter data in California to study graywater -- this would
be very useful, as well as setting up a statistical study to control for confounding factors ahead of
time
• 50%-75% of systems she’s looked at use high-efficiency clothes washers (12-15 gal per load) which
CAN provide occasional challenges, but are usually fine

Burbank Sustainable Water Master Plan Page | 108
APPENDIX H – RAINWATER HARVESTING APPENDIX
RAIN BARREL/CISTERN MODEL PROCESS
• INPUTS:
• Rain barrel size (gallons)
• Roof area (sq ft)
• Water price ($/HCF)
• Area breakdown of native/drought tolerant plants, turf, and xeriscape/succulent (sq ft)
• Uses NCDC daily precipitation data recorded at station USC00041194 - “BURBANK VALLEY PUMP CA
US” from 1/1/1940 through 12/31/2014 [Columns H-J]
• Converts precipitation into gallons based on roof size at a rate of 934 gal/1500 sq ft for a 1” storm
[Column K]
• Calculates volume of water that can be captured depending on available rain barrel capacity from
day before [Column L]. Any remaining precipitation from a large storm or if the barrel was already
full is lost [Column N]
• Calculates potential daily water use based on water use factors145 and season where summer = May-
Oct and winter = Nov-Apr (e.g. if user input 1000 sq ft of turf, it would take 8.3 gpd in winter and 95
gpd in summer). If there was rain in the past 5 days, the model assumes no rain barrel drawdown
until the 6th day [Column O]
• Tracks rain barrel volume based on inflows, outflows, and volume from the day before [Colum Q]
• OUTPUTS (total and yearly average, if applicable):
• Total Precipitation (gallons equivalent)
• Total Water Utilized (gallons)
• Efficiency (Total Precipitation/Total Water Utilized)
• Water Bill Savings ($)
• % days with barrel use
SUMMARIES OF CASE STUDY INTERVIEWS:
CITY OF SANTA MONICA, OFFICE OF SUSTAINABILITY & THE ENVIRONMENT (POPULATION ~92,500)
• Rebate: Large cisterns (500+ gal) - up to $2,000 each (max 2), small cisterns (200-499 gal) - up to
$500 each (max 4), and rain barrels (less than 200 gal) - up to $200 each (max 8)
Burbank Sustainable Water Master Plan Page | 109
• Participation: 150-200 rebates in past five years. ~95% of customers use the rebate for standard 55-
gallon rain barrel, not cisterns.
• Funding: Originally through City water efficiency funding, then through State grant, now funded
through a stormwater parcel fee and clean beaches property tax.
• Reasons for implementation: 1) offset potable water to achieve 20% by 2020 sustainability goal and
water self-sufficiency, 2) stormwater volume and pollution prevention for Santa Monica Bay health
• Other key notes:
• Customers who apply for a rebate get annual follow-up letters to remind them about their
participation in the rebate program and also remind about doing an annual barrel check and
clean-out
FOOTHILL MUNICIPAL WATER DISTRICT (OVER 80,000 PEOPLE)
• Rebate: $0.15 per gallon (up to $2,000 per customer) for cisterns 300+ gallons; also participate in
MWD’s $75/barrel for up to 4 barrels (min 50 gallon) rain barrel program
• Participation: Cistern program began in 2015 so no information yet; rain barrel rebates were around
200 in the last ~1 year
• Funding: MWD’s Member Agency Administered Program for the cistern rebates; MWD processes
the regular rain barrel rebate program
• Reasons for implementation: Rain barrels became very popular in last year with the drought but
don’t have a large cost-savings. They introduced a cistern program to allow customers to capture
more rainfall for use in summer months and encourage more conservation. Larger lots in Foothill
MWD service area are amenable to cistern siting.
• Other key notes:
• TreePeople (nonprofit) helped Foothill MWD connect with Hey!TanksLA (cistern/rain barrel
vendor) who assisted with setting up the program and developing recommendations to
customers. Foothill also modeled parts of their program off of Santa Monica’s established
rain barrel rebate program.
HEY!TANKSLA, LOCAL RAINWATER HARVESTING CONTRACTOR
• Small, passive rain barrels are somewhat of a novelty - they fill too quickly, are too storage-
constrained to be useful in SoCal. Over many site visits, he’s seen people come to realize this pretty
quickly and lose interest.
• To make a significant impact on outdoor water use, you need an enormous tank, ~5,000+ gallons
• 1300-1500 gallon cistern can be quite useful if managed as a passive system by the owner (not
automatically fed into irrigation system with automatic controller), especially for raising awareness.
Burbank Sustainable Water Master Plan Page | 110
• Rainwater harvesting has qualitative value: homeowners who install any size of barrel have to view
home and yard as a mini-watershed with valuable resources, become conscious of water use.
Controlled barrel overflow into yard has large beneficial use, especially for infiltration in LA County.
• Commercial uses of rainwater harvesting through large cisterns, primarily outdoor irrigation, are
picking up. Lots of pressure in the industry to support this.
CITY OF SANTA CRUZ, WATER CONSERVATION OFFICE - RAIN BARREL PROGRAM (POPULATION ~63,000)
• Participant Cost: $50 for a subsidized 50-gallon Ivy brand rain barrel + $10 shipping. Rain barrels
shipped to Water Conservation Office which distributes them to customers at centralized location.
• Participation: Budget for the program has consistently run out due to high customer participation
(2,000+ rain barrels sold yearly)
• Funding: City budget. City Council strongly supports the program because residents support it. It is
also not an overwhelming expense because they do sell the barrels.
• Reasons for implementation: Well aware that 50-gal rain barrels are not very practical for
significant supply augmentation or economics, but the “feel good” effect, working with a more
water-conscientious community, and the chance to communicate more with customers pays
dividends.
• Other key notes:
• Cisterns have engineering complications -- the City requires a backflow device and yearly
testing for barrels 500+ gallons. Generally, any proposed wide-scale rebate/project that
involves permitting has a pushback.
CITY OF SAN DIEGO, PUBLIC UTILITIES DEPARTMENT - RAIN BARREL PROGRAM (POPULATION 1.356 MILLION)
• Rebate: $1 per gallon, up to $400 total (minimum 50 gallons)
• Participation: 337 rain barrels rebated in FY2012; in FY14-15, already have 300 rebates!
• Funding: Funding by the stormwater department → it’s a funded program because it decreases
runoff and is required by stormwater permit
• Reasons for implementation: Really easy for customers to wrap their heads around and install, but
they have also seen that customers realize quickly that rain barrels aren’t super effective and then
consider other options for water re-use and efficiency.
• Other key notes:
• About 50% of the rebates they process are small barrels, but they do have a large number of
customers who rebate for larger barrels/cisterns. One notable customer received a
maximum rebate for eight 50-gallon barrels!
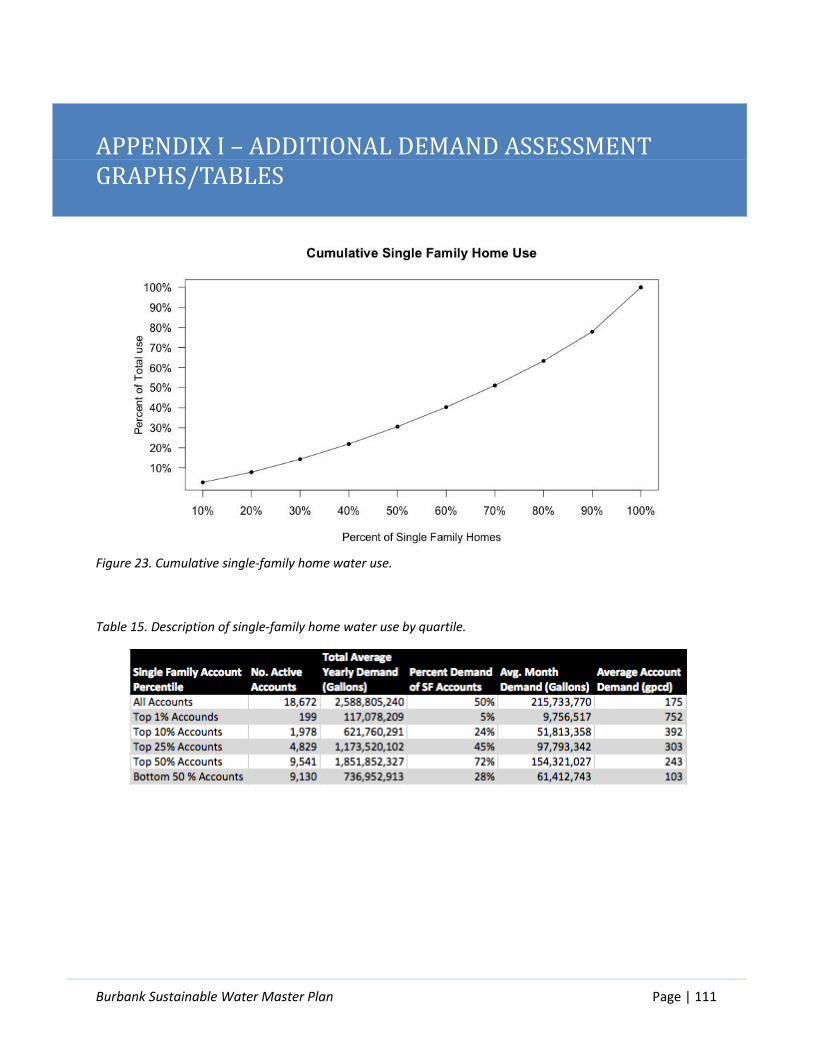
Burbank Sustainable Water Master Plan Page | 111
APPENDIX I – ADDITIONAL DEMAND ASSESSMENT GRAPHS/TABLES
Figure 23. Cumulative single-family home water use.
Table 15. Description of single-family home water use by quartile.
Burbank Sustainable Water Master Plan Page | 112
REFERENCES
1 “Burbank, CA : Burbank History,” accessed February 18, 2015, http://www.burbankca.gov/about-2 “Burbank (city) QuickFacts from the US Census Bureau,” accessed February 17, 2015, http://quickfacts.census.gov/qfd/states/06/0608954.html. 3 “Burbank, CA : Burbank History.” 4 “Burbank (city) QuickFacts from the US Census Bureau.” 5 “Burbank, CA : Burbank History.” 6 “Aviation Archaeology · Lockheed Martin,” accessed February 18, 2015, http://www.lockheedmartin.com/us/100years/stories/aviation-archeology.html. 7 Metropolitan Water District, “MWD: City of Burbank,” January 13, 2015, http://www.mwdh2o.com/mwdh2o/pages/memberag/agencies/burbank.htm. 8 “2011 SHOWCASE AWARDS Burbank Water and Power | California Sustainability Alliance,” accessed February 18, 2015, http://sustainca.org/showcase/burbank_water_and_power. 9 Burbank Department of Water and Power: Water Division, “2010 Urban Water Management Plan,” June 2011. 10 W.B. DeOreo, et al., “California Single Family Home Water Use Efficiency Study,” April 20, 2011, http://water.cityofdavis.org/Media/PublicWorks/Documents/PDF/PW/Water/Documents/California-Single-Family-Home-Water-Use-Efficiency-Study-20110420.pdf. 11 Burbank Department of Water and Power: Water Division, “2010 Urban Water Management Plan.” 12 US EPA, “US EPA Combined Retrofit Report,” March 28, 2005, http://www.allianceforwaterefficiency.org/uploadedFiles/Resource_Center/Library/residential/showers/Aquacraft(2005)EPA-Single-Family-Retrofit-Studies-Combined-Report.pdf. 13 Ibid. 14 DeOreo, et al., “California Single Family Home Water Use Efficiency Study.” 15 Ibid. 16 Ibid. 17 Ibid. 18 David Inman and Paul Jeffrey, “A Review of Residential Water Conservation Tool Performance and Influences on Implementation Effectiveness,” Urban Water Journal 3, no. 3 (2006): 127–43; Mary E Renwick and Richard D Green, “Do Residential Water Demand Side Management Policies Measure up? An Analysis of Eight California Water Agencies,” Journal of Environmental Economics and Management 40, no. 1 (2000): 37–55. 19 William Lord and LA Winterfield, “Choosing the Optimal Water Conservation Policy,” Journal of the American Water Works Association 75, no. 7 (1983): 324–29; Renwick and Green, “Do Residential Water Demand Side Management Policies Measure up? An Analysis of Eight California Water Agencies”; Inman and Jeffrey, “A Review of Residential Water Conservation Tool Performance and Influences on Implementation Effectiveness.”
Burbank Sustainable Water Master Plan Page | 113
20 WaterSmart Software, “Tapping into the Power of Behavioral Science,” n.d., http://www.watersmart.com/media/tapping-behavioral-science/. 21 Lord and Winterfield, “Choosing the Optimal Water Conservation Policy.” 22 Ibid.; Renwick and Green, “Do Residential Water Demand Side Management Policies Measure up? An Analysis of Eight California Water Agencies.” 23 Lord and Winterfield, “Choosing the Optimal Water Conservation Policy”; Renwick and Green, “Do Residential Water Demand Side Management Policies Measure up? An Analysis of Eight California Water Agencies”; Inman and Jeffrey, “A Review of Residential Water Conservation Tool Performance and Influences on Implementation Effectiveness.” 24 Lord and Winterfield, “Choosing the Optimal Water Conservation Policy”; Renwick and Green, “Do Residential Water Demand Side Management Policies Measure up? An Analysis of Eight California Water Agencies”; Inman and Jeffrey, “A Review of Residential Water Conservation Tool Performance and Influences on Implementation Effectiveness.” 25 Peter Mayer et al., Residential End Uses of Water (Am, 1999). 26 Toby Bickmore and Hillery Francis, “The Non-Savers: An Evaluation of Turf Conversion Properties That Don’t Save Water,” 2014, https://lulu.watersmartinnovations.com/documents/pdf/2014/sessions/2014-T-1408.pdf. 27 Saving Water Partnership, “How to Water New Plants,” n.d., http://www.savingwater.org/LawnGarden/Plants/HowtoWaterNewPlants/index.htm. 28 Kent Sovocool, “Xeriscape Conversion Study: Final Report” (Souther Nevada Water Authority, 2005). 29 Michael D. Dukes and Melissa Baum Haley, “Validation of Landscape Irrigation Reduction in Soil Moisture Sensor Irrigation Controllers,” Journal of Irrigation Drainage Engineering 138:135–144 (2012); “Conserving Water | Green Homes | US EPA,” accessed March 18, 2015, http://www.epa.gov/greenhomes/ConserveWater.htm#landscaping. 30 Matthew Heberger, Heather Cooley, and Peter Gleick, “Urban Water Conservation and Efficiency Potential in California” (Pacific Institute and National Resources Defense Council, June 2014).
Peter Mayer et al., Residential End Uses of Water (Am, 1999). 31 California Energy Commission, Integrated Energy Policy Report, November 2005. 32 Mary Tiger, Jeff Hughes, and Shadi Eskaf, Designing Water Rate Structures for Conservation and Revenue Stability (Environmental Finance Center at the University of North Carolina, Chapel Hill, 2014). 33 Janice Beecher and Thomas Chesnutt, Declining Water Sales and Utility Revenues: A Framework for Understanding and Adapting (Alliance for Water Efficiency, August 29, 2012); Thomas Chesnutt and Janice Beecher, Revenue Effects of Conservation Programs: The Case of Lost Revenue (A & N Technical Services, October 2004); Sheila Olmstead and Robert Stavins, Managing Water Demand: Price vs. Non-Price Conservation Programs (Boston, MA: Pioneer Institute for Public Police Research, November 2006). 34 Chesnutt and Beecher, Revenue Effects of Conservation Programs: The Case of Lost Revenue. 35 Jeff Hughes et al., Defining a Resilient Business Model for Water Utilities (Water Research Foundation, 2014), www.waterrf.org/PublicReportLibrary/4366.pdf. 36 Ibid.; Chesnutt and Beecher, Revenue Effects of Conservation Programs: The Case of Lost Revenue.

Burbank Sustainable Water Master Plan Page | 114
37 Lisa Maddaus, William Maddaus, and Michelle Maddaus, Preparing Urban Water Use Efficiency Plans: A Best Practice Guide (International Water Association Publishing, 2013); Chesnutt and Beecher, Revenue Effects of Conservation Programs: The Case of Lost Revenue. 38 WaterSmart Software, “Tapping into the Power of Behavioral Science.” 39 Ibid. 40 Heberger, Cooley, and Gleick, “Urban Water Conservation and Efficiency Potential in California.” 41 DeOreo, et al., “California Single Family Home Water Use Efficiency Study.” 42 Heberger, Cooley, and Gleick, “Urban Water Conservation and Efficiency Potential in California.” 43 Joanna Endter-Wada et al., “Situational Waste in Landscape Watering: Residential and Business Water Use in an Urban Utah community1,” JAWRA Journal of the American Water Resources Association 44, no. 4 (2008): 902–20. 44 DeOreo, et al., “California Single Family Home Water Use Efficiency Study.” 45 Ellen Hanak and Matthew Davis, “California Economic Policy,” Public Policy Institute of California 2, no. 2 (2006), http://wwxv.ppic.org/content/pubs/cep/EP_706EHEP.pdf. 46 Michael D. Dukes, B. Cardenas-Lailhacar, and G.L. Miller, Evaluation of Soil Moisture-Based On-Demand Irrigation Controllers, Final Report (Southwest Florida Water Management, 2008). 47 Dukes and Baum Haley, “Validation of Landscape Irrigation Reduction in Soil Moisture Sensor Irrigation Controllers.” 48 Thomas R. Olmsted and Michael D. Dukes, “Frequency of Residential Irrigation Maintenance Problems,” 2011, 20111, http://edis.ifas.ufl.edu/ae472. 49 Hanak and Davis, “California Economic Policy.” 50 “Conserving Water | Green Homes | US EPA.” 51 Burbank Department of Water and Power: Water Division, “2010 Urban Water Management Plan.” 52 Peter H. Gleick, Gary Hartman Wolff, and Katherine Kao Cushing, Waste Not, Want Not: The Potential for Urban Water Conservation in California (Pacific Institute for Studies in Development, Environment, and Security Oakland, CA, 2003), http://www.colorado.edu/geography/class_homepages/geog_4501_sum14/Western%20Water/J.June%2017/Gleick_waste_not_want_not_full_report.pdf. 53 Heberger, Cooley, and Gleick, “Urban Water Conservation and Efficiency Potential in California.” 54 California Department of Water Resources and California Urban Water Conservation Council, Commercial, Industrial, and Institutional Task Force, Water Use Best Management Practices, Report to the Legislature, October 2013. 55 Ronnie Cohen, Kristina Ortez, and Crossley Pinkstaff, “Making Every Drop Count: Increasing Water Efficiency in California’s Commercial, Industrial, and Institutional (CII) Sector” (NRDC, May 2009), http://www.nrdc.org/water/cacii/files/cii.pdf. 56 Geoff Gardiner, John Fawcett, and Audra Liubinas, “City West Water’s CII Water Efficiency Program (AWE Innovative CII Efficiency Programs Webinar),” May 6, 2014, http://www.allianceforwaterefficiency.org/EPCIIwebinar.aspx. 57 Peter Mayer et al., Water Budgets and Rate Structures -- Innovative Management Tools (American Water Works Association, May 2008); Thomas Chesnutt et al., Building Better Water Rates for an
Burbank Sustainable Water Master Plan Page | 115
Uncertain World: Balancing Revenue Management, Resource Efficiency, and Fiscal Sustainability (Alliance for Water Efficiency, 2014). 58 Chesnutt et al., Building Better Water Rates for an Uncertain World: Balancing Revenue Management, Resource Efficiency, and Fiscal Sustainability. 59 Ibid. 60 Ibid.; Olmstead and Stavins, Managing Water Demand: Price vs. Non-Price Conservation Programs. 61 Olmstead and Stavins, Managing Water Demand: Price vs. Non-Price Conservation Programs; Sheila Olmstead, Michael Hanemann, and Robert Stavins, Does Price Structure Matter? Household Water Demand Under Increasing-Block and Uniform Prices (University of California, Berkeley, October 2003). 62 Olmstead and Stavins, Managing Water Demand: Price vs. Non-Price Conservation Programs. 63 Christopher Timmins, “Demand-Side Technology Standards Under Inefficient Pricing Regimes,” Environmental and Resource Economics 26, no. 1 (September 1, 2003): 107–24; Tiger, Hughes, and Eskaf, Designing Water Rate Structures for Conservation and Revenue Stability; Olmstead, Hanemann, and Stavins, Does Price Structure Matter? Household Water Demand Under Increasing-Block and Uniform Prices. 64 Olmstead and Stavins, Managing Water Demand: Price vs. Non-Price Conservation Programs. 65 Kurt Schwabe, Ken Baerenklau, and Ariel Dinar, Policy Matters: University of California, Riverside 6, no. 1 (Fall 2014): 1–7. 66 Kristina Donnelly and Juliet Christian-Smith, An Overview of the “New Normal” and Water Rate Basics (Pacific Institute, 2013); A Primer on Water Pricing in the San Diego Region (Equinox Center, October 2009); Chesnutt et al., Building Better Water Rates for an Uncertain World: Balancing Revenue Management, Resource Efficiency, and Fiscal Sustainability. 67 Schwabe, Baerenklau, and Dinar; Mayer et al., Water Budgets and Rate Structures -- Innovative Management Tools; Donnelly and Christian-Smith, An Overview of the “New Normal” and Water Rate Basics. 68 Mayer et al., Water Budgets and Rate Structures -- Innovative Management Tools. 69 Ibid. 70 Ibid. 71 Chesnutt et al., Building Better Water Rates for an Uncertain World: Balancing Revenue Management, Resource Efficiency, and Fiscal Sustainability. 72 “Fiscal Year 2014-2015 Proposed Budget Presentation” (The Burbank Department of Water and Power, June 10, 2014). 73 Metropolitan Water District, “Metropolitan Water District Supply Conditions,” February 10, 2015, http://www.mwdh2o.com/mwdh2o/pages/yourwater/supply/res_storage/res_storage.pdf. 74 Metropolitan Water District, “Adopted Water Rates and Charges,” July 30, 2014, http://www.mwdh2o.com/mwdh2o/pages/finance/finance_03.html#Anchor-Long-term-42055. 75 Burbank Department of Water and Power: Water Division, “2010 Recycled Water Master Plan” (The Burbank Department of Water and Power, June 2011). 76 City of Burbank, “City of Burbank Adopted Citywide Fee Schedule,” 2014. 77 Burbank Department of Water and Power, “Who Is Targeted? BWP WebPage,” accessed February 18, 2015, http://www.burbankwaterandpower.com/water/recycled-water/who-is-targeted.

Burbank Sustainable Water Master Plan Page | 116
78 Burbank Department of Water and Power, “Recycled Water Quality,” Municipal Agency Website, accessed February 18, 2015, http://www.burbankwaterandpower.com/water/recycled-water/water-quality. 79 Kathleen Salyer, “SECOND FIVE-YEAR REVIEW REPORT FOR SAN FERNANDO VALLEY (AREA 1) SUPERFUND SITE” (US EPA & Army Corps of Engineers, September 30, 2013), -. 80 Kathleen Salyer, “SECOND FIVE-YEAR REVIEW REPORT FOR SAN FERNANDO VALLEY (AREA 1) SUPERFUND SITE.” 81 USEPA, “Superfund Site Overview San Fernando Valley (Area 1 North Hollywood And Burbank), Pacific Southwest, US EPA,” accessed February 18, 2015, http://yosemite.epa.gov/r9/sfund/r9sfdocw.nsf/ViewByEPAID/CAD980894893. 82 The Honorable Edmon M. Moor, “The City of Los Angeles vs. City of San Fernando, et Al” (Superior Court of the State of California for the County of Los Angeles, January 26, 1979). 83 Richard C. Slade, PG, “ULARA 2011-2012 Water Year Annual Report” (Watermaster Service, May 2013), http://ularawatermaster.com/public_resources/WY_2011-12_ULARA_WM_Rpt_-5-2013.pdf. 84 California Urban Water Agencies’ Water Supply Reliability Report (California Urban Water Agencies, August 2012); Metropolitan Water District of Southern California, Integrated Water Resources Plan: 2010 Update (Metropolitan Water District of Southern California, 2010). 85 CUWA Water Supply Reliability Report; Ellen Hanak and Jay Lund, Adapting California’s Water Management to Climate Change (Public Policy Institute of California, November 2008). 86 Gary Freeman, Securing Reliable Water Supplies for Southern California (Los Angeles County Economic Development Corporation, January 2008). 87 H Blanco et al., Water Supply Scarcity in Southern California: Assessing Water District Level Strategies (University of Southern California, Price School of Public Policy, Center for Sustainable Cities, 2012). 88 “Fiscal Year 2014-2015 Proposed Budget Presentation.” 89 Metropolitan Water District: Annual Report 2014 (Metro, 2014). 90 Freeman, Securing Reliable Water Supplies for Southern California. 91 Ibid.; Blanco et al., Water Supply Scarcity in Southern California: Assessing Water District Level Strategies; California Water Action Plan (California Natural Resources Agency, California Department of Food and Agriculture, and California Environmental Protection Agency, 2014). 92 Richard C. Slade, PG, “ULARA 2011-2012 Water Year Annual Report.” 93 Department of Health Services, Drinking Water Field Operations Branch, “Department of Health Services_State of Calif_Water Permit Amendment” (State of California, Health and Human Services Agency, October 16, 2000). 94 Burbank Department of Water and Power, “BWP Groundwater Pumping and Spreading Plan” (Burban Department of Water and Power, May 2013). 95 Douglas B. Blatchford, P.E., “Los Angeles Basin Groundwater Adjudication Summary,” July 2014. 96 “Statutes Related to Recycled Water & the California Department of Public Health” (California Department of Public Health, May 1, 2014), http://www.waterboards.ca.gov/drinking_water/certlic/drinkingwater/documents/lawbook/RWstatutes2014-05-01a.pdf.
Burbank Sustainable Water Master Plan Page | 117
97 MichaelE. Dietz, “Low Impact Development Practices: A Review of Current Research and Recommendations for Future Directions,” Water, Air, and Soil Pollution 186, no. 1–4 (November 1, 2007): 351–63, doi:10.1007/s11270-007-9484-z. 98 Los Angeles & San Gabriel Rivers Watershed Council, “Ground Water Augmentation Model Demonstration Report,” January 2010, http://www.usbr.gov/lc/socal/reports/LASGwtraugmentation/AppC.pdf. 99 Ibid. 100 Ibid. 101 Ibid. 102 “LADWP Announces Stormwater Capture Master Plan,” March 28, 2014, http://www.lastormwater.org/blog/2014/03/ladwp-announces-stormwater-capture-master-plan/. 103 Department of Housing and Community Development, Nonpotable Water Reuse Systems, February 2, 2010, http://www.hcd.ca.gov/codes/shl/2007CPC_Graywater_Complete_2-2-10.pdf. 104 Lucy Allen, Juliet Christian-Smith, and Meena Palaniappan, Overview of Greywater Reuse: The Potential of Greywater Systems to Aid Sustainable Water Management (Pacific Institute, November 2010), http://www.pacinst.org/wp-content/uploads/sites/21/2013/02/greywater_overview3.pdf. 105 California Building Standards Commission, “FINAL EXPRESS TERMS FOR PROPOSED BUILDING STANDARDS OF THE CALIFORNIA BUILDING STANDARDS COMMISSION,” 2012, http://www.documents.dgs.ca.gov/bsc/prpsd_chngs/documents/2012/BSC-05-12-ET-Pt5-Final.pdf. 106 Ibid. 107 Laura Allen, Sherry Bryan, and Cleo Woelfle-Erskine, Residential Greywater Irrigation Systems in California: An Evaluation of Soil and Water Quality, User Satisfaction, and Installation Costs (Greywater Action, November 2012), http://www.greywateraction.org/sites/default/files/GW_Study_revised-2013.pdf. 108 Chris Solloway, Rainwater Harvesting: Conservation, Credit, Codes, and Cost Literature Review and Case Studies (United States Environmental Protection Agency, January 2013), http://water.epa.gov/polwaste/nps/upload/rainharvesting.pdf. 109 Burbank Department of Water and Power: Water Division, “2010 Urban Water Management Plan.” 110 Solloway, Rainwater Harvesting: Conservation, Credit, Codes, and Cost Literature Review and Case Studies. 111 Foothill Municipal Water District, “Rainwater Harvesting - Cisterns, Rebate Application,” 2015, http://www.fmwd.com/resources/documents/conservation/FMWD%20Cistern%20Rebate.pdf. 112 Alliance for Water Efficiency, “On-Site Alternate Water Sources & Use Introduction,” January 18, 2013, http://www.allianceforwaterefficiency.org/1Column.aspx?id=1278&LangType=1033&terms=rain+barrels. 113 Solloway, Rainwater Harvesting: Conservation, Credit, Codes, and Cost Literature Review and Case Studies. 114 City of San Diego, Rainwater Harvesting Guide, n.d., http://www.sandiego.gov/water/pdf/conservation/rainwaterguide.pdf.

Burbank Sustainable Water Master Plan Page | 118
115 V. Grace Mitchell, “How Important Is the Selection of Computational Analysis Method to the Accuracy of Rainwater Tank Behaviour Modelling?,” Hydrological Processes 21, no. 21 (October 15, 2007): 2850–61, doi:10.1002/hyp.6499. 116 “Direct Potable Reuse Initiative Tops $5 Million Mark | WateReuse,” accessed February 18, 2015, http://www.watereuse.org/node/2642. 117 Wichita Falls, TX Public Works Dept., “Wichita Falls, TX - Official Website - Direct Potable Reuse Project,” accessed February 20, 2015, http://www.wichitafallstx.gov/index.aspx?nid=1595. 118 “Statutes Related to Recycled Water & the California Department of Public Health.” 119 Sovocool, “Xeriscape Conversion Study: Final Report.” 120 Mayer et al., Residential End Uses of Water. 121 Sovocool, “Xeriscape Conversion Study: Final Report.” 122 “Zillow: Real Estate, Apartments, Mortgage & Home Values in the US,” accessed February 19, 2015, http://www.zillow.com/. 123 Mayer et al., Residential End Uses of Water. 124 Chesnutt et al., Building Better Water Rates for an Uncertain World: Balancing Revenue Management, Resource Efficiency, and Fiscal Sustainability. 125 Maddaus, Maddaus, and Maddaus, Preparing Urban Water Use Efficiency Plans: A Best Practice Guide. 126 Hughes et al., Defining a Resilient Business Model for Water Utilities; Beecher and Chesnutt, Declining Water Sales and Utility Revenues: A Framework for Understanding and Adapting; Tiger, Hughes, and Eskaf, Designing Water Rate Structures for Conservation and Revenue Stability. 127 Tiger, Hughes, and Eskaf, Designing Water Rate Structures for Conservation and Revenue Stability; Hughes et al., Defining a Resilient Business Model for Water Utilities; Chesnutt and Beecher, Revenue Effects of Conservation Programs: The Case of Lost Revenue. 128 Hughes et al., Defining a Resilient Business Model for Water Utilities; Chesnutt and Beecher, Revenue Effects of Conservation Programs: The Case of Lost Revenue; Olmstead and Stavins, Managing Water Demand: Price vs. Non-Price Conservation Programs. 129 Hughes et al., Defining a Resilient Business Model for Water Utilities; Beecher and Chesnutt, Declining Water Sales and Utility Revenues: A Framework for Understanding and Adapting; Olmstead and Stavins, Managing Water Demand: Price vs. Non-Price Conservation Programs. 130 Chesnutt and Beecher, Revenue Effects of Conservation Programs: The Case of Lost Revenue; Beecher and Chesnutt, Declining Water Sales and Utility Revenues: A Framework for Understanding and Adapting; Maddaus, Maddaus, and Maddaus, Preparing Urban Water Use Efficiency Plans: A Best Practice Guide. 131 Beecher and Chesnutt, Declining Water Sales and Utility Revenues: A Framework for Understanding and Adapting; Tiger, Hughes, and Eskaf, Designing Water Rate Structures for Conservation and Revenue Stability; Olmstead and Stavins, Managing Water Demand: Price vs. Non-Price Conservation Programs. 132 Stuart Feinglas, Christine Gray, and Peter Mayer, Conservation Limits Rate Increase for a Colorado Utility (Alliance for Water Efficiency, November 2013). 133 Hughes et al., Defining a Resilient Business Model for Water Utilities; Maddaus, Maddaus, and Maddaus, Preparing Urban Water Use Efficiency Plans: A Best Practice Guide.

Burbank Sustainable Water Master Plan Page | 119
134 Los Angeles Department of Water and Power Achieves Demand Management Goals with Unique Volumetric Rate Structure and Long-Term Planning (Water Resource Foundation and Alliance for Water Efficiency, August 2008), http://www.financingsustainablewater.org/resource-search/case-study-los-angeles-department-water-power-achieves-demand-management-goals. 135 Mayer et al., Water Budgets and Rate Structures -- Innovative Management Tools. 136 Kenneth Baerenklau, Kurt Schwabe, and Ariel Dinar, Do Increasing Block Rate Water Budgets Reduce Residential Water Demand? A Case Study in Southern California (Water Science and Policy Center: University of California, Riverside, September 2013); Thomas Chesnutt and David Pekelney, Landscape Water Conservation Programs: Evaluation of Water Budget Based Rate Structures (A & N Technical Services, 1997). 137 Baerenklau, Schwabe, and Dinar, Do Increasing Block Rate Water Budgets Reduce Residential Water Demand? A Case Study in Southern California; Chesnutt and Pekelney, Landscape Water Conservation Programs: Evaluation of Water Budget Based Rate Structures. 138 Donnelly and Christian-Smith, An Overview of the “New Normal” and Water Rate Basics. 139 Bill McDonnell and Metropolitan Water District, “Finding the Next Tier of CII Water Efficiency,” October 3, 2013. 140 David Bracciano, Lisa Krenz, and Jack Kiefer, “Quantifying CII Water Use Efficiency and Market Potential,” October 2014. 141 Tampa Bay Water and Hazen and Sawyer, Water Demand Management Report, December 2013, http://www.tampabaywater.org/documents/conservation/2013_TampaBayWater-Water-Demand-Management-Plan.pdf. 142 Beth Fahl, “Orange County’s Water Smart Hotel Program: Survey and Save!” (Municipal Water District of Orange County, n.d.). 143 Richard C. Slade, PG, “ULARA 2011-2012 Water Year Annual Report.” 144 Laura Allen, Sherry Bryan, and Cleo Woelfle-Erskine, Residential Greywater Irrigation Systems in California: An Evaluation of Soil and Water Quality, User Satisfaction, and Installation Costs (Greywater Action, November 2012), http://www.greywateraction.org/sites/default/files/GW_Study_revised-2013.pdf. 145 City of San Diego, Rainwater Harvesting Guide.